Abstract
High-quality urban green space (UGS) is an integral part of a livable city. The scientific evaluation of UGS has great value for improving the quality and efficiency of green spaces. In this study, we integrated the water and walking networks into the existing green index model and proposed a new green index: the building blue–green index (BBGI). Using this method, we analyzed the quality of green spaces within 300 m of 2138 buildings located in 13 communities in the Mochou Lake subdistrict in Nanjing, China. The results revealed that the green-space quality of high-rise, low-density buildings was greater than that of low-rise, high-density buildings. In addition, buildings close to water had higher green-space quality, while impervious surfaces reduced green-space quality. Furthermore, the connectivity and orientation of the road network indicated that even if a community was close to large parks and water bodies, there would still be lower green-space quality. This study’s findings highlight the usefulness of evaluation methods for green-space quality that combine blue and green spaces. We also propose feasible measures for improving neighborhood green-space planning and land management.
1. Introduction
Urban green space (UGS) is an essential component of a livable city; it can provide numerous health benefits and promote the sustainability of urban environments [1,2,3,4,5,6]. When 21–40% of a neighborhood is covered by green space, residents can more easily access green space, and as the coverage rate increases, residents’ happiness will increase as well [7]. To evaluate the human wellbeing provided by UGSs, many studies have investigated green space at the neighborhood level, taking the percentage of green areas as a common indicator of green-space quality [8,9]. The percentage of the green area is also a concern of city authorities [10]; thus, many greening strategies have been proposed, including adding green roofs, increasing the number of urban parks, and planting a large number of street trees [11]. Recently, the benefits of UGS have been found to be related not only to the absolute amount but also to the quality attributes of green spaces [12,13,14]. Therefore, it is essential to develop a scientific evaluation method for neighborhood green-space quality to optimize the distribution of UGS and improve its service performance.
Currently, there are two main methods for assessing UGS quality: subjective perception measurement and objective measurement. Subjective perception measurement flexibly acquires green-space quality data using self-reported questionnaires and checklists [15,16,17]. Thus, it is the more popular method for assessing green-space quality. For example, one questionnaire-based study included the supply of facilities, the convenience of facilities, natural features, and the absence of civilization, accessibility, and maintenance as the six dimensions of green-space quality [18]. However, this method is weak with regard to depicting the spatial distribution of green-space quality, and therefore provides limited information for implementing UGS design and planning. Meanwhile, objective measurement methods use quantitative indicators to evaluate UGS quality based on satellite imagery. Richards et al. [19] calculated green-space percentage and green space per capita from panchromatic spectral images provided by Landsat 7. Yan et al. [20] used Pleiades-1A satellite images consisting of multispectral images and panchromatic images to measure UGS landscape metrics such as vegetation coverage, patch shape, and density. These single indicators can reflect the spatial distribution of green space on a macro scale and provide a wealth of tools for continuous monitoring over long periods. They pay little attention, however, to the microenvironments of built-up areas [8,16,21]. To address this deficiency, researchers have defined availability, accessibility, and building density as quantitative parameters of UGS quality, providing an understanding of UGS quality by integrating these parameters into green index models [22,23,24,25]. In addition, objective measurement is often used to provide spatial distribution information for urban green space design. Therefore, a rational selection of evaluation parameters is needed to improve the application of objective measurements of UGS quality.
Recently, research on human wellbeing provided by green space has expanded the research objectives from green spaces to blue–green spaces. As a result, increasing attention has been paid to the positive effects of blue spaces on green-space ecosystems and sustainable landscape planning [26,27,28,29]. A growing body of research based on subjective perception measurement has proposed that the combination of blue and green spaces can provide better ecological and social service functions than green spaces alone [30,31,32]. For example, research has found that multilayered green space combined with water provide the highest-quality restorative green space [33]. Surveying residents’ and visitors’ perceptions of the social value of green park spaces, Chen et al. [34] found that distance to water positively promoted both groups’ experience of the recreational and cultural value of green spaces. However, those objective methods have not reached a consensus on blue space as an evaluation parameter for UGS quality. Many cities in developing countries are located in areas with dense water networks; thus, a method integrating the blue-space context into the evaluation parameters of UGS quality is needed [28,35].
To improve the rationality of objective measurement methods at the neighborhood level by combining blue and green spaces, this study (1) reviewed the literature on the objective evaluation of neighborhood green-space quality; (2) constructed a building blue–green index (BBGI) using network analysis to assess UGS quality of Mochou Lake Subdistrict in Nanjing, China; (3) analyzed the differences between BBGI and the traditional green index; and (4) made practical suggestions for improving the design of neighborhood green spaces.
2. Study Area and Data
2.1. Study Area
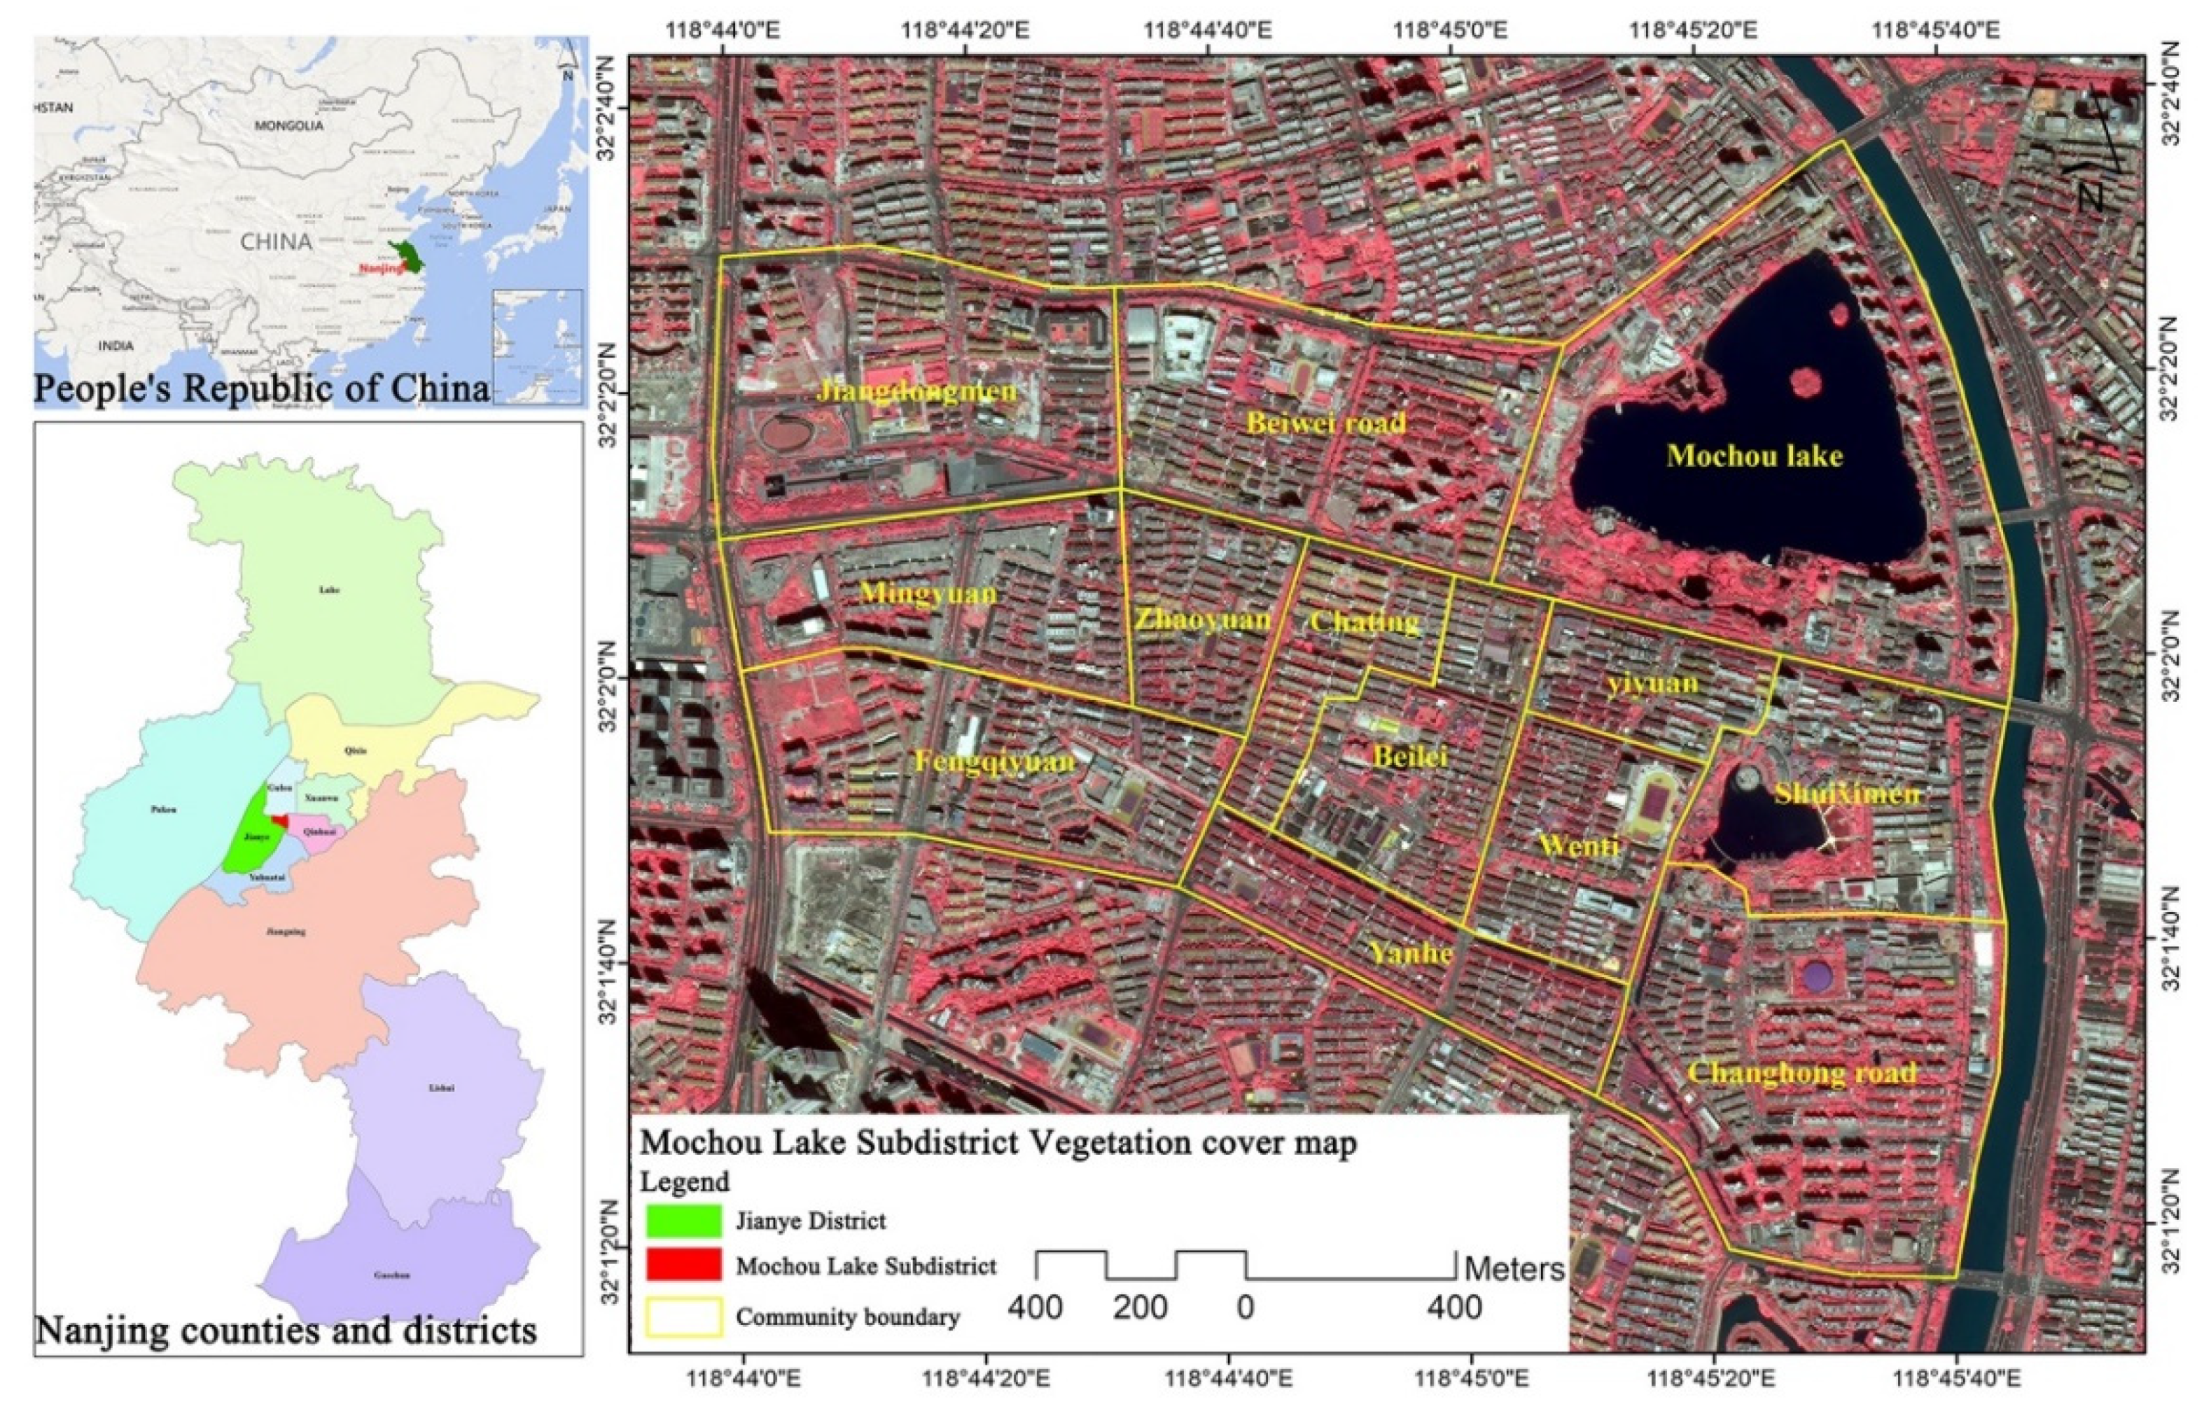
Mochou Lake Subdistrict is located in Hexi New Town, Jianye District, Nanjing, China. It is adjacent to the Qinhuai River to the east. The subdistrict ranks sixth in Nanjing Province in terms of the total population with 117,219 people (Mochou Lake Subdistrict Office, 2018). It is about 4.28 square kilometers (Figure 1). Mochou Lake Subdistrict is a subtropical humid climate zone with four distinct seasons. The area is rich in flora, vegetation grows well, and the vegetation coverage rate is 37%. Moreover, UGS in the area reflects a typical landscape interwoven with blue and green spaces. The interior green space in the subdistrict is mainly composed of shelter forests along the river and vegetation planted along roadsides and in parks. There are two large parks with large areas of water to the east of the subdistrict. There are 13 communities in the Mochou Lake Subdistrict (source: www.njjy.gov.cn/, accessed on 3 February 2022). The community is the smallest administrative unit in China. Here, the concept of community is the same as that of neighborhood but has a different name.

Figure 1.
Study site and vegetation cover map.
2.2. Data Sources and Preprocessing
This study used GF-2 satellite data, based on imaging for 26 April 2018. The image was taken by the first optical remote-sensing satellite. It is an optical remote-sensing image which consists of one panchromatic band (Band: 450–900 nm) with a spatial resolution of 1 m, and four multispectral bands (Band red: 630–690 nm; Band green: 520–590 nm; Band blue: 450–520 nm; Band NIR: 770–890 nm) with a spatial resolution of 4 m (source: http://www.cresda.com/CN/, accessed on 3 February 2022). This type of high-resolution image achieves the level of accuracy needed for image information extraction and classification, with rich spectral features and texture information [18,36]. Although the satellite’s data are relatively new, its land cover classification performance has been recognized [37]. Using ENVI 5.3, high-resolution images were preprocessed by conducting radiometric calibrations, atmospheric correction, orthorectification, and fusion.
Vector data provided by the Mochou Lake Subdistrict Office were used to extract accurate residential building block data and road network data. The Outdoor Assistant application was used for field investigation to rectify and supplement the data.
3. Methods
3.1. Progress in the Objective Measurement of Neighborhood Green-Space Quality
Taking into account the disorder of buildings and green spaces in Indian cities, Gupta et al. [22] proposed the urban neighborhood green index (UNGI). In this method, a residential area was divided into uniform grids of 20 × 20 m2, which are used as the unit of green-space quality evaluation. UNGI is the result of the weighted superposition of four parameters (green index, proximity to green space, building density, and building height).
First, the band values in the multispectral image are applied to generate an NDVI map. According to the map, the greenness in each grid is calculated to determine the green index. Second, the study area is classfied into four land types (including densely planted areas, sparsely planted areas, open spaces without plants, and built-up areas) by using the maximum likelihood supervision classification method. Proximity to green space is calculated by calculating the percentage of the area of the cells contained in 20 m buffer zones. Third, the high-rise building index is calculated by caiculating the proportion of high-rise building cells in each grid. Finally, the values of the four above indexes are normalized, and the analytic hierarchy process is used to determine their weights. Compared with an index for measuring the amount of green space on a macro scale, UNGI is more accurate because it not only evaluates greenness at the neighborhood level but also considers accessibility to green space and the effect of building height on the availability of green space. However, since this method is a homogeneous grid method, it cannot identify the spatial distribution of residents’ actual activity spaces.
To solve the abovementioned deficiency of UNGI, Li et al. [23] used lidar data and multispectral remote-sensing imagery to develop a building proximity to green space index (BPGI). In this method, a 20 m circular buffer is generated around the center of a building’s mass. The value of BPGI is equal to the ratio of the area of green space to the area of non-green space. Then, based on BPGI, Liu et al. [24] developed the building neighborhood green index (BNGI), which can reveal disparities in residents’ proximity to green spaces at the neighborhood level. This method defines a 20 m buffer area around a building as the analysis unit, as opposed to a 20 m × 20 m grid. Although the parameters of BPGI are similar to those in UNGI—including green index, green-space proximity, building sparsity, and high-rise building sparsity—there are differences in the calculation methods. First, proximity to green space is equal to the percentage of vegetation areas to the area of the building buffer zone. Second, the building sparsity index is defined as the proportion of nonbuilding areas in a single building’s 20 m buffer zone. Similarly, high-rise sparsity is the proportion of non-high-rise buildings in the 20 m buffer of a building. BPGI is more of a microscale evaluation of UGS quality because it can reveal disparities in residents’ proximity to different types of vegetation at the neighborhood level. Moreover, the building buffer method in BPGI suggests that green-space accessibility is an important aspect that affects UGS evaluation since residents can better enjoy the benefits of green space when they can more easily access it [38]. The present study provides new evidence that a convenient walking environment has a positive effect on the availability of green space [39,40]. However, the BPGI model does not consider the process of walking from a building to green space.
Recently, a urban green accessibility index considering the topological relationship between the road network and the green space was proposed [41]. The index includes three parameters: green amount, topological importance of street, and distance from green space to street. Firstly, the NDVI map of the city is generated based on high-definition images. Then, the topological importance of urban roads is determined by the choice index and integration index in the space syntax software. Finally, the straight-line distance from each green patch to the road is calculated through QGIS software. This method addresses the defect that the above urban green indexes ignore: the road environment.
The above urban green indexes consider the interaction of neighborhood green spaces and built-up features without considering the effect of blue space on UGS quality. To measure UGS quality from the perspective of the combination of blue and green spaces, Wang et al. [42] developed a hybrid land-use pattern index to identify the characteristics of blue–green space at the neighborhood level. This model consists of four parameters: building coverage ratio, green–blue surface ratio, impervious surface ratio, and mean building height. Based on the supervised classification of high-resolution satellite images, the proportion of blue–green spaces and the proportion of impervious surfaces are obtained. They used building vector data from Baidu Maps to calculate building coverage ratio and mean building height. This method not only considers blue–green space as a whole but also considers buildings and impervious surfaces as important factors affecting UGS ecological quality. However, Wang et al. (2021) aimed to explore the role of urban blue–green space in promoting the cooling effect, as opposed to objectively assessing green-space quality. That study used the method to cluster the landscape patterns of neighborhood blue–green spaces, which could not readily quantify the value of UGS quality. Moreover, the walking accessibility of UGS and the distribution of high-rise buildings were not considered.
Recent research on blue–green space characterizes the quality of blue–green space by calculating the proportion of three land cover types of blue, green, and impervious surface through high-resolution remote sensing, which provides a new method for the optimization of green space indexes. Since walking areas and blue spaces are both important aspects of green-space quality, a green index model that can evaluate the blue–green space in the walkable area of a neighborhood is needed.
3.2. A New Framework for Analyzing Neighborhood Green Sapce Quality—Building a Blue–Green Index
3.2.1. Research Framework
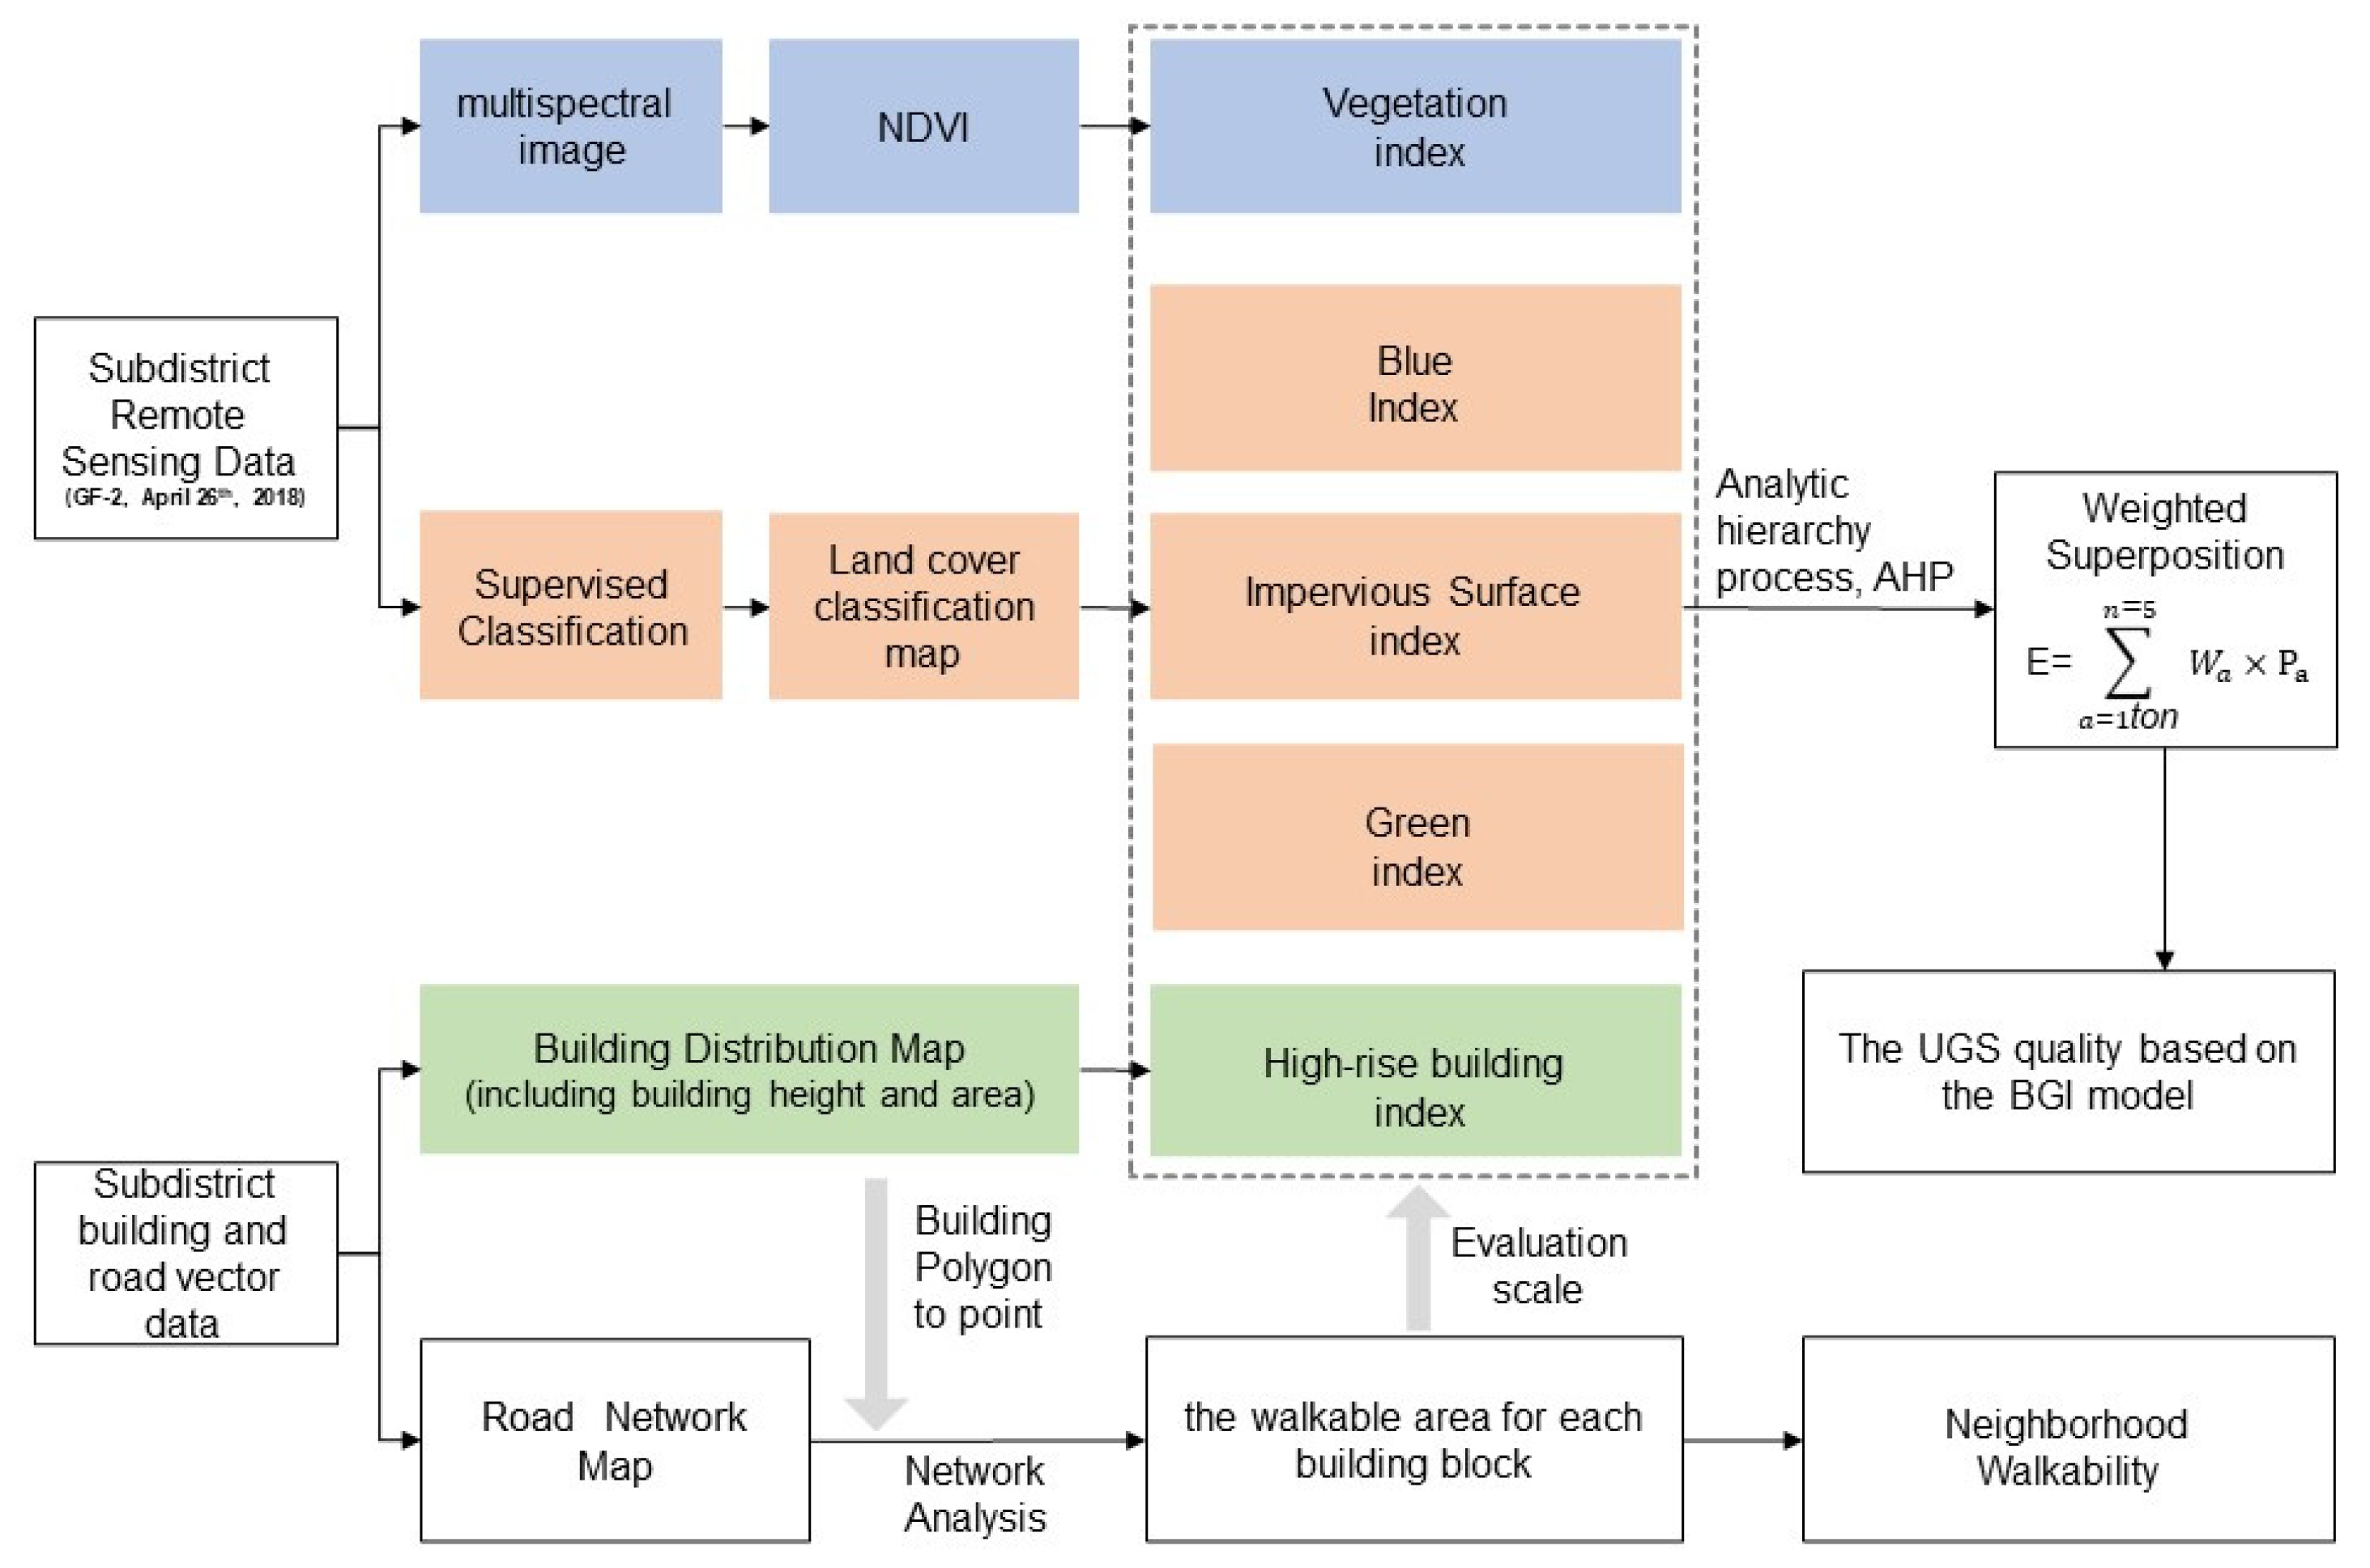
The proposed BBGI is a new neighborhood green-space quality measurement that incorporates the land-use pattern index of blue–green space into green index models such as UNGI and BNGI. It varies widely in its evaluation scale and the selection of parameters (Figure 2). Based on the street space design by Japanese architect Aihara Yoshito, “External Space Design”, when people are active as walkers, the most pleasant travel distance is 300 m [43]. Therefore, a 300 m maximum distance has been proposed as the default option for UGS assessment [5].

Figure 2.
Research framework.
For this study, the 300 m road network analysis threshold was used to determine the walkable area, which is the evaluation scale for BBGI. Then, to analyze the effect of walkable area on the evaluation results, we calculated neighborhood walkability, which was defined as the ratio of the walkable area of all buildings in the neighborhood to the walkable area of all buildings in the study area. There were also differences in the selection of parameters. Five factors were selected: vegetation index, blue index, impervious surface index, green index, and high-rise building index. Finally, the analytic hierarchy process (AHP) was used to determine the weights of the factors to obtain the evaluation results.
Supervised classification is a common technique in traditional classification methods. In this study, the maximum likelihood classifier was used to extract three landcover types, including green space, water surface, and impervious surface. First, we used image maps from Google Earth as the base map to analyze the distribution to ensure that the selected samples were accurate and representative. A total of 238 training samples were manually delineated. Then, the Region of Interest (ROI) separability tool in ENVI 5.3 was used to calculate the statistical distance between each class to avoid substantial similarities between samples. The separability values of the samples between the landcover types were all greater than 1.9, indicating high separability. Finally, we evaluated the accuracy of the classification result map using the confusion matrix method. Overall accuracy was 98.81%, and the Kappa coefficient was 0.93.
3.2.2. Green Index
The green index measures the amount of green space in a city. Appropriate green indicators in UGS planning and design provide residents with a high level of green space. We measured the green index by calculating the proportion of green-space area in the network buffer zone to the total area of the network buffer zone. The formula is
where Ai-area is the network buffer area of i building. Ai-green is the green-space area in the network buffer zone of building i.
3.2.3. Vegetation Index
The numerical value of NDVI is closely related to parameters such as the leaf area index and photosynthesis. It is used as the closest factor to describe vegetation growth status and coverage [44]. We calculated NDVI [NDVI = (NIR − R)/(NIR + R)] using the spectral characteristics of the red-light band (R) (0.63–0.69 μm) and the near-infrared band (NIR) (0.77–0.89 μm). The formula is
where is the network buffer area of building i. ∑NDVI is the sum of NDVI values in the network buffer zone of building i.
3.2.4. Blue Index
Blue and green spaces should both be considered in sustainable landscape design [45]. Thus, we measured the blue index by calculating the proportion of the area of blue space in the network buffer zone to the total area of the network buffer zone. The formula is
where is the network buffer area of building i, and is the water body area in the network buffer zone of building i.
3.2.5. Impervious Surface Index
Impervious surfaces, including concrete pavement, roads, buildings, and plazas, are considered an essential factor for understanding built-up environments [46,47]. The proportion of impervious surfaces coverage has been used to assess built-up density [48]. Urban impervious surfaces can represent the degree of urbanization and the health of urban ecosystems [49].
We therefore measured the impervious surface index by the proportion of the area of impervious surface in the network buffer zone to the total area of the network buffer zone. The formula is
where is the network buffer area of building i, and is the impervious surface area in the network buffer zone of building i.
3.2.6. High-Rise Building Index
Building height can also affect satisfaction and well-being for people accessing green spaces surrounding buildings [50]. Based on China’s residential design code, we defined a building with more than six floors as a high-rise.
Thus, the high-rise building index was used to measure the total floor area of buildings with more than six floors. The formula is
where is the network buffer area of building i. is the number of floors of high-rise building j. Sj is the floor area of high-rise building j. is the summed floor area of the part above six stories in high-rise buildings.
3.2.7. Weight Determination and Overlay Analysis
According to the values obtained for each building unit, we converted the final evaluation value of each indicator into four green-space quality grades (i.e., low, medium, high, and very high quality) by using Natural Breaks Jenks Method (Table 1). We then used the spatial analyst tool in ArcGIS 10.5 to reclassify and standardize all indicators. The evaluation results provided a relative value for comparison analysis and visualization.

Table 1.
Standards for UGS quality division, different factors, and their weights.
The factor weights were determined using AHP. The AHP method is a systemic decision analysis tool which can quantifies the relative importance of each factor to the complex system [51,52]. Because of the varying degrees of importance of each indicator, standardization was performed to reflect the degree of difference between indicators. A pairwise judgment matrix was utilized, and the corresponding weight of each indicator was calculated (Table 1). A consistency test was conducted on the indicator system to ensure the quality of indicators, and the logic of the weight coefficient was measured. Finally, superposition analysis was performed based on the weights of the indicators to obtain a comprehensive evaluation map of the subdistrict’s green space.
4. Results
4.1. Study Area Evaluation Results for Each Parameter
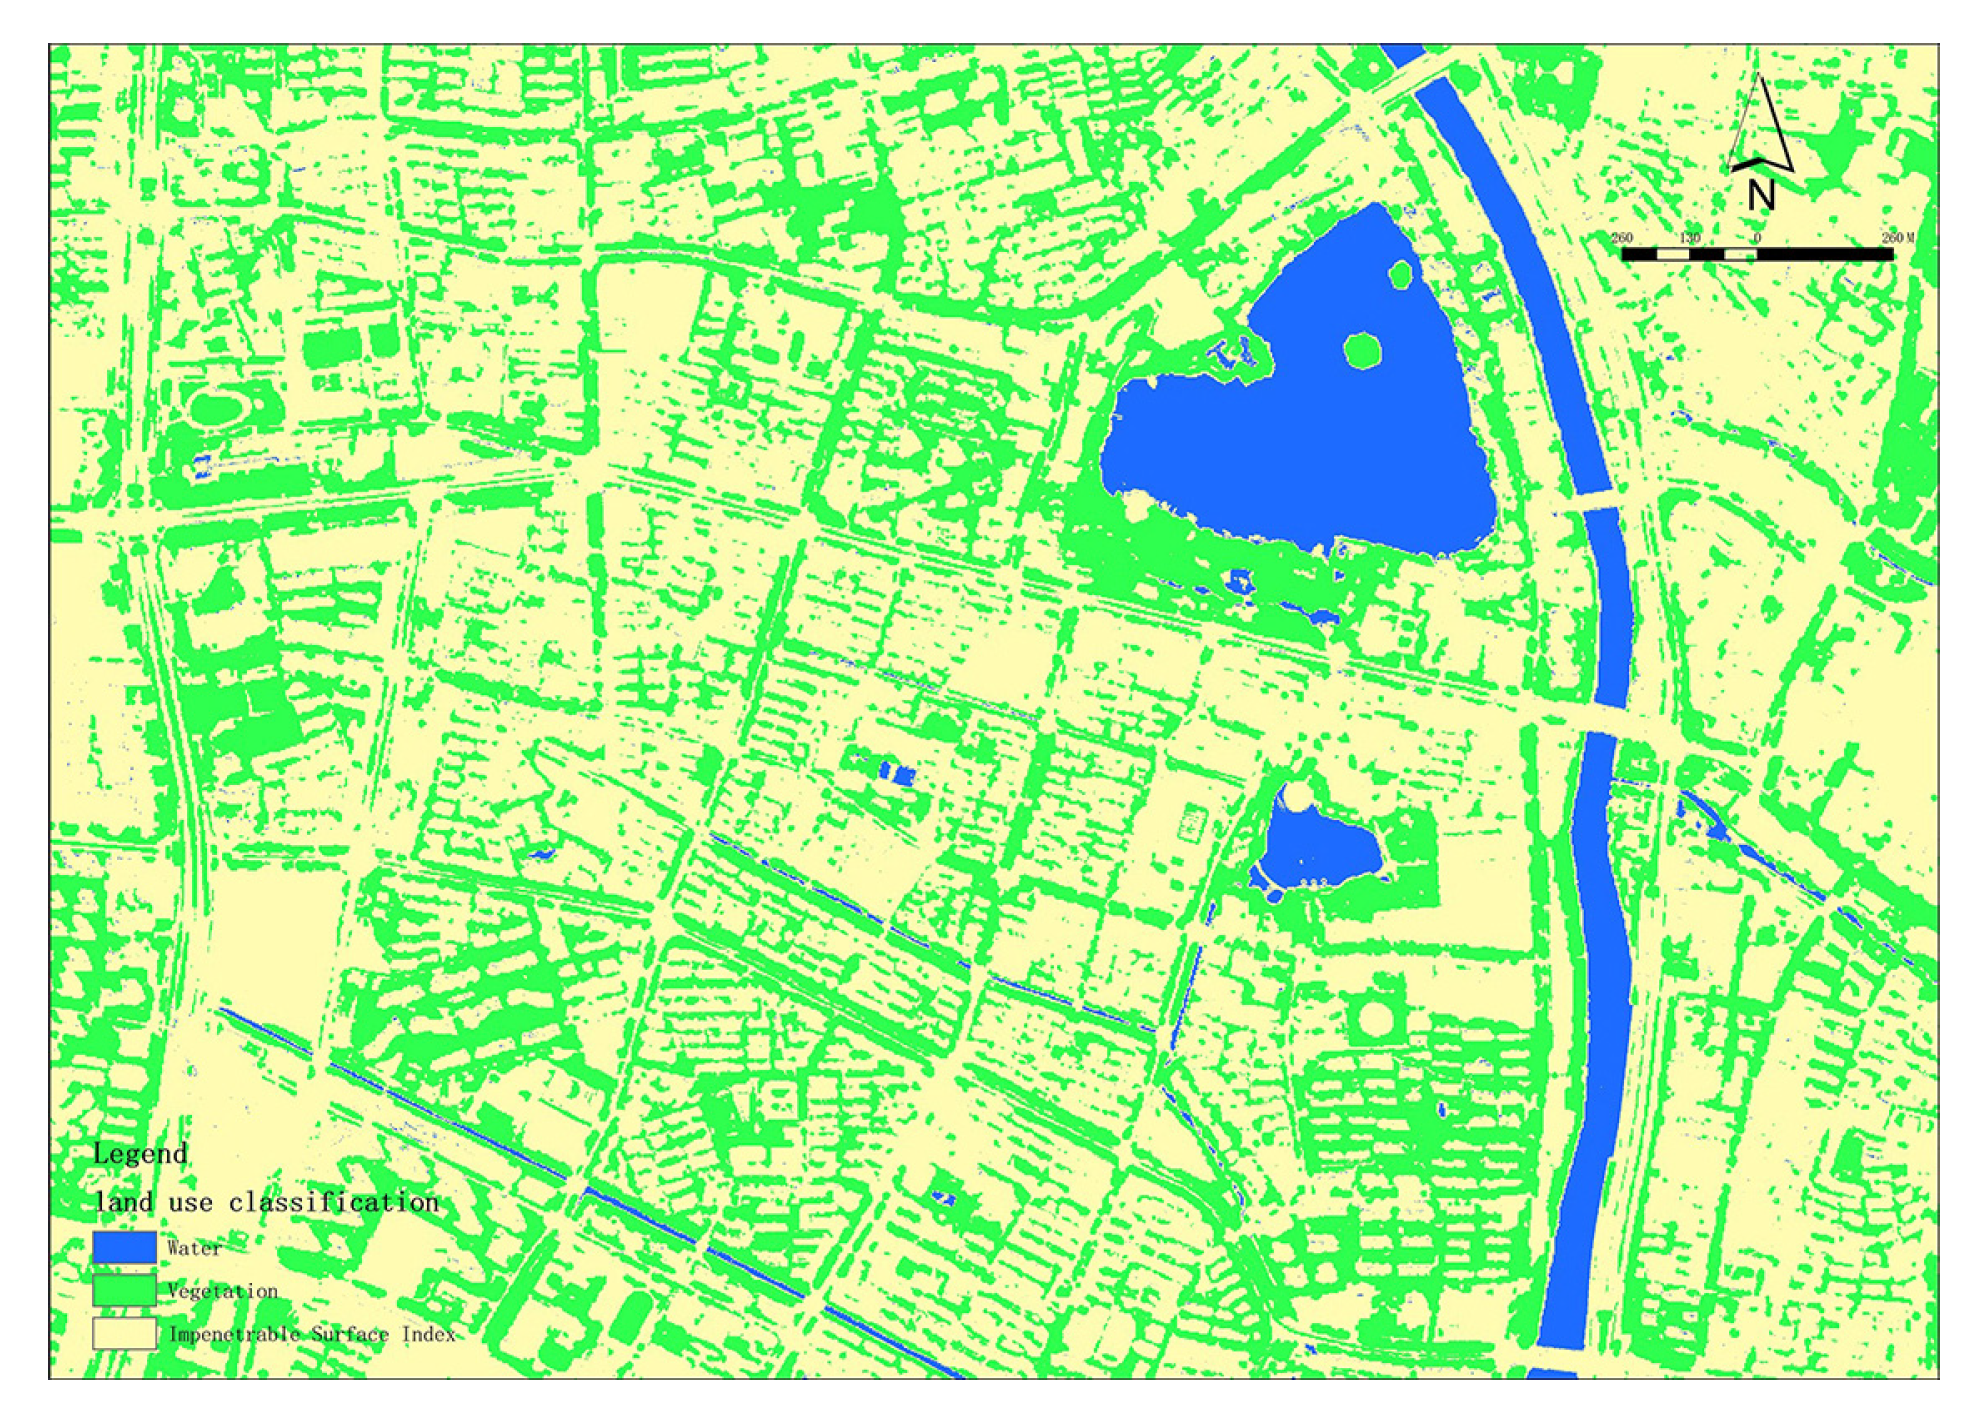
The Mochou Lake Subdistrict remote-sensing image was classified into three landcover types: vegetation (37%), impervious surface (58%), and water area (5%) (Figure 3).
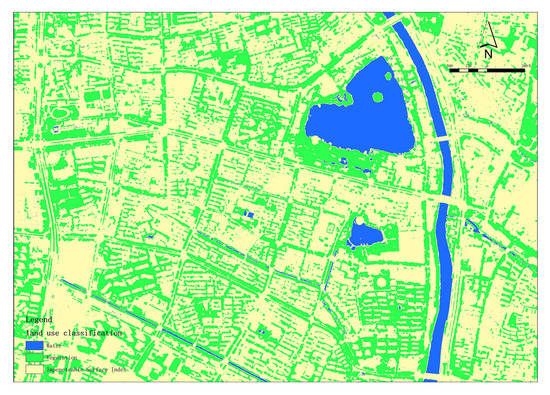
Figure 3.
Land cover classification map.
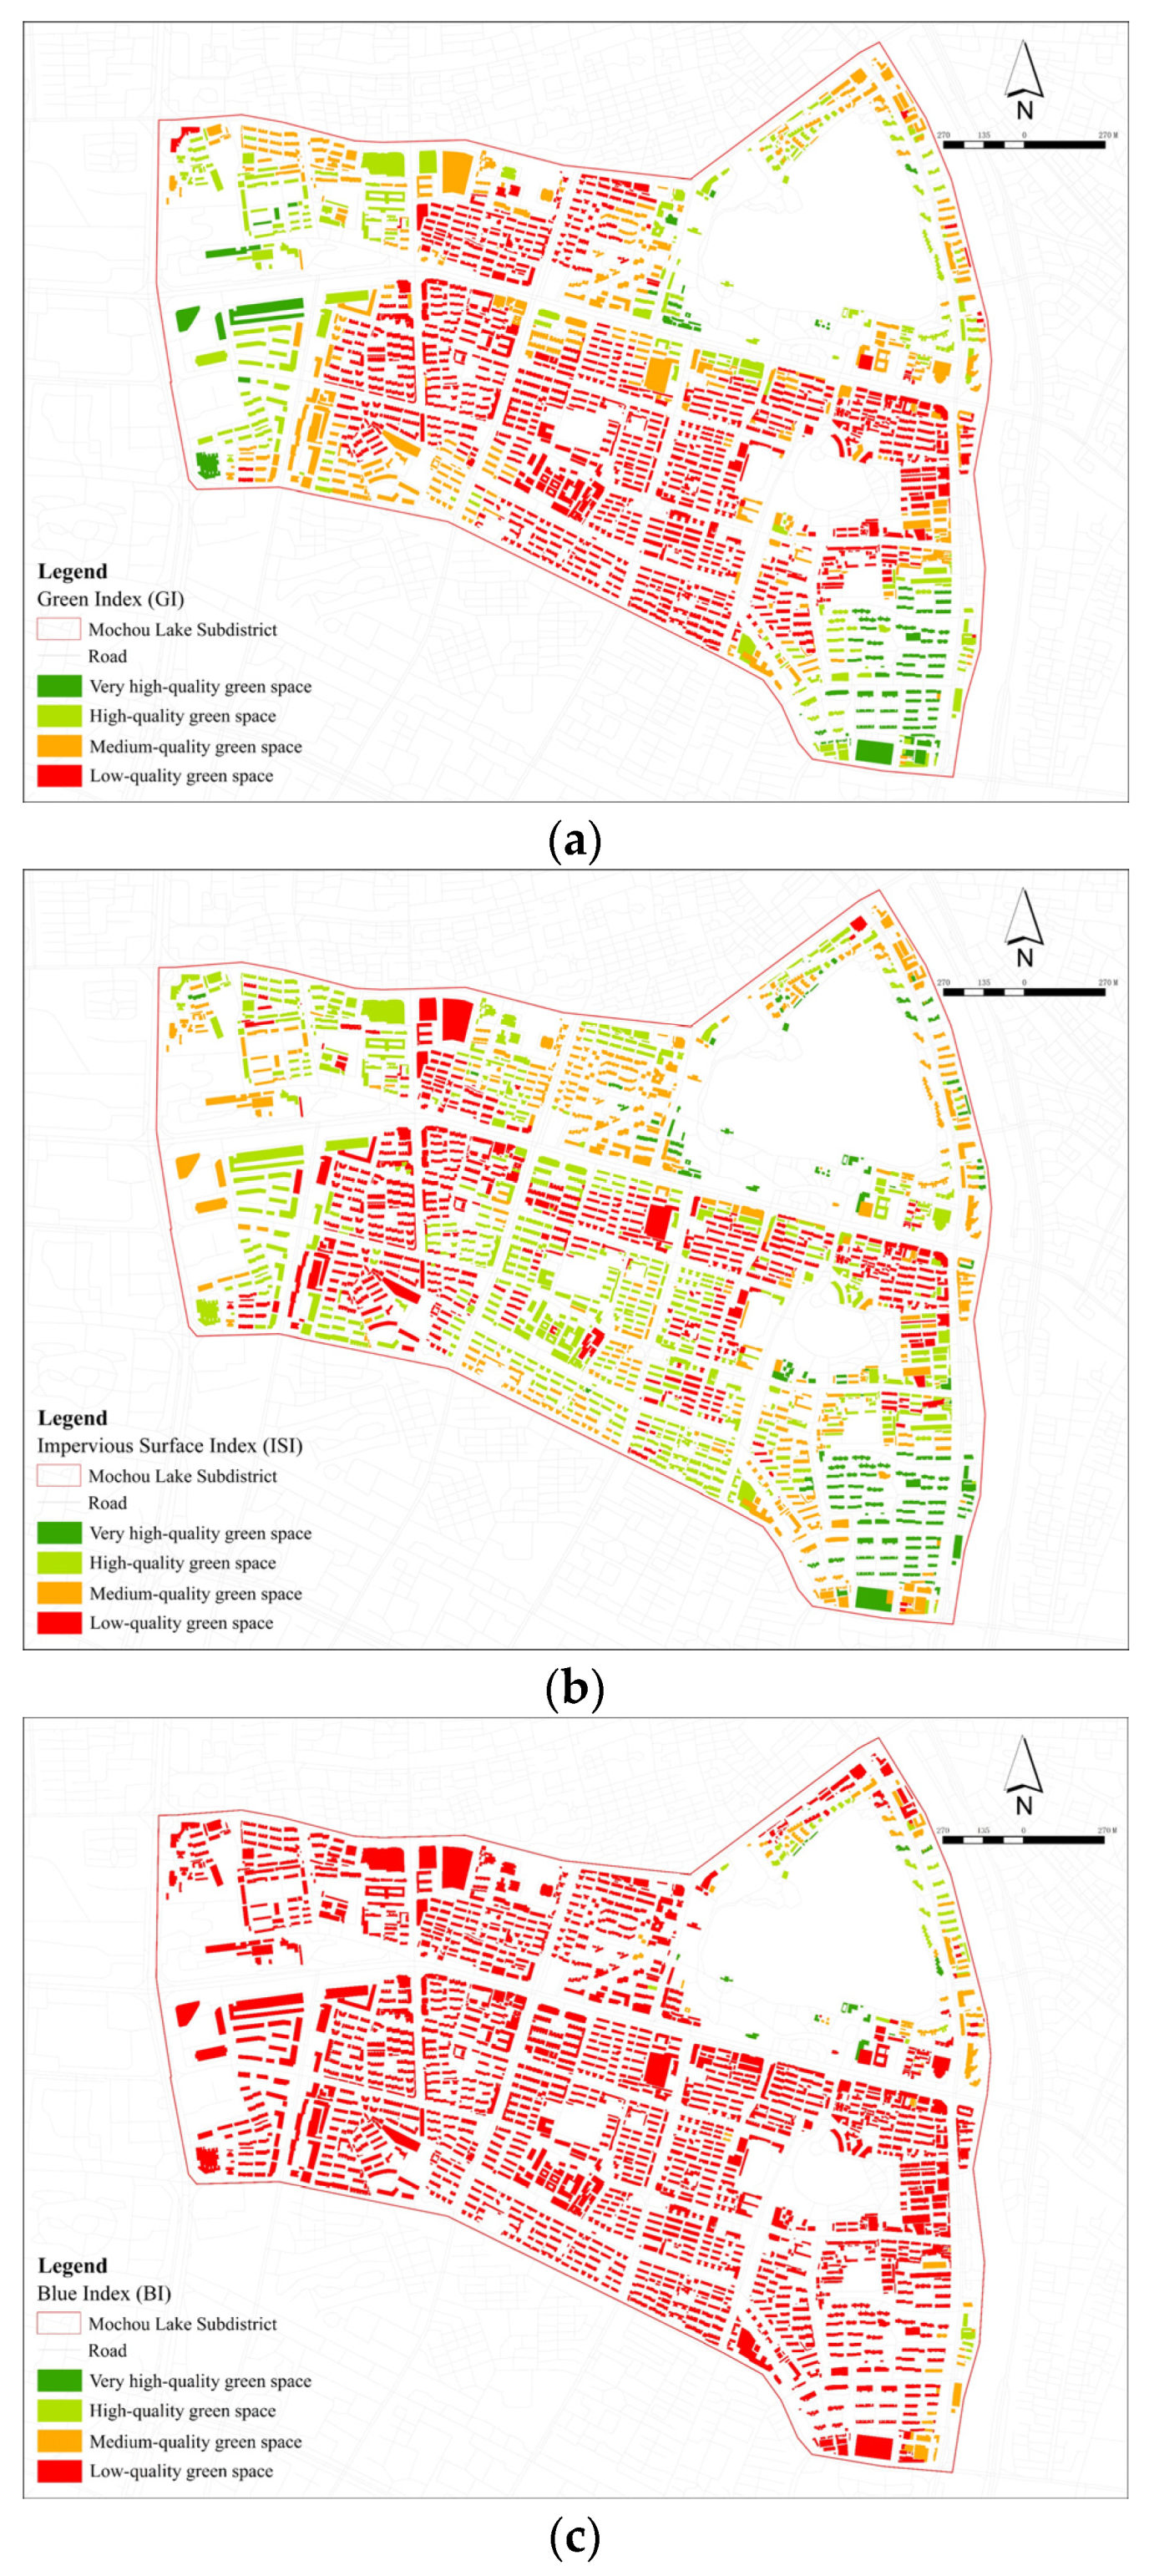
The green-space index (Figure 4a) indicated that the Jiangdongmen, Mingyuan, and Fengqi yuan communities in the west and the Changhong Road and Mochou Lake communities in the east had relatively large amounts of green space. Meanwhile, other communities had inadequate green space, with the green coverage of most buildings being low.
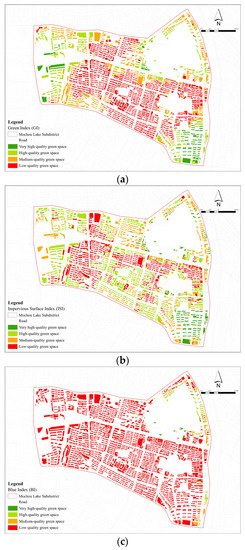
Figure 4.
(a) green index, (b) impervious surface index, (c) blue index.
The impervious surface index (Figure 4b) indicated that the impervious surface conditions of the Changhong Road and Mochou Lake communities in the east, Jiangdongmen in the west, and the Yanhe communities in the south were the best. The impervious surface coverage of most buildings in the study area was below the medium level.
The blue index (Figure 4c) indicated that compared to the communities far from water bodies, communities adjacent to Mochou Lake Park and along the east side of the Qinhuai River enjoyed more blue space, while it was inconvenient for the communities around Nanhu Lake Park to enjoy the health benefits offered by the water in Parks. Moreover, we found that most buildings with higher blue-space coverage also had higher green-space coverage.
These three types of land cover presented very different green-space quality maps. For example, the central part of the Mingyuan community had a high green index, but the impervious surface and blue indexes were low. Therefore, considering them at the same time when evaluating green-space quality is necessary.
From the results of the NDVI analysis (Figure 5a), we estimated the vegetation index (Figure 5b). The vegetation index showed that most communities were generally covered by vegetation. Surprisingly, the Beiwei and Yanhe communities, which had low blue and green indicators, had a high-quality vegetation context. We also found that buildings with high-quality blue space had generally low NDVI values.
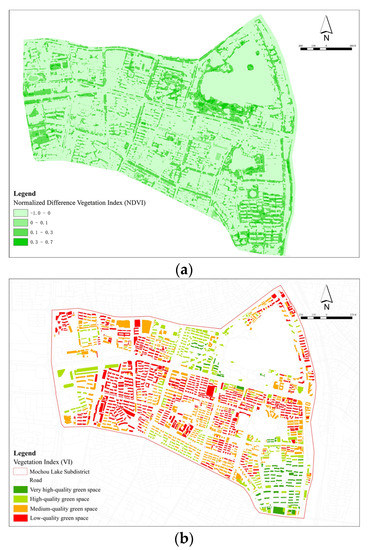
Figure 5.
(a) Mochou Lake Subdistrict NDVI map, (b) vegetation index.
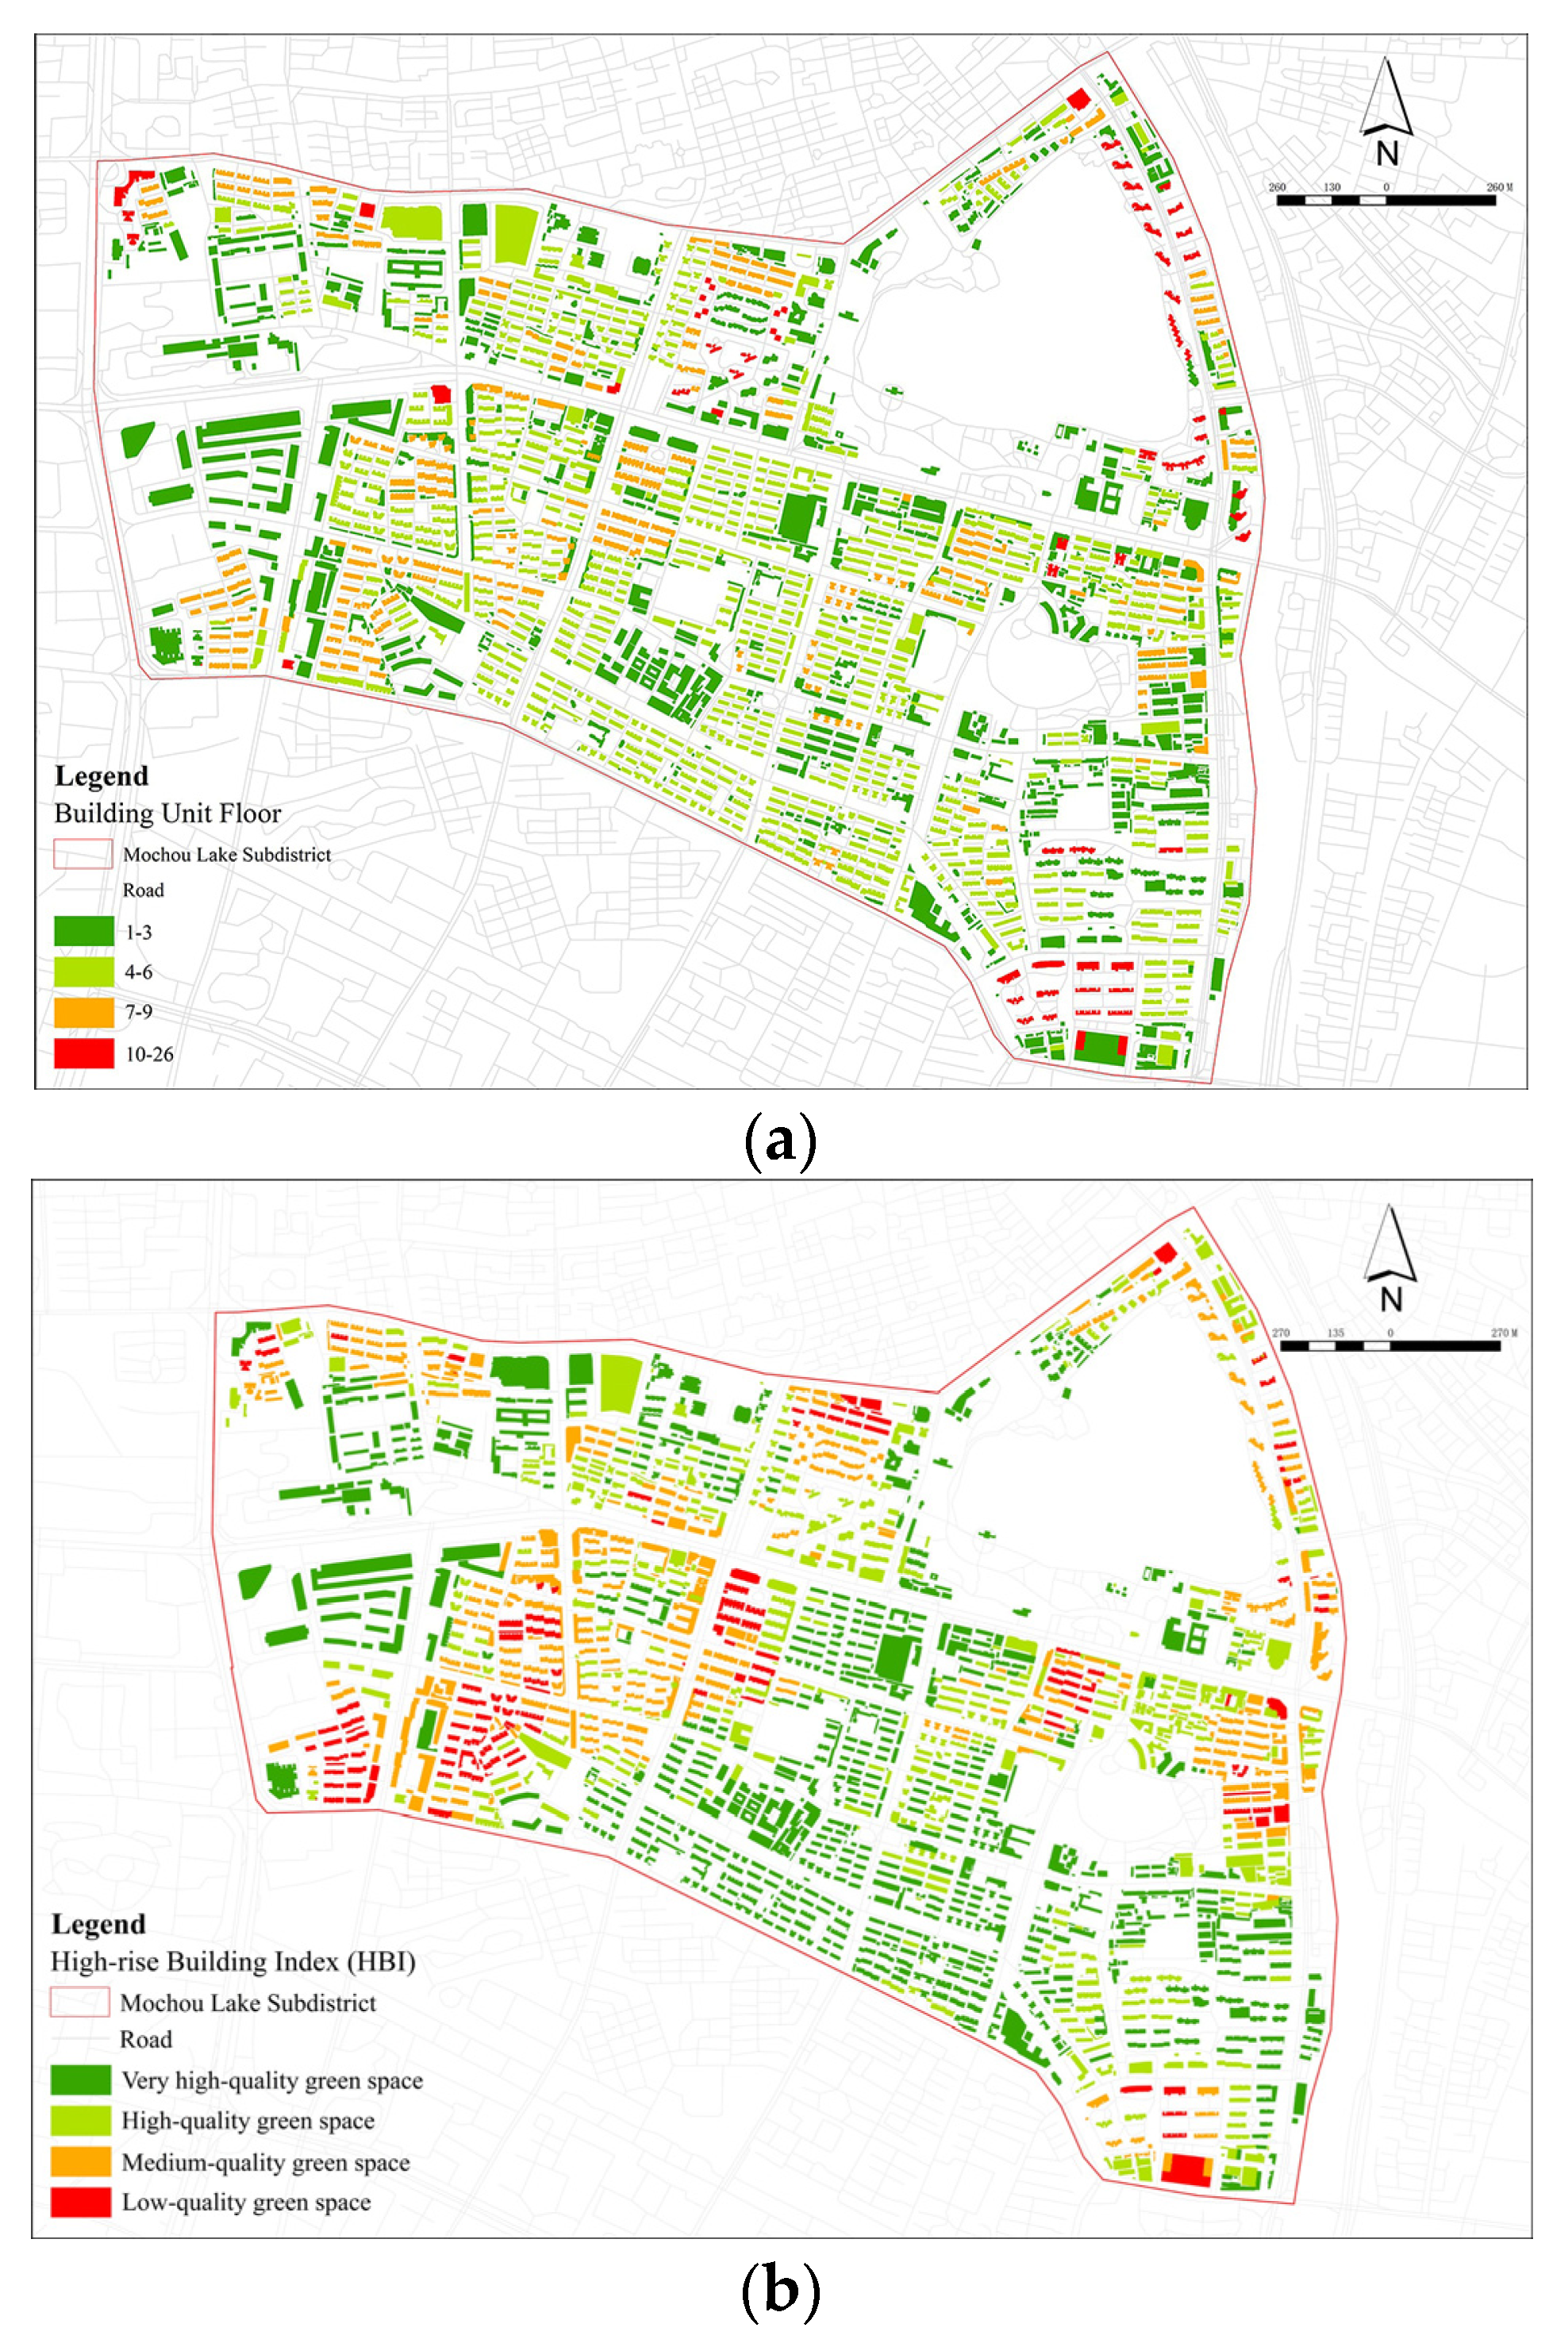
From the results of the building distribution map (Figure 6a), we can see that the buildings in the Mochou Lake Subdistrict were all arranged through orderly urban planning. The high-rise building index (Figure 6b) showed that most communities were made up of low-rise buildings. Therefore, most low-rise buildings had high-quality green space. It is worth noting that the Changhong Road community on the southeast side had very high-quality green space in terms of the green indexes, vegetation indexes, and impervious surface indexes. Based on the high-rise building index, however, it had low-quality green space.

Figure 6.
(a) Building distribution map, (b) high-rise building index.
4.2. Evaluation Results Based on BBGI
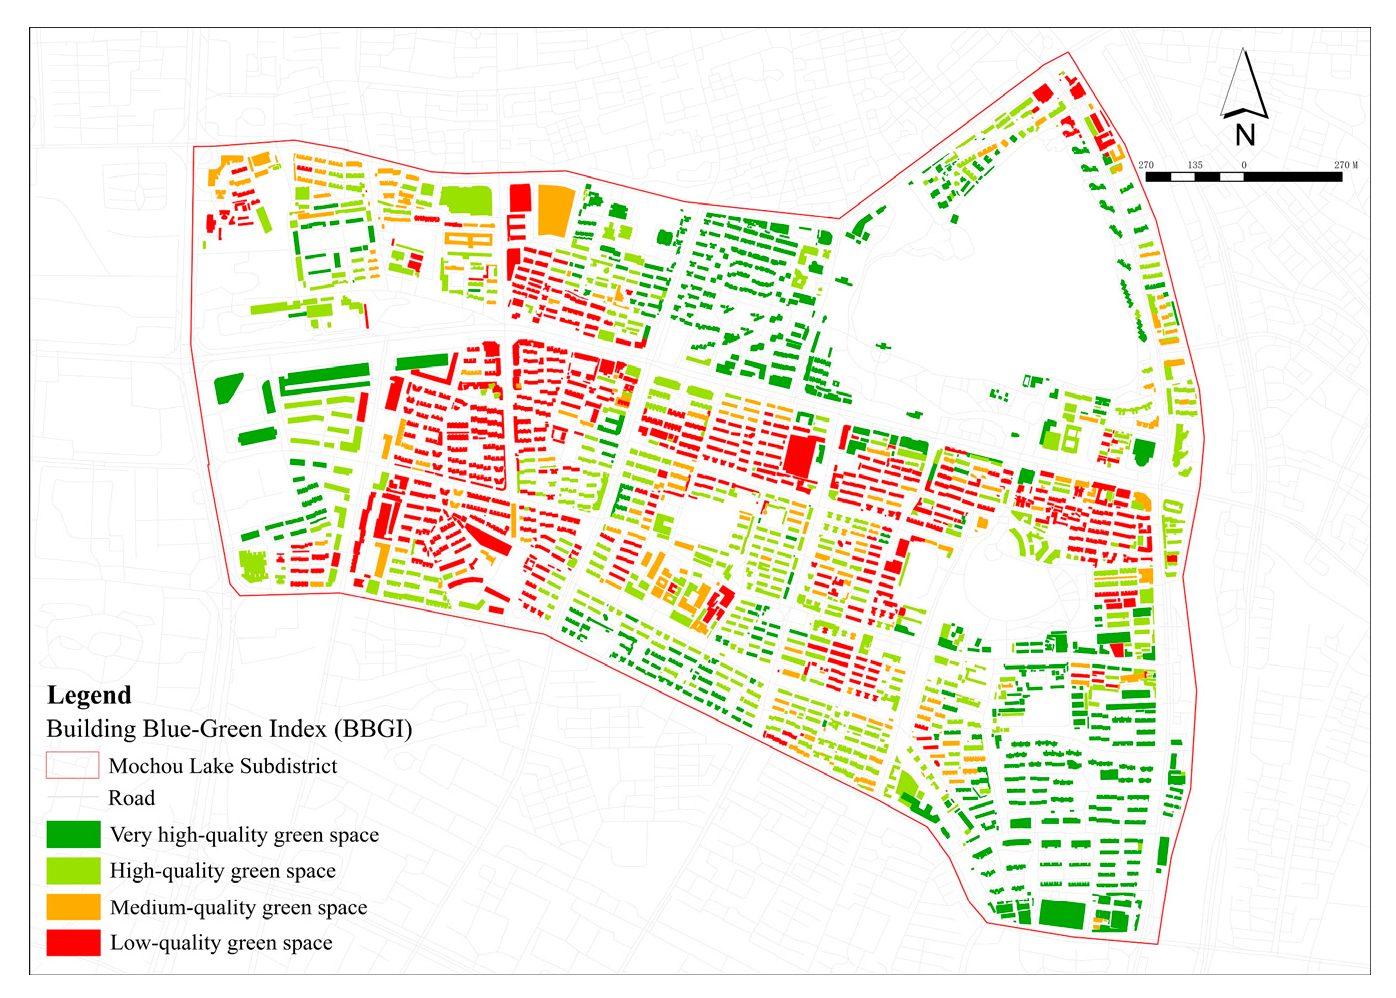
The evaluation factors for the Mochou Lake Subdistrict were weighted and superimposed according to the corresponding weights from Table 1. The BBGI results were then computed and were classified into four green-space quality categories (Figure 7). According to the BBGI results for 2138 buildings, we obtained the proportion and distribution of green-space quality in each community (Table 2).
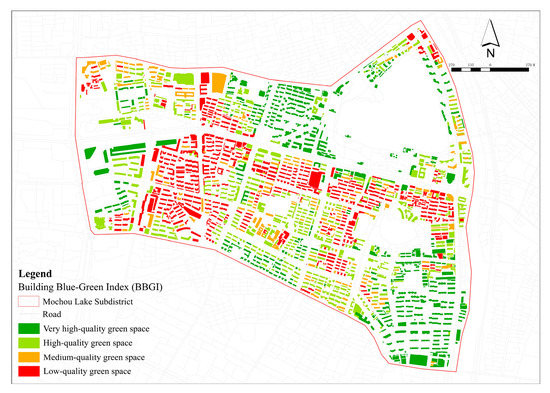
Figure 7.
Building blue–green index map.
Table 2.
Neighborhood walkability, green index, and BBGI results.
The quality of green space in the Mochou Lake Subdistrict was classified as follows: very high (28.02%), high (30.12%), medium (11.41%), and low (30.6%) (Table 2). Overall, the quality of green space was estimated to be relatively high. The very high-quality green spaces were concentrated in the Beiwei Road and Changhong Road communities. These two communities were built recently, dispersed with high-rise buildings and rich vegetation. They are also near Mochou Lake Park and Nanhu Lake Park, providing the area with high-quality green spaces. Low-quality green space was situated mainly in the low-rise and dense residential areas, which contained single vegetation types, disheveled sheds, and many cement surfaces.
4.3. Comparison of the Green Index and BBGI
Comparing the green index (Figure 4a) and BBGI (Figure 7), we found different results. In the study area, BBGI showed better green-space quality than the green index did. The green index revealed that low-quality green space was distributed in most communities, while only a small amount of medium-quality and high-quality green space was distributed around Mochou Lake Park and on the main roads of the community. Table 2 shows that only the Changhong Road community had very high-quality green space, with 3.32%, and the remaining communities were below 1%. Meanwhile, BBGI showed that each community had more high-and medium-quality green space.
4.4. The Effect of Neighborhood Walkability on UGS Quality
Compared with the green index, BBGI was more sensitive to neighborhood walkability. We compared communities with different degrees of neighborhood walkability.
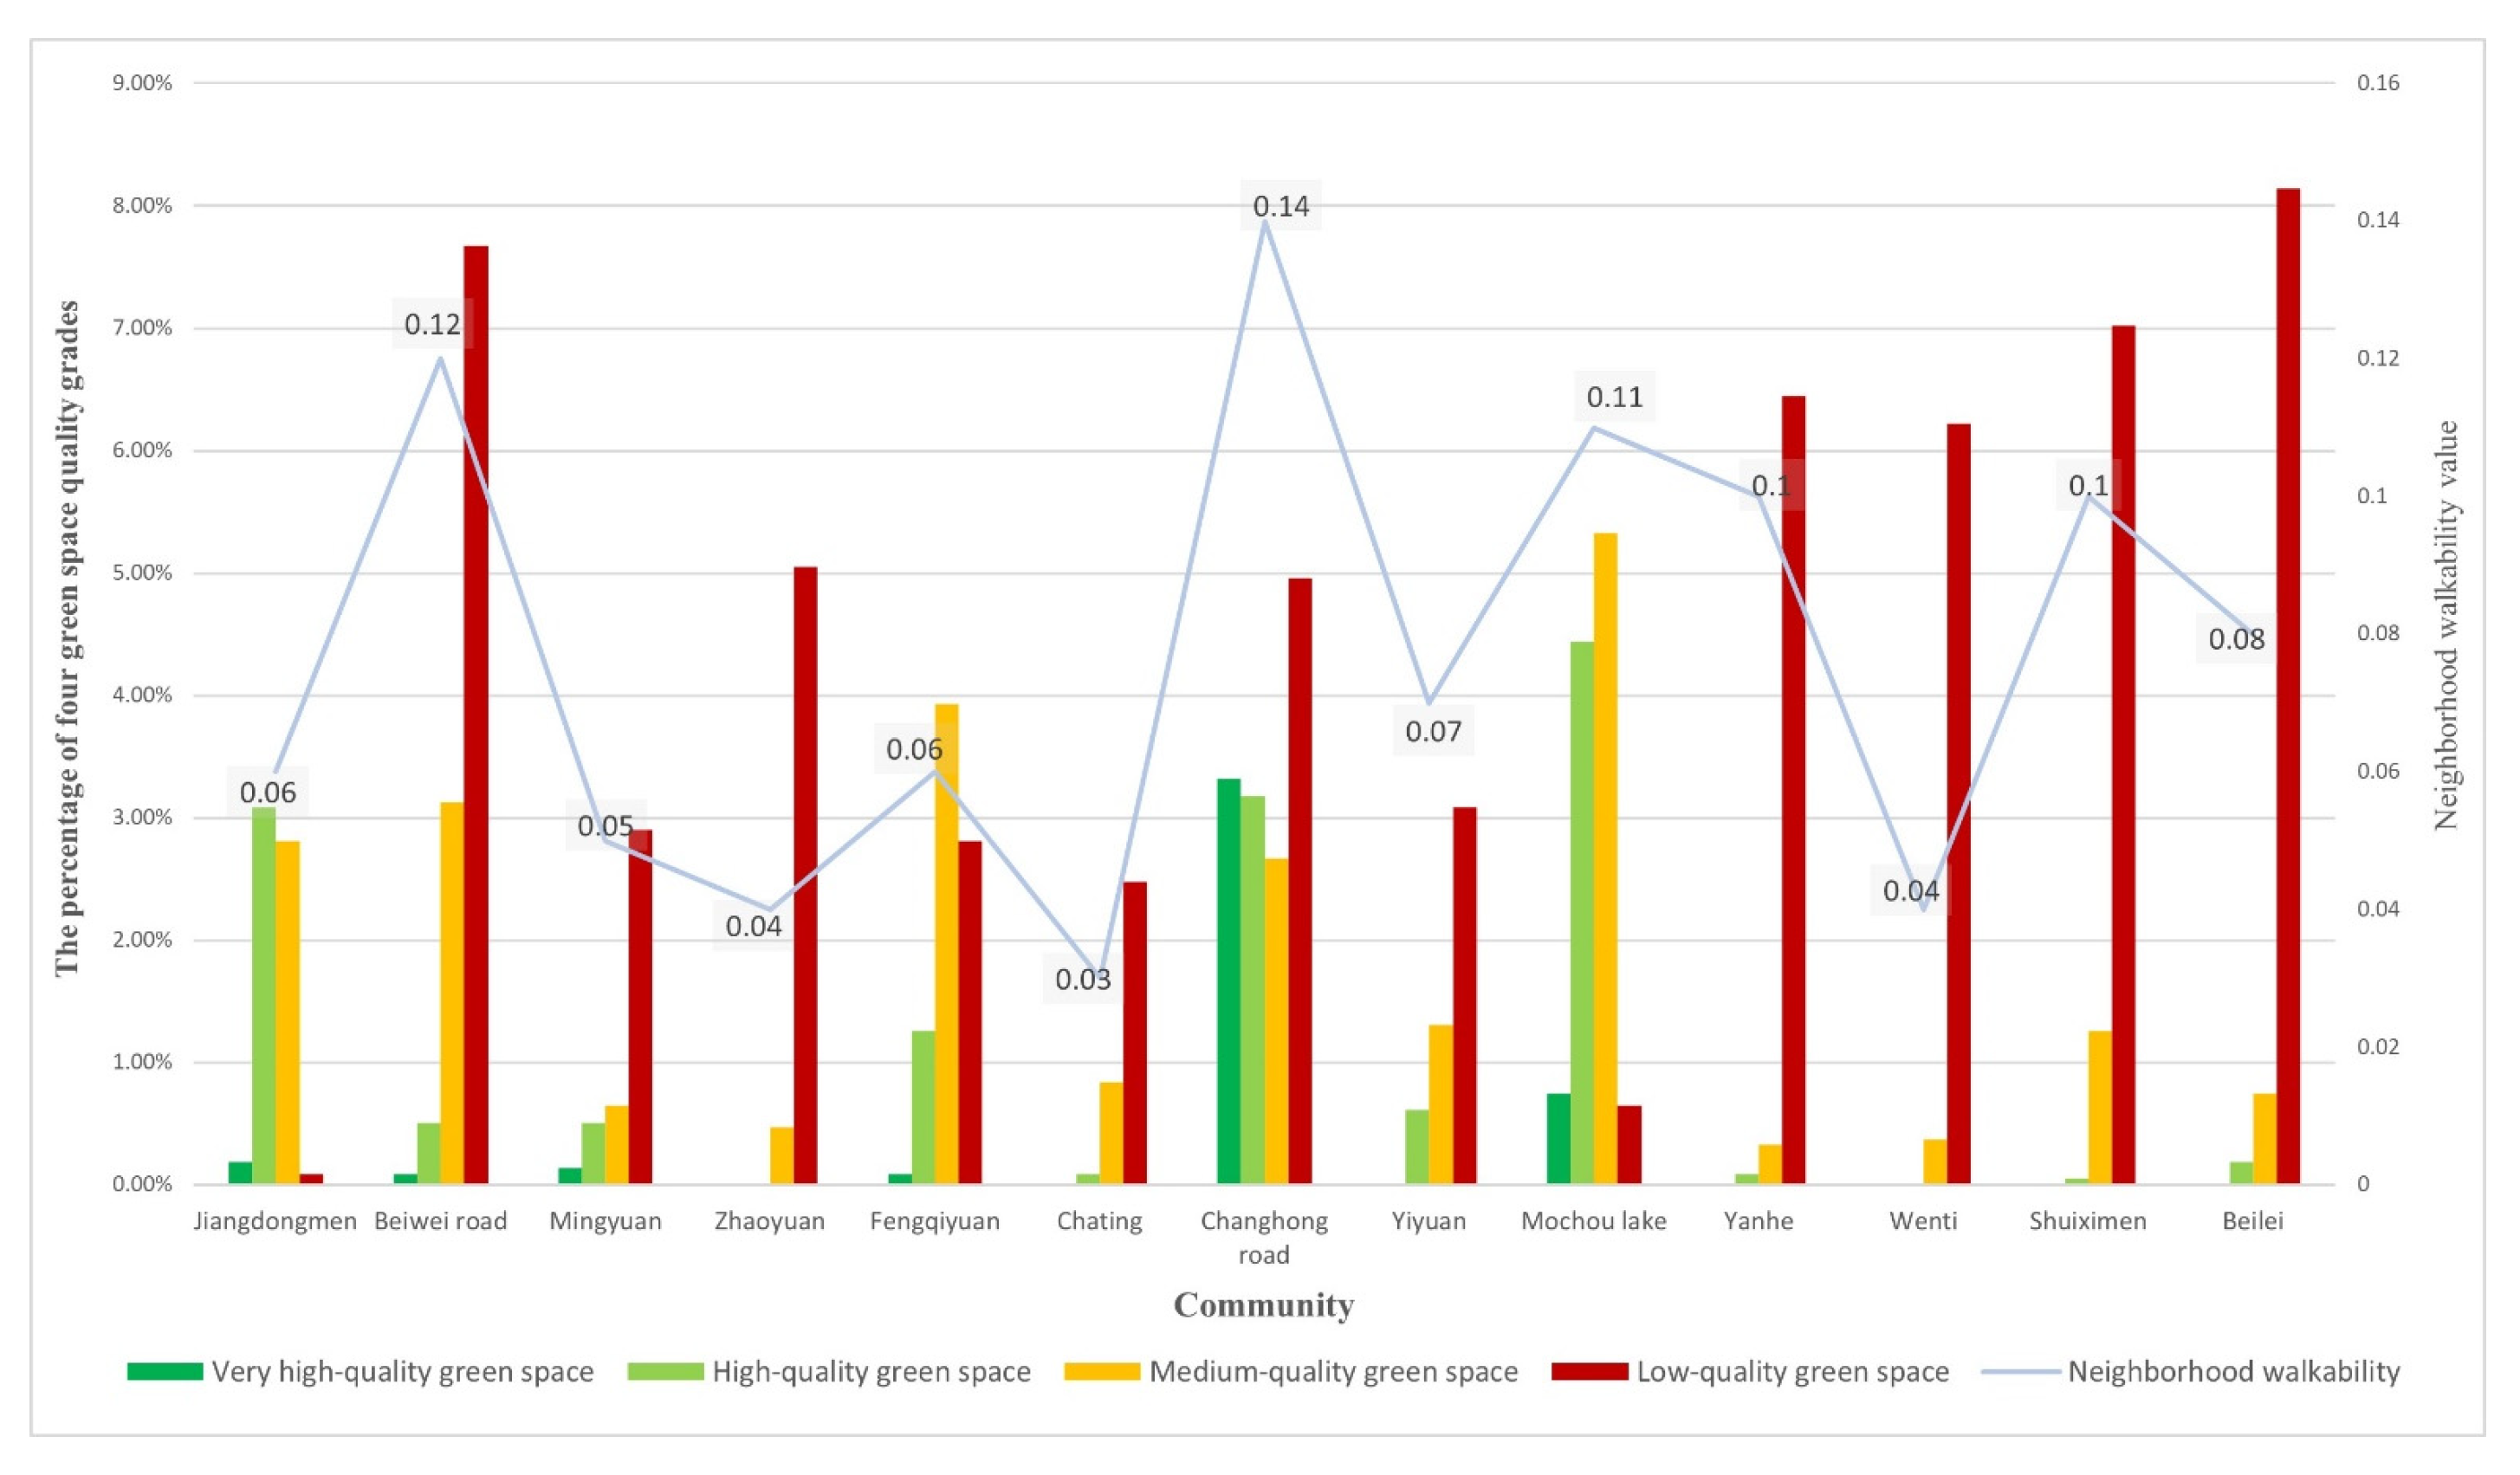
The green index (Figure 8) showed that the green-space quality of the two communities with a neighborhood walkability value higher than 0.1 in Mochou Lake and Changhong Road was better than that of other communities. Although the neighborhood walkability of the Shuiximen and Beiwei Road communities was also higher than 0.1, their green-space quality was not as good as that of Jiangdongmen and Fengqi Road, whose neighborhood walkability values were only 0.06 and 0.07, respectively. BBGI, meanwhile, showed that except for the Shuiximen community, the communities with a neighborhood walkability value higher than 0.1 had higher green-space quality (Figure 9). The high building density increased the impervious surface area, which contributed to the overall low quality of green spaces in Shuiximen. As shown in Figure 1, while the west side of Shuiximen is adjacent to Nanhu Park, the internal building density is very high with basically no vegetation cover in the living environment. The Beiweilu community has a high degree of mixed land use. There is a university as well as government office buildings and commercial facilities on the north side. The survey revealed a great deal of green space surrounding these facilities. BBGI can therefore be considered a more accurate measurement for identifying the effect of neighborhood walkability on UGS quality.
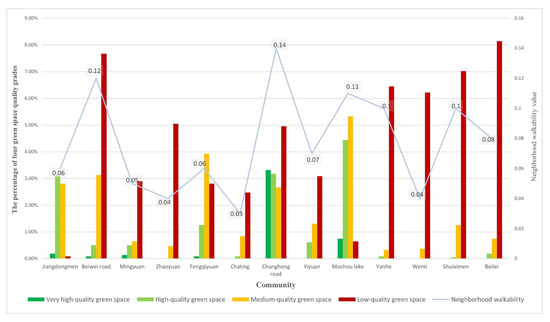
Figure 8.
Relationship between the green index and neighborhood walkability.
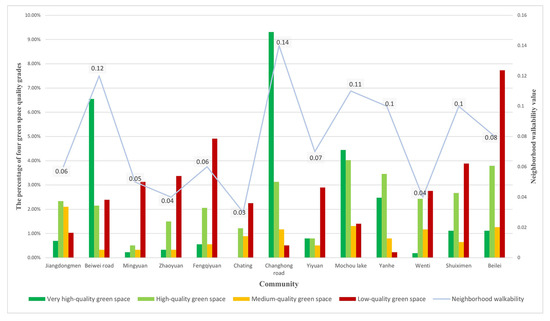
Figure 9.
Relationship between BBGI and neighborhood walkability.
5. Discussion
5.1. Advantages of BBGI
In this study, we presented a tool for assessing the quality of UGS for each building in a neighborhood as opposed to measuring the green quality of each grid or administrative district. The advantages of BBGI are as follows. First, BBGI integrates specific urban characteristics such as vegetation, water, impervious surface, and building height into GI; thus, it is more in line with reality. For example, if we only consider green space and plants and ignore water, the eastern part of the Mochou Lake community adjacent to Qinhuai River and Mochou Lake Park would be considered to have the same green-space quality as the Yanhe community, which is adjacent to the main road. BBGI shows not only the overall distribution of green-space quality but also the UGS quality in walkable areas surrounding each building. Second, this study was the first to apply GF2 remote sensing to the evaluation of green space at neighborhood level. It has been suggested that high spatial resolution images do not always meet the needs of UGS research [53,54]. However, for urban areas where buildings are arranged in a certain order and distance, our research supported the use of high spatial resolution images for green-space assessment. We achieved a high overall coefficient and Kappa coefficient, satisfying the requirements of classification accuracy. Furthermore, since the spatial resolution of imagery provided by the GF2 satellite is 1 m, we could identify small patches of green space, in line with those who have suggested that small-scale green space should be the focus of UGS research based on remote sensing [55].
Finally, the assessment measure used in this study is representative of the trend toward combining microscale measurement and macroscale analysis in UGS research [16,56,57]. The evaluation of UGS quality at the building level is more objective and authentic [50]. Meanwhile, the method is suitable for helping the local government identify blind spots in the built environment and take effective measures to improve it.
5.2. Implications for UGS Planning and Design
Our results suggested that BBGI was a more accurate indicator than the general index for assessing UGS quality. We found that BBGI identified better green-space quality than the green index. Recent studies have also found that the green index might underestimate UGS quality [22,58]. Thus, we proposed that the comprehensive assessment of neighborhood-scale green-space quality could provide more detailed implications for urban planners and policymakers.
This study contributes to the environmental justice literature by revealing the uneven spatial distribution of UGS quality at different scales. At the neighborhood scale, we found that the green-space quality of high-rise, low-density communities was higher than that of low-rise, high-density communities. This was similar to Gupta et al. [22]. However, some buildings in high-rise, low-density communities still had lower green-space quality than those in low-rise communities. This was mainly attributable to the different distribution patterns of green space. In high-rise, low-density areas, green space was attached to estate companies or institutions and evenly distributed around each building. In low-rise, high-density areas, which were old and mainly built by state and collective units, green space was distributed either around the boundary of residential areas or concentrated in the center of residential areas.
Gated communities are one major type of residential area in China. In this case, in addition to the public and private provision of green space in the community, there is also a form of club provision. One study found that the complementarity of clubbed green space and public green space is possible [9,59]. Thus, we also propose a policy framework that encourages clubbed communities with high-quality green space to share green space with other communities with low-quality UGS [59]. For example, Gupta et al. [60] argued that there is great potential for institutional green space to be converted into public green space on nonworking days through compensation mechanisms acceptable to residents.
Moreover, although there is evidence that small, fragmented green spaces are indicative of worse quality compared to large, contiguous ones [61,62], we found that communities adjacent to large public parks did not necessarily have higher-quality green space. We also found that communities along rivers or lakes did not necessarily have a higher blue index. The main reason for this is that in developing cities, the layout of large public parks is based on blueprint planning rather than the conditions of the road network. Inconvenient pedestrian roads and enclosed walls around neighborhoods make it difficult to access blue–green spaces. Another reason is that most of Nanhu park and Mochou Lake park are covered by water, leaving little space for vegetation and green space. Low green-space coverage and NDVI lower the quality of green space in nearby areas. Wu and Zhang [45] reached a similar conclusion with regard to Suzhou—another Chinese city that has dense blue spaces. We should pay attention, therefore, to the value of blue space in the evaluation of green-space quality. Based on our findings, we propose that a blue space-oriented network can be constructed to improve the connectivity between UGS and neighborhoods [63]. For example, a blue–green infrastructure (BGI) network [28] could be established by connecting existing parks, historical sites, recreational sites, and rivers.
The BBGI may also provide implications for optimizing urban land use patterns in crowed residential areas. For communities with high impervious index and low green index, it is possible to convert impervious water into green space to improve the accessibility of buildings to green space. However, for communities with low impervious index and low green index, the scarcity of land made it difficult to add green space. Three-dimensional greening could be an alternative strategy [64].
5.3. Limitations and Future Research
This study had some limitations. First, the GF-2 image we used was captured on 26 April 2018. This could have resulted in some bias because of seasonal differences [55]. In the future, periodic assessments based on multi-temporal images can be used to reveal neighborhood green-space evolution in terms of socioeconomic and neighborhood characteristics [20,65]. Sathyakumar et al. [66], for example, studied changes in green-space distribution in Mumbai from 2001 to 2011 and found that the quantity of green space had decreased and that the landscape had become fragmented; these changes showed obvious differences at the neighborhood scale.
Second, in constructing the network analysis model, we do not classify UGS at different hierarchical levels. However, distinguishing the hierarchy of UGS is important since different kinds of green space meet the needs of different population groups [60]. Thus, future studies could test the quality of green space by considering different buffers in network analysis to further reveal the distribution of UGS based on BBGI.
Third, BBGI is an objective measurement based on an overhead view. Studies have shown that green-space measurements based on eye level and overhead views reveal different aspects of green-space quality [8,16]. For example, citizens’ thermal comfort brought by green space is an important aspect of green space quality, which can only be measured by questionnaires methods [67,68,69]. Thus, BBGI is needed to combine with subjective perceptual data to provide more insightful recommendations regarding UGS planning and design.
Finally, Li et al. [23] noted that building-oriented UGS measurement has the potential to be applied to more macroscale urban areas. However, further tests and improvements are needed before BBGI is applied in the real world. The developed BBGI is an indicator for residential areas in central districts. The areas are simply classified into three land cover types (water, green space, and impervious surface). In order to accommodate different land use patterns and management policies between central districts and suburban districts future research needs to perform more specific land use classifications.
6. Conclusions
Although UGSs have multiple benefits for communities, increasing the amount of green space has not always been a top priority, especially given the problems of limited spaces with various conflicting uses. In this regard, the Mochou Lake Subdistrict is typical of many large cities in that simply considering the proportion of green space is not sufficient for improving the quality of the living environment. This study developed a blue–green space evaluation method that provides a more microscopic perspective by using residential building blocks. The method assesses UGS quality based on network analysis and provides an objective decision-making approach for UGS.
The results revealed that owing to building density and the distribution of UGSs and water bodies, high-quality green spaces were mainly distributed near newly built residential areas or around green park spaces. Most older neighborhoods had low-quality green spaces. This study contributed to our understanding of the complementarity between subjective perception and objective measurement. Based on the findings, we recommend improving UGS quality in older neighborhoods through the public use of clubbed green space, promoting the land management policies, implementing three-dimensional greening, and constructing a blue space-oriented network system. These findings offer an improved understanding of how to better plan and design high-quality green spaces in urban environments.
Author Contributions
Conceptualization, methodology, writing, supervision, project administration and funding acquisition, Z.L. Investigation, software, data curation, original draft preparation and visualization, X.C. Formal analysis, resources, reviewing and editing, Z.S. and Z.F. All authors have read and agreed to the published version of the manuscript.
Funding
This research was funded by the National Natural Science Foundation of China (No. 41001086).
Institutional Review Board Statement
Not applicable.
Informed Consent Statement
Not applicable.
Data Availability Statement
The data presented in this study are available on request from the corresponding author.
Conflicts of Interest
The authors declare no conflict of interest.
References
- Girma, Y.; Terefe, H.; Pauleit, S. Urban green spaces use and management in rapidly urbanizing countries:-The case of emerging towns of Oromia special zone surrounding Finfinne, Ethiopia. Urban For. Urban Green. 2019, 43, 126357. [Google Scholar] [CrossRef]
- Haaland, C.; van den Bosch, C.K. Challenges and strategies for urban green-space planning in cities undergoing densification: A review. Urban For. Urban Green. 2015, 14, 760–771. [Google Scholar] [CrossRef]
- Yen, Y.; Wang, Z.; Shi, Y.; Xu, F.; Soeung, B.; Sohail, M.T.; Rubakula, G.; Juma, S.A. The predictors of the behavioral intention to the use of urban green spaces: The perspectives of young residents in Phnom Penh, Cambodia. Habitat Int. 2017, 64, 98–108. [Google Scholar] [CrossRef]
- Xiao, Y.; Zhang, Y.; Sun, Y.; Tao, P.; Kuang, X. Does Green Space Really Matter for Residents’ Obesity? A New Perspective from Baidu Street View. Front. Public Health 2020, 8, 332. [Google Scholar] [CrossRef] [PubMed]
- Annerstedt van den Bosch, M.; Mudu, P.; Uscila, V.; Barrdahl, M.; Kulinkina, A.; Staatsen, B.; Swart, W.; Kruize, H.; Zurlyte, I.; Egorov, A.I. Development of an urban green space indicator and the public health rationale. Scand. J. Public Health 2015, 44, 159–167. [Google Scholar] [CrossRef]
- Wang, R.; Zhao, J.; Meitner, M.J.; Hu, Y.; Xu, X. Characteristics of urban green spaces in relation to aesthetic preference and stress recovery. Urban For. Urban Green. 2019, 41, 6–13. [Google Scholar] [CrossRef]
- Feng, X.; Astell-Burt, T. Residential Green Space Quantity and Quality and Child Well-being: A Longitudinal Study. Am. J. Prev. Med. 2017, 53, 616–624. [Google Scholar] [CrossRef]
- Leslie, E.; Sugiyama, T.; Ierodiaconou, D.; Kremer, P. Perceived and objectively measured greenness of neighbourhoods: Are they measuring the same thing? Landsc. Urban Plan. 2010, 95, 28–33. [Google Scholar] [CrossRef]
- Zhang, Y.; Wu, Q.; Wu, L.; Li, Y. Measuring Community Green Inequity: A Fine-Scale Assessment of Beijing Urban Area. Land 2021, 10, 1197. [Google Scholar] [CrossRef]
- Fan, C.; Gai, Z.; Shen, S.; Sun, S. An implementation evaluation framework of ecological spatial planning based on multi-dimensional data: A case study in China. Urban For. Urban Green. 2021, 63, 127222. [Google Scholar] [CrossRef]
- Arghavani, S.; Malakooti, H.; Bidokhti, A.-A.A.A. Numerical assessment of the urban green space scenarios on urban heat island and thermal comfort level in Tehran Metropolis. J. Clean. Prod. 2020, 261, 121183. [Google Scholar] [CrossRef]
- Putra, I.G.N.E.; Astell-Burt, T.; Cliff, D.P.; Vella, S.A.; Feng, X. Do physical activity, social interaction, and mental health mediate the association between green space quality and child prosocial behaviour? Urban For. Urban Green. 2021, 64, 127264. [Google Scholar] [CrossRef]
- Nguyen, P.-Y.; Astell-Burt, T.; Rahimi-Ardabili, H.; Feng, X. Green Space Quality and Health: A Systematic Review. Int. J. Environ. Res. Public Health 2021, 18, 11028. [Google Scholar] [CrossRef] [PubMed]
- Fan, Z.; Duan, J.; Lu, Y.; Zou, W.; Lan, W. A geographical detector study on factors influencing urban park use in Nanjing, China. Urban For. Urban Green. 2021, 59, 126996. [Google Scholar] [CrossRef]
- Leslie, E.; Saelens, B.; Frank, L.; Owen, N.; Bauman, A.; Coffee, N.; Hugo, G. Residents’ perceptions of walkability attributes in objectively different neighbourhoods: A pilot study. Health Place 2005, 11, 227–236. [Google Scholar] [CrossRef] [PubMed]
- Gulwadi, G.B.; Mishchenko, E.D.; Hallowell, G.; Alves, S.; Kennedy, M. The restorative potential of a university campus: Objective greenness and student perceptions in Turkey and the United States. Landsc. Urban Plan. 2019, 187, 36–46. [Google Scholar] [CrossRef]
- Loder, A.K.F.; Schwerdtfeger, A.; Van Poppel, M.N.M. Perceived greenness at home and at university are independently associated with mental health. BMC Public Health 2020, 20, 802. [Google Scholar] [CrossRef]
- Zhang, Y.; Van den Berg, A.E.; Van Dijk, T.; Weitkamp, G. Quality over Quantity: Contribution of Urban Green Space to Neighborhood Satisfaction. Int. J. Environ. Res. Public Health 2017, 14, 535. [Google Scholar] [CrossRef]
- Richards, D.R.; Passy, P.; Oh, R.R. Impacts of population density and wealth on the quantity and structure of urban green space in tropical Southeast Asia. Landsc. Urban Plan. 2017, 157, 553–560. [Google Scholar] [CrossRef]
- Yan, J.; Zhou, W.; Zheng, Z.; Wang, J.; Tian, Y. Characterizing variations of greenspace landscapes in relation to neighborhood characteristics in urban residential area of Beijing, China. Landsc. Ecol. 2019, 35, 203–222. [Google Scholar] [CrossRef]
- Loder, A.K.F.; Gspurning, J.; Paier, C.; Van Poppel, M.N.M. Objective and Perceived Neighborhood Greenness of Students Differ in Their Agreement in Home and Study Environments. Int. J. Environ. Res. Public Health 2020, 17, 3427. [Google Scholar] [CrossRef] [PubMed]
- Gupta, K.; Kumar, P.; Pathan, S.K.; Sharma, K.P. Urban Neighborhood Green Index—A measure of green spaces in urban areas. Landsc. Urban Plan. 2012, 105, 325–335. [Google Scholar] [CrossRef]
- Li, X.; Meng, Q.; Li, W.; Zhang, C.; Jancsó, T.; Mavromatis, S. An explorative study on the proximity of buildings to green spaces in urban areas using remotely sensed imagery. Ann. GIS 2014, 20, 193–203. [Google Scholar] [CrossRef]
- Liu, Y.; Meng, Q.; Zhang, J.; Zhang, L.; Jancsó, T.; Vatseva, R. An effective Building Neighborhood Green Index model for measuring urban green space. Int. J. Digit. Earth 2016, 9, 387–409. [Google Scholar] [CrossRef]
- Lotfata, A. Using Remote Sensing in Monitoring the Urban Green Spaces: A Case Study in Qorveh, Iran. Eur. J. Environ. Earth Sci. 2021, 2, 11–15. [Google Scholar] [CrossRef]
- Cui, L.; Wang, J.; Sun, L.; Lv, C. Construction and optimization of green space ecological networks in urban fringe areas: A case study with the urban fringe area of Tongzhou district in Beijing. J. Clean. Prod. 2020, 276, 124266. [Google Scholar] [CrossRef]
- Ha, J.; Kim, H.J.; With, K.A. Urban green space alone is not enough: A landscape analysis linking the spatial distribution of urban green space to mental health in the city of Chicago. Landsc. Urban Plan. 2021, 218, 104309. [Google Scholar] [CrossRef]
- Ahmed, S.; Meenar, M.; Alam, A. Designing a Blue-Green Infrastructure (BGI) Network: Toward Water-Sensitive Urban Growth Planning in Dhaka, Bangladesh. Land 2019, 8, 138. [Google Scholar] [CrossRef] [Green Version]
- Lourdes, K.; Gibbins, C.; Hamel, P.; Sanusi, R.; Azhar, B.; Lechner, A. A Review of Urban Ecosystem Services Research in Southeast Asia. Land 2021, 10, 40. [Google Scholar] [CrossRef]
- Dai, X.; Wang, L.; Tao, M.; Huang, C.; Sun, J.; Wang, S. Assessing the ecological balance between supply and demand of blue-green infrastructure. J. Environ. Manag. 2021, 288, 112454. [Google Scholar] [CrossRef]
- Jiang, Y.; Huang, J.; Shi, T.; Li, X. Cooling Island Effect of Blue-Green Corridors: Quantitative Comparison of Morphological Impacts. Int. J. Environ. Res. Public Health 2021, 18, 11917. [Google Scholar] [CrossRef] [PubMed]
- Iojă, I.-C.; Osaci-Costache, G.; Breuste, J.; Hossu, C.A.; Grădinaru, S.R.; Onose, D.A.; Niță, M.R.; Skokanová, H. Integrating urban blue and green areas based on historical evidence. Urban For. Urban Green. 2018, 34, 217–225. [Google Scholar] [CrossRef]
- Luo, S.; Xie, J.; Furuya, K. Assessing the Preference and Restorative Potential of Urban Park Blue Space. Land 2021, 10, 1233. [Google Scholar] [CrossRef]
- Chen, Y.; Ke, X.; Min, M.; Cheng, P. Disparity in Perceptions of Social Values for Ecosystem Services of Urban Green Space: A Case Study in the East Lake Scenic Area, Wuhan. Front. Public Health 2020, 8, 370. [Google Scholar] [CrossRef]
- Mertens, E.; Stiles, R.; Karadeniz, N. Green May Be Nice, but Infrastructure Is Necessary. Land 2022, 11, 89. [Google Scholar] [CrossRef]
- Shen, G.; Xu, B.; Jin, Y.; Chen, S.; Zhang, W.; Guo, J.; Liu, H.; Zhang, Y.; Yang, X. Monitoring wind farms occupying grasslands based on remote-sensing data from China’s GF-2 HD satellite—A case study of Jiuquan city, Gansu province, China. Resour. Conserv. Recycl. 2017, 121, 128–136. [Google Scholar] [CrossRef]
- Wu, Q.; Zhong, R.; Zhao, W.; Song, K.; Du, L. Land-cover classification using GF-2 images and airborne lidar data based on Random Forest. Int. J. Remote Sens. 2019, 40, 2410–2426. [Google Scholar] [CrossRef]
- Zhang, Y.; Zhan, Y.; Yu, T.; Ren, X. Urban green effects on land surface temperature caused by surface characteristics: A case study of summer Beijing metropolitan region. Infrared Phys. Technol. 2017, 86, 35–43. [Google Scholar] [CrossRef]
- Zuniga-Teran, A.A.; Stoker, P.; Gimblett, R.H.; Orr, B.J.; Marsh, S.E.; Guertin, D.P.; Chalfoun, N.V. Exploring the influence of neighborhood walkability on the frequency of use of greenspace. Landsc. Urban Plan. 2019, 190, 103609. [Google Scholar] [CrossRef]
- Sugiyama, T.; Leslie, E.; Giles-Corti, B.; Owen, N. Associations of neighbourhood greenness with physical and mental health: Do walking, social coherence and local social interaction explain the relationships? J. Epidemiol. Community Health 2008, 62, e9. [Google Scholar] [CrossRef] [Green Version]
- Jang, K.M.; Kim, J.; Lee, H.-Y.; Cho, H.; Kim, Y. Urban Green Accessibility Index: A Measure of Pedestrian-Centered Accessibility to Every Green Point in an Urban Area. ISPRS Int. J. Geo-Inf. 2020, 9, 586. [Google Scholar] [CrossRef]
- Wang, Y.; Sheng, S.; Xiao, H. The cooling effect of hybrid land-use patterns and their marginal effects at the neighborhood scale. Urban For. Urban Green. 2021, 59, 127015. [Google Scholar] [CrossRef]
- Ashawa, Y.; Peitong, Y. External Space Design; China Architecture & Building Press: Beijing, China, 1985; p. 111. [Google Scholar]
- Liu, F.; Wang, X.; Xu, J.; Gao, S. Sensitivity analysis of retrieving land surface emissivity based on NDVI threshold method. Remote Sens. Inf. 2012, 27, 3–12. [Google Scholar]
- Wu, Z.; Zhang, Y. Spatial Variation of Urban Thermal Environment and Its Relation to Green Space Patterns: Implication to Sustainable Landscape Planning. Sustainability 2018, 10, 2249. [Google Scholar] [CrossRef] [Green Version]
- Kuang, W. Mapping global impervious surface area and green space within urban environments. Sci. China Earth Sci. 2019, 62, 1591–1606. [Google Scholar] [CrossRef]
- Lu, D.; Hetrick, S.; Moran, E. Impervious surface mapping with Quickbird imagery. Int. J. Remote Sens. 2011, 32, 2519–2533. [Google Scholar] [CrossRef] [Green Version]
- Yin, P. Comparison of greenness measures in assessing the association between urban residential greenness and birth weight. Urban For. Urban Green. 2019, 46, 126519. [Google Scholar] [CrossRef]
- Lee, C.; Kim, K.; Lee, H. GIS based optimal impervious surface map generation using various spatial data for urban nonpoint source management. J. Environ. Manag. 2018, 206, 587–601. [Google Scholar] [CrossRef] [PubMed]
- Li, X.; Li, W.; Meng, Q.; Zhang, C.; Jancso, T.; Wu, K. Modelling building proximity to greenery in a three-dimensional perspective using multi-source remotely sensed data. J. Spat. Sci. 2016, 61, 389–403. [Google Scholar] [CrossRef]
- Li, Z.; Fan, Z.; Shen, S. Urban Green Space Suitability Evaluation Based on the AHP-CV Combined Weight Method: A Case Study of Fuping County, China. Sustainability 2018, 10, 2656. [Google Scholar] [CrossRef] [Green Version]
- Xu, Y.N.; Jia, D.P.; Wang, X. The Study of Green Space System Planning Based on AHP and GIS in Changzhou city, China. In Proceedings of the 2nd International Conference on Information and Computing Science, Manchester, UK, 21–22 May 2009. [Google Scholar]
- Geiss, C.; Klotz, M.; Schmitt, A.; Taubenbock, H. Object-Based Morphological Profiles for Classification of Remote Sensing Imagery. IEEE Trans. Geosci. Remote Sens. 2016, 54, 5952–5963. [Google Scholar] [CrossRef]
- Sun, Y.; Sun, Z.; Zhang, J.; Zhang, L.; Meng, Q. Assessing the impacts of grain sizes on landscape pattern of urban green space. In AOPC 2017: Optical Sensing and Imaging Technology and Applications; SPIE Press: Bellingham, WA, USA, 2017; Volume 10462, p. 104623J. [Google Scholar] [CrossRef]
- Shahtahmassebi, A.R.; Li, C.; Fan, Y.; Wu, Y.; Lin, Y.; Gan, M.; Wang, K.; Malik, A.; Blackburn, G.A. Remote sensing of urban green spaces: A review. Urban For. Urban Green. 2021, 57, 126946. [Google Scholar] [CrossRef]
- Vich, G.; Marquet, O.; Miralles-Guasch, C. Green exposure of walking routes and residential areas using smartphone tracking data and GIS in a Mediterranean city. Urban For. Urban Green. 2019, 40, 275–285. [Google Scholar] [CrossRef]
- Stessens, P.; Canters, F.; Huysmans, M.; Khan, A.Z. Urban green space qualities: An integrated approach towards GIS-based assessment reflecting user perception. Land Use Policy 2020, 91, 104319. [Google Scholar] [CrossRef]
- Zhu, Z.; Lang, W.; Tao, X.; Feng, J.; Liu, K. Exploring the Quality of Urban Green Spaces Based on Urban Neighborhood Green Index—A Case Study of Guangzhou City. Sustainability 2019, 11, 5507. [Google Scholar] [CrossRef] [Green Version]
- Xiao, Y.; Li, Z.; Webster, C. Estimating the mediating effect of privately-supplied green space on the relationship between urban public green space and property value: Evidence from Shanghai, China. Land Use Policy 2016, 54, 439–447. [Google Scholar] [CrossRef]
- Gupta, K.; Roy, A.; Luthra, K.; Maithani, S. Mahavir GIS based analysis for assessing the accessibility at hierarchical levels of urban green spaces. Urban For. Urban Green. 2016, 18, 198–211. [Google Scholar] [CrossRef]
- Tian, Y.; Jim, C.; Wang, H. Assessing the landscape and ecological quality of urban green spaces in a compact city. Landsc. Urban Plan. 2014, 121, 97–108. [Google Scholar] [CrossRef]
- Li, H.; Liu, Y. Neighborhood socioeconomic disadvantage and urban public green spaces availability: A localized modeling approach to inform land use policy. Land Use Policy 2016, 57, 470–478. [Google Scholar] [CrossRef]
- Tao, Y.; Yang, J.; Chai, Y. The Anatomy of Health-Supportive Neighborhoods: A Multilevel Analysis of Built Environment, Perceived Disorder, Social Interaction and Mental Health in Beijing. Int. J. Environ. Res. Public Health 2019, 17, 13. [Google Scholar] [CrossRef] [Green Version]
- Zhao, M.; Luo, D.; Hou, H.; Kang, Q. A study on vertical greening practice emphasizing ecological benefits in Xiamen City of China. Int. J. Sustain. Dev. World Ecol. 2015, 22, 368–374. [Google Scholar] [CrossRef]
- Pu, R.; Landry, S.; Yu, Q. Assessing the potential of multi-seasonal high resolution Pléiades satellite imagery for mapping urban tree species. Int. J. Appl. Earth Obs. Geoinf. 2018, 71, 144–158. [Google Scholar] [CrossRef]
- Sathyakumar, V.; Ramsankaran, R.; Bardhan, R. Geospatial approach for assessing spatiotemporal dynamics of urban green space distribution among neighbourhoods: A demonstration in Mumbai. Urban For. Urban Green. 2020, 48, 126585. [Google Scholar] [CrossRef]
- Oliveira, S.; Vaz, T.; Andrade, H. Perception of thermal comfort by users of urban green areas in Lisbon. Finisterra Rev. Port. De Geogr. 2015, 49, 113–131. [Google Scholar] [CrossRef] [Green Version]
- Aram, F.; Solgi, E.; Baghaee, S.; García, E.H.; Mosavi, A.; Band, S.S. How parks provide thermal comfort perception in the metropolitan cores; a case study in Madrid Mediterranean climatic zone. Clim. Risk Manag. 2020, 30, 100245. [Google Scholar] [CrossRef]
- Lopes, H.S.; Remoaldo, P.C.; Ribeiro, V.; Martín-Vide, J. Perceptions of human thermal comfort in an urban tourism destination—A case study of Porto (Portugal). Build. Environ. 2021, 205, 108246. [Google Scholar] [CrossRef]


Publisher’s Note: MDPI stays neutral with regard to jurisdictional claims in published maps and institutional affiliations. |
© 2022 by the authors. Licensee MDPI, Basel, Switzerland. This article is an open access article distributed under the terms and conditions of the Creative Commons Attribution (CC BY) license (https://creativecommons.org/licenses/by/4.0/).