
Environmental Zoning in a Context of Strong Pressure from Productivist Agriculture in Brazil’s Northeast: The Case of the Ipojuca River, Pernambuco, Brazil


Abstract
:1. Introduction
2. Materials and Methods
3. Results
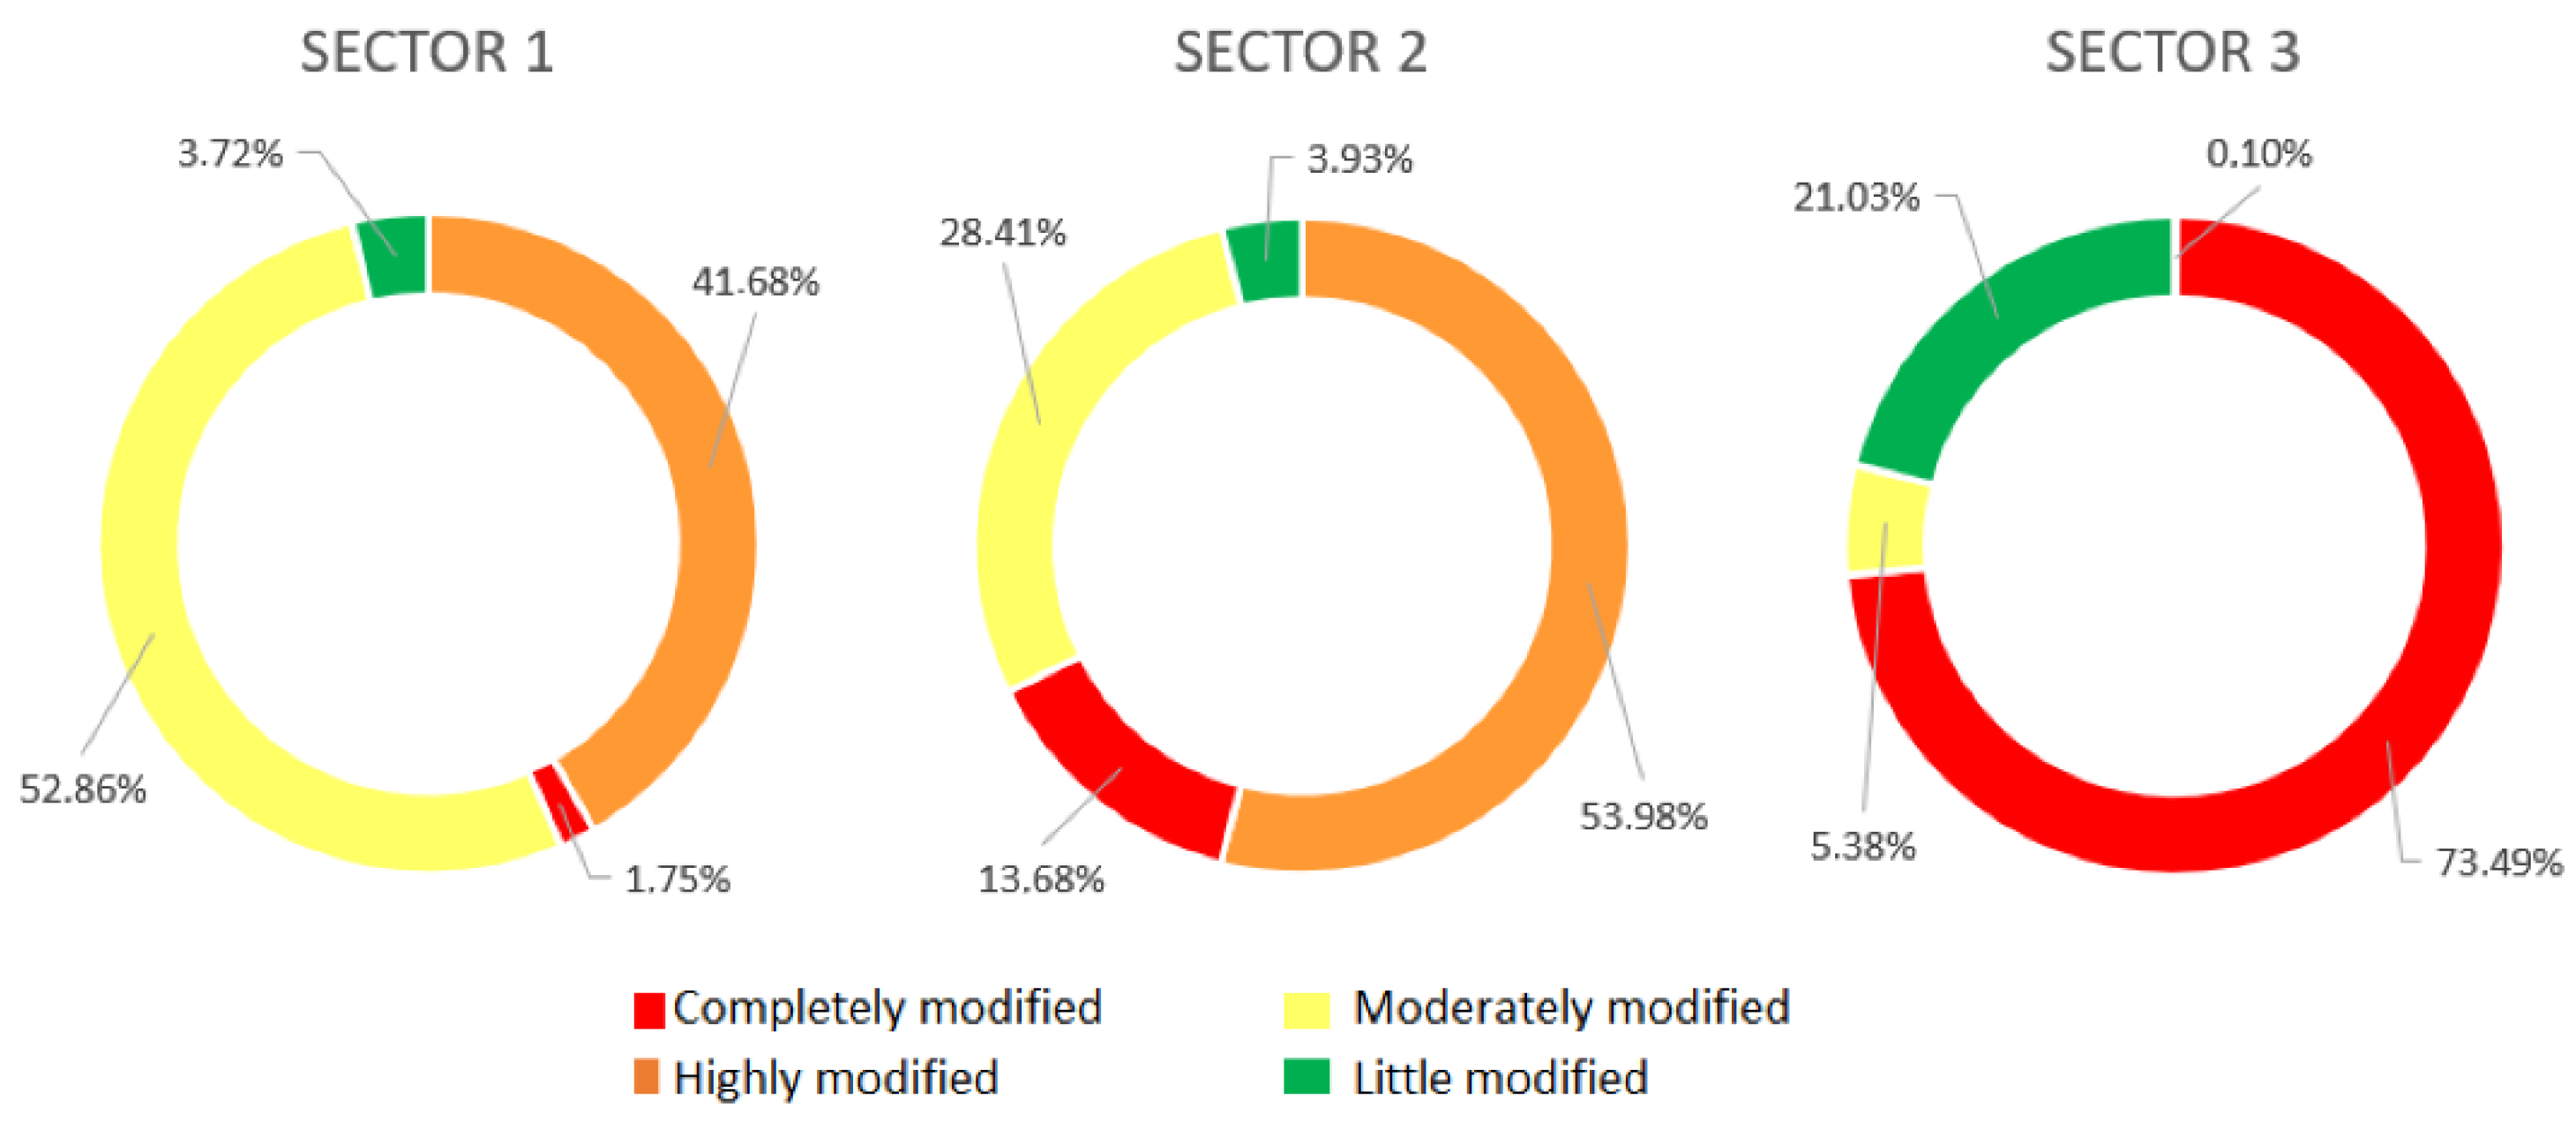
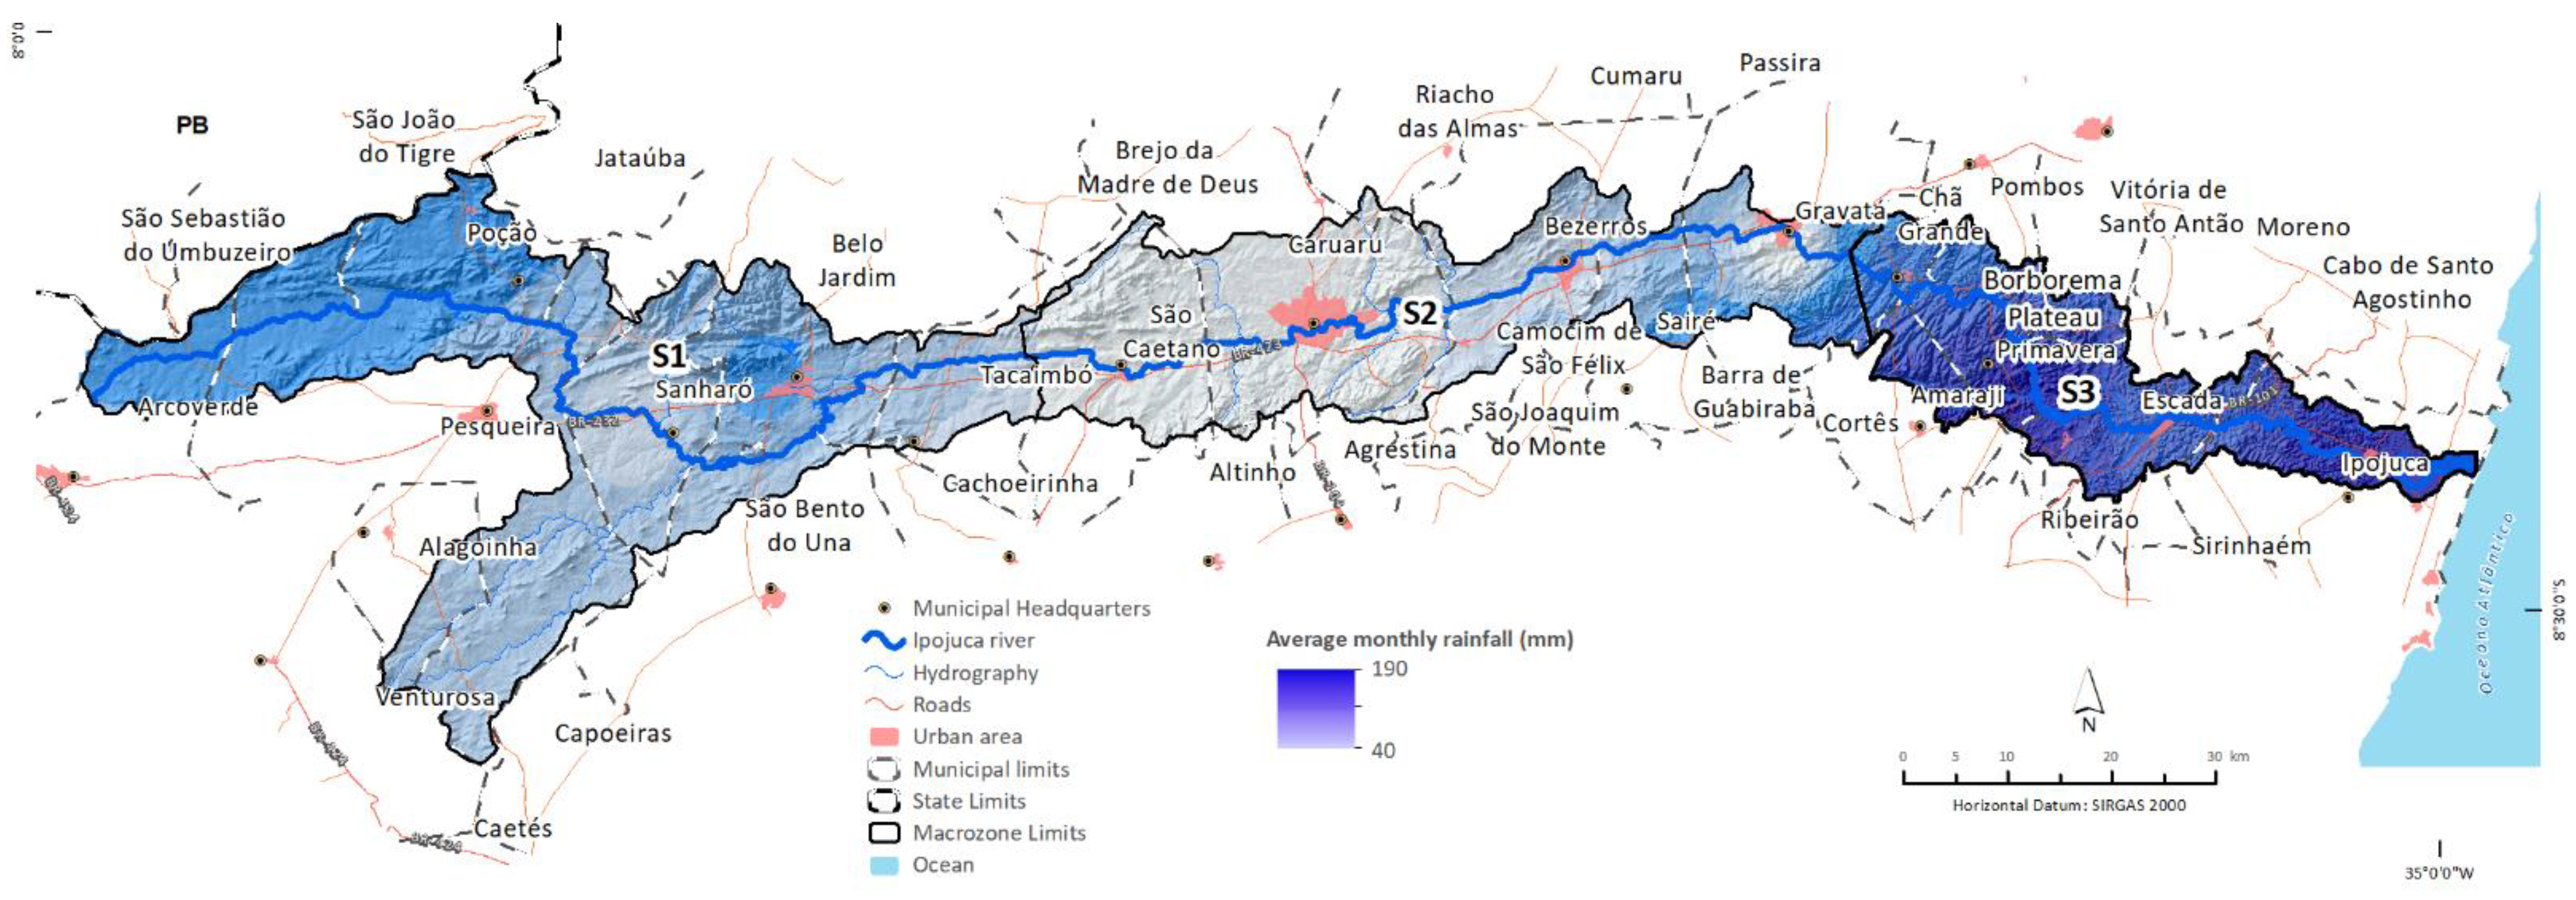
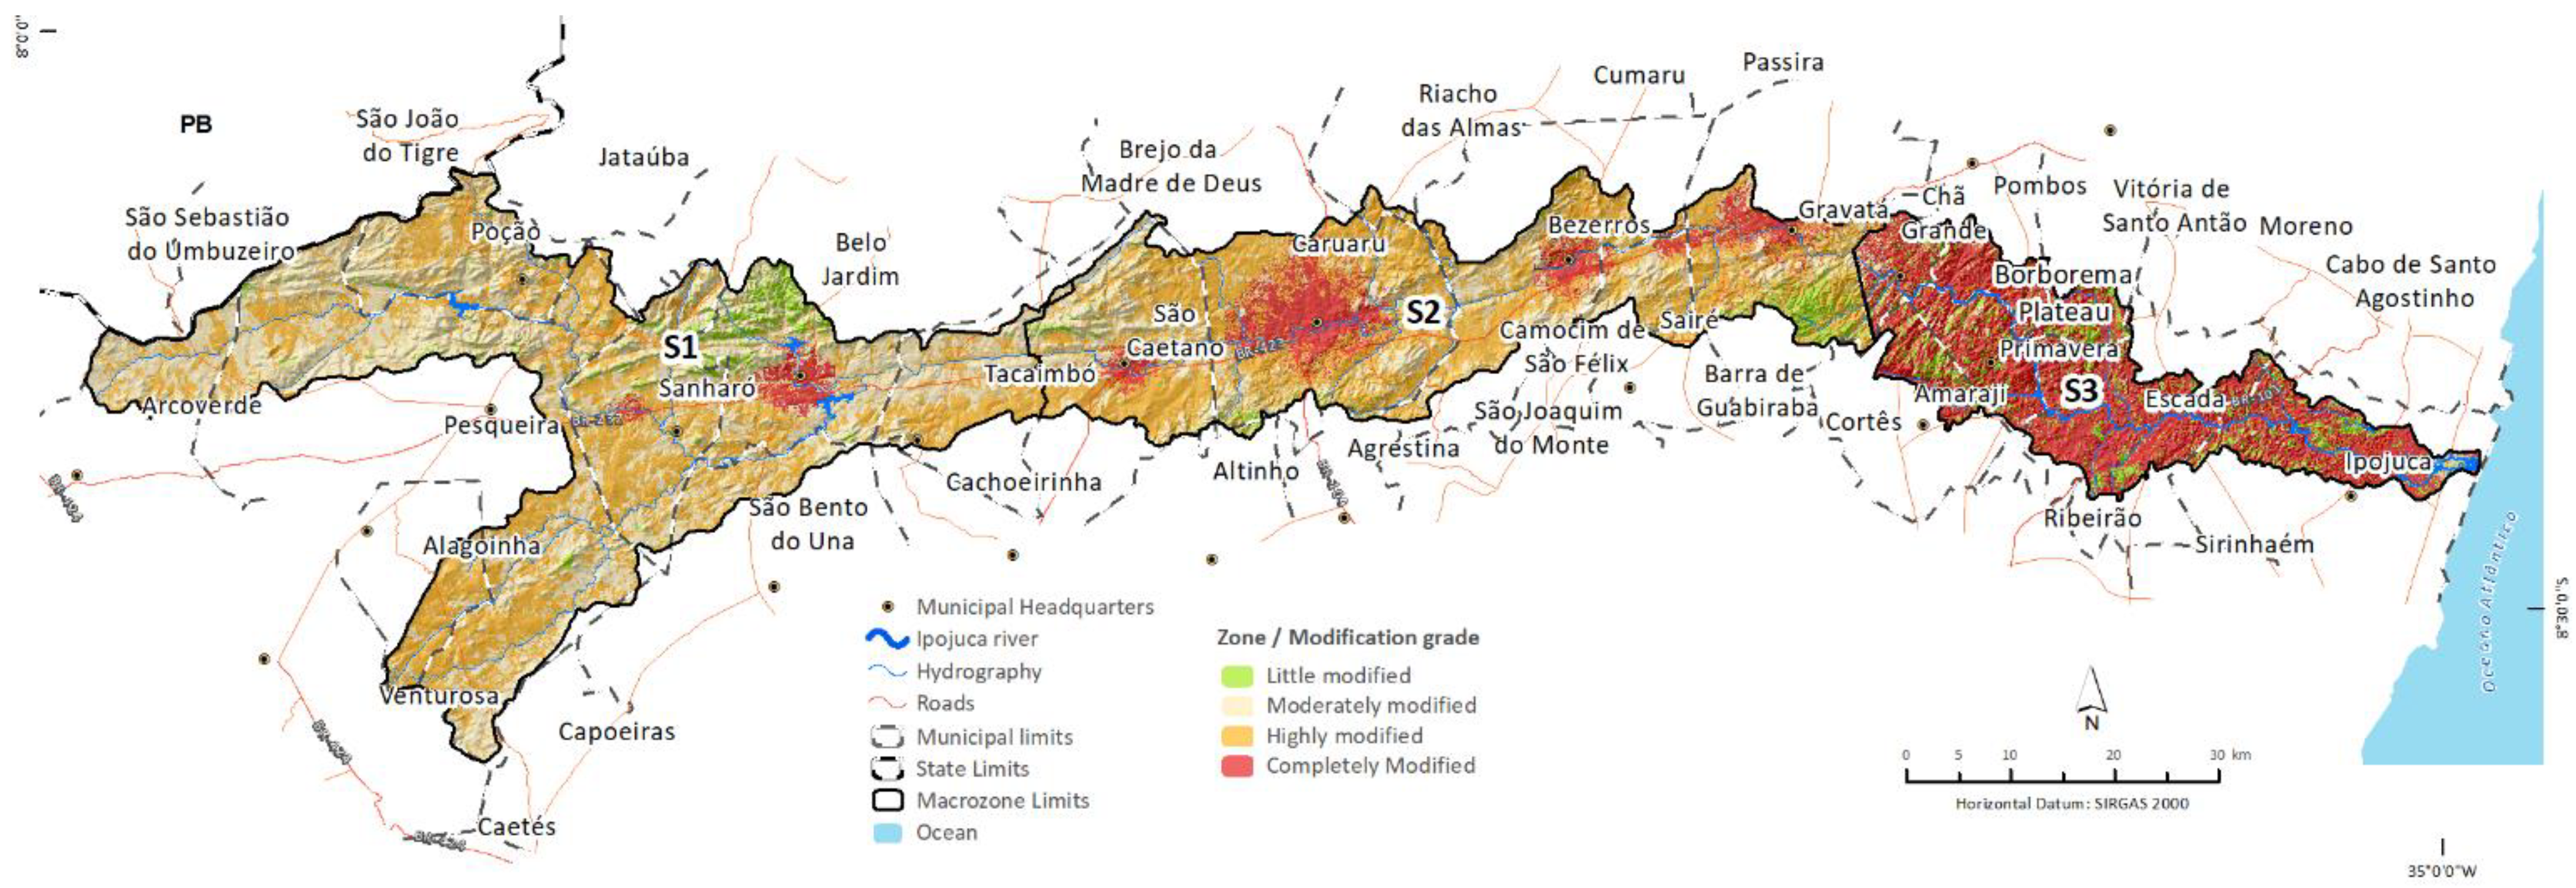
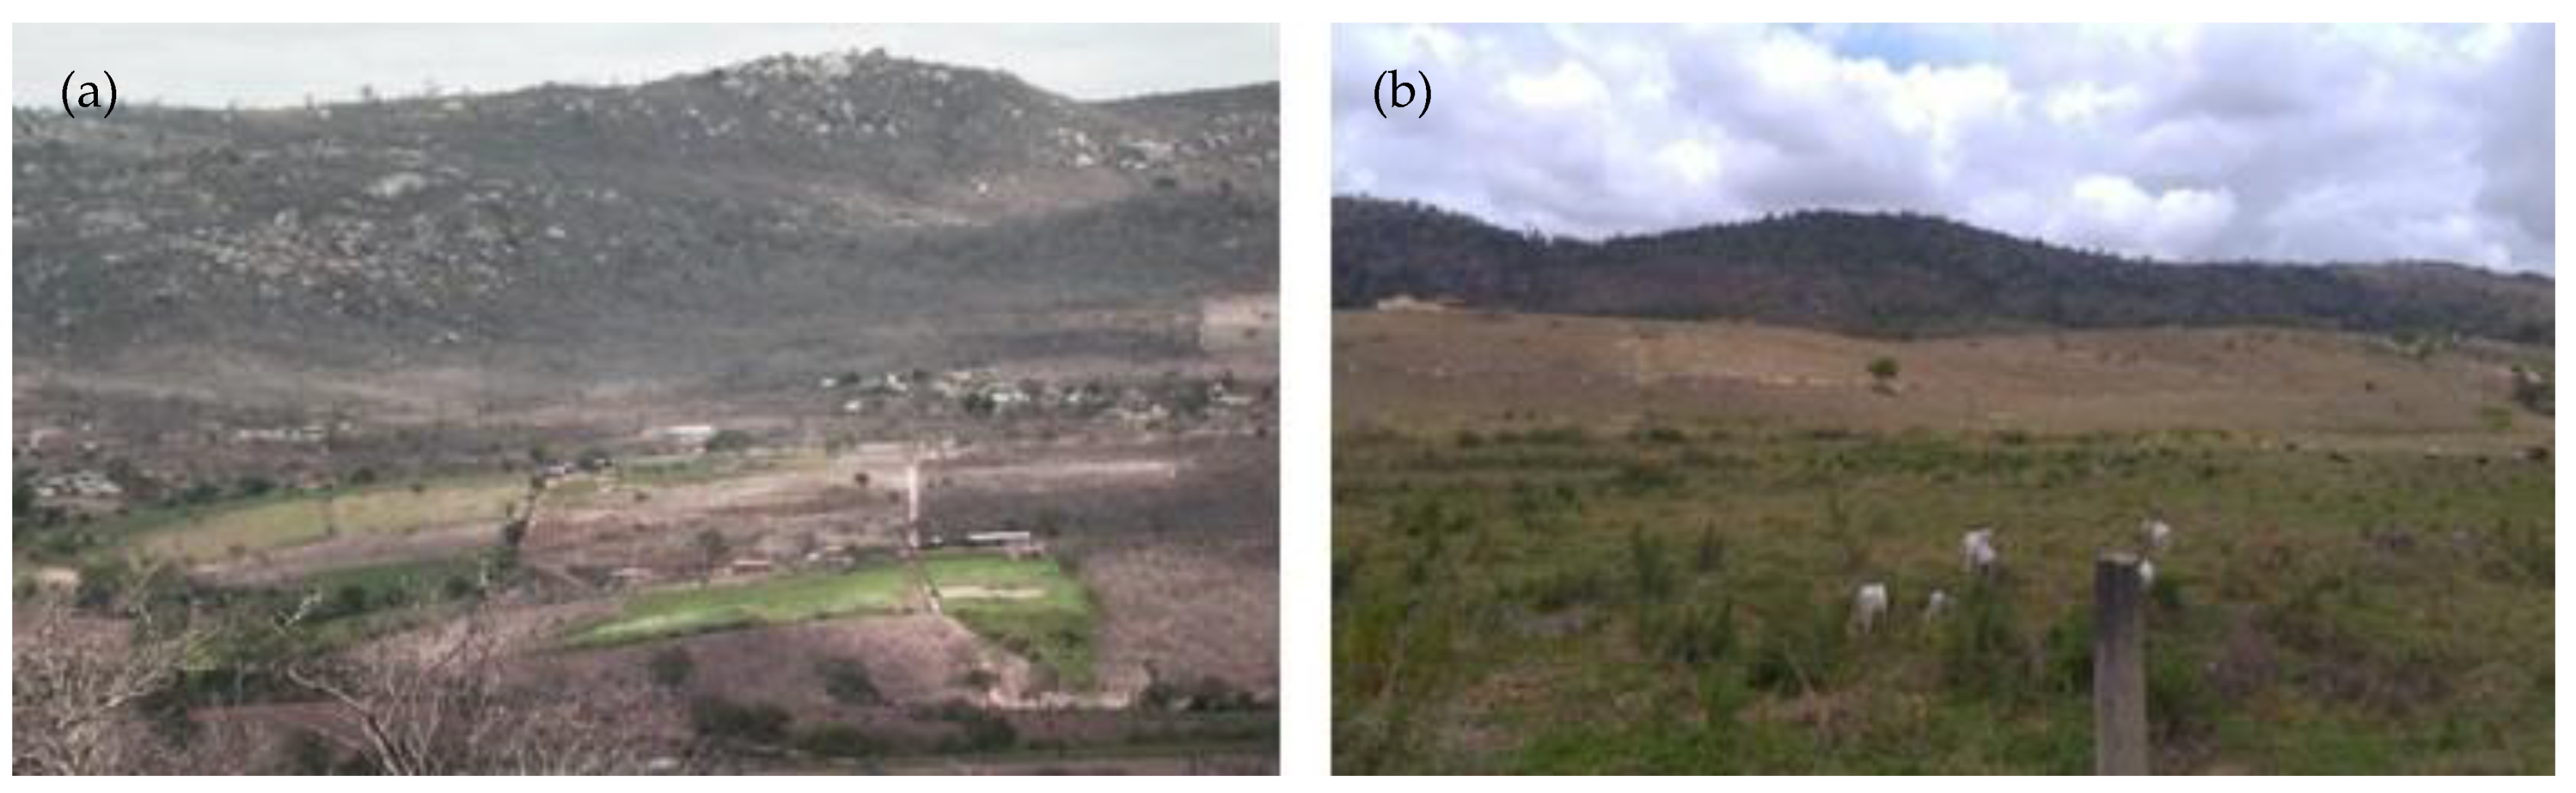
- S1—West sector of the watershed. Even under human pressure, the moderately changed environments are dominant (86,392.23 ha), as they still preserve a significant percentage of forest remnants, with the landscape being characterised by the predominance of fields (10,584.95 ha) and open forest (75,204.96 ha), resulting in partially preserved environments, as well as areas in different stages of the recovery process. In this sector, the main impacts on the Ipojuca River resulting from human activities are pastures and subsistence agriculture;
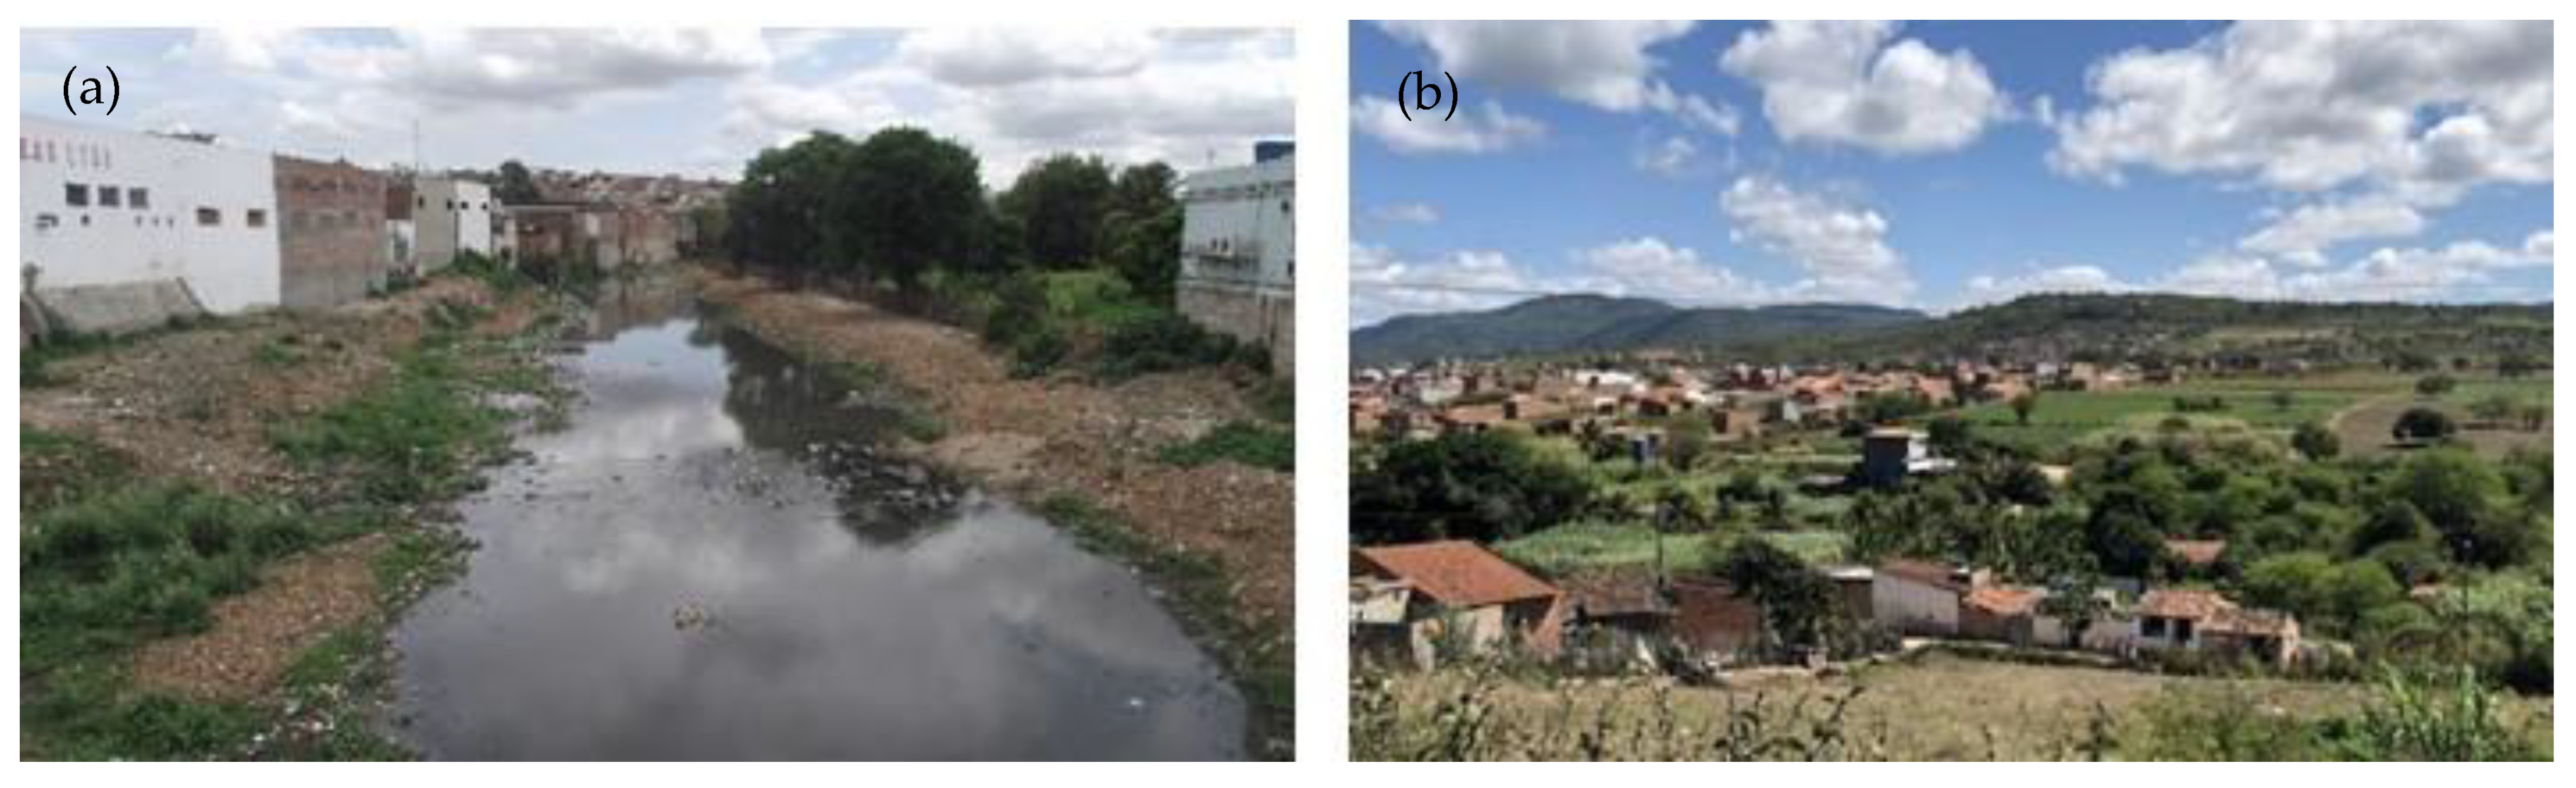
- S2—Located in the central portion of the watershed. It is the most urbanised sector, with the city of Caruaru being a key regional centre, the second most populated city in the State of Pernambuco, and the third most populated in the north-eastern interior. There is a large area dedicated to pastures (34,755.25 ha) and agriculture is carried out only along the main course of the Ipojuca. It is the sector of the watershed with the lowest rainfall;
- S3—East sector of the watershed, where the mouth of the Ipojuca is located. As it is the most humid sector, it has a predominance of agricultural activities, especially the cultivation of sugarcane, in addition to fruits and vegetables, to a lesser extent. In the estuary, there are well-preserved mangroves, classified as an Area of Permanent Preservation. Next to them is the Suape Port Industrial Complex, comprising more than 100 companies. It is the watershed sector with the highest percentage of slightly changed environments.
4. Discussion
5. Conclusions
Author Contributions
Funding
Data Availability Statement
Conflicts of Interest
References
- Hildén, M. The Role of Integrating Concepts in Watershed Rehabilitation. Ecosyst. Health 2000, 6, 39–50. [Google Scholar] [CrossRef]
- Silva, J.S. Desenvolvimento Territorial e Gestão de Bacia Hidrográfica: O Caso da Bacia do rio Jaboatão, Pernambuco. Master’s Dissertation, Postgraduate Programme in Geography, CFCH. Federal University of Pernambuco, Recife, Brazil, 2013. [Google Scholar]
- Condesso, F.R.C. O Ordenamento do Território; ISCSP: Lisboa, Portugal, 2004. [Google Scholar]
- Nunes, J. Geographic Space as a Set of Concrete Geographical Entities. In Cognitive and Linguistic Aspects of Geographic Space; NATO ASI Series (Series D: Behavioural and Social Sciences); Mark, D.M., Frank, A.U., Eds.; Springer: Dordrecht, The Netherlands, 1991; Volume 63. [Google Scholar] [CrossRef]
- Gülbahar, N.; Elhatip, H. Estimation of environmental impacts on the water quality of the Tahtalıdam watershed in İzmir, Turkey. Environ. Geol. 2005, 47, 725–728. [Google Scholar] [CrossRef]
- Desta, H.; Fetene, A. Land-use and land-cover change in Lake Ziway watershed of the Ethiopian Central Rift Valley Region and its environmental impacts. Land Use Policy 2020, 96, 104682. [Google Scholar] [CrossRef]
- Cunha, A.P.; Alvalá, R.C.; Oliveira, G.S. Impactos das mudanças de cobertura vegetal nos processos de superfície na região semiárida do Brasil. Rev. Bras. Meteorol. 2013, 28, 139–152. [Google Scholar] [CrossRef]
- Rossi, R. Desertification and Agriculture. EPRS—European Parliamentary Research Service, February 2020. Available online: https://www.europarl.europa.eu/RegData/etudes/BRIE/2020/646171/EPRS_BRI(2020)646171_EN.pdf (accessed on 21 November 2021).
- Myers, N. Environmental Degradation and Some Economic Consequences in the Philippines. Environ. Conserv. 1988, 15, 205–214. [Google Scholar] [CrossRef]
- Molle, F.; Wester, P.; Hirsch, P. River basin closure: Processes, implications and responses. Agric. Water Manag. 2010, 97, 569–577. [Google Scholar] [CrossRef]
- Pahl-Wostl, C. The Importance of Social Learning in Restoring the Multifunctionality of Rivers and Floodplains. Ecol. Soc. 2006, 14. Available online: http://www.ecologyandsociety.org/vol11/iss1/art10/ (accessed on 21 November 2021). [CrossRef]
- Hu, M.; Wang, Y.; Xia, B.; Jiao, M.; Huang, G. How to balance ecosystem services and economic benefits?—A case study in the Pearl River Delta, China. J. Environ. Manag. 2020, 271, 110917. [Google Scholar] [CrossRef] [PubMed]
- Ojeda, A.O. Guía Metodológica sobre Buenas Prácticas en Restauración Fluvial; Manual Para Gestores; University of Zaragoza: Zaragoza, Spain, 2015. [Google Scholar]
- Lüderitz, V.; Jüpner, R.; Müller, S.; Feld, C.K. Renaturalization of streams and rivers—The special importance of integrated ecological methods in measurement of success. An example from Saxony-Anhalt (Germany). Limnologica 2004, 34, 249–263. [Google Scholar] [CrossRef] [Green Version]
- Paweł, Ł.; Małgorzata, W.; Ewa, J.; Małgorzata, D. Application of the Unified Stream Assessment Method to Determine the Direction of Revitalization of Heavily Transformed Urban Rivers. Water Resour. 2020, 47, 521–529. [Google Scholar] [CrossRef]
- Oliveira, A.G. Mapeamento e Avaliação da Fragilidade Ambiental em Bacias Hidrográficas Utilizando Álgebras de Mapas com Vistas à Gestão do Território. Ph.D. Thesis, International PhD School (EDIUS), University of Santiago de Compostela, Santiago de Compostela, Spain, 2021. [Google Scholar]
- Alho, C.J.R.; Lacher, T.E.; Gonçalves, H.C. Environmental Degradation in the Pantanal Ecosystem. BioScience 1988, 38, 164–171. [Google Scholar] [CrossRef]
- Warner, R.F. Impacts of environmental degradation on rivers, with some examples from the Hawkesbury-Nepean system. Aust. Geogr. 1991, 22, 1–13. [Google Scholar] [CrossRef]
- Machado, R.A.S.; Lima, E.C.; Oliveira, A.G. Evolução da cobertura e uso do solo na Zona de Amortecimento da Estação Ecológica Raso da Catarina entre 1985 e 2015 e sua relação com o processo de desertificação. Braz. Appl. Sci. Rev. 2020, 4, 3107–3122. [Google Scholar] [CrossRef]
- Filho, H.M.; Moraes, C.; Bennati, P.; Rodrigues, R.A.; Guilles, M.; Rocha, P.; Lima, A.; Vasconcelos, I. Mudança do Clima e os Impactos na Agricultura Familiar no Norte e Nordeste do Brasil; International Policy Centre for Inclusive Growth (IPC-IG), United Nations Development Programme: Brasilia, Brazil, 2016. [Google Scholar]
- Melo, M.L. Paisagens do Nordeste em Pernambuco e Paraíba, 2nd ed.; Revista CEPE.: Recife, Brazil, 2012. [Google Scholar]
- Santana, N.S. Análise da vulnerabilidade ambiental de Salvador: Um subsídio ao planejamento e à gestão territorial da cidade. Ph.D. Thesis, UFBA Geosciences Institute, Salvador, Brazil, 2014. [Google Scholar]
- Antunes, P.B. Direito Ambiental. 12ª. ed Amplamente Reformulada; Editora Lumen Júris: Rio de Janeiro, Brazil, 2009. [Google Scholar]
- Ferreira, F.W. Planejamento sim e não (um Modo de Agir num Mundo em Permanente Mudança), 4th ed.; Paz e Terra: Rio de Janeiro, Brazil, 1983; 157p. [Google Scholar]
- Conyers, D.; Hills, P. An Introduction to Development Planning in the Third World; Public Administration in Developing Countries; John Wiley & Sons: Hoboken, NJ, USA, 1984; 271p. [Google Scholar]
- Santos, R.F. Planejamento Ambiental: Teoria e Prática; Oficina de Textos: São Paulo, Brazil, 2004. [Google Scholar]
- Ab’Saber, A.N. Zoneamento Ecológico da Amazônia: Questões de Escala em Método; Institute for Applied Economic Research; CEPAL/IPEA: Brasília, Brazil, 1987.
- Decrees the Water Code. Brazil. Decree No. 24,643, of 10 July 1934, 1934.
- Sets out the National Environmental Policy, its objectives and mechanisms of formulation and application, and other provisions. Brazil. Law No. 6,938, of 31 August 1981, 1981.
- Institutes the National Water Resources Policy, creates the National Water Resources Management System, regulates section XIX of Art. 21 of the Federal Constitution, and amends Art. 1 of Law No. 8,001, of 13 March 1990, which amended Law No. 7,990, of 28 December 1989. Brazil. Law No. 9,433, of 8 January 1997, 1997.
- Motta, P.R. O estado da arte da gestão pública. Pensata. Rev. Adm. Empres. 2013, 53, 82–90. [Google Scholar] [CrossRef] [Green Version]
- Newson, M. Land, Water and Development. In Sustainable and Adaptive Management of Rivers; Routledge: London, UK, 2008. [Google Scholar]
- Everard, M.; Moggridge, H.L. Rediscovering the value of urban rivers. Urban Ecosyst. 2012, 15, 293–314. [Google Scholar] [CrossRef]
- Wlodarczyk, A.M.; Mascarenhas, J.M.R.D. Nature in cities. Renaturalization of riverbanks in urban areas. Open Eng. 2016, 6, 2016. [Google Scholar] [CrossRef] [Green Version]
- Grilo, D.C.; Franca-Rocha, W.J.S.; Vale, R.M.C. Caracterização Geoambiental associada a processos de desertificação no município de Jeremoabo/Bahia. In Proceedings of the Annals of the 14th Brazilian Symposium on Remote Sensing, Natal, Brazil, 25–30 April 2009; INPE: São José dos Campos, Brazil, 2009; pp. 5243–5249. [Google Scholar]
- Sampaio, E.V.S.B.; Araújo, M.; Dos, S.; Sampaio, Y.S.B. Impactos ambientais da agricultura no processo de desertificação no nordeste do Brasil. Rev. Geogr. 2005, 22, 90–112. [Google Scholar]
- Wüst, C.; Tagliani, N.; Concato, A.C. A pecuária e sua influência impactante ao meio ambiente. In Proceedings of the 6th Brazilian Congress on Environmental Management, Porto Alegre, Brazil, 23–26 November 2015. [Google Scholar]
- De Souza, R.B. Sensoriamento Remoto: Conceitos Fundamentais e Plataformas; IV CEOS WGEduWorkshop: Santa Maria-RS, Brazil, 2010. [Google Scholar]
- Bilotta, G.S.; Brazier, R.E.; Haygarth, P.M. The impacts of grazing animals on the quality of soils, vegetation, and surface waters in intensively managed grasslands. Adv. Agron. 2007, 94, 237–280. [Google Scholar]
- Shukla, P.R.; Skeg, J.; Buendia, E.C.; Masson-Delmotte, V.; Pörtner, H.O.; Roberts, D.C.; Zhai, P.; Slade, R.; Connors, S.; van Diemen, S.; et al. Desertification. In Climate Change and Land: An IPCC Special Report on Climate Change, Desertification, Land Degradation, Sustainable Land Management, Food Security, and Greenhouse Gas Fluxes in Terrestrial Ecosystems; IPCC: Geneva, Switzerland, 2019. [Google Scholar]
- Albiero, D.; Cajado, D.M.; Fernandes, I.L.; Monteiro, L.A.; Esmeraldo, G.G. Tecnologias Agroecológicas para o Semiárido; Edição do Autor: Fortaleza, Brazil, 2015; 216p. [Google Scholar]
- Almeida, A.S.; Santos, R.L.; Chaves, J.M. Mapeamento de Uso e Ocupação do Solo no Município de Jeremoabo-Ba: Uso do Algoritmo Máxima Verossimilhança (Maxver). In Proceedings of the Annals of the 15th Brazilian Symposium on Remote Sensing—SBSR, Curitiba, Brazil, 30 April–5 May 2011; INPE: São José dos Campos, Brazil, 2011; p. 7255. [Google Scholar]
- Rigotti, J.A.; Rodrigues, L.H.R.; Pompêo, C.A.; Pasqualini, J.P. Revitalização de rios: Perspectivas sobre restauração ecológica e desenvolvimento urbano. In Proceedings of the Florianópolis: 22nd Brazilian Symposium on Water Resources, Florianopolis, Brazil, 22–24 September 2017. [Google Scholar]
- Meyer, J.L. Stream health: Incorporating the human dimension to advance stream ecology. J. N. Am. Benthol. Soc. 1997, 16, 439–447. [Google Scholar] [CrossRef] [Green Version]
- Dzurik, A.A. Water Resources Planning; Rowman & Littlefield Publishing Group: Lanham, MD, USA, 2003. [Google Scholar]
- Randolph, J. Environmental Land Use Planning and Management; Island Press: Washington, DC, USA, 2004. [Google Scholar]
- Carneiro, P.R.F. Controle de inundações em bacias metropolitanas, considerando a integração do planejamento do uso do solo à gestão dos recursos hídricos. Estudo de caso: Bacia dos rios Iguaçu/Sarapuí na região metropolitana do Rio de Janeiro. Ph.D. Thesis, Federal University of Rio de Janeiro, Rio de Janeiro, Brazil, 2008. [Google Scholar]


| Sensor | Band Number | Band Name | Wavelength (μm) | Resolution (m) | Band Applications |
|---|---|---|---|---|---|
| TM | 1 | Visible Blue | 0.45–0.52 | 30 | Bathymetric mapping, distinguishing soil from vegetation, and deciduous from coniferous vegetation |
| TM | 2 | Visible Green | 0.52–0.60 | 30 | Emphasises peak vegetation, which is useful for assessing plant vigor |
| TM | 3 | VisibleRed | 0.63–0.69 | 30 | Discriminates vegetation slopes |
| TM | 4 | NIR | 0.76–0.90 | 30 | Emphasises biomass content and shore lines |
| TM | 5 | SWIR 1 | 1.55–1.75 | 30 | Discriminates moisture content of soil and vegetation; penetrates thin clouds |
| TM | 6 | Thermal | 10.40–12.50 | 120 | Thermal mapping and estimated soil moisture |
| TM | 7 | SWIR 2 | 2.08–2.35 | 30 | Hydrothermally altered rocks associated with mineral deposits |
| Zone/Degree of Change | Predominant Pattern of Land Cover and Use | Characteristics |
|---|---|---|
| Completely changed | Urban infrastructure/Sugarcane agroindustry | The criteria established for the definition of zones —classified as completely changed— were those where the areas suffered environmental effects over time: considered to be negative or adverse. These resulted mainly from human activities or interventions such as the intense urbanisation process and, as interventions in areas of native vegetation —partially or totally extinct— to give way to intensive agriculture, as is the case of the sugarcane agroindustry in Sector 3. The main effects resulting from these processes were: changes in topography, triggering of erosive processes, river channelization, water pollution and soil sealing. |
| Greatly changed | Agriculture/pasture and pasture | Greatly changed zones are areas that have undergone major processes of change over the years, where today only a small part of the natural landscape is preserved. In these areas, the predominance of farming can be seen as a determining activity for the formation of the local landscape. |
| Moderately changed | Grassland vegetation (fields)/Open forest/Mangrove | Moderately changed zones are those that, even under human pressure, retain a significant part of their original characteristics, resulting in partially preserved environments, as well as areas in different stages of the recovery process. |
| Slightly changed | Dense forest | Slightly changed zones are areas whose conservation of their original characteristics is predominant, or they are fully preserved zones, including areas protected by the environmental legislation in force. |
| Propositional Zoning | Criteria |
|---|---|
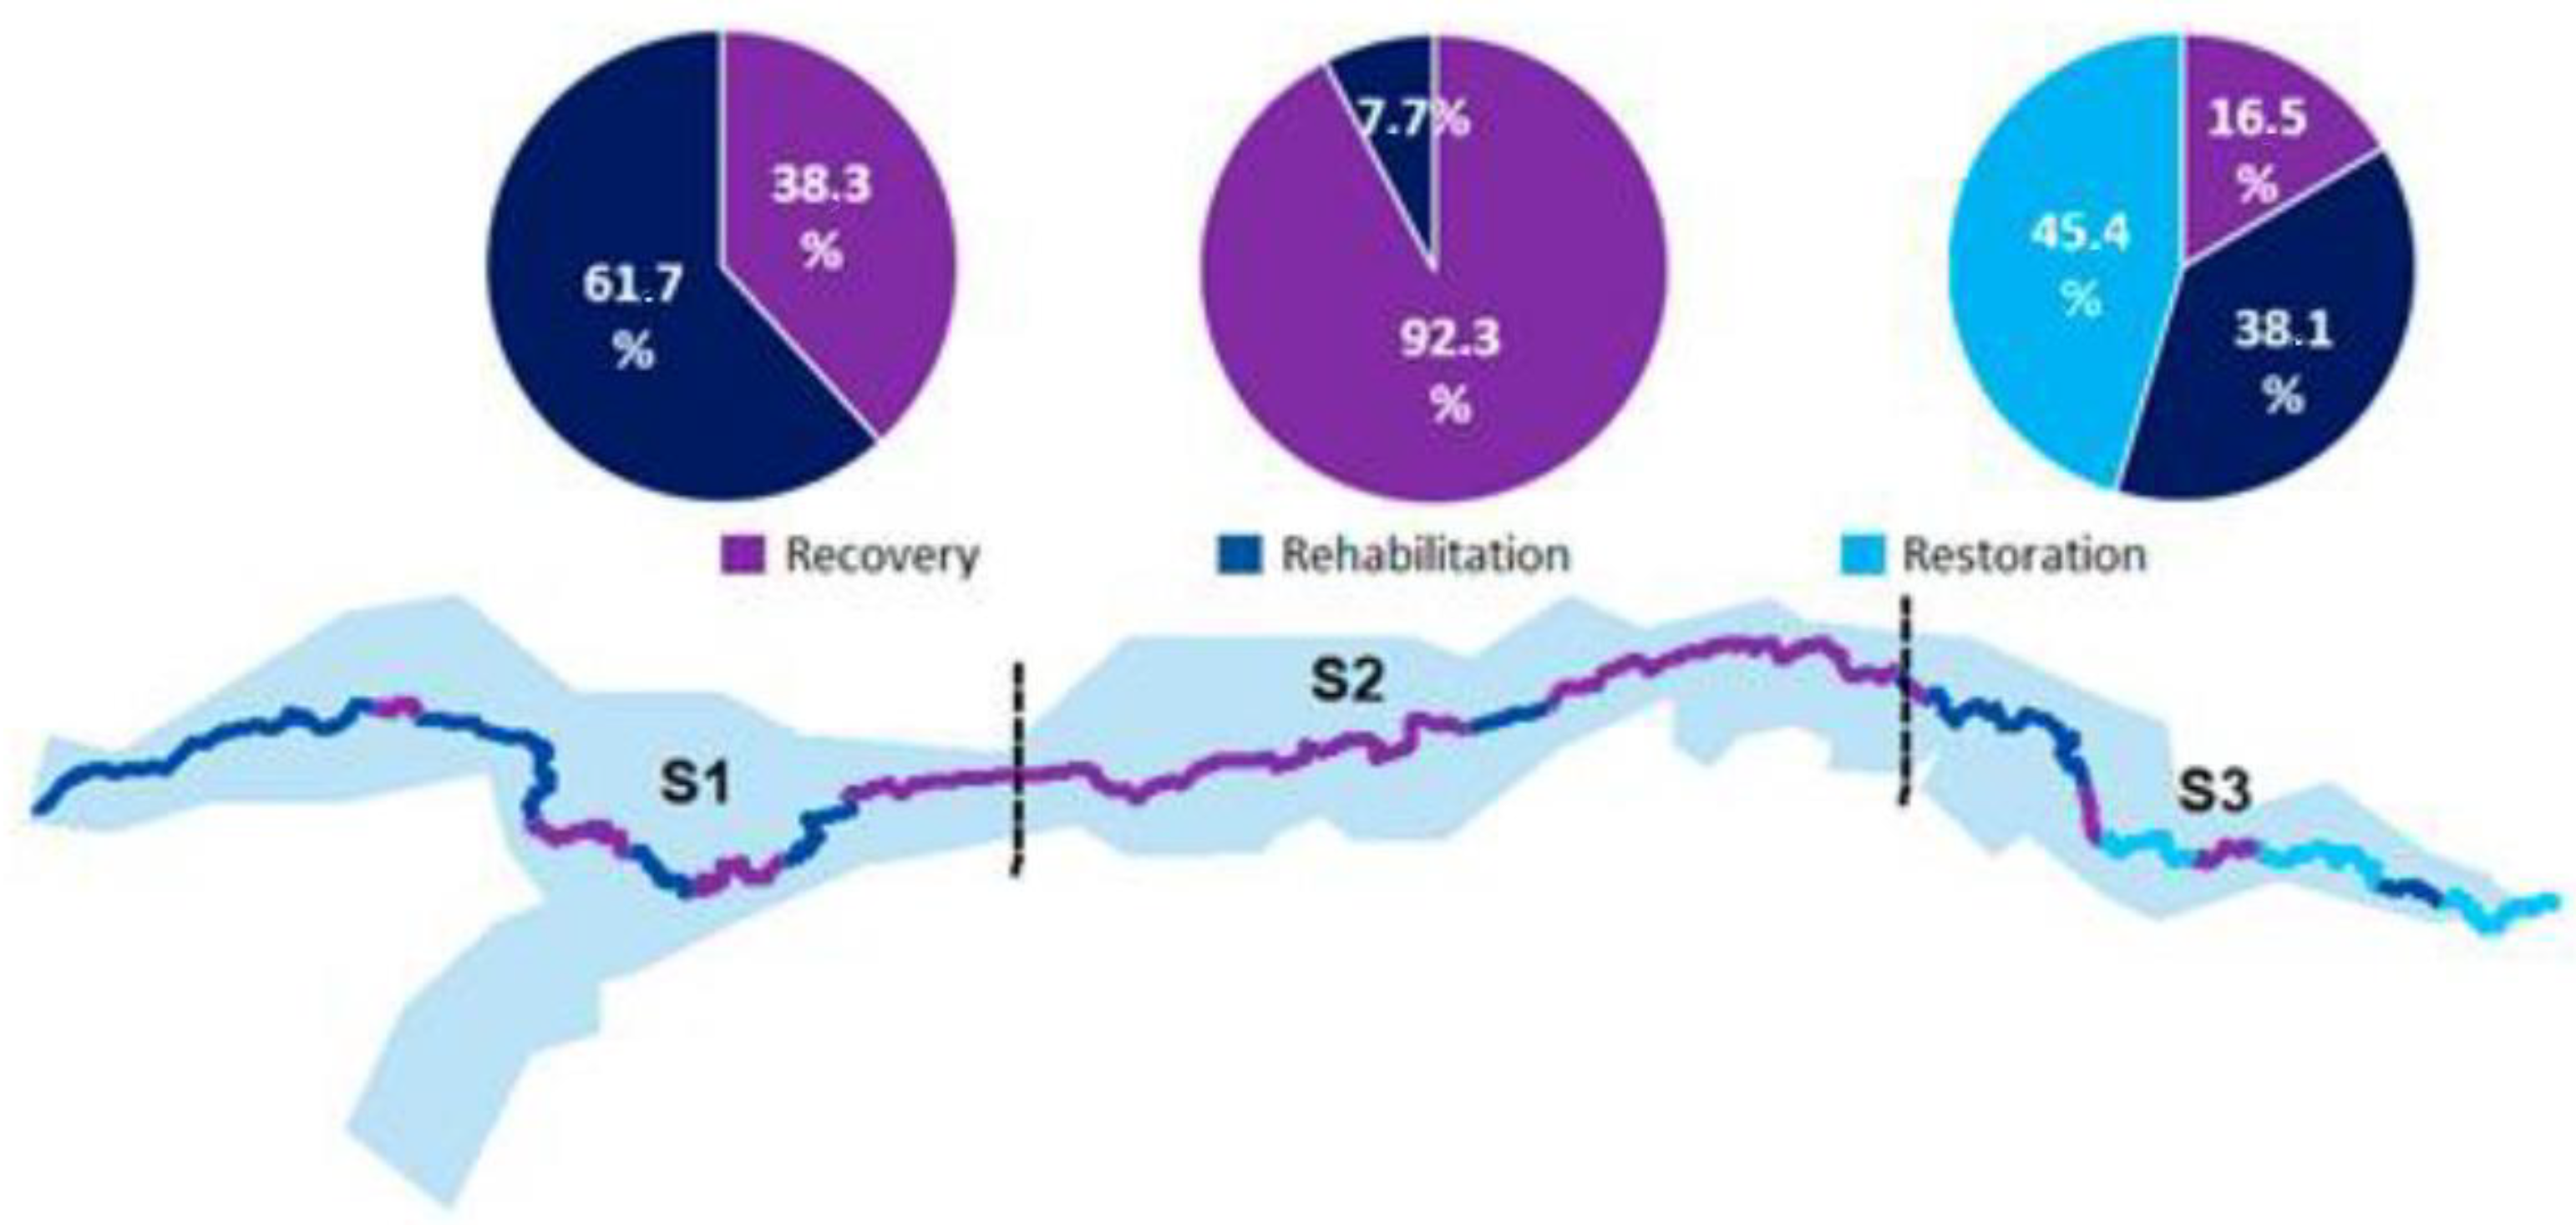
| Recovery Zone—Z1 | Return of the degraded site to a form of use, in accordance with the pre-established plan for the land use, aiming to obtain a stability of the environment and improvement in the environmental conditions.This zone includes urban and industrial areas where the natural environment has been definitively modified. |
| Rehabilitation Zone—Z2 | Return of the degraded area to an appropriate biological state. This return does not necessarily mean that the area can have a productive use in the long term, but it can be used for alternative activities suitable for human use, such as aesthetic and ecological enhancement, and for recreational purposes.These are places with profound changes in the configuration of the relief and in the characteristics of the vegetation, due to agriculture, livestock, and erosion processes. |
| Restoration Zone—Z3 | Refers to the return of the river to its original state (or as close to it as possible), asit was before being altered by human intervention. Aspects related to topography, vegetation, fauna, soil, hydrology, etc., must be conducted to present the characteristics prior to degradation.These correspond to the stretches where the riparian forest and relief are well preserved. |
| Classes | Use Classes | |||||||
|---|---|---|---|---|---|---|---|---|
| 2000 | 2005 | 2010 | 2015 | |||||
| Area (ha) | % in the Watershed | Area (ha) | % in the Watershed | Area (ha) | % in the Watershed | Area (ha) | % in the Watershed | |
| Agriculture/pasture | 112,569.55 | 32.74 | 109,040.07 | 31.71 | 120,686.18 | 35.10 | 99,554.94 | 28.95 |
| Pasture | 61,836.08 | 17.98 | 72,705.50 | 21.14 | 51,193.87 | 14.89 | 78,092.07 | 22.71 |
| Grassland vegetation (fields) | 8362.65 | 2.43 | 7570.32 | 2.20 | 3982.89 | 1.16 | 12,993.92 | 3.78 |
| Open forest | 127,023.35 | 36.94 | 126,573.45 | 36.81 | 126,364.53 | 36.75 | 108,428.92 | 31.53 |
| Dense forest | 28,634.78 | 8.33 | 19,954.58 | 5.80 | 28,918.60 | 8.41 | 24,107.51 | 7.01 |
| Urban infrastructure | 4612.27 | 1.34 | 6543.70 | 1.90 | 11,067.53 | 3.22 | 19,540.00 | 5.68 |
| Mangrove | 535.56 | 0.16 | 539.38 | 0.16 | 545.78 | 0.16 | 516.38 | 0.15 |
| Water bodies | 302.44 | 0.09 | 934.31 | 0.27 | 1112.67 | 0.32 | 634.84 | 0.18 |
| Beaches and dunes | 3.64 | 0.00 | 18.92 | 0.01 | 8.17 | 0.00 | 11.63 | 0.00 |
| Total | 343,880.22 | 100.00 | 343,880.22 | 100.00 | 343,880.22 | 100.00 | 343,880.22 | 100.00 |
| Sectors | Use Class | Area (ha) | Sector | Degree of Change | Area (ha) |
|---|---|---|---|---|---|
| S1 | Agriculture or Pasture | 24,941.81 | S1 | Greatly Changed | 68,120.02 |
| S1 | Water Bodies | 302.31 | S1 | Completely Changed | 2860.00 |
| S1 | Open Forest | 75,204.96 | S1 | Moderately Changed | 86,392.23 |
| S1 | Dense Forest | 6078.49 | S1 | Slightly Changed | 6078.49 |
| S1 | Urban Infrastructure | 2860.00 | Subtotal—Sector 1 | 163,450.73 | |
| S1 | Pasture | 43,478.21 | |||
| S1 | Grassland Vegetation (Fields) | 10,584.95 | S2 | Greatly Changed | 61,812.03 |
| Subtotal—Sector 1 | 163,450.73 | S2 | Completely Changed | 15,667.06 | |
| S2 | Moderately Changed | 32,526.70 | |||
| S2 | Agriculture or Pasture | 27,110.29 | S2 | Slightly Changed | 4496.36 |
| S2 | Water Bodies | 90.34 | Subtotal—Sector 2 | 114,502.14 | |
| S2 | Open Forest | 30,073.57 | |||
| S2 | Dense Forest | 4124.47 | S3 | Greatly Changed | 68.26 |
| S2 | Urban Infrastructure | 15,985.44 | S3 | Completely Changed | 48,448.94 |
| S2 | Pasture | 34,755.25 | S3 | Moderately Changed | 3545.80 |
| S2 | Grassland Vegetation (Fields) | 2362.79 | S3 | Slightly Changed | 13,864.34 |
| Subtotal—Sector 2 | 114,502.14 | Subtotal—Sector 3 | 65,927.34 | ||
| Watershed Total | 343,880.22 | ||||
| S3 | Agriculture or Pasture | 47,389.05 | |||
| S3 | Water Bodies | 241.71 | |||
| S3 | Open Forest | 2772.00 | |||
| S3 | Dense Forest | 13,864.34 | |||
| S3 | Urban Infrastructure | 1059.95 | |||
| S3 | Mangrove | 515.11 | |||
| S3 | Pasture | 68.20 | |||
| S3 | Beaches and dunes | 11.57 | |||
| S3 | Grassland Vegetation (Fields) | 5.41 | |||
| Subtotal—Sector 3 | 65,927.34 | ||||
| Watershed Total | 343,880.22 | ||||
| Arrangement | Actions/Activities to Be Carried Out | Sector 1 | Sector 2 | Sector 3 | ||||
|---|---|---|---|---|---|---|---|---|
| Z1 | Z2 | Z1 | Z2 | Z1 | Z2 | Z3 | ||
| Urban areas | Encouraging the municipalities bordering the Ipojuca River to prepare their Municipal Basic Sanitation Plan—PMSB, in order to implement actions provided for in the legal framework (No. 11,445/2007 and No. 12,305/2010). | |||||||
| Preparing or updating the Urban Development Master Plans —PDDU containing effective proposals for technical regulation of the land cover and use in order to contain the horizontal urban sprawl, avoiding the aggravation of problems related to the removal of vegetation cover and new pressures on the water system. | ||||||||
| Recomposing the banks of the rivers that surround urban areas, with the implementation of green infrastructure. | ||||||||
| Water bodies | Strengthening the BHRI’s Steering Committee. | |||||||
| Identifying and eliminating the diffuse sources of pollution in the Ipojuca River based on the PMSB. | ||||||||
| Improving/maintaining and inspecting the legal framework for water distribution, aiming to ensure the quantitative and qualitative control of water resources, in order to avoid the occurrence of irregular water abstraction for agricultural supply purposes. | ||||||||
| Developing a river dredging plan around urban areas to remove solid waste irregularly discarded by the population, in order to restore the riverbed in these areas. | ||||||||
| Approving and monitoring the preparation of the Watershed’s Water Resources Plan, which gathers strategic information for water management. | ||||||||
| Implementing a water quality monitoring system. | ||||||||
| Arbitrating conflicts over water use. | ||||||||
| Agriculture and livestock | Strengthening the activities carried out by family agriculture. | |||||||
| Improving the credit access system for rural producers. | ||||||||
| Encouraging non-agricultural activities in rural areas. | ||||||||
| Encouraging activities with greater added value. | ||||||||
| Support for structuring local production chains. | ||||||||
| Providing technical assistance and training for rural producers. | ||||||||
| Encouraging the use of technology to cope with drought. | ||||||||
| Encouraging agroecological production with the aim of incorporating social, political, cultural, energy, environmental and ethical issues. | ||||||||
| Promoting and encouraging the development of social technologies. | ||||||||
| Developing/implementing erosive process control programmes. | ||||||||
| Licensing and inspecting the establishment of large agro-industrial enterprises. | ||||||||
| Remnants of vegetation cover | Implementing policies for the management and conservation of vegetation cover. | |||||||
| Creating protected natural areas with the aim of preserving the existing vegetation cover and natural resources. | ||||||||
| Encouraging recovery, rehabilitation and restoration actions of degraded areas, prioritising the practice of reforestation. | ||||||||
| Encouraging the restoration of forest reserves on rural lands. | ||||||||
| Developing/implementing programmes for the revitalisation of springs and restoration of riparian forests in order to increase the recharge capacity of the watershed, as well as protect water bodies from human activities. | ||||||||
| Encouraging the creation of ecological corridors. | ||||||||
Publisher’s Note: MDPI stays neutral with regard to jurisdictional claims in published maps and institutional affiliations. |
© 2022 by the authors. Licensee MDPI, Basel, Switzerland. This article is an open access article distributed under the terms and conditions of the Creative Commons Attribution (CC BY) license (https://creativecommons.org/licenses/by/4.0/).
Share and Cite
Gomes Oliveira, A.; Souza Machado, R.A.; Lois González, R.C. Environmental Zoning in a Context of Strong Pressure from Productivist Agriculture in Brazil’s Northeast: The Case of the Ipojuca River, Pernambuco, Brazil. Land 2022, 11, 611. https://doi.org/10.3390/land11050611
Gomes Oliveira A, Souza Machado RA, Lois González RC. Environmental Zoning in a Context of Strong Pressure from Productivist Agriculture in Brazil’s Northeast: The Case of the Ipojuca River, Pernambuco, Brazil. Land. 2022; 11(5):611. https://doi.org/10.3390/land11050611
Chicago/Turabian StyleGomes Oliveira, Anderson, Ricardo Augusto Souza Machado, and Rubén Camilo Lois González. 2022. "Environmental Zoning in a Context of Strong Pressure from Productivist Agriculture in Brazil’s Northeast: The Case of the Ipojuca River, Pernambuco, Brazil" Land 11, no. 5: 611. https://doi.org/10.3390/land11050611
APA StyleGomes Oliveira, A., Souza Machado, R. A., & Lois González, R. C. (2022). Environmental Zoning in a Context of Strong Pressure from Productivist Agriculture in Brazil’s Northeast: The Case of the Ipojuca River, Pernambuco, Brazil. Land, 11(5), 611. https://doi.org/10.3390/land11050611