
The Poverty of Farmers in a Main Grain-Producing Area in Northeast China


Abstract
1. Introduction
2. Literature Review
2.1. Poverty Definition and Measurement
2.2. Regional Differentiation of Farmers’ Poverty
3. Materials and Methods
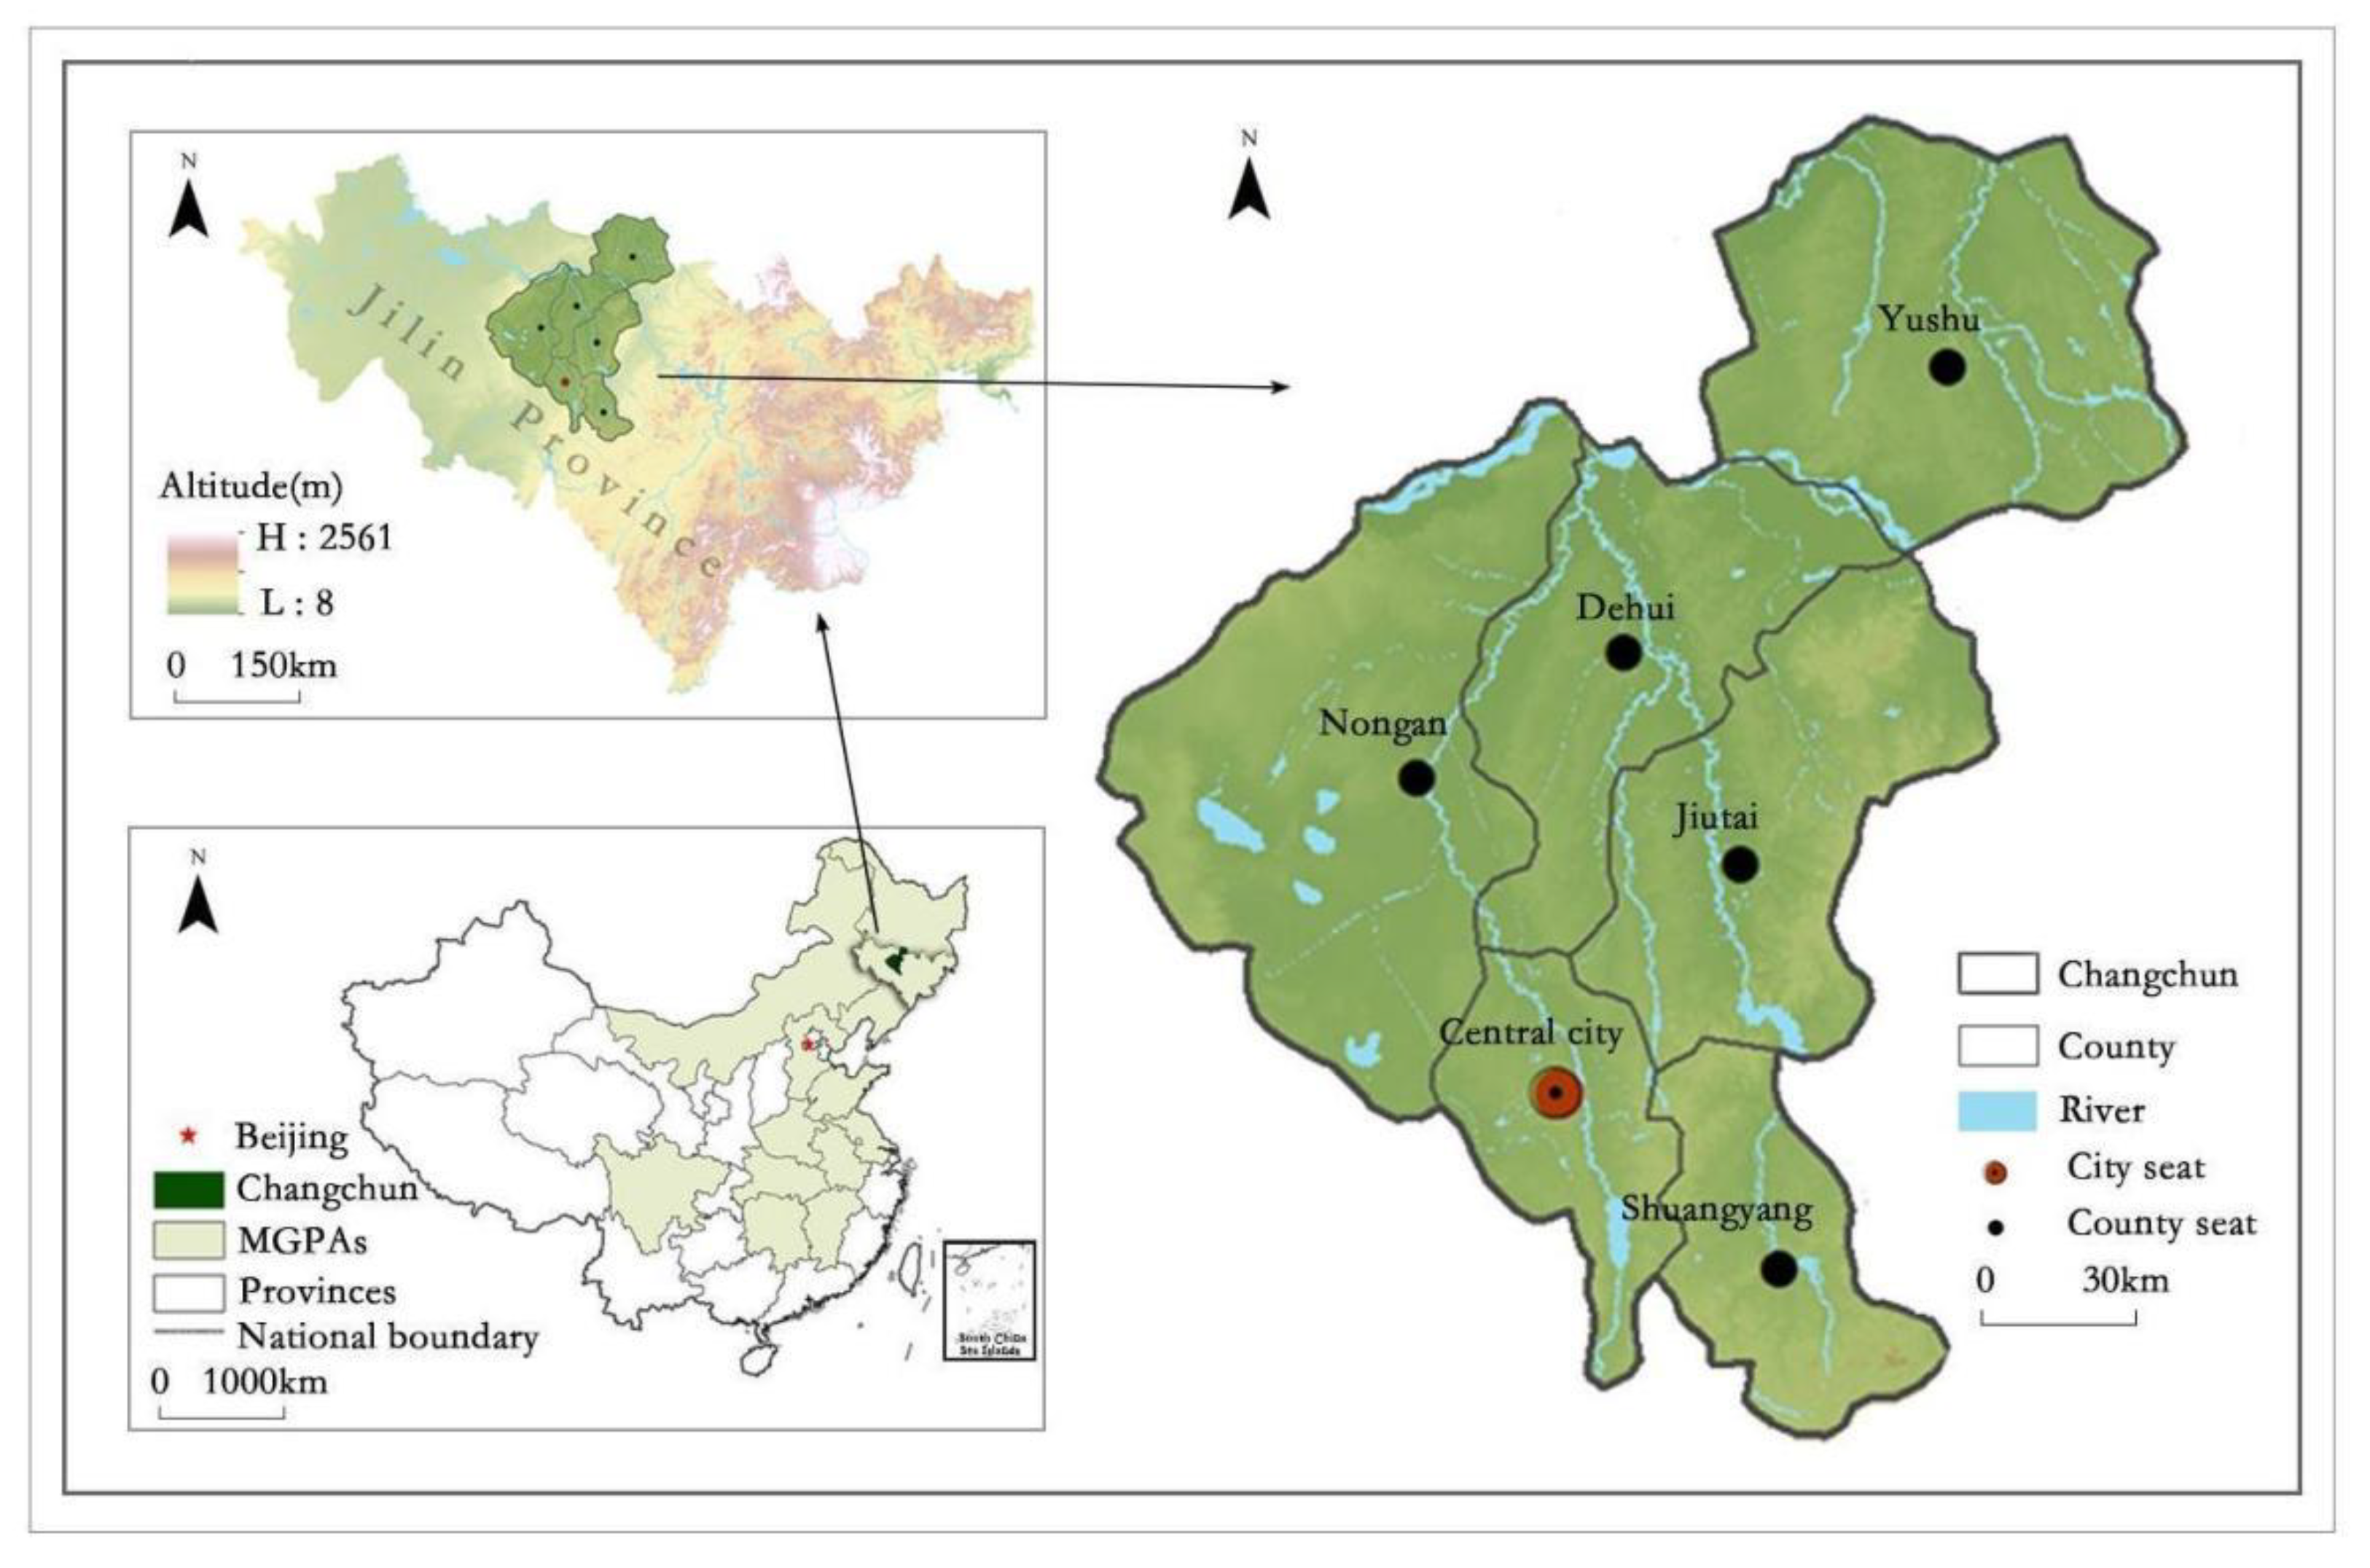
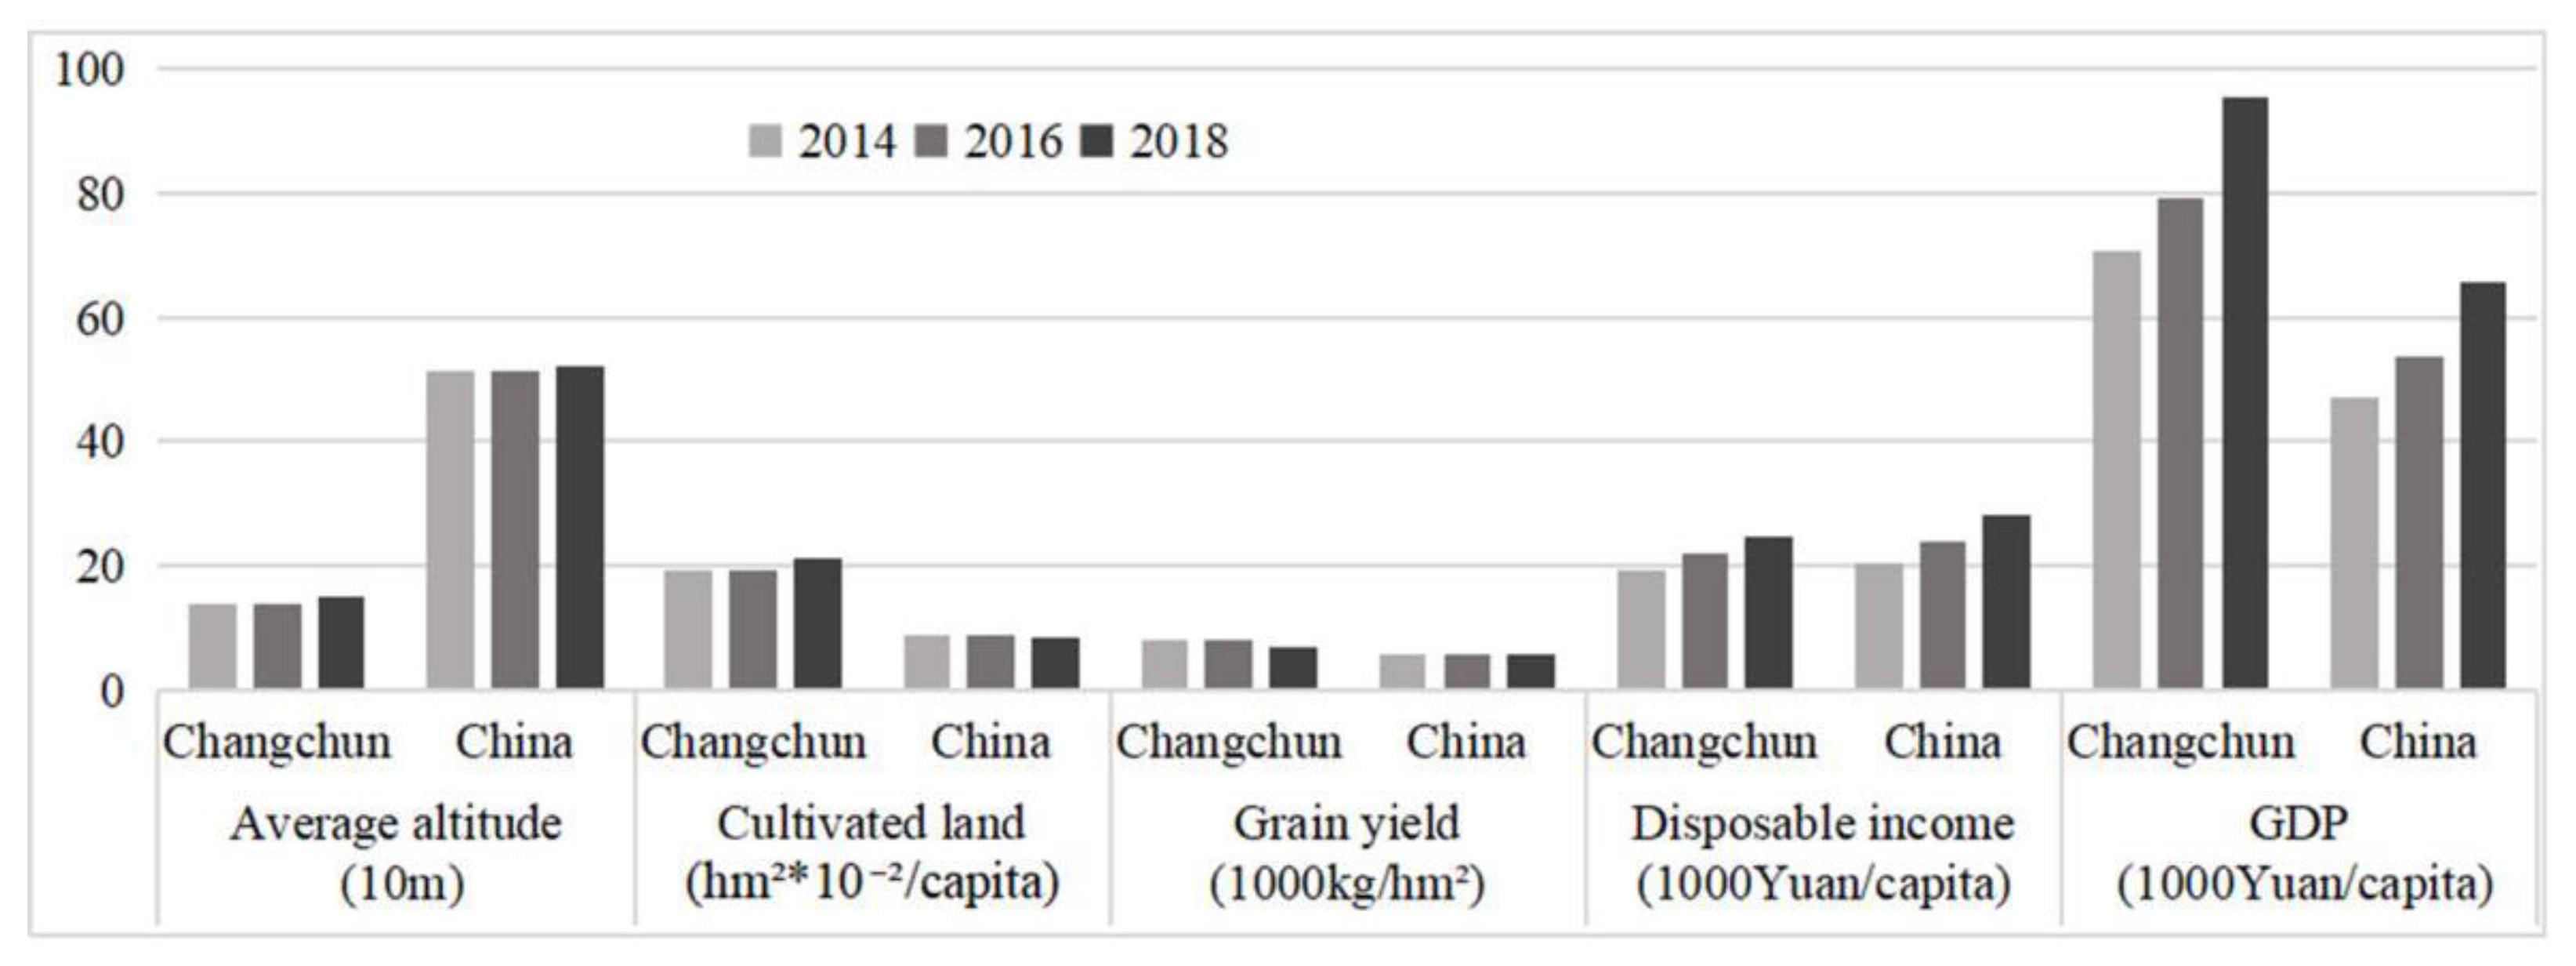
3.1. Study Area
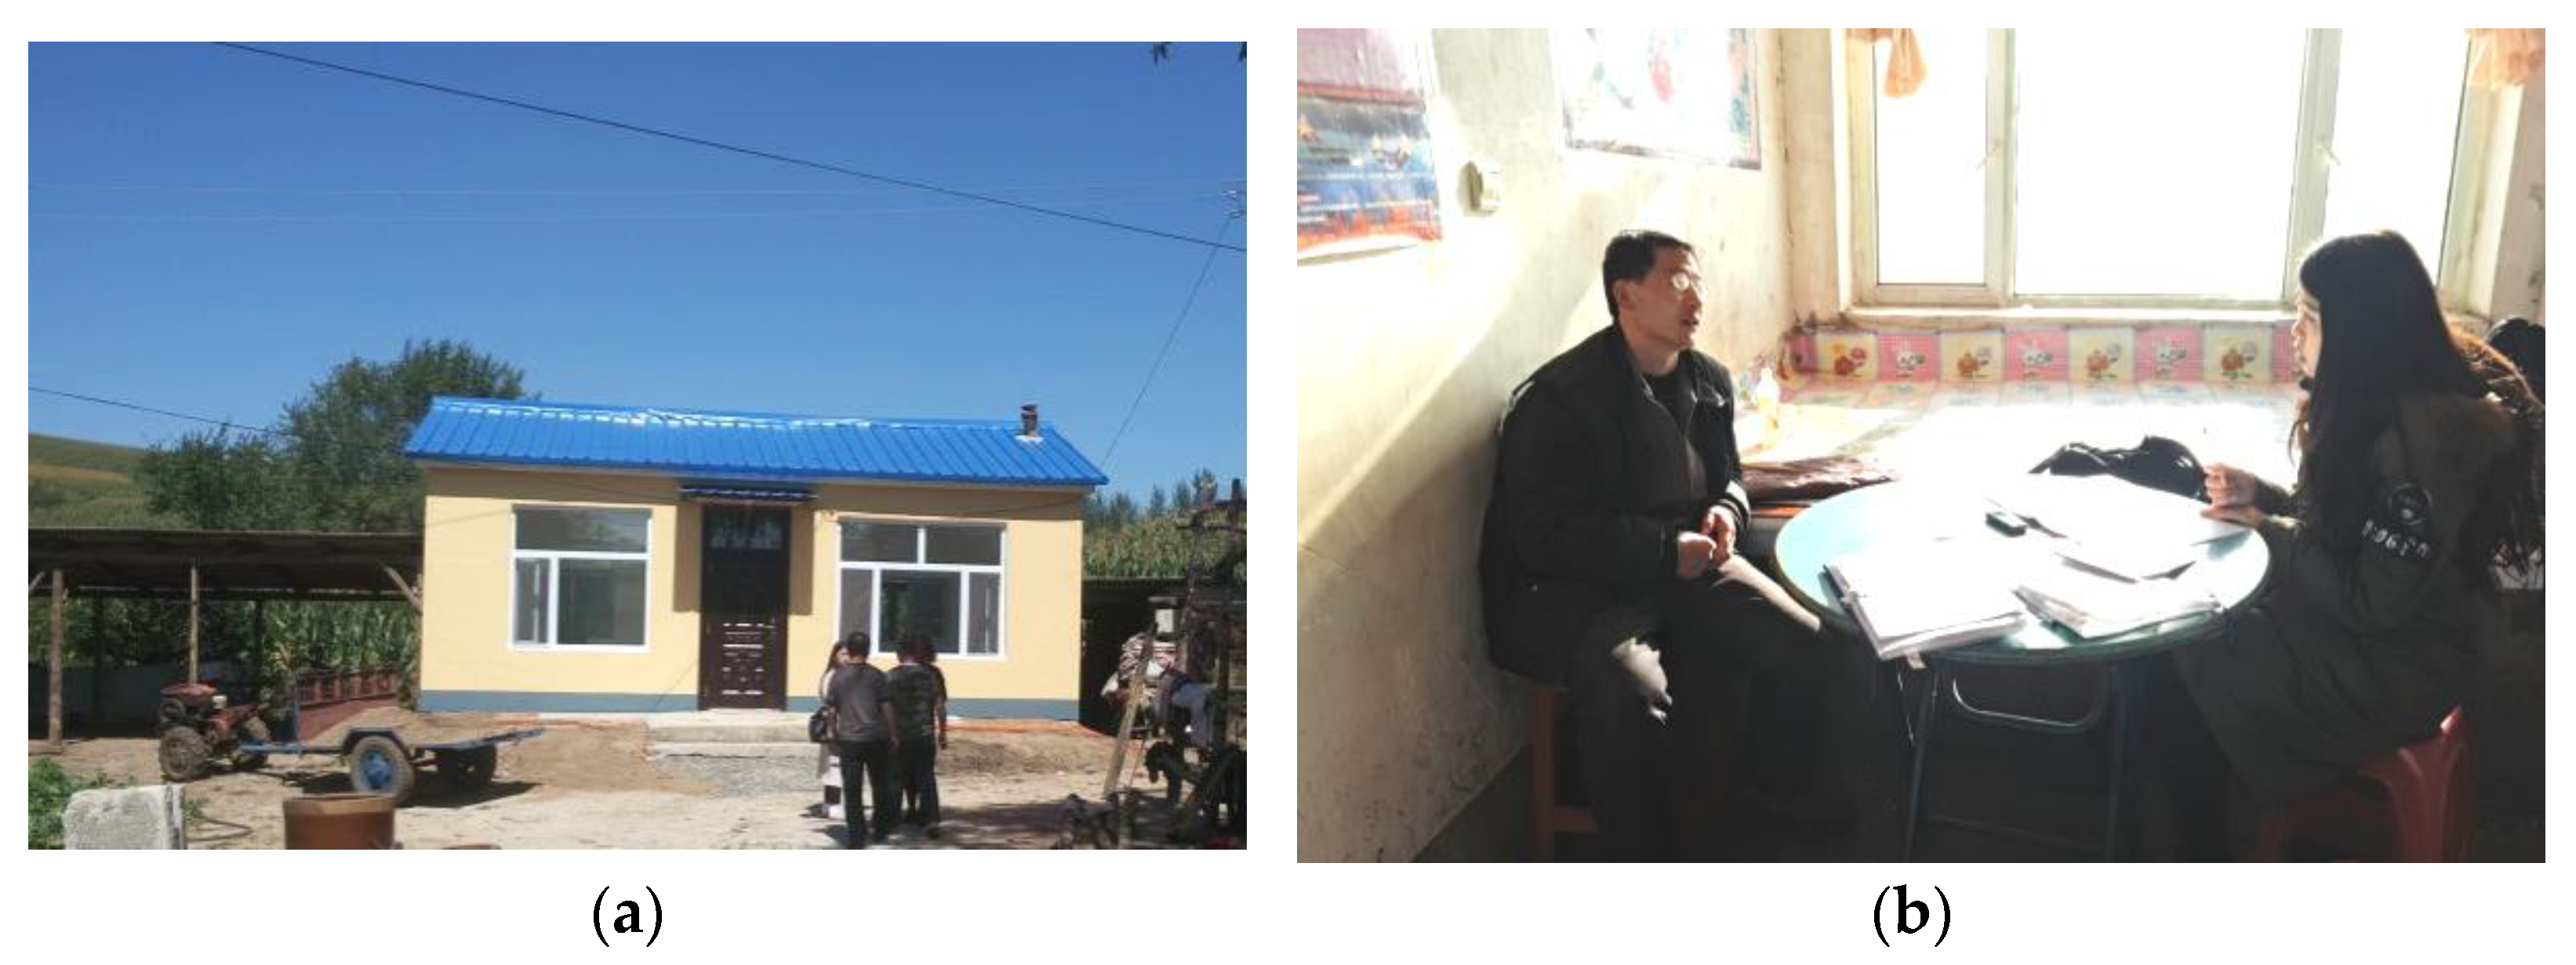
3.2. Data
3.3. Methods
4. Results
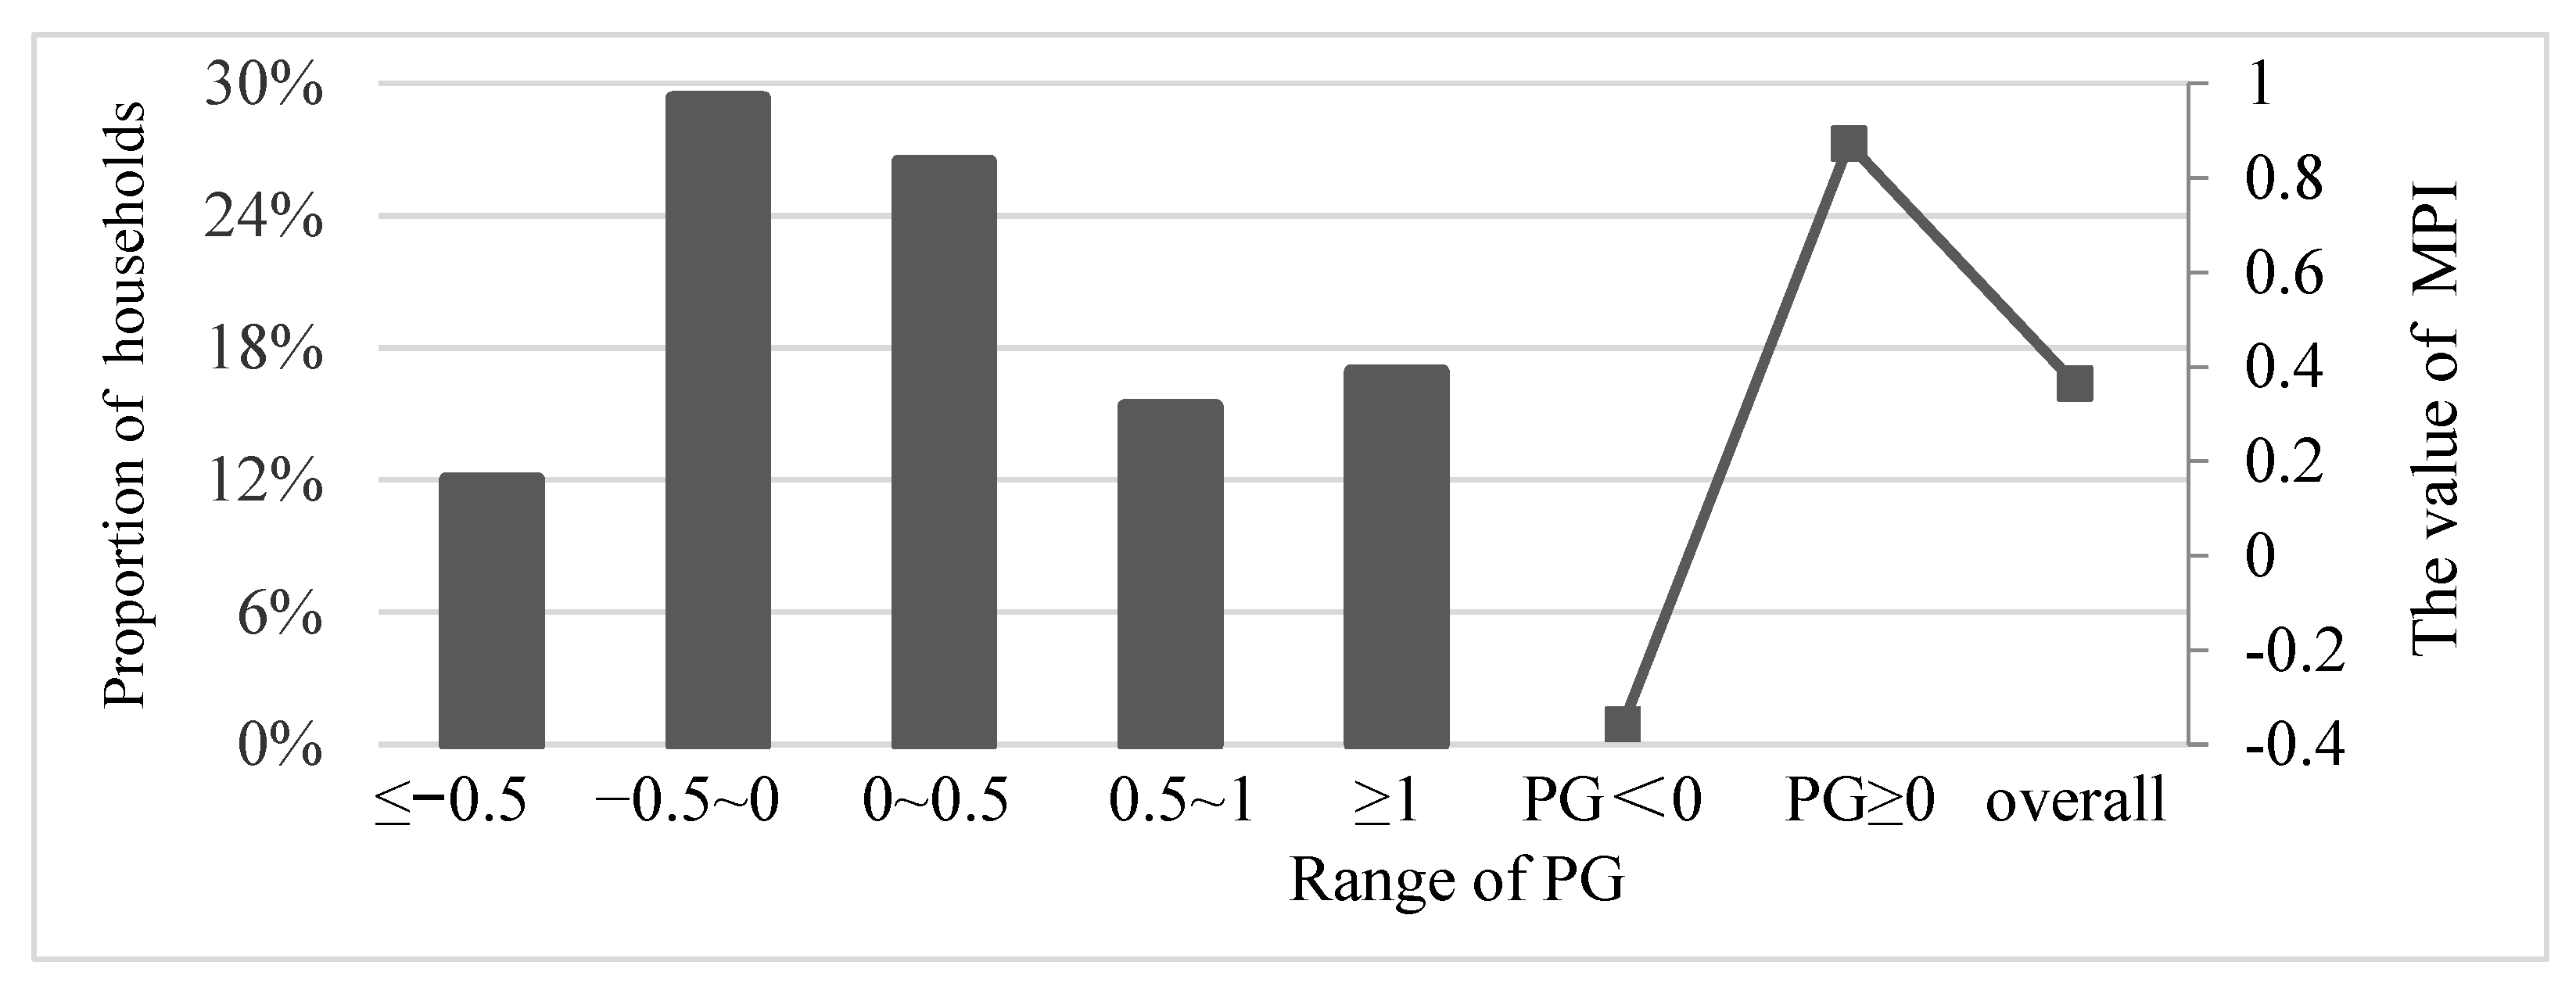
4.1. Income Poverty
4.1.1. Characteristics of Income Poverty
4.1.2. Impact Factors of Income Poverty
4.2. Multidimensional Poverty
4.2.1. Characteristics of Multidimensional Poverty
4.2.2. Impact Factors of Multidimensional Poverty
5. Discussion
6. Conclusions
Author Contributions
Funding
Institutional Review Board Statement
Informed Consent Statement
Data Availability Statement
Acknowledgments
Conflicts of Interest
References
- Contzen, S.; Crettaz, E. Being a poor farmer in a wealthy country: A Swiss case study. Sociol. Rural. 2019, 59, 393–418. [Google Scholar] [CrossRef]
- World Bank. Understanding Poverty. 2019. Available online: https://www.worldbank.org/en/topic/poverty/overview (accessed on 5 March 2019).
- Bernard, J.; Contzen, S.; Decker, A.; Shucksmith, M. Poverty and social exclusion in diversified rural contexts. Sociol. Rural. 2019, 59, 353–368. [Google Scholar] [CrossRef]
- Bernard, J. Where Have All the Rural Poor Gone? Explaining the Rural–Urban Poverty Gap in European Countries. Sociol. Rural. 2019, 59, 369–392. [Google Scholar] [CrossRef]
- Curtis, K.J.; Lee, J.; O’Connell, H.A.; Zhu, J. The Spatial Distribution of Poverty and the Long Reach of the Industrial Makeup of Places: New Evidence on Spatial and Temporal Regimes. Rural Sociol. 2019, 84, 28–65. [Google Scholar] [CrossRef]
- Fisher, M.G. Why Is U.S. Poverty Higher in Nonmetropolitan than Metropolitan Areas? Evidence from the Panel Study of Income Dynamics; RPRC Working Paper 05-04; RUPRI Rural Poverty Research Center: Iowa City, IA, USA, 2005.
- Leslie, C.; Gray, W.G.M. A Geographical Perspective on Poverty-environment interactions. Geogr. J. 2005, 171, 9–23. [Google Scholar]
- Palmer-Jones, R.; Sen, K. It is where you are that matters the spatial determinants of rural poverty in India. Agric. Econ. 2006, 34, 229–242. [Google Scholar] [CrossRef]
- Gang, I.N.; Sen, K.; Yun, M.S. Poverty In Rural India: Caste And Tribe. Rev. Income Wealth 2008, 54, 50–70. [Google Scholar] [CrossRef]
- Goli, S.; Maurya, N.K.; Sharma, M.K. Continuing caste inequalities in rural Uttar Pradesh. Int. J. Sociol. Soc. Policy 2015, 35, 252–272. [Google Scholar] [CrossRef]
- Kam, S.P.; Hossain, M.; Bose, M.L.; Villano, L.S. Spatial patterns of rural poverty and their relationship in Bangladesh. Food Policy 2005, 30, 551–567. [Google Scholar] [CrossRef]
- Nahar, P. The link between infertility and poverty: Evidence from Bangladesh. Hum. Fertil. 2011, 15, 18–26. [Google Scholar] [CrossRef]
- Bird, K.; Shepherd, A. Livelihoods and Chronic Poverty in Semi-Arid Zimbabwe. World Dev. 2003, 31, 591–610. [Google Scholar] [CrossRef]
- Addaekorankye, A. Causes of Poverty in Africa: A Review of Literature. Am. Int. J. Soc. Sci. 2014, 3, 147–153. [Google Scholar]
- Vanlauwe, B.; Six, J.; Sanginga, N.; Adesina, A.A. Soil fertility decline at the base of rural poverty in sub-Saharan Africa. Nat. Plants 2015, 1, 15101. [Google Scholar] [CrossRef]
- Macedonia, Former Yugoslav Republic of—Poverty, Jobs and Firms: An Assessment for 2002–2006; World Bank Group: Washington, DC, USA, 2009. Available online: http://documents.worldbank.org/curated/en/874201468053096160/Macedonia-former-Yugoslav-Republic-of-Poverty-jobs-and-firms-an-assessment-for-2002-2006 (accessed on 15 April 2022).
- Hunzai, K.; Gerlitz, J.-Y.; Hoermann, B. Understanding Mountain Poverty in the Hindu Kush-Himalayas: Regional Report for Afghanistan, Bangladesh, Bhutan, China, India, Myanmar, Nepal, and Pakistan; ICIMOD: Kathmandu, Nepal, 2011. [Google Scholar]
- Winsemius, H.C.; Jongman, B.; Veldkamp, T.I.E.; Hallegatte, S.; Bangalore, M.; Ward, P.J. Disaster risk, climate change, and poverty: Assessing the global exposure of poor people to floods and droughts. Environ. Dev. Econ. 2018, 23, 328–348. [Google Scholar] [CrossRef]
- Xu, Z.; Cai, Z.; Wu, S.; Huang, X.; Liu, J.; Sun, J.; Su, S.; Weng, M. Identifying the Geographic Indicators of Poverty Using Geographically Weighted Regression: A Case Study from Qiandongnan Miao and Dong Autonomous Prefecture, Guizhou, China. Soc. Indic. Res. 2018, 142, 947–970. [Google Scholar] [CrossRef]
- Ma, Z.; Chen, X.; Jia, Z.; Lv, P. Poor people, or poor area? A geostatistical test for spatial poverty traps. Geogr. Res. 2018, 37, 123–136. [Google Scholar]
- Thirtle, C.; Lin, L.; Piesse, J. The Impact of Research-Led Agricultural Productivity Growth on Poverty Reduction in Africa, Asia and Latin America. World Dev. 2003, 31, 1959–1975. [Google Scholar] [CrossRef]
- The World Bank. World Development Report 2008—Agriculture and Development; The World Bank: Washington, DC, USA, 2007. [Google Scholar]
- Hanjra, M.A.; Ferede, T.; Gutta, D.G. Reducing poverty in sub-Saharan Africa through investments in water and other priorities. Agric. Water Manag. 2009, 96, 1062–1070. [Google Scholar] [CrossRef]
- Abro, Z.A.; Alemu, B.A.; Hanjra, M.A. Policies for Agricultural Productivity Growth and Poverty Reduction in Rural Ethiopia. World Dev. 2014, 59, 461–474. [Google Scholar] [CrossRef]
- Ogundipe, A.; Oduntan, E.A.; Adebayo, O.; Olagunju, K. Agricultural Productivity, Poverty Reduction and Inclusive Growth in Africa Linkages and Pathways. Asian J. Agric. Extension. Econ. Sociol. 2017, 18, 1–15. [Google Scholar] [CrossRef]
- Christiaensen, L.; Martin, W. Agriculture, structural transformation and poverty reduction: Eight new insights. World Dev. 2018, 109, 413–416. [Google Scholar] [CrossRef]
- Bertolini, P. Overview of income and non-income rural poverty in developed countries. Present. Retrieved 2019, 5, 2020. [Google Scholar]
- Partridge, M.D.; Dan, S.R. Distance from Urban Agglomertion Economies and Rural Poverty. J. Reg. Sci. 2010, 48, 285–310. [Google Scholar] [CrossRef]
- Commins, P. Poverty and Social Exclusion in Rural Areas-Characteristics, Processes and Research Issues. Sociol. Rural. 2004, 44, 61–75. [Google Scholar] [CrossRef]
- Milbourne, P.; Doheny, S. Older people and poverty in rural Britain: Material hardships, cultural denials and social inclusions. J. Rural Stud. 2012, 28, 389–397. [Google Scholar] [CrossRef]
- Zaidi, A. Poverty Risks for Older People in EU Countries—An Update; Policy Brief January (11); European Centre: Vienna, Austria, 2010; Available online: https://www.researchgate.net/publication/267421142 (accessed on 15 April 2022).
- Klärner, A.; Knabe, A. Social Networks and Coping with Poverty in Rural Areas. Sociol. Rural. 2019, 59, 447–473. [Google Scholar] [CrossRef]
- Dawson, N.; Martin, A.; Sikor, T. Green Revolution in Sub-Saharan Africa: Implications of Imposed Innovation for the Wellbeing of Rural Smallholders. World Dev. 2016, 78, 204–218. [Google Scholar] [CrossRef]
- Liu, Y.; Xu, Y. Geographical identification and classification of multi-dimensional poverty in rural China. Acta Geogr. Sin. 2015, 70, 993–1007. [Google Scholar]
- Queen, S.A.; Mann, D.M. Social Pathology. J. Nerv. Ment. Dis. 1931, 74, 379. [Google Scholar] [CrossRef]
- Sen, A. Ingredients of Famine Analysis: Availability and Entitlements. Q. J. Econ. 1981, 96, 433–464. [Google Scholar] [CrossRef]
- Sen, A. Well-being, agency and freedom. J. Philos. 1985, 82, 169–221. [Google Scholar]
- Alkire, S.; Foster, J. Counting and multidimensional poverty measurement. J. Public Econ. 2011, 95, 476–487. [Google Scholar] [CrossRef]
- Milbourne, P. Rural Poverty: Marginalisation and Exclusion in Britain and the United States; Routledge: London, UK; New York, NY, USA, 2004. [Google Scholar]
- Barbier, E.B. The economic linkages between rural poverty and land degradation—Some evidence from Africa. Agric. Ecosyst. Environ. 2000, 82, 355–370. [Google Scholar] [CrossRef]
- Azzarri, C.; Signorelli, S. Climate and poverty in Africa South of the Sahara. World Dev. 2019, 125, 104691. [Google Scholar] [CrossRef] [PubMed]
- Mirza, M.M.Q. Climate change, flooding in South Asia and implications. Reg. Environ. Chang. 2011, 11, 95–107. [Google Scholar] [CrossRef]
- Malley, Z.J.U.; Mzimbiri, M.K.; Mwakasendo, J.A. Integrating local knowledge with science and technology in management of soil, water and nutrients: Implications for management of natural capital for sustainable rural livelihoods. Int. J. Sustain. Dev. World 2009, 16, 151–163. [Google Scholar] [CrossRef]
- Wang, S.; Tian, J.; Wang, B.; Cheng, L.; Du, C. Regional Characteristics and Causes of Rural Poverty in Northeast China from the Perspective of Targeted Poverty Alleviation. Sci. Geogr. Sin. 2017, 37, 1449–1458. [Google Scholar]
- Ivanic, M.; Martin, W.J. Short- and Long-Run Impacts of Food Price Changes on Poverty; World Bank Policy Research Working Paper 7011; World Bank: Washington, DC, USA, 2014. [Google Scholar] [CrossRef]
- Hans, P.; Binswanger-Mkhize, T.J.; Paul Chimuka Samboko, L.Y. The impact of urban growth on agricultural and non-farm income in Kenya. In Proceedings of the 5th International Conference of the African Association of Agricultural Economists, Addis Ababa, Ethiopia, 23–26 September 2016. [Google Scholar]
- Li, G.; Cai, Z.; Liu, J.; Liu, X.; Su, S.; Huang, X.; Li, B. Multidimensional Poverty in Rural China: Indicators, Spatiotemporal Patterns and Applications. Soc. Indic. Res. 2019, 144, 1099–1134. [Google Scholar] [CrossRef]
- Akevičiūtė, R. Rural Livelihood Diversification: A Solution for Poverty in the Post-Soviet Rural Baltic States? Sociol. Rural. 2019, 59, 560–580. [Google Scholar]
- Chen, J.; Wang, Y.; Wen, J.; Fang, F.; Song, M. The influences of aging population and economic growth on Chinese rural poverty. J. Rural Stud. 2016, 47, 665–676. [Google Scholar] [CrossRef]
- Jöhr, H. Where are the Future Farmers to Grow Our Food. Int. Food Agribus. Manag. Rev. 2012, 15, 9–11. [Google Scholar]
- Chirca, C.; Tesliuc, E.D.; Campeanu, M.; Gheorghe, D.; Halus, R.; Panduru, F.; Augustin Pop, M.; Sandu, D. From Rural Poverty to Rural Development; World Bank: Washington, DC, USA; National Commission for Statistics: Bucharest, Romania, 2010. Available online: https://documents.worldbank.org/en/publication/documents-reports/documentdetail/309721468763840126/pdf (accessed on 15 April 2022).
- Bernard, J.; Decker, A.; Mikešová, R.; Vojtíšková, K. Living and Dealing with Limited Opportunities: Social Disadvantage and Coping Strategies in Rural Peripheries. Sociální Studia/Soc. Stud. 2016, 13, 29–53. [Google Scholar] [CrossRef]
- Bernard, J.; Šafr, J. The other disadvantaged neighbourhood: Income related effects of living in rural peripheries. Hous. Stud. 2018, 34, 946–973. [Google Scholar] [CrossRef]
- Norris, A.N.; Zajicek, A.; Murphy-Erby, Y. Intersectional Perspective and Rural Poverty Research: Benefits, Challenges and Policy Implications. J. Poverty 2010, 14, 55–75. [Google Scholar] [CrossRef]
- Yuanzhi, G.; Yang, Z.; Yansui, L. Targeted poverty alleviation and its practices in rural China: A case study of Fuping county, Hebei Province. J. Rural Stud. 2019; in press. [Google Scholar]
- Li, E.; Deng, Q.; Zhou, Y. Livelihood resilience and the generative mechanism of rural households out of poverty: An empirical analysis from Lankao County, Henan Province, China. J. Rural Stud. 2019; in press. [Google Scholar] [CrossRef]
- China Health and Nutrition Survey. Available online: http://www.cpc.unc.edu/projects/china (accessed on 18 May 2021).
- Alkire, S.; Fang, Y. Dynamics of Multidimensional Poverty and Uni-dimensional Income Poverty: An Evidence of Stability Analysis from China. Soc. Indic. Res. 2018, 142, 25–64. [Google Scholar] [CrossRef]
- Ministry of Housing and Urban-Rural Development of the People’s of Republic of China. Notice on Printing and Distributing “Technical Guidelines for Appraisal of Dangerous Houses in Rural Areas (Trial)”. Available online: https://www.mohurd.gov.cn/gongkai/fdzdgknr/tzgg/200903/20090330_188114.html (accessed on 13 March 2022).
- Miles, J. Tolerance and Variance Inflation Factor. In Encyclopedia of Statistics in Behavioral Science; John Wiley & Sons: Totnes, UK, 2005. [Google Scholar] [CrossRef]
- Yu, J. Multidimensional Poverty in China: Findings Based on the CHNS. Soc. Indic. Res. 2013, 112, 315–336. [Google Scholar] [CrossRef]
- Zheng, W. Targeted Poverty Alleviation under the hollowing out of rural population: Dilemma and path. Chin. Cadres Trib. 2016, 7, 82–84. [Google Scholar] [CrossRef]
- The World Bank. World Bank Open Data-Agricultural Land. Available online: https://data.worldbank.org/indicator/AG.LND.AGRI.ZS (accessed on 14 March 2022).
- Afriyie, K.; Abass, K.; Adjei, P.O.-W. Urban sprawl and agricultural livelihood response in peri-urban Ghana. Int. J. Urban Sustain. Dev. 2019, 12, 202–218. [Google Scholar] [CrossRef]
- Oduro, C.Y.; Adamtey, R.; Ocloo, K. Urban Growth and Livelihood Transformations on the Fringes of African Cities: A Case Study of Changing Livelihoods in Peri-Urban Accra. Environ. Nat. Resour. Res. 2015, 5, 81. [Google Scholar] [CrossRef]
- Su, Z.; Aaron, J.R.; Guan, Y.; Wang, H. Sustainable Livelihood Capital and Strategy in Rural Tourism Households: A Seasonality Perspective. Sustainability 2019, 11, 4833. [Google Scholar] [CrossRef]


| Dimensions | Indicators | Deemed as below the Poverty Line/Living in Poverty If: |
|---|---|---|
| Health | Physical condition | Any family member with a chronic illness, serious disease, or disability |
| Medical insurance | Eligible household members do not participate in China’s rural medical system | |
| Education | Years of schooling | Head of the household has not completed at least five years of schooling |
| Child enrollment | Any school-aged child at the stage of compulsory education is not attending school | |
| Living Standards | Housing | No long-term stable and safe housing or dwelling exhibits safety hazards |
| Diet | Lack of staple foods, or protein available less than once per month | |
| Clothing | No seasonal clothing, shoes, and quilts for daily change or all have been donated |
| Impact Factors | Description | Min. | Max. | Mean | Tolerance | VIF |
|---|---|---|---|---|---|---|
| Amount of government subsidies provided | This includes agricultural subsidies, minimum living standard subsidy, disability subsidy, family planning subsidy, and veterans’ allowance | 0.00 | 4.00 | 1.40 | 0.94 | 1.07 |
| Cultivated land area (hm2) | Cultivated land area owned by the household | 0.01 | 4.00 | 0.50 | 0.82 | 1.22 |
| Livelihood strategy | 1: none of the family members farming or working; 2: all members farming only; 3: any members both farming and working; 4: all members working only | 1.00 | 4.00 | 2.06 | 0.71 | 1.40 |
| Nearby employment opportunities | 1: no employment opportunities, no enterprises, processing plants, and large cooperatives that can provide employment opportunities for villagers. 2: seasonal employment opportunities: farmers with large-scale farming or breeding work, or cooperatives requiring short-term and temporary workers. 3: long term employment opportunities: enterprises, processing plants, and cooperatives in the village that require long-term workers, which can provide relatively stable employment opportunities for villagers. | 1.00 | 3.00 | 1.90 | 0.96 | 1.05 |
| Gender of head of household | 1: male; 2: female | 1.00 | 2.00 | 1.20 | 0.97 | 1.03 |
| Education level of head of household | 1: primary school and below; 2: above primary school | 1.00 | 2.00 | 1.23 | 0.97 | 1.03 |
| Physical condition of family members | 1: some members disabled and/or sick; 2: nobody disabled and/or sick | 1.00 | 2.00 | 1.05 | 0.98 | 1.02 |
| Family size | Number of family members | 1.00 | 8.00 | 2.61 | 0.61 | 1.63 |
| Proportion of people aged over 60 (%) | Number of people over 60/family size∗100% | 0.00 | 100 | 48.71 | 0.77 | 1.30 |
| Proportion of people with capacity to work (%) | Number of people with capacity to work/family size∗100% | 0.00 | 100 | 28.72 | 0.97 | 1.03 |
| Distance from center of Changchun (h) | The time distances from housing to centers under driving, calculated by AMAP, which is a widely used road navigation software in China and considers the road conditions in its calculation. | 0.61 | 4.99 | 2.43 | 0.78 | 1.28 |
| Distance from county center (h) | 0.09 | 3.39 | 0.91 | 0.61 | 1.65 | |
| Distance from town center (h) | 0.02 | 3.75 | 0.49 | 0.70 | 1.43 | |
| N | 1324 | |||||
| Variables | Model 1: With Transfer Income | Model 2: Without Transfer Income | ||||
|---|---|---|---|---|---|---|
| B | Exp (B) | Sig. | B | Exp (B) | Sig. | |
| Amount of government subsidies | −0.550 | 0.577 | 0.000 | — | — | |
| Cultivated land area | −0.102 | 0.903 | 0.000 | −0.082 | 0.922 | 0.000 |
| Livelihood strategy | 0.000 | 0.000 | ||||
| Livelihood strategy (1) | 2.497 | 12.147 | 0.000 | 3.859 | 47.431 | 0.000 |
| Livelihood strategy (2) | 1.560 | 4.757 | 0.000 | 1.932 | 6.903 | 0.000 |
| Livelihood strategy (3) | −0.361 | 0.697 | 0.245 | −0.236 | 0.790 | 0.350 |
| Nearby employment opportunities | 0.005 | — | — | |||
| Nearby employment opportunities (1) | 0.498 | 1.645 | 0.001 | — | — | |
| Nearby employment opportunities (2) | 0.270 | 1.310 | 0.106 | — | — | |
| Physical condition of family members | 0.900 | 2.460 | 0.011 | — | — | |
| Family size | 0.501 | 1.651 | 0.000 | 0.349 | 1.417 | 0.000 |
| Proportion of people with the capacity to work | — | — | −0.005 | 0.995 | 0.015 | |
| Distance from center of Changchun | 0.005 | 1.651 | 0.000 | — | — | |
| Constant | −3.542 | 0.029 | 0.000 | −0.754 | 0.470 | 0.009 |
| R2 | 0.280 | 0.410 | ||||
| Prediction accuracy | 58.9% | 70.0% | ||||
| MPI | 0 | −1 | −2 | −3 | −4 | −5 | −6 | −7 | |
|---|---|---|---|---|---|---|---|---|---|
| Proportion (%) | Total | 0.45% | 21.22% | 61.78% | 14.20% | 1.81% | 0.53% | 0.00% | 0.00% |
| Non-aging family | 1.20% | 26.62% | 58.03% | 12.71% | 0.96% | 0.48% | 0.00% | 0.00% | |
| Semi-aging family | 0.00% | 20.62% | 64.52% | 11.97% | 2.22% | 0.67% | 0.00% | 0.00% | |
| Aging family | 0.22% | 16.89% | 62.50% | 17.76% | 2.19% | 0.44% | 0.00% | 0.00% | |
| Indicator | Physical condition | Medical insurance | Years of schooling | Child enrollment | Housing | Diet | Clothing | Mean MPI | |
| Deprived rate (%) | Total | 96.00% | 3.10% | 76.74% | 1.21% | 15.41% | 2.49% | 2.34% | −1.973 |
| Non-aging family | 94.72% | 3.36% | 71.70% | 1.68% | 13.67% | 1.20% | 0.72% | −1.871 | |
| Semi-aging family | 96.23% | 3.10% | 75.39% | 2.00% | 14.86% | 3.10% | 3.10% | −1.978 | |
| Aging family | 96.93% | 2.85% | 82.68% | 0.00% | 17.54% | 3.07% | 3.07% | −2.061 | |
Publisher’s Note: MDPI stays neutral with regard to jurisdictional claims in published maps and institutional affiliations. |
© 2022 by the authors. Licensee MDPI, Basel, Switzerland. This article is an open access article distributed under the terms and conditions of the Creative Commons Attribution (CC BY) license (https://creativecommons.org/licenses/by/4.0/).
Share and Cite
Ma, L.; Wang, S.; Wästfelt, A. The Poverty of Farmers in a Main Grain-Producing Area in Northeast China. Land 2022, 11, 594. https://doi.org/10.3390/land11050594
Ma L, Wang S, Wästfelt A. The Poverty of Farmers in a Main Grain-Producing Area in Northeast China. Land. 2022; 11(5):594. https://doi.org/10.3390/land11050594
Chicago/Turabian StyleMa, Li, Shijun Wang, and Anders Wästfelt. 2022. "The Poverty of Farmers in a Main Grain-Producing Area in Northeast China" Land 11, no. 5: 594. https://doi.org/10.3390/land11050594
APA StyleMa, L., Wang, S., & Wästfelt, A. (2022). The Poverty of Farmers in a Main Grain-Producing Area in Northeast China. Land, 11(5), 594. https://doi.org/10.3390/land11050594