Article

Integrating IPAT and CLUMondo Models to Assess the Impact of Carbon Peak on Land Use

1
School of Public Administration, Guangxi University, No. 100, Da Xue Road, Nanning 530004, China
2
Department of City and Regional Planning, University of North Carolina at Chapel Hill, Chapel Hill, NC 27599, USA
3
Regional Social Management Innovation Research Center, Guangxi University, No. 100, Da Xue Road, Nanning 530004, China
4
School of Mechanical Engineering, Guangxi University, No. 100, Da Xue Road, Nanning 530004, China
5
China Center for Agricultural Policy (CCAP), School of Advanced Agricultural Sciences, Peking University, No. 5, Yi He Yuan Road, Beijing 100871, China
*
Author to whom correspondence should be addressed.
Land 2022, 11(4), 573; https://doi.org/10.3390/land11040573
Submission received: 15 March 2022 / Revised: 31 March 2022 / Accepted: 12 April 2022 / Published: 13 April 2022

Abstract

:
China’s growth plans include a carbon emission peak policy, which is a restriction that indirectly impacts land use structure. In this study, we simulate different paths for achieving policy objectives, and explore the linkages between those paths and land use change. The IPAT model was used to simulate the carbon emissions generated from a natural development scenario, an ideal policy scenario, and a retributive carbon emission scenario in China from 2020 to 2030. The simulation results were incorporated into the CLUMondo model as a demand driver to simulate the land use change in 2030. The results show that carbon emission peak policy can somewhat reduce carbon emissions and increase building land in a regulated way. However, the policy may also lead to a short-term surge in carbon emissions, a reactive expansion of arable land and building land. This may reduce losses in economic development when carbon emissions are limited, but does not achieve the integration of social, economic, and ecological goals. This study links the carbon emission peak policy with land use change and provides a fresh perspective on the Chinese government’s carbon reduction policy.

1. Introduction

The carbon peak policy was the first step China took following the Paris Climate Summit in 2021. Will it have a positive effect on China’s land use pattern? To answer this question, scholars have analyzed the path and mode of the carbon peak policy’s impact on land use, exploring the impact of the carbon tax policy and energy utilization patterns [1,2,3,4]. Recently, two other new research directions have emerged to explore this question. First, studies have explored ways to accurately simulate the path towards realizing the carbon peak policy [5,6,7]. Under the carbon peak policy, the government has focused on reducing carbon emissions in alignment with its Sustainable Development Goals [8]. Energy utilization is dominated by enterprises, which is a major factor affecting carbon emissions. However, enterprises work to maximize their interests, and tend to disregard carbon target constraints on energy-intensive production [9,10,11]. Instead of pursuing sustainable production to increase their income, they may work against carbon emissions reduction targets [12,13,14]. These reactive carbon-related actions impact both carbon emissions and the relationships involved in land use systems. Land resources are material carriers that are closely related to human survival and development; as such, land use is guided by any carbon peak policy and determines actual carbon emissions.
Scholars often use predictive models to simulate land use, with the goal of improving policy effectiveness [15]. Many studies have found that realizing the carbon peak policy will impact land use changes [16,17,18,19]; however, the link between the policy and those changes have not yet been identified. In addition, few studies have effectively included policies in policy-related simulations. This highlights the need to study the different paths to realizing the carbon peak, and to explore the impact of those paths on land use to prevent carbon retrenching.
Achieving carbon peak targets calls for more efficient and environmentally friendly land use, with constrained carbon emissions. However, few studies have combined the two. Many previous studies have focused on carbon emission projections and land use type simulations [8,9]. Land resources are a lifeblood for human beings, and must be closely considered in the process of survival and development [20]. As such, they are strictly subject to guidance and policy constraints. This highlights the need to explore how policy incentives can be incorporated into land use change forecasting [21,22]. Previous studies have tended to focus on Laos [23], and other small countries at relatively small research scales; research has not yet been conducted on larger study scales.
This study responds to the problems described above. The IPAT model and CLUMondo model have been widely used to predict carbon emissions and to simulate land use change, respectively. The IPAT model accounts for the energy utilization pattern, which is the most important factor influencing carbon emissions. The CLUMondo model accounts for policy stimulus actions as a driver of demand, improving prediction accuracy. In this study, IPAT and CLUMondo models were combined to simulate China’s carbon emissions from 2020 to 2030 for three different scenarios, based on the possible implementation effect of the policy under the carbon peak target. This paper reveals the potential relationship between the carbon peak and land use change for decision-makers, which can lead to the more effective implementation of the carbon peak policy in China.
Under the peak carbon target, China’s goal is to achieve a peak in carbon emissions by 2030. This could limit the economic behavior of companies. This highlights the need to develop approaches that maximize economic benefits, while also achieving national goals. The important impact of carbon emissions on social development highlights the importance of predicting carbon emissions from different research perspectives. For example, Tengfei Huo and Linbo Xu studied residential buildings, using Monte Carlo simulation and scenario analysis to conclude that China may achieve a carbon peak in 2042 [24]. That study applied a hierarchical spatial autoregressive model, revealing an inverted U-shaped relationship between land urbanization and carbon dioxide emissions [25]. When the grey rolling model was used for prediction, the model results were relatively accurate, but the model did not consider energy structure factors that significantly affect carbon emissions [26,27]. IPAT-E and PLS-SEM models have also been used to identify the driving factors of carbon dioxide emissions in China [28]. The energy consumption caused by China’s economic growth and technological progress has also been calculated, using the IPAT model and its extension [29]. The results have shown that China’s rapid economic growth still depends largely on energy consumption [30,31,32]. Previous studies have generated different results, because of differences in model selection and interval prediction. Limiting carbon emissions leads to adjustments in energy structure, which lead to changes in land use type and land use intensity. This study proposes that carbon emissions should be predicted based on energy flow and consumption. These drivers are important references in setting the scenarios for this study that assess the carbon peak policy.
The carbon peak policy affects land use change, which determines carbon emissions. The binding target of low-carbon development somewhat inhibits economic activities [33], and restricts the overdevelopment of land. However, different land use types have different carbon emission coefficients and different carbon sink capacities [34]. These coefficients are affected by land use intensity. Building land has the highest carbon emission coefficient, meaning that the building land produces the largest carbon dioxide emission per unit area [35,36]. The main function of woodland, water, and grassland is to store carbon emissions. However, the carbon storage capacity of terrestrial ecosystems can be damaged due to the extensive occupation of ecological land by expanded production [37,38,39]. Whether or not the carbon peak policy can lead to reasonable land use changes, while also achieving the goal of environmentally sustainable development, is a key research question.
Due to the complexity and uncertainty of land use, prediction models can help improve the accuracy of policy simulations [15]. Key land use research methods include cellular automata models, CLUE-S and regression analysis, and the CLUMondo land use type simulation model. Cellular automata models largely depend on empirical knowledge from experts and may not be objective [40]. The CLUE-S model is used to establish a regression analysis between land use type and driving factors, but the quantitative relationship does not describe the intensity distribution of land use [41,42]. CLUMondo is a relatively new model for simulating land use type, and can adjust the land use type according to the intensity of land use through constrained demand conditions [43]. Compared with other models, it has the advantage of being able to incorporate policy stimulus into the model [44]. The parameter setting is simple, with relatively accurate results. Using the CLUMondo model, this paper simulates different policy effects according to different scenarios, bringing the simulated results close to reality.
Existing studies have noted that the energy mix and energy efficiency are important factors affecting carbon emissions [13,14,45]. However, most previous studies on the carbon peak policy have focused on predicting when the results of the policy will be realized [15]. However, limitations in carbon emissions created by the carbon peak policy may lead to different peak results. Research is needed to link the implementation of the carbon peak policy with land use change, based on the correlation between carbon emissions and changes in land use. Therefore, this study identifies the potential relationship between carbon peak policy and land use change. From the perspective of driving factors of carbon emissions, the paper simulates the future land use situation under a natural development approach, an ideal policy implementation approach, and an enterprise-driven reactive approach, providing a new perspective that contrasts with the existing research. This paper explores the optimal solution of land use structure to result in a win–win path of economic development and reduced carbon emissions.

2. Materials and Methods

2.1. Study Area and Data Processing

The study area is the People’s Republic of China. China is located in eastern Asia and occupies much of the west coast of the Pacific Ocean, geographically located at 73°33′~135°05′ east longitude and 3°51′~53°33′ north latitude. In 2021, the Chinese government proposed a “peak carbon” target, pledging that carbon dioxide emissions would peak in 2030 and gradually decline thereafter (https://www.gov.cn/, accessed on 18 June 2021). During the 14th Five-year Plan period, China’s economy and society developed rapidly, leading to the rapid expansion of urban areas. The built-up area increased from 40,058 square kilometers in 2010 by 60,721 square kilometers in 2020 [46,47]. In a developing country, limiting carbon emissions curbs urban land expansion and decreases energy use [48]. Given the challenge of balancing economic development and the development of an ecological civilization, the Chinese government continues to explore reasonable ways to achieve the carbon peak policy.
The data used for this study included: carbon emissions demand data, built-up area demand data, land use type data, data on driving factors (listed below), and the land use service coefficient data for different land types. Carbon emissions from 2010 to 2020 data were collected from CLIMATE WATCH (https://www.climatewatchdata.org/, accessed on 18 June 2021). Factors related to the carbon peak policy included population, affluence, technology progress forecasts for 2020~2030 for the three studied scenarios, and carbon emissions data. Data for the specific study area were collected from the department of housing and urban-rural development of the People’s Republic of China (http://www.mohurd.gov.cn/index.html, accessed on 18 June 2021). The trend extrapolation method was used to generate the data simulating the built-up area from 2020 to 2030. Data of land use status in 2010 and 2015 were collected from the Data Center for Resources and Environmental Sciences, Chinese Academy of Sciences (http://www.resdc.cn/, accessed on 18 June 2021). Based on the National Plan for Main Functional Zones, areas restricted to development were designated as restricted layers to protect the ecological security of vulnerable areas.
The four types of driving factors studied included climate, topography, accessibility, and socioeconomic development. Seven variables were selected to study the relationship between land types and independent variables (driving factors). Climate-related data included temperature and precipitation data from the Chinese Academy of Sciences Data Center for Resources and Environmental Sciences (http://www.resdc.cn/, accessed on 18 June 2021). Topographic data included elevation and slope. The elevation data came from the Data Center for Resources and Environmental Sciences, Chinese Academy of Sciences (http://www.resdc.cn/, accessed on 18 June 2021), and the slope was obtained using the slope analysis tool in ArcGIS. Accessibility data included the distance from the city, obtained through GIS cost distance analysis. Socioeconomic development data included population and GROSS national product (GNP), with data coming from the Chinese Academy of Sciences Data Center for Resources and Environmental Sciences (http://www.resdc.cn/, accessed on 18 June 2021). The data above were aggregated to a resolution of 2000 m in ArcGIS and projected using Albers technology.
Land use parameters were determined using the Classification Table of Land Use Status (GB/T21010-2007), land feature characteristics, data availability for the study area, and the intensity of land use management. Based on data availability, land use types were divided into six types: cultivated land, forest land, grassland, building land, water area, and unused land. The land use service coefficient refers to the services per unit area of land on the map [49]. The carbon emission coefficient was estimated from the carbon emissions generated by energy consumption. Other land types provide few services to the built-up areas; as such, this study set the land use service coefficient of building land as 1. In other words, 1 ha of building land produces 1 ha of built-up area. Table 1 shows the carbon emission coefficients of the six land use types.

2.2. Methods

2.2.1. Scenario Definitions

China’s carbon peak policy is designed to build a green, low-carbon, circular economic system, and to vigorously promote the transformation and upgrading of the economic structure, energy structure, and industrial structure. The carbon peak policy is intended to implement a “1 + N” policy system, where “1” refers to the positions of the CPC (Communist Party of China) Central Committee and the State Council with respect to achieving peak carbon neutrality, and the key content of “N” is to implement plans in key fields and industries, such as energy, steel, and non-ferrous metals (https://www.ndrc.gov.cn/?code=&state=123, accessed on 18 June 2021). Achieving the carbon peak is expected to impact the social energy structure, energy efficiency, and regional land use patterns, due to changes in land use patterns and land use intensity. Therefore, this study applied the energy utilization structure as the intermediate medium. Based on the actual land use situation and development process in China, three land use scenarios were used to study the impact of the carbon peak policy on land use change.
Scenario 1 (natural development scenario, NDS): China has only established an initial carbon peak target, and the implementation effect needs to be evaluated. As such, the first scenario assumes that the impact of this policy target is small and China will continue to develop according to the original development status, with annual increases in carbon emissions.
Scenario 2 (ideal policy scenario, IPS): This scenario assumes that the carbon emissions in the study area are controlled under the influence of the carbon peak policy target; the growth of building land is moderately controlled; and the growth rate of building land area is slower compared to natural development scenario.
Scenario 3 (Reactive carbon emission scenario, RCS): The central government has placed importance on realizing the carbon peak target. However, local governments often pursue economic benefits, and consider other forms of performance in realizing the carbon peak target. To align this research closer to reality, the third scenario assumes that under the circumstance of limited development, enterprises delay practices that would decrease carbon emissions to after 2030; before 2030, ecological land is rapidly converted into urban land or another building land, leading to large-scale carbon emissions.

2.2.2. Carbon Emission Forecast

Using the IPAT model, this paper predicted the carbon emissions of different scenarios in the context of the carbon peak policy from 2010 to 2020 [22]. The IPAT model, also known as the environmental pressure model, is used to quantitatively represent the impact of human activities on the environment. The model decomposes the impact of human activities on the environment into the product of three driving factors: population size (P), affluence (A), and technological progress (T) (I = P × A × T). P is often affected by citizens’ conception of fertility and is difficult to control using policies. A is usually represented by per capita gross domestic product (GDP). T is usually represented by carbon dioxide (CO2) emission per unit GDP. Based on realistic conditions in China and data availability, this paper further decomposes the classical IPAT model. The development trend of A and T is often regulated by the state and can be predicted using relevant policies (http://www.gov.cn/, accessed on 18 June 2021). Therefore, based on the original IPAT model, this study introduced a new variable, and the influence of the population factor on the model was removed by subdivision. The total amount of CO2 was generated by multiplying the expected population of future years by the per capita amount of CO2.
The decomposition optimization process of the IPAT optimization extended model is as follows. The first level of factoring is as follows:
C = P × G P × C G
The first level factoring is as follows:
C = P × G P × E G × C E
The optimized model is as follows:
C = P × G P × E G × C E × 1 0.95 r
P represents China’s total population (persons); G represents the gross domestic product (CNY); E represents annual total energy consumption (a ton of standard coal); C represents annual carbon dioxide emissions (ton); and R represents the rate of remuneration to workers. There is a strong and stable correlation between industrial–technological progress and changes in the renumeration of industrial workers. Therefore, the rate of industrial–technological progress is represented as being 0.95 times the industrial labor rate.
In the natural development scenario (NDS), the carbon peak policy has less impact on carbon emissions. The energy intensity of GDP is calculated using the total energy consumption and GDP from 2011 to 2020.
C / E = 2.46
In other words, 1 unit of mass-energy produces approximately 2.46 times the mass of CO2. The logarithmic processing value of per capita wage (CNY) from 2011 to 2020 was linearly fitted to obtain the curve:
y = 0.0407 x 77.4184
The variation coefficient r of the laborers’ rate of return is 0.0407; the value of technological progress is 0.0388; and the influence coefficient of technological factors is 96.12% (1–0.95 R). The promotion of modern science and technology generally lasts 5 years, and 2020 serves as the base year. According to the CPC Central Committee’s Proposal on the Formulation of the 14th Five-Year Plan for National Economic and Social Development and the Long-term Goals for 2035, China’s GDP in 2035 is assumed to be CNY 20,319,724 billion. The NDS assumes uniform GDP growth from 2022 to 2035. Assuming that the total energy consumption is 6 billion tons of standard coal in 2030, the energy intensity of GDP is predicted to be 3.67954 × 10⁻⁵ (tons of standard coal/yuan). According to planning targets, China’s energy consumption per unit of GDP in 2025 is expected to be 13.5% lower compared to 2020, resulting in a GDP energy intensity of 4.23992 × 10⁻⁵ (a ton of standard coal/CNY) in 2025.
In the reactive carbon emission scenario (RCS), enterprises maximize profits, do not invest in industrial structure and emission reductions, and implement industrial activities and decisions that increase industrial income without limits. Based on the continuous tracking calculation and prediction of the industrialization level index, China’s industrialization level entered the later stage of industrialization after 2011. China was in the middle stage of industrial development from the 1990s to 2014, and entered the later stage of industrial development from 2016 to 2020. In the later stage of industrial development, the energy intensity of GDP increases at a uniform rate, with a maximum value of 5.94447 × 10⁻⁵ (a ton of standard coal/CNY); the value rises to a maximum level and then declines at the same rate.
The ideal policy scenario (IPS) assumes that the carbon emissions in the study area are controlled under the influence of the carbon peak policy goal. As such, the growth in building land is moderately controlled. Therefore, the growth rate of building land area is slower compared to the natural development scenario, and the annual growth rate of carbon emissions decreases at the same rate. Based on the above analysis, the quadratic single-valued function of carbon emission f(x) on year X is as follows:
f ( x ) = 7.8178 ( x 2020 ) 2 + 156.356 ( x 2020 ) + 11856.4

2.2.3. Land Use Change Prediction

In this paper, the CLUMondo model was used to simulate the land use changes in China from 2020 to 2030 under the three scenarios introduced above (NDS, IPS and RCS). CLUMondo is software that simulates land use change [50]. Parameters in the requirements module can drive competition among different land use types [51]. When the land use type is sufficient to meet the demand setting, then the current land use mode is considered to be the target [52]. In this paper, carbon emissions are calculated according to the three scenarios associated with the carbon peak policy. Carbon emissions are brought into the model as a constraint to adjust land use. According to the land use service coefficient of different land use types, the target land use pattern satisfying carbon emission and the built-up area was calculated. Other model parameters include the regression coefficient, transition resistance, transition matrix, constraint layer, and situational requirements.
Land use changes result from the interaction of different driving factors. Based on data availability and representativeness, seven factors were selected for the regression against the six land use types. The relationship between land use type and independent variable was obtained, and the spatial position of the land use type was determined. Conversion resistance represents the degree of difficulty in converting one land type into another: 1 indicates that the land use type is extremely difficult to be transformed into other land use types; and 0 indicates that the land use type is extremely easy to be transformed into other land use types. The transfer matrix specifies which land use types can be converted to each other; otherwise, the conversion between land use types is prohibited. The restriction layer represents the area under which development is restricted under the policy, with 0 indicating that the land use type can be changed and −0.9998 indicating that the restriction cannot change. Repeated debugging of the model yielded a set of parameters which made the simulated land use data in 2015 highly close to the real land use situation in 2015. The Kappa coefficient was 0.85, so this group of parameters was selected as the parameters for the formal simulation.
The two requirements selected in this paper are carbon emissions and built-up area. In the context of the carbon peak policy, carbon emissions may peak in 2030 as stipulated by the policy; emissions may increase at the original rate; or enterprises may react to the policy with more carbon dioxide emissions to maximize profits. The outcomes of these three scenarios were predicted using the IPAT model. Then, according to the data of the built-up area from 2010 to 2020, the built-up area from 2020 to 2030 was predicted. The above two variables were used as the demand to drive land use changes, leading to the calculation of the target land use types.

3. Results

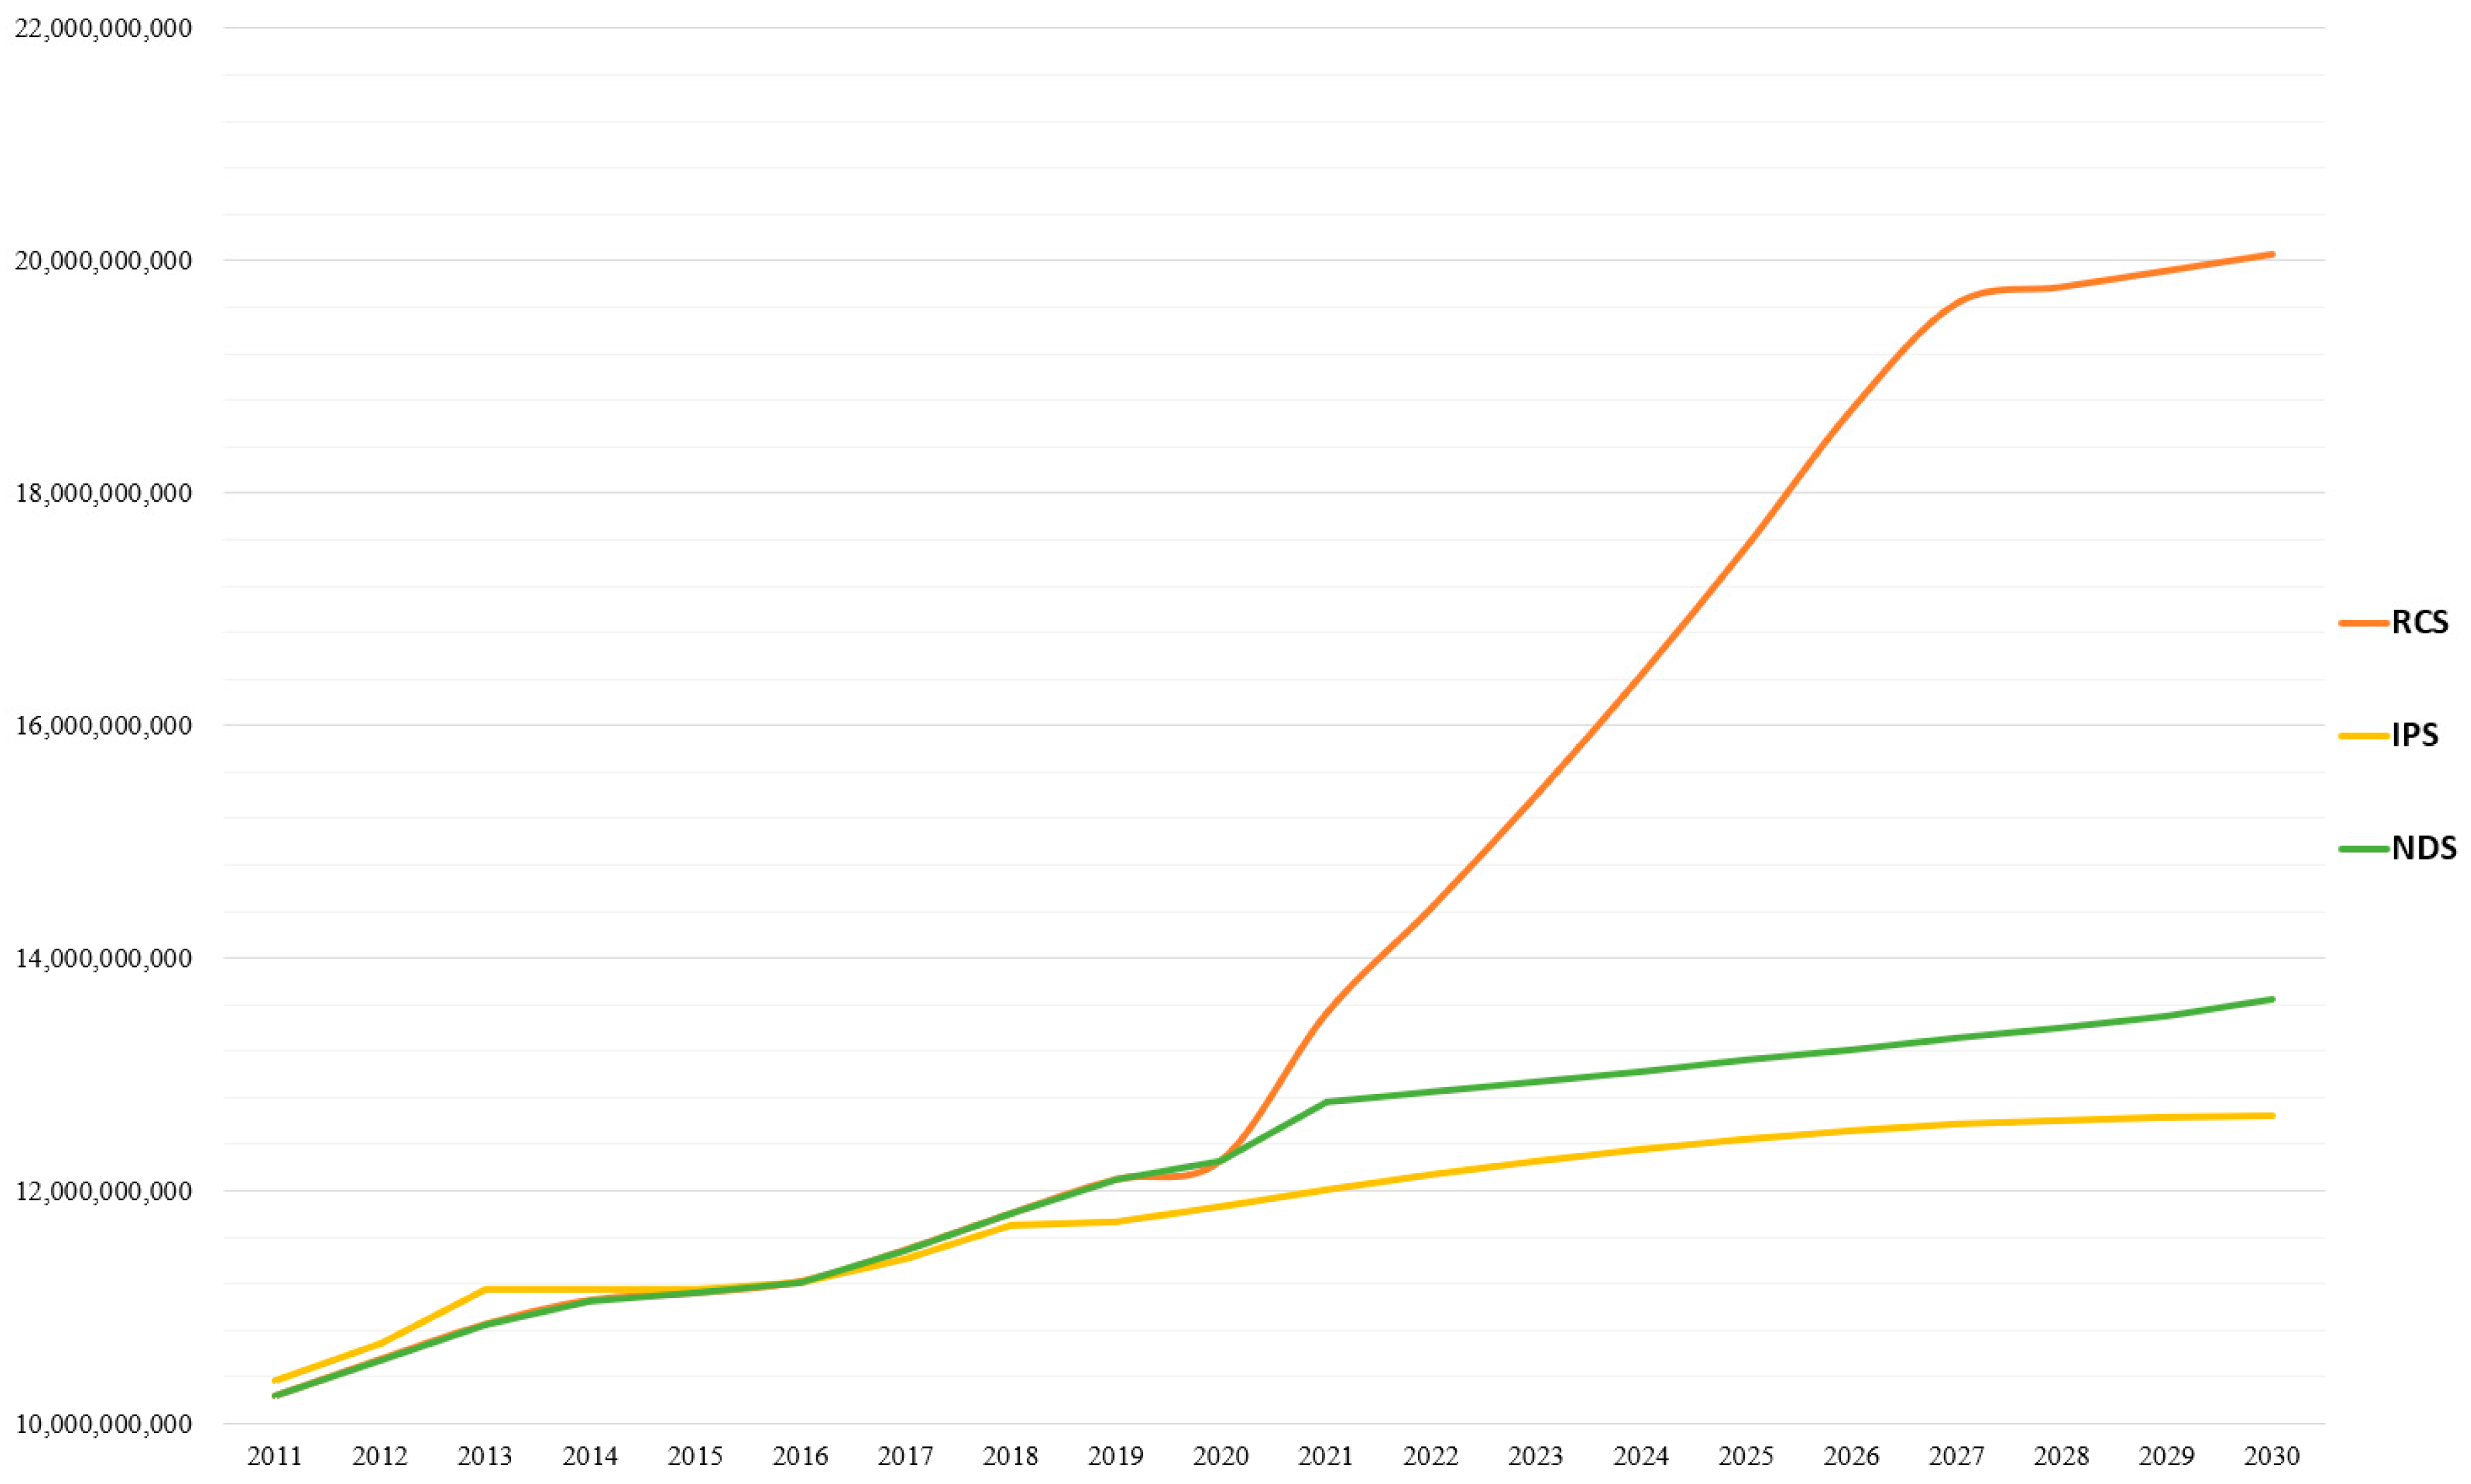
3.1. Carbon Emission Projections

The optimized IPAT model formula was used to predict and test the carbon emissions from 2011 to 2020. The carbon emission prediction results for the NDS, IPS, and RCS from 2021 to 2030 are shown in Table 2 and Figure 1. The calculation results indicate a 2% error between 2011–2020 carbon emissions calculated using the IPAT optimization and expansion model, and the national carbon emissions data in the national database. The model is highly accurate and is believed to effectively predict outcomes in 2020–2030.
In the NDS, carbon emissions are expected to continue to grow at the original growth rate, and China’s carbon emissions are expected to reach 13.64076 million tons in 2030. This reflects an average annual growth rate of 0.7%. In the NDS, carbon emissions continue to grow steadily and do not peak in 2030. This indicates that, in the absence of policy implementation, carbon emissions will rise steadily at a certain rate to meet the needs of social development. Therefore, controlling carbon emissions growth requires mandatory measures from the government. In the IPS, enterprises reasonably adjust their energy structures under the policy stimulus, and the annual growth rate of carbon dioxide emissions steadily declines. In the concerted effort, emissions peak in 2030 and stopped rising thereafter. Compared with the NDS, carbon emissions in the IPS under policy regulation decrease by 8%, indicating that the carbon peak policy has an impact. In the RCS, China’s carbon emissions in 2030 are expected to reach 2.005684 million tons, 1.47 times that of the NDS. Per capita carbon emissions increase annually, reaching more than 10 tons in 2022. Emissions then increase rapidly in 2021–2027, and slow in 2028–2030, reaching 13.83 tons in 2030. Given the changes in industrial structure, enterprises tend to use higher energy consumption per unit GDP with respect to the energy structure, resulting in energy intensity having a large impact on carbon emissions in 2021–2027. As technology advances, however, the impact of energy intensity is expected to diminish. People are expected to gradually find more effective ways to use energy and achieve peak carbon targets. If the RCS appears in real life, carbon emissions may significantly exceed those predicted for the NDS, highlighting the need to guard against reactive carbon emission scenarios.

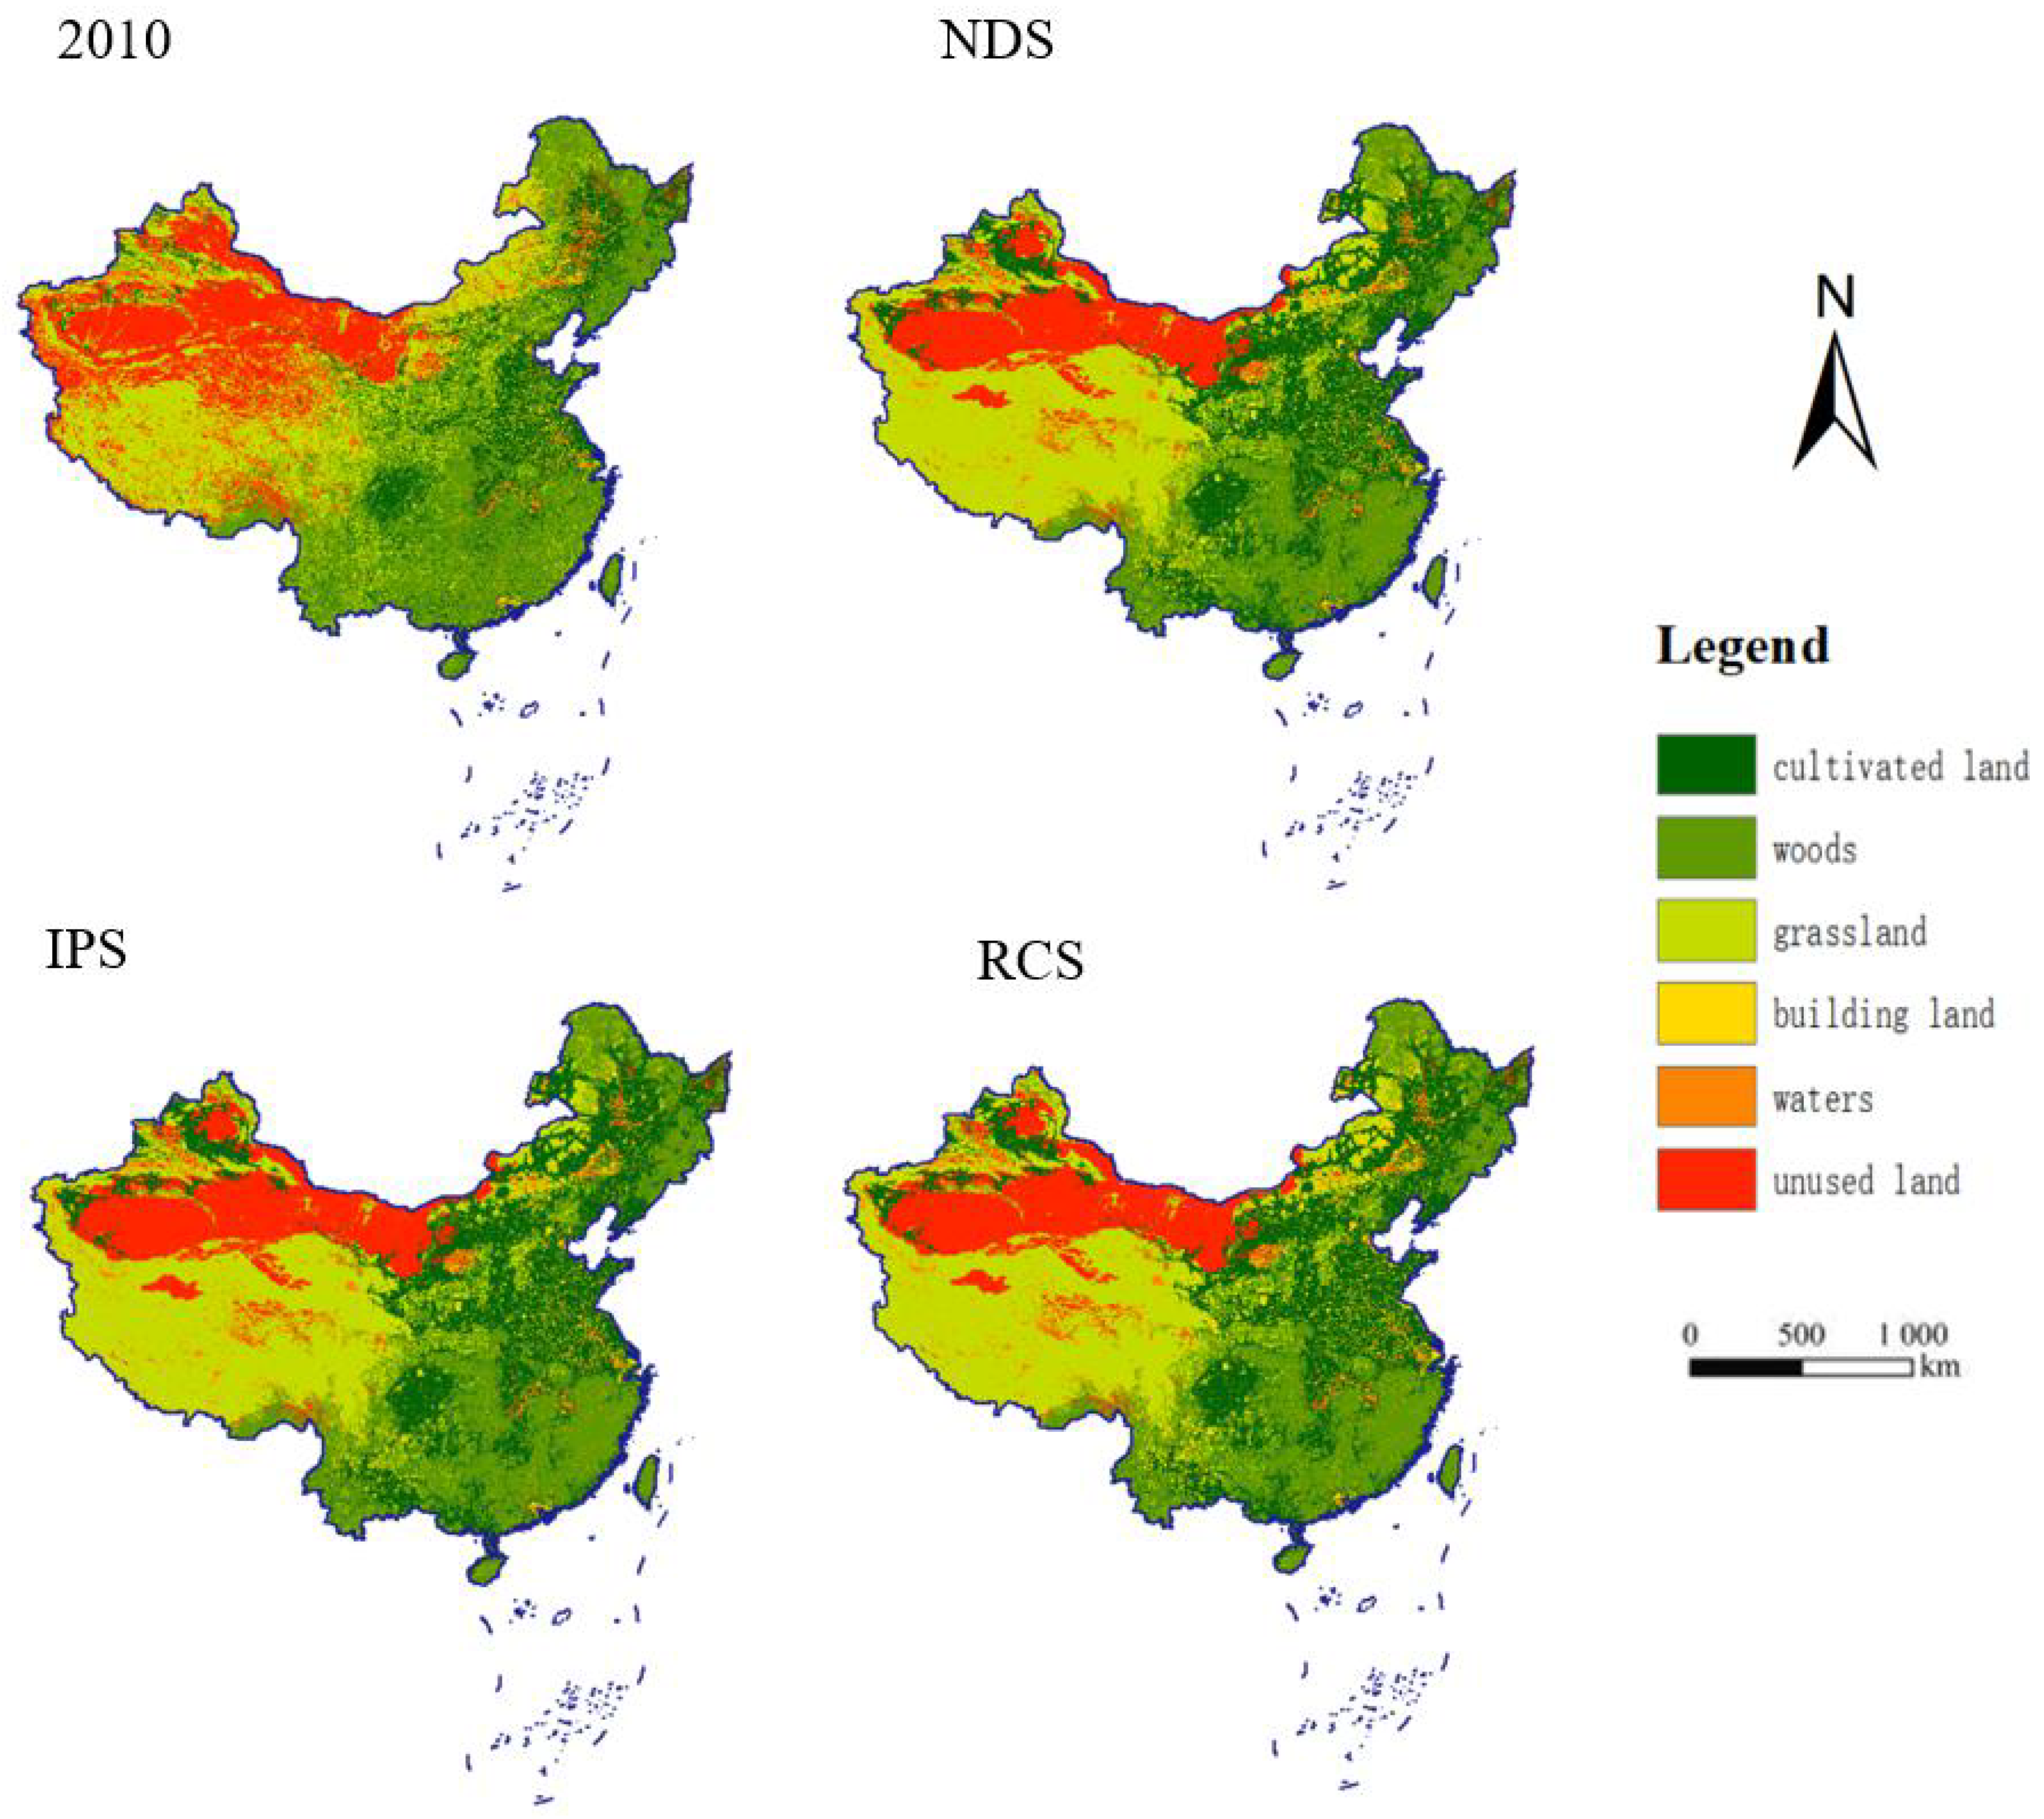
3.2. Simulation Results of Land Use Change

Figure 2 shows the state of land use in 2010 and the predicted changes in land use under the NDS, IPS, and RCS in 2030. In 2010, there were significant amounts of unused land in Northwest China and the Qinghai–Tibet Plateau. This is mainly due to the rugged terrain and large areas designated for environmental protection, which are not suitable for industrial and agricultural development. In terms of quantity, the area covered by water is expected to remain unchanged between 2015 and 2030. Compared with 2010, the total woodland and grassland areas are expected to be approximately 22% and 7% less, respectively. The area of arable land increases significantly in all three scenarios. The area of building land also increases, with an average growth of 10%.
The IPS assumes that politics works in an ideal way, leading to a slowing in the increase of land used for construction. The area of arable land continues to increase at an average rate of 2.67% per year. The IPS is more intensive than NDS, and the associated degree of land contiguity significantly improves. This closely relates to the regional division of China’s main functional areas. At the same time, the forest area in the IPS increases in South China, effectively protecting the ecological environment. In the RCS, there is an increase in the degree of land fragmentation, and building land use increases significantly. This shows that in the context of the carbon peak policy, many enterprises adjust their strategic policies to improve self-generated economic benefits, by using land to a greater extent and across a wider range. In the coastal areas of southeast China and the North China Plain, there is clear growth in building land, with building land mainly distributed in the eastern and western regions of China. By reactively delaying carbon emissions after 2030 to achieve maximize profits, enterprises may adversely affect China’s policy implementation efforts.

3.3. Land Use Change under Different Scenarios

The built-up area and carbon emission quantity requirements are not the same in the three scenarios. As such, different land use changes occur. In the three scenarios, cultivated land and building land experience an upward trend, while forest land and grassland show a downward trend. It is difficult to change water areas, so that land use is not projected to significantly change (Table 3).
Under the NDS, the cultivated land in the North China Plain and the eastern coastal areas rapidly increase, with a large area of unused land in the Qinghai–Tibet Plateau converted into forest land and grassland. From 2010 to 2030, the area of arable land rises by 50.92%, while the area of building land increases by 12.36%. This is mainly due to the conversion of unused land, forest land, and grassland. Economic and societal development increase the development of land. In the IPS, the land use experiences more complete use. Woodland and grassland are mainly converted into arable land and building land; however, the speed of change is slower compared to the NDS. This is because the steady implementation of policies makes land use types change at a relatively stable speed.
When considering the rational economic man of the enterprise, to more accurately reflect the actual situation, the RCS adjusts the energy utilization mode and energy utilization rate, compared to the IPS. In the RCS, the area of building land increases by 17.94%, 10.03%, and 5.58%, respectively, compared with IPS and NDS. That may be because companies push their industries to minimize losses from carbon curbs. Unused land also decreases significantly in this scenario, by 35.28%. The decrease in forest land and grassland area shows that China tends to not consider the ecological civilization when developing its economy. Most unused land, grassland, and forest land are converted into farmland and building land, which does not support improvements in the ecological environment. At the same time, it is important to improve the efficiency of land use, because of the problem of soil erosion and degraded land quality across a large area of China. This improvement would protect the utilization of land resources and improve the utilization efficiency of developed land.
In the NDS, the changing area of forest land and grassland is smaller compared to RCS, but the cultivated land area increases more quickly compared to RCS. This is closely related to people’s awareness of cultivated land protection. For building land area, the controls with NDS are effective compared with IPS; there are clear controls on the utilization of unused land. This shows that the carbon peak policy can play a role in carbon emission and ecological protection. However, because enterprises are expected to maximize their interests, carbon emissions may rise in the short term.
Land use changes under the three scenarios are shown in the Figure 3. The percentage represented by the bars reflects the proportion of a particular land type to the total area (marked on the left of the y-axis). The lines in the figure represent the proportion of the land use type across the national land area.

4. Discussion

4.1. Main Contributions

The carbon peak policy leads to adjustments in the strategic decisions made by government and enterprises. It also indirectly causes the change of land use intensity in time and space. Working towards the carbon peak can help coordinate the relationship between carbon emissions and economic development; however, it is important to consider the reactive actions that may be taken with respect to carbon emissions.
This paper makes four main contributions to the field.
First, previous studies on the carbon peak policy have mainly focused on predicting carbon emissions, using mathematical methods to predict the future peak. Few studies have considered different scenarios associated with achieving that carbon peak [53,54,55]. Further, few studies have considered the role of reactive emissions. This study considered three scenarios—the natural development scenario, ideal policy scenario, and reactive carbon emission scenario—to predict the possible outcomes of future carbon emissions more fully. Consistent with previous studies, this study found that carbon peak policies can effectively control carbon emissions, leading to significantly lower carbon emissions compared to natural development scenarios. Furthermore, our study found that reactive carbon increase is highly likely to occur. Because of economic benefits, enterprises may develop high-energy consumption industries and high-pollution industries before the carbon emissions peak target, to reduce the losses caused by increased carbon emission limits in a later period. The carbon peak policy leads to adjustments in carbon emissions, but it can also lead to changes in the strategic behavior of enterprises and governments. Exploring the relationship between the carbon peak policy and carbon emissions under different scenarios helps more comprehensively describe the impact of policies.
Second, past studies on land use change and carbon emissions have mainly focused on the changes in carbon emissions caused by land use. Some studies have explored changes in carbon sinks and other factors by simulating past land use changes [56,57,58]. Other studies have focused on urban expansion and population projections to explore future land use changes [59,60]. Both kinds of research provide references for future policymaking. However, to evaluate the future policy implementation effect more accurately. Therefore, this paper incorporated the carbon emissions and built-up areas into the CLUMondo model as part of the demand module. The carbon emission coefficient was quantified as the ability of all kinds of land to generate carbon emissions, allowing for the simulation of land use changes under different scenarios. This enabled the realization of both ecological and economic goals, forming a more complete simulation of the policy implementation effect.
Third, in terms of method, we used the CLUMondo model to simulate land use changes under the three scenarios, which accurately simulates land use changes according to the demand of different land use types. This paper considered four driving factors: climate, topography, accessibility, and social and economic development. A restriction layer was set to limit the conversion of some regions, making the model more realistic. This model was also applied to simulate the relationship between land development rights and land use change, by setting demand variables [20,61]. At the same time, different carbon emission coefficients of different land types were selected to distinguish the differences in the carbon emission capacity of different land types [62].
Fourth, this study considered a larger research area compared to previous research. Previous studies have mainly focused on analyzing land use changes in a certain region, with few analyses at the country level [62]. The exception has been studies focusing on small countries, such as Laos. This is because it is difficult to sort different kinds of land use data at a large scale, and there are problems with coordinate system transformation and pixel scopes that do not completely overlap. Generating a more perfect data set was the catalyst for obtaining the desired result of CLUMondo.

4.2. Study Limitations

While fully considering the possible impact of different parameters, such as the carbon emissions coefficient, this paper does have some limitations.
First, data were acquired for different land use types, based on the classification of land use status by the Chinese Academy of Sciences. This resulted in six types of land use. However, the study did not distinguish the quality of different land use types. Second, the carbon emission prediction model could be further modified through secondary classification, and by a more comprehensive consideration of the different driving factors. This should be explored in future research. Third, when simulating land use changes, the CLUMondo parameters remain somewhat subjective. Future studies should consider the impact of increased policy planning and combine CLUMondo with other models. In addition, econometric approaches (difference in difference [63] and synthetic control method [64]) and time-varying qualitative comparative analysis [65] to uncover causal complexity deserve further attempts.

5. Conclusions and Policy Recommendations

5.1. Conclusions

Land use changes are mainly manifested in changes in its quantity and distribution. Land use is likely to change under the dual influence of macro-level policies and micro-level individual behaviors. Simulating the implementation effect of policy objectives and considering the potential impacts created by policy can more realistically simulate land use changes, providing a reference for policy implementation. Therefore, based on the policy goal of “Peak Carbon 2030” and binding targets in economic development and social planning, this paper linked land use change with carbon emissions. The CLUMondo model was used to simulate the land use change under different scenarios in China in 2030. There are three main research conclusions.
First, reactive approaches to carbon emission scenarios may adversely affect carbon emissions and land use change. The carbon peak policy may limit future energy utilization. Under the assumption of the rational “economic man,” enterprises may mitigate the potential loss of future economic benefits by developing industries with high energy consumption. This would generate higher carbon emissions in 2030 compared to the NDS. We simulated the land use area and land use intensity according to the carbon emissions, and the construction and development area would be expected to significantly increase. Establishing high carbon emission points may improve the land use intensity. Changing the land use in a short time may not encourage the realization of ecological and environmental goals from a resource utilization perspective.
Second, the reactive carbon emission scenario and the ideal policy scenario result in the carbon peak policy having different policy implementation effects. If the carbon peak policy were to be successfully implemented, it could greatly reduce China’s carbon emissions, control the speed of urban development, and protect ecological civilization. In that scenario, total carbon emissions in 2030 would be lower than natural growth. However, in the process of policy implementation, enterprises may exhibit reactive carbon emission behavior. It is important to extrapolate different carbon emission scenarios based on social development factors and the energy utilization patterns of enterprises, and explore ways to avoid reactive carbon emissions from a driving factors perspective.
Third, the ideal policy scenario shows that implementing the carbon peak policy has practical significance. In addition to reducing carbon emissions, it may promote effective land resource allocations. This would achieve economic development while protecting ecological goals. At the same time, the substantial reduction of carbon emissions reflects China’s responsibilities and important role in global carbon reduction.

5.2. Policy Recommendations

A carbon peak policy is expected to change land use intensity, impacting China’s spatial planning. The research results point to three policy recommendations.
First, it is important to improve the energy mix and the way energy is used. China has a large amount of unused land and other exploitable resource reserves. This enables enterprises to achieve economic development; however, this development comes at the cost of ecological construction. Controlling the energy utilization of enterprises can reduce the negative externalities that enterprises impose on society, while obtaining economic benefits. This involves maintaining the balanced and stable growth of carbon emissions through political means. In addition, unlimited development and utilization of resources bring limited value-added benefits. Improving the ways in which enterprises use energy supports the sustainable development of those enterprises and society, and may guard against reactive emission behavior.
Second, land use and other environmental indicators should be included in policy implementation targets. The normal implementation of a carbon peak policy can reduce carbon dioxide emissions. However, without reconsidering total carbon emission limits, it may be difficult to avoid ecological damage caused by rapid urbanization in China. Setting different carbon emission targets for different regions would enable different land types to be developed based on local conditions. In addition, establishing the carbon peak policy does not mean that peak carbon emissions can increase without limit. The environmental carrying capacity of a region should drive development and construction, and sustainable development should be conducted within a controlled planning scope.
Third, it is important to strictly implement a policy of peak carbon emissions and include indicators such as carbon intensity in territorial and spatial planning. Carbon emissions are closely related to land use patterns. As such, spatial planning based on the carbon emission intensity of specific land use types can play a role in optimizing land resource allocations. Carbon emission limits can be an important consideration when facing limited land area and land intensity. When carbon emissions are included as an element of land use spatial planning in policy, they can have a real binding effect on development and planning.

Author Contributions

Conceptualization, X.N. and H.W.; methodology, Y.J.; software, X.H.; formal analysis, F.T.; investigation, J.W.; resources, Y.J.; data curation, X.H.; writing—original draft preparation, Y.J.; writing—review and editing, H.W. and X.N.; visualization, Y.J.; supervision, X.H. All authors have read and agreed to the published version of the manuscript.

Funding

This study was supported by the National Natural Science Foundation of China (Nos. 71763001 and 71973038).

Institutional Review Board Statement

Not applicable.

Informed Consent Statement

Does not apply.

Data Availability Statement

The data presented in this study are available upon request to authors.

Conflicts of Interest

The authors declare no conflict of interest.

References

  1. Gokhale, H. Japan’s carbon tax policy: Limitations and policy suggestions. Curr. Res. Environ. Sustain. 2021, 3, 100082. [Google Scholar] [CrossRef]
  2. Chepeliev, M.; Osorio-Rodarte, I.; van der Mensbrugghe, D. Distributional impacts of carbon pricing policies under the Paris Agreement: Inter and intra-regional perspectives. Energy Econ. 2021, 102, 105530. [Google Scholar] [CrossRef]
  3. Yu, P. Carbon tax/subsidy policy choice and its effects in the presence of interest groups. Energy Policy 2020, 147, 111886. [Google Scholar] [CrossRef]
  4. Zhang, S.; Wang, K.; Xu, W.; Iyer-Raniga, U.; Athienitis, A.; Ge, H.; Cho, D.W.; Feng, W.; Okumiya, M.; Yoon, G.; et al. Policy recommendations for the zero energy building promotion towards carbon neutral in Asia-Pacific Region. Energy Policy 2021, 159, 112661. [Google Scholar] [CrossRef]
  5. Zhang, W.-W.; Zhao, B.; Ding, D.; Sharp, B.; Gu, Y.; Xu, S.-C.; Xing, J.; Wang, S.-X.; Liou, K.-N.; Rao, L.-L. Co-benefits of subnationally differentiated carbon pricing policies in China: Alleviation of heavy PM2.5 pollution and improvement in environmental equity. Energy Policy 2021, 149, 112060. [Google Scholar] [CrossRef]
  6. Fu, Y.; He, C.; Luo, L. Does the low-carbon city policy make a difference? Empirical evidence of the pilot scheme in China with DEA and PSM-DID. Ecol. Indic. 2021, 122, 107238. [Google Scholar] [CrossRef]
  7. Chen, X.; Lin, B. Towards carbon neutrality by implementing carbon emissions trading scheme: Policy evaluation in China. Energy Policy 2021, 157, 112510. [Google Scholar] [CrossRef]
  8. Song, Q.; Liu, T.; Qi, Y. Policy innovation in low carbon pilot cities: Lessons learned from China. Urban Clim. 2021, 39, 100936. [Google Scholar] [CrossRef]
  9. Pan, X.; Pan, X.; Wu, X.; Jiang, L.; Guo, S.; Feng, X. Research on the heterogeneous impact of carbon emission reduction policy on R&D investment intensity: From the perspective of enterprise’s ownership structure. J. Clean. Prod. 2021, 328, 129532. [Google Scholar]
  10. Wei, S. A sequential game analysis on carbon tax policy choices in open economies: From the perspective of carbon emission responsibilities. J. Clean. Prod. 2021, 283, 124588. [Google Scholar] [CrossRef]
  11. Rustico, E.; Dimitrov, S. Environmental taxation: The impact of carbon tax policy commitment on technology choice and social welfare. Int. J. Prod. Econ. 2022, 243, 108328. [Google Scholar] [CrossRef]
  12. Liu, P.; Qiao, H. How does China’s decarbonization policy influence the value of carbon-intensive firms? Financ. Res. Lett. 2021, 43, 102141. [Google Scholar] [CrossRef]
  13. Kiss, T.; Popovics, S. Evaluation on the effectiveness of energy policies—Evidence from the carbon reductions in 25 countries. Renew. Sustain. Energy Rev. 2021, 149, 111348. [Google Scholar] [CrossRef]
  14. Zhao, P.; Deng, Q.; Zhou, J.; Han, W.; Gong, G.; Jiang, C. Optimal production decisions for remanufacturing end-of-life products under quality uncertainty and a carbon cap-and-trade policy. Comput. Ind. Eng. 2021, 162, 107646. [Google Scholar] [CrossRef]
  15. Shao, Z.; Xu, J.; Chung, C.K.L.; Spit, T.; Wu, Q. The State as Both Regulator and Player: The Politics of Transfer of Development Rights in China. Int. J. Urban Reg. Res. 2020, 44, 38–54. [Google Scholar] [CrossRef] [Green Version]
  16. Shi, H.; Chai, J.; Lu, Q.; Zheng, J.; Wang, S. The impact of China’s low-carbon transition on the economy, society, and energy in 2030 is based on CO2 emissions drivers. Energy 2022, 239, 122336. [Google Scholar] [CrossRef]
  17. Song, Y.; Chen, B.; Kwan, M.-P. How does urban expansion impact people’s exposure to green environments? A comparative study of 290 Chinese cities. J. Clean. Prod. 2020, 246, 119018. [Google Scholar] [CrossRef]
  18. Wu, H.; Fang, S.; Zhang, C.; Hu, S.; Nan, D.; Yang, Y. Exploring the impact of urban form on urban land use efficiency under low-carbon emission constraints: A case study in China’s Yellow River Basin. J. Environ. Manag. 2022, 311, 114866. [Google Scholar] [CrossRef]
  19. Yang, X.; Liu, X. Carbon conduction effect and temporal-spatial difference caused by land type transfer in Chang-Zhu-Tan urban agglomeration from 1995 to 2018. Acta Ecol. Sin. 2022. [Google Scholar] [CrossRef]
  20. Wang, H.; Lu, S.; Lu, B.; Nie, X. Overt and covert: The relationship between the transfer of land development rights and carbon emissions. Land Use Policy 2021, 108, 105665. [Google Scholar] [CrossRef]
  21. Tian, S.; Wang, S.; Bai, X.; Luo, G.; Li, Q.; Yang, Y.; Hu, Z.; Li, C.; Deng, Y. Global patterns and changes of carbon emissions from land use during 1992–2015. Environ. Sci. Ecotechnol. 2021, 7, 100108. [Google Scholar] [CrossRef]
  22. Chuai, X.; Gao, R.; Huang, X.; Lu, Q.; Zhao, R. The embodied flow of built-up land in China’s interregional trade and its implications for regional carbon balance. Ecol. Econ. 2021, 184, 106993. [Google Scholar] [CrossRef]
  23. Wu, S.; Hu, S.; Frazier, A.E. Spatiotemporal variation and driving factors of carbon emissions in three industrial land spaces in China from 1997 to 2016. Technol. Forecast. Soc. Chang. 2021, 169, 120837. [Google Scholar] [CrossRef]
  24. Huo, T.; Xu, L.; Feng, W.; Cai, W.; Liu, B. Dynamic scenario simulations of carbon emission peak in China’s city-scale urban residential building sector through 2050. Energy Policy 2021, 159, 112612. [Google Scholar] [CrossRef]
  25. Li, J.; Huang, X.; Chuai, X.; Yang, H. The impact of land urbanization on carbon dioxide emissions in the Yangtze River Delta, China: A multiscale perspective. Cities 2021, 116, 103275. [Google Scholar] [CrossRef]
  26. Zaman, K.; Moemen, M.A.-E. Energy consumption, carbon dioxide emissions and economic development: Evaluating alternative and plausible environmental hypothesis for sustainable growth. Renew. Sustain. Energy Rev. 2017, 74, 1119–1130. [Google Scholar] [CrossRef]
  27. Huang, Y.; Matsumoto, K. Drivers of the change in carbon dioxide emissions under the progress of urbanization in 30 provinces in China: A decomposition analysis. J. Clean. Prod. 2021, 322, 129000. [Google Scholar] [CrossRef]
  28. Wen, L.; Li, Z. Driving forces of national and regional CO2 emissions in China combined IPAT-E and PLS-SEM model. Sci. Total Environ. 2019, 690, 237–247. [Google Scholar] [CrossRef]
  29. Song, M.; Wang, S.; Yu, H.; Yang, L.; Wu, J. To reduce energy consumption and to maintain rapid economic growth: Analysis of the condition in China based on expended IPAT model. Renew. Sustain. Energy Rev. 2011, 15, 5129–5134. [Google Scholar] [CrossRef]
  30. Wang, C.; Wang, F.; Zhang, X.; Yang, Y.; Su, Y.; Ye, Y.; Zhang, H. Examining the driving factors of energy related carbon emissions using the extended STIRPAT model based on IPAT identity in Xinjiang. Renew. Sustain. Energy Rev. 2017, 67, 51–61. [Google Scholar] [CrossRef]
  31. Chontanawat, J. Decomposition analysis of CO2 emission in ASEAN: An extended IPAT model. Energy Procedia 2018, 153, 186–190. [Google Scholar] [CrossRef]
  32. York, R.; Rosa, E.A.; Dietz, T. STIRPAT, IPAT and ImPACT: Analytic tools for unpacking the driving forces of environmental impacts. Ecol. Econ. 2003, 46, 351–365. [Google Scholar] [CrossRef]
  33. Li, A.J.; Zhang, A.Z.; Zhou, Y.X.; Yao, X. Decomposition analysis of factors affecting carbon dioxide emissions across provinces in China. J. Clean. Prod. 2017, 141, 1428–1444. [Google Scholar] [CrossRef]
  34. Zhou, J.; Wang, Y.; Liu, X.; Shi, X.; Cai, C. Spatial-temporal differences of provincial carbon emissions and carbon compensation in China based on land use change. Geogr. Sci. 2019, 39, 1955–1961. (In Chinese) [Google Scholar]
  35. Bart, I.L. Urban sprawl and climate change: A statistical exploration of cause and effect, with policy options for the EU. Land Use Policy 2010, 27, 283–292. [Google Scholar] [CrossRef]
  36. Siikamäki, J.; Newbold, S.C. Potential Biodiversity Benefits from International Programs to Reduce Carbon Emissions from Deforestation. Ambio 2012, 41, 78–89. [Google Scholar] [CrossRef] [Green Version]
  37. Ostle, N.; Levy, P.; Evans, C.; Smith, P. UK land use and soil carbon sequestration. Land Use Policy 2009, 26, S274–S283. [Google Scholar] [CrossRef]
  38. Hutyra, L.R.; Yoon, B.; Hepinstall-Cymerman, J.; Alberti, M. Carbon consequences of land cover change and expansion of urban lands: A case study in the Seattle metropolitan region. Landsc. Urban Plan. 2011, 103, 83–93. [Google Scholar] [CrossRef]
  39. Feng, Y.; Chen, S.; Tong, X.; Lei, Z.; Gao, C.; Wang, J. Modeling changes in China’s 2000–2030 carbon stock caused by land use change. J. Clean. Prod. 2020, 252, 119659. [Google Scholar] [CrossRef]
  40. Yang, X.; Zheng, X.-Q.; Lv, L.-N. A spatiotemporal model of land use change based on ant colony optimization, Markov chain and cellular automata. Ecol. Model. 2012, 233, 11–19. [Google Scholar] [CrossRef]
  41. Verburg, P.H.; de Koning, G.H.J.; Kok, K.; Veldkamp, A.T. A spatial explicit allocation procedure for modelling the pattern of land use change based upon actual land use. Ecol. Model. 1999, 116, 45–61. [Google Scholar] [CrossRef]
  42. Van Gossum, P.; Arts, B.; van Laar, J.; Verheyen, K. Implementation of the forest expansion policy in the Netherlands in the period 1986–2007: Decline in success? Land Use Policy 2010, 27, 1171–1180. [Google Scholar] [CrossRef]
  43. Jiang, W.; Deng, Y.; Tang, Z.; Lei, X.; Chen, Z. Modelling the potential impacts of urban ecosystem changes on carbon storage under different scenarios by linking the CLUE-S and the InVEST models. Ecol. Model. 2017, 345, 30–40. [Google Scholar] [CrossRef]
  44. Wilson, S.; Schuster, R.; Rodewald, A.; Bennett, J.; Smith, A.; La Sorte, F.; Verburg, P.; Arcese, P. Prioritize diversity or declining species? Trade-offs and synergies in spatial planning for the conservation of migratory birds in the face of land cover change. Biol. Conserv. 2019, 239, 108285. [Google Scholar] [CrossRef]
  45. Li, L.; Yang, J. A new method of energy-related carbon dioxide emissions estimation at the provincial-level: A case study of Shandong Province, China. Sci. Total Environ. 2020, 700, 134384. [Google Scholar] [CrossRef]
  46. Zhou, D.; Li, Z.; Wang, S.; Tian, Y.; Zhang, Y.; Jiang, G. How does the newly urban residential built-up density differ across Chinese cities under rapid urban expansion? Evidence from residential FAR and statistical data from 2007 to 2016. Land Use Policy 2021, 104, 105365. [Google Scholar] [CrossRef]
  47. Zhang, P.; Yang, D.; Qin, M.; Jing, W. Spatial heterogeneity analysis and driving forces exploring of built-up land development intensity in Chinese prefecture-level cities and implications for future Urban Land intensive use. Land Use Policy 2020, 99, 104958. [Google Scholar] [CrossRef]
  48. Li, G.; Wei, W. Financial development, openness, innovation, carbon emissions, and economic growth in China. Energy Econ. 2021, 97, 105194. [Google Scholar] [CrossRef]
  49. Fang, J.; Guo, Z.; Piao, S.; Chen, A. Terrestrial vegetation carbon sinks in China, 1981–2000. Sci. China Ser. D Earth Sci. 2007, 50, 1341–1350. [Google Scholar] [CrossRef]
  50. Van Asselen, S.; Verburg, P.H. Land cover change or land-use intensification: Simulating land system change with a global-scale land change model. Glob. Chang. Biol. 2013, 19, 3648–3667. [Google Scholar] [CrossRef]
  51. Jin, G.; Chen, K.; Wang, P.; Guo, B.; Dong, Y.; Yang, J. Trade-offs in land-use competition and sustainable land development in the North China Plain. Technol. Forecast. Soc. Chang. 2019, 141, 36–46. [Google Scholar] [CrossRef]
  52. Connor, J.D.; Bryan, B.A.; Nolan, M.; Stock, F.; Gao, L.; Dunstall, S.; Graham, P.; Ernst, A.; Newth, D.; Grundy, M.; et al. Modelling Australian land use competition and ecosystem services with food price feedbacks at high spatial resolution. Environ. Model. Softw. 2015, 69, 141–154. [Google Scholar] [CrossRef]
  53. Brabec, E.; Smith, C. Agricultural land fragmentation: The spatial effects of three land protection strategies in the eastern United States. Landsc. Urban Plan. 2002, 58, 255–268. [Google Scholar] [CrossRef] [Green Version]
  54. Wang, H.; Tao, R.; Tong, J. Trading land development rights under a planned land use system: The “Zhejiang Model”. China World Econ. 2009, 17, 66–82. [Google Scholar] [CrossRef]
  55. Linkous, E.R.; Chapin, T.S. TDR Program Performance in Florida. J. Am. Plan. Assoc. 2014, 80, 253–267. [Google Scholar] [CrossRef]
  56. Neeff, T.; Graça, P.M.D.A.; Dutra, L.V.; Freitas, C.D.C. Carbon budget estimation in Central Amazonia: Successional forest modeling from remote sensing data. Remote Sens. Environ. 2005, 94, 508–522. [Google Scholar] [CrossRef]
  57. Xu, Q.; Yang, R.; Dong, Y.-X.; Liu, Y.-X.; Qiu, L.-R. The influence of rapid urbanization and land use changes on terrestrial carbon sources/sinks in Guangzhou, China. Ecol. Indic. 2016, 70, 304–316. [Google Scholar] [CrossRef]
  58. Ali, G.; Pumijumnong, N.; Cui, S. Valuation and validation of carbon sources and sinks through land cover/use change analysis: The case of Bangkok metropolitan area. Land Use Policy 2018, 70, 471–478. [Google Scholar] [CrossRef]
  59. Geoghegan, J.; Lawrence, D.; Schneider, L.C.; Tully, K. Accounting for carbon stocks in models of land-use change: An application to Southern Yucatan. Reg. Environ. Chang. 2010, 10, 247–260. [Google Scholar] [CrossRef]
  60. Mannan, A.; Liu, J.; Zhongke, F.; Khan, T.U.; Saeed, S.; Mukete, B.; ChaoYong, S.; Yongxiang, F.; Ahmad, A.; Amir, M.; et al. Application of land-use/land cover changes in monitoring and projecting forest biomass carbon loss in Pakistan. Glob. Ecol. Conserv. 2019, 17, e00535. [Google Scholar] [CrossRef]
  61. Malek, Ž.; Verburg, P. Adaptation of land management in the Mediterranean under scenarios of irrigation water use and availability. Mitig. Adapt. Strat. Glob. Chang. 2018, 23, 821–837. [Google Scholar] [CrossRef] [PubMed]
  62. Dong, F.; Bian, Z.; Yu, B.; Wang, Y.; Zhang, S.; Li, J.; Su, B.; Long, R. Can land urbanization help to achieve CO2 intensity reduction target or hinder it? Evidence from China. Resour. Conserv. Recycl. 2018, 134, 206–215. [Google Scholar] [CrossRef]
  63. Nie, X.; Wu, J.; Chen, Z.; Zhang, A.; Wang, H. Can environmental regulation stimulate the regional Porter effect? Double test from quasi-experiment and dynamic panel data models. J. Clean Prod. 2021, 314, 128027. [Google Scholar] [CrossRef]
  64. Nie, X.; Wu, J.; Zhang, W.; Zhang, J.; Wang, W.; Wang, Y.; Luo, Y.; Wang, H. Can environmental regulation promote urban innovation in the underdeveloped coastal regions of western China? Mar. Pol. 2021, 133, 104709. [Google Scholar] [CrossRef]
  65. Nie, X.; Wu, J.; Wang, H.; Li, L.; Huang, C.; Li, W.; Wei, Z. Booster or Stumbling Block? The Role of Environmental Regulation in the Coupling Path of Regional Innovation under the Porter Hypothesis. Sustainability 2022, 14, 2876. [Google Scholar] [CrossRef]
Figure 1. Carbon emission projections for the three scenarios.
Land 11 00573 g001
Figure 2. CLUMondo simulation of land use change.
Land 11 00573 g002
Figure 3. Land use changes under three scenarios. (Unit: hm2).
Land 11 00573 g003
Table 1. Carbon emission coefficient of each land use type.
Land Use TypesCarbon Emission Coefficient (tC/ha)Data Sources
Cultivated land0.0422Lai L (2010)
Woods (Forest land)−0.0578Lai L (2010)
Grassland−0.0021Fang et al. (2007)
Building (Construction) land4.2970Duan et al. (2008)
Water areas−0.0252Fang et al. (2007)
Unused land−0.0005Lai L (2010)
A positive number indicates that the land use type produces carbon dioxide. A negative number indicates that the land use type absorbs carbon dioxide.
Table 2. Carbon emissions under different scenarios 2020–2030. (Unit: 10,000 tons).
YEARNDSIPSRCS
20201,225,6381,185,6401,225,638
20211,275,6731,200,4931,351,896
20221,284,7221,213,7841,442,836
20231,293,8361,225,5101,539,893
20241,303,0141,235,6731,643,479
20251,312,3341,244,2731,754,033
20261,321,6431,251,3091,872,024
20271,331,0181,256,7811,963,599
20281,340,4601,260,6901,977,528
20291,349,9691,263,0361,991,556
20301,364,0761,263,8182,005,684
Table 3. Changes in the areas of different land types under NDS, IPS, and RCS (Unit: hm2).
Land Use TypeNDSIPSRCS
Cultivated land711,981723,599706,976
Woods (Forestland)499,288501,317493,552
Grassland748,264754,666738,621
Building (Construction) land112,05591,036138,363
Water areas80,70280,70280,697
Unused land361,087562,057355,178
Publisher’s Note: MDPI stays neutral with regard to jurisdictional claims in published maps and institutional affiliations.

