Article

Disturbances Brought about by Human Activities in Relation to the Eco-Environment of the Main Stream of the Tarim River, 2000–2020

1
School of Architecture and Urban Planning, Guangdong University of Technology, Guangzhou 510090, China
2
Key Laboratory of Urban Land Resources Monitoring and Simulation, Ministry of Natural Resources, Shenzhen 518034, China
3
School of Geography and Geomatics Engineering, Suzhou University of Science and Technology, Suzhou 215011, China
4
Faculty of Geography, Yunnan Normal University, Kunming 650500, China
*
Author to whom correspondence should be addressed.
Land 2022, 11(3), 424; https://doi.org/10.3390/land11030424
Submission received: 30 January 2022 / Revised: 28 February 2022 / Accepted: 3 March 2022 / Published: 15 March 2022
(This article belongs to the Special Issue The Eco-Environmental Effects of Urban Land Use)

Abstract

:
The main stream of the Tarim River in China is typical of ecologically sensitive areas that have been heavily disturbed by human activities; as such, the monitoring of the quality of its eco-environment constitutes an important task for researchers. By using GlobeLand30 data and applying the disturbance degree model and revised ecosystem service value (ESV) model, the study presented in this paper undertook a quantitative estimation of the effects of the disturbance impacts of human activities on the eco-environment of this area in the period of 2000 to 2020. The main conclusions are as follows: (1) disturbance index values, which reflect disturbance to the local ecosystem by human activities, increased over the study period. Further, cultivated land experienced the largest increase, which, in turn, brought about the most significant disturbance to the eco-environment. High disturbance index values presented a patchy distribution in the west of the main stream of the Tarim River and formed bands and dots in the east; the area of land characterized by high and moderate disturbance index values increased, with growth areas taking on a scattered distribution of patches, bands, and dots without significant spatial continuity. (2) The total ESV increased, indicating the quality of the eco-environment improved. The increase of cultivated land offset the increase in ESV, which counteracted the effects of ecological governance measures. Areas with high ESV values were mainly located in the western and central parts of the study area, while low values were found in the middle east and east. Areas with higher increases in ESV were mainly located in the western and the western part of the middle reaches and took on a zonal distribution, while areas of decrease followed a scattered distribution, presenting as dots or patches. Using the quantitative analysis methods and high-resolution remote sensing data to evaluate the changes in the eco-environment was considered as the innovation of this study, and the findings are useful in exploring the influence of human activities on ecosystems and evaluating the eco-environment in the minor watershed of an arid area. This piece of quantitative research contributes to the task of monitoring eco-environmental changes using remote sensing techniques in ecologically sensitive areas.

1. Introduction

In September 2015, the United Nations (UN) unveiled the 2030 Sustainable Development Goals (SDGs), which include 17 categories and 169 specific goals [1]. The fifteenth category goal addresses “the sustainable use of terrestrial ecosystems,” emphasizing the need for monitoring and protection of typical ecological regions and sensitive regions and highlighting the importance of studying the eco-environmental effects of major land-cover changes [2]. The main stream of the Tarim River in China is typical of the ecologically vulnerable regions mentioned within the SDGs: here, human activities, and, in particular, the excessive and disorderly reclamation of wastelands since the mid-20th century, which consumes a great deal of irrigation water [3] and exacerbates drought [4], have caused considerable disturbances to and destruction of the eco-environment [5]. Having approved a comprehensive governance plan for the Tarim River Area in 2001, China’s State Council engaged in a program of comprehensive governance over the area for more than 10 years; the effects of these controls have attracted much attention within China [6]. In 2009, a research group at the Chinese Academy of Engineering (CAE) carried out a special evaluation of the effects of the Tarim River Area governance program, concluding that, whilst the eco-environment had generally improved, destructive human behavior—in particular, the disorderly reclamation of wasteland—had still not been effectively restrained [7]. In order to further study the effects of governance in relation to the Tarim River Area, researchers have tried to use “earth observation” methods, as well as the concepts of “disturbance” and “ecosystem service value” (ESV) in evaluation indexes, in order to conduct assessment and change monitoring in ways that combine qualitative, quantitative, and positioning research [8]. This previous assessment addressed data from before 2005, and updated research is needed.
“Disturbance” is a concept that has been developed within the field of ecology in order to describe events that affect a given ecosystem beyond its normal range and in such a way that the system cannot recover and the nature of the system changes [9]. Disturbances can be divided into natural disturbances and human disturbances, and it is this latter category—wherein nature is transformed as the result of a purposeful human behavior, such as bringing a wasteland into cultivation, deforestation, grazing, agricultural activities, land-use structure change, and so on—that is addressed in this paper [10]. From a human viewpoint, human activities are productive and are not generally thought of as disturbances, but, for natural ecosystems, “what humans do” clearly constitutes a form of disturbance [11]. Studying the impact of human land-use activities on biodiversity conservation services in a range of different ecosystems, Zhao et al. constructed an integrated human–ecosystem disturbance index, using it to analyze the disturbances wrought by land-use changes in key areas of biodiversity conservation in China during the period of 1990 to 2010 [12]. Using SPOT-5 image data and applying both a landscape pattern index and GIS spatial analysis methods, Xu et al. analyzed dynamic changes in the landscape pattern and the degree of human disturbance in the Pearl River Delta [13]. Further, Grondin et al. [14] and Thiffault et al. [15] both studied the disturbance effects of the natural environment and climate change on forests in Quebec, Canada. In relation to arid areas, we further note the study by Zhang and Wang [16], which analyzed the disturbance characteristics of the background surface processes that occur in desert areas on oasis ecosystems. Whilst these existing studies have mainly addressed natural disturbances, such as fire [17], earthquake [18], and drought [19], less attention has been paid to human disturbances, and, where this has been addressed, researchers have mainly been concerned with the disturbance caused by a single factor rather than undertaking the comprehensive study of several factors [20]. This omission is evident in the existing literature addressing the main stream of the Tarim River, where single-factor natural disturbances have also constituted the main object of research, while comprehensive human disturbance remains under-represented in the research. Chinese research, further, has tended to be concentrated in the central and eastern regions of the country [21] and some other small watersheds [22], while the arid and semi-arid areas have received significantly less attention.
The disturbance brought about by human activities causes changes in a given ecosystem’s “ecosystem services value” (ESV), a measure that refers to the life support products and services obtained directly or indirectly through the structure, process, and function of the ecosystem [23,24]. Increasing ESV levels indicate improvement in the quality of the eco-environment, and vice versa [25]. By using remote sensing measures to extract and reveal land cover changes, ESV change can be estimated; this constitutes an important method in eco-environmental assessment [26]. The basic idea in such an approach is to calculate the ESV of a single land cover category, based on the ESV coefficient of different land cover categories, and then estimate the ESV of the region after weighting. Costanza et al. established ESV coefficients for cultivated land, forest, and other land cover categories and, by applying global land cover data with 1° resolution, were able to calculate global ESV levels for the first time [27]. Whilst this approach pioneered ESV evaluation methods in relation to land cover measures, many scholars have questioned the global use of the same coefficient to study geographically diverse areas. In order to make up for this deficiency, Xie et al. [28] conducted an exercise in downscaling the ESV in response to Chinese conditions using a 1 hm2 national average yield of farmland for the annual economic value of natural grain and then developing an equivalent factor table and revision method in order to enrich the ESV model and make it more suitable for China [29]. In a study addressing the eco-environmental effects of land cover change in the arid area of Xinjiang, Huang et al. applied remote sensing data at a 1-km resolution in order to calculate the correction value of the ESV coefficient in Costanza’s model in relation to the grain yield of the period 1998 to 2008, finding that the transformation of grassland to cultivated land was the primary reason for the deterioration of the eco-environment in Xinjiang [30]. In addition, according to the market value of grain crop production services, Bai et al. [31] revised the “China land ESV coefficient” proposed by Xie et al. [28], finding that the ESV of forest and water bodies was greatest in the main stream of the Tarim River and that the ESV followed a gradient distribution that ranged from high to low as one moved downstream. On the whole, the studies motioned above were conducted under the framework set out by Costanza, with ESV coefficients being revised in relation to the conditions of the given study area. Scholars have faced four main problems in using the ESV method to assess and monitor the eco-environment of the main stream of the Tarim River, namely: (1) the study period failed to cover the time between the start of the ecological governance project and the research survey by CAE (2001–2009) and thus could not evaluate the effectiveness of the governance strategy [31]; (2) most of the study areas have either constituted larger scale arid and semi-arid regions or been located in Northwest China or Xinjiang, neither of which can reflect the specific situation with respect to the ESV of the typical ecological area of the main stream of the Tarim River [32]; (3) a 300-m or 1-km resolution in remote sensing data has restricted the accuracy of the research results [33,34]; and (4) various ESV coefficients were used [31,35].
Based on the above analysis, by applying GlobeLand30 data, the study detailed in the present paper used a disturbance degree model and revised ESV model in order to quantitatively calculate the degree of disturbance caused by human activities on the main stream of the Tarim River and the effects of that disturbance on ESV levels between 2000 and 2020. Using the quantitative analysis methods and high-resolution remote sensing data to evaluate eco-environment change was considered as the innovation of the present paper; it is hoped that our results provide new concepts and means for analyzing and evaluating the effects of governance strategies in relation to the main stream of the Tarim River.
The remainder of this article is organized according to the following structure. In Section 2, the study area, the dataset for model implementation, and the methodology are introduced. In Section 3, the spatiotemporal results of the disturbance of human activities and the influence of human activities on the ESV in the main stream of the Tarim River are analyzed. Section 4 presents a discussion of the data, methods, and the differences of our results compared to those of others. Finally, the conclusions are presented in Section 5.

2. Materials and Methods
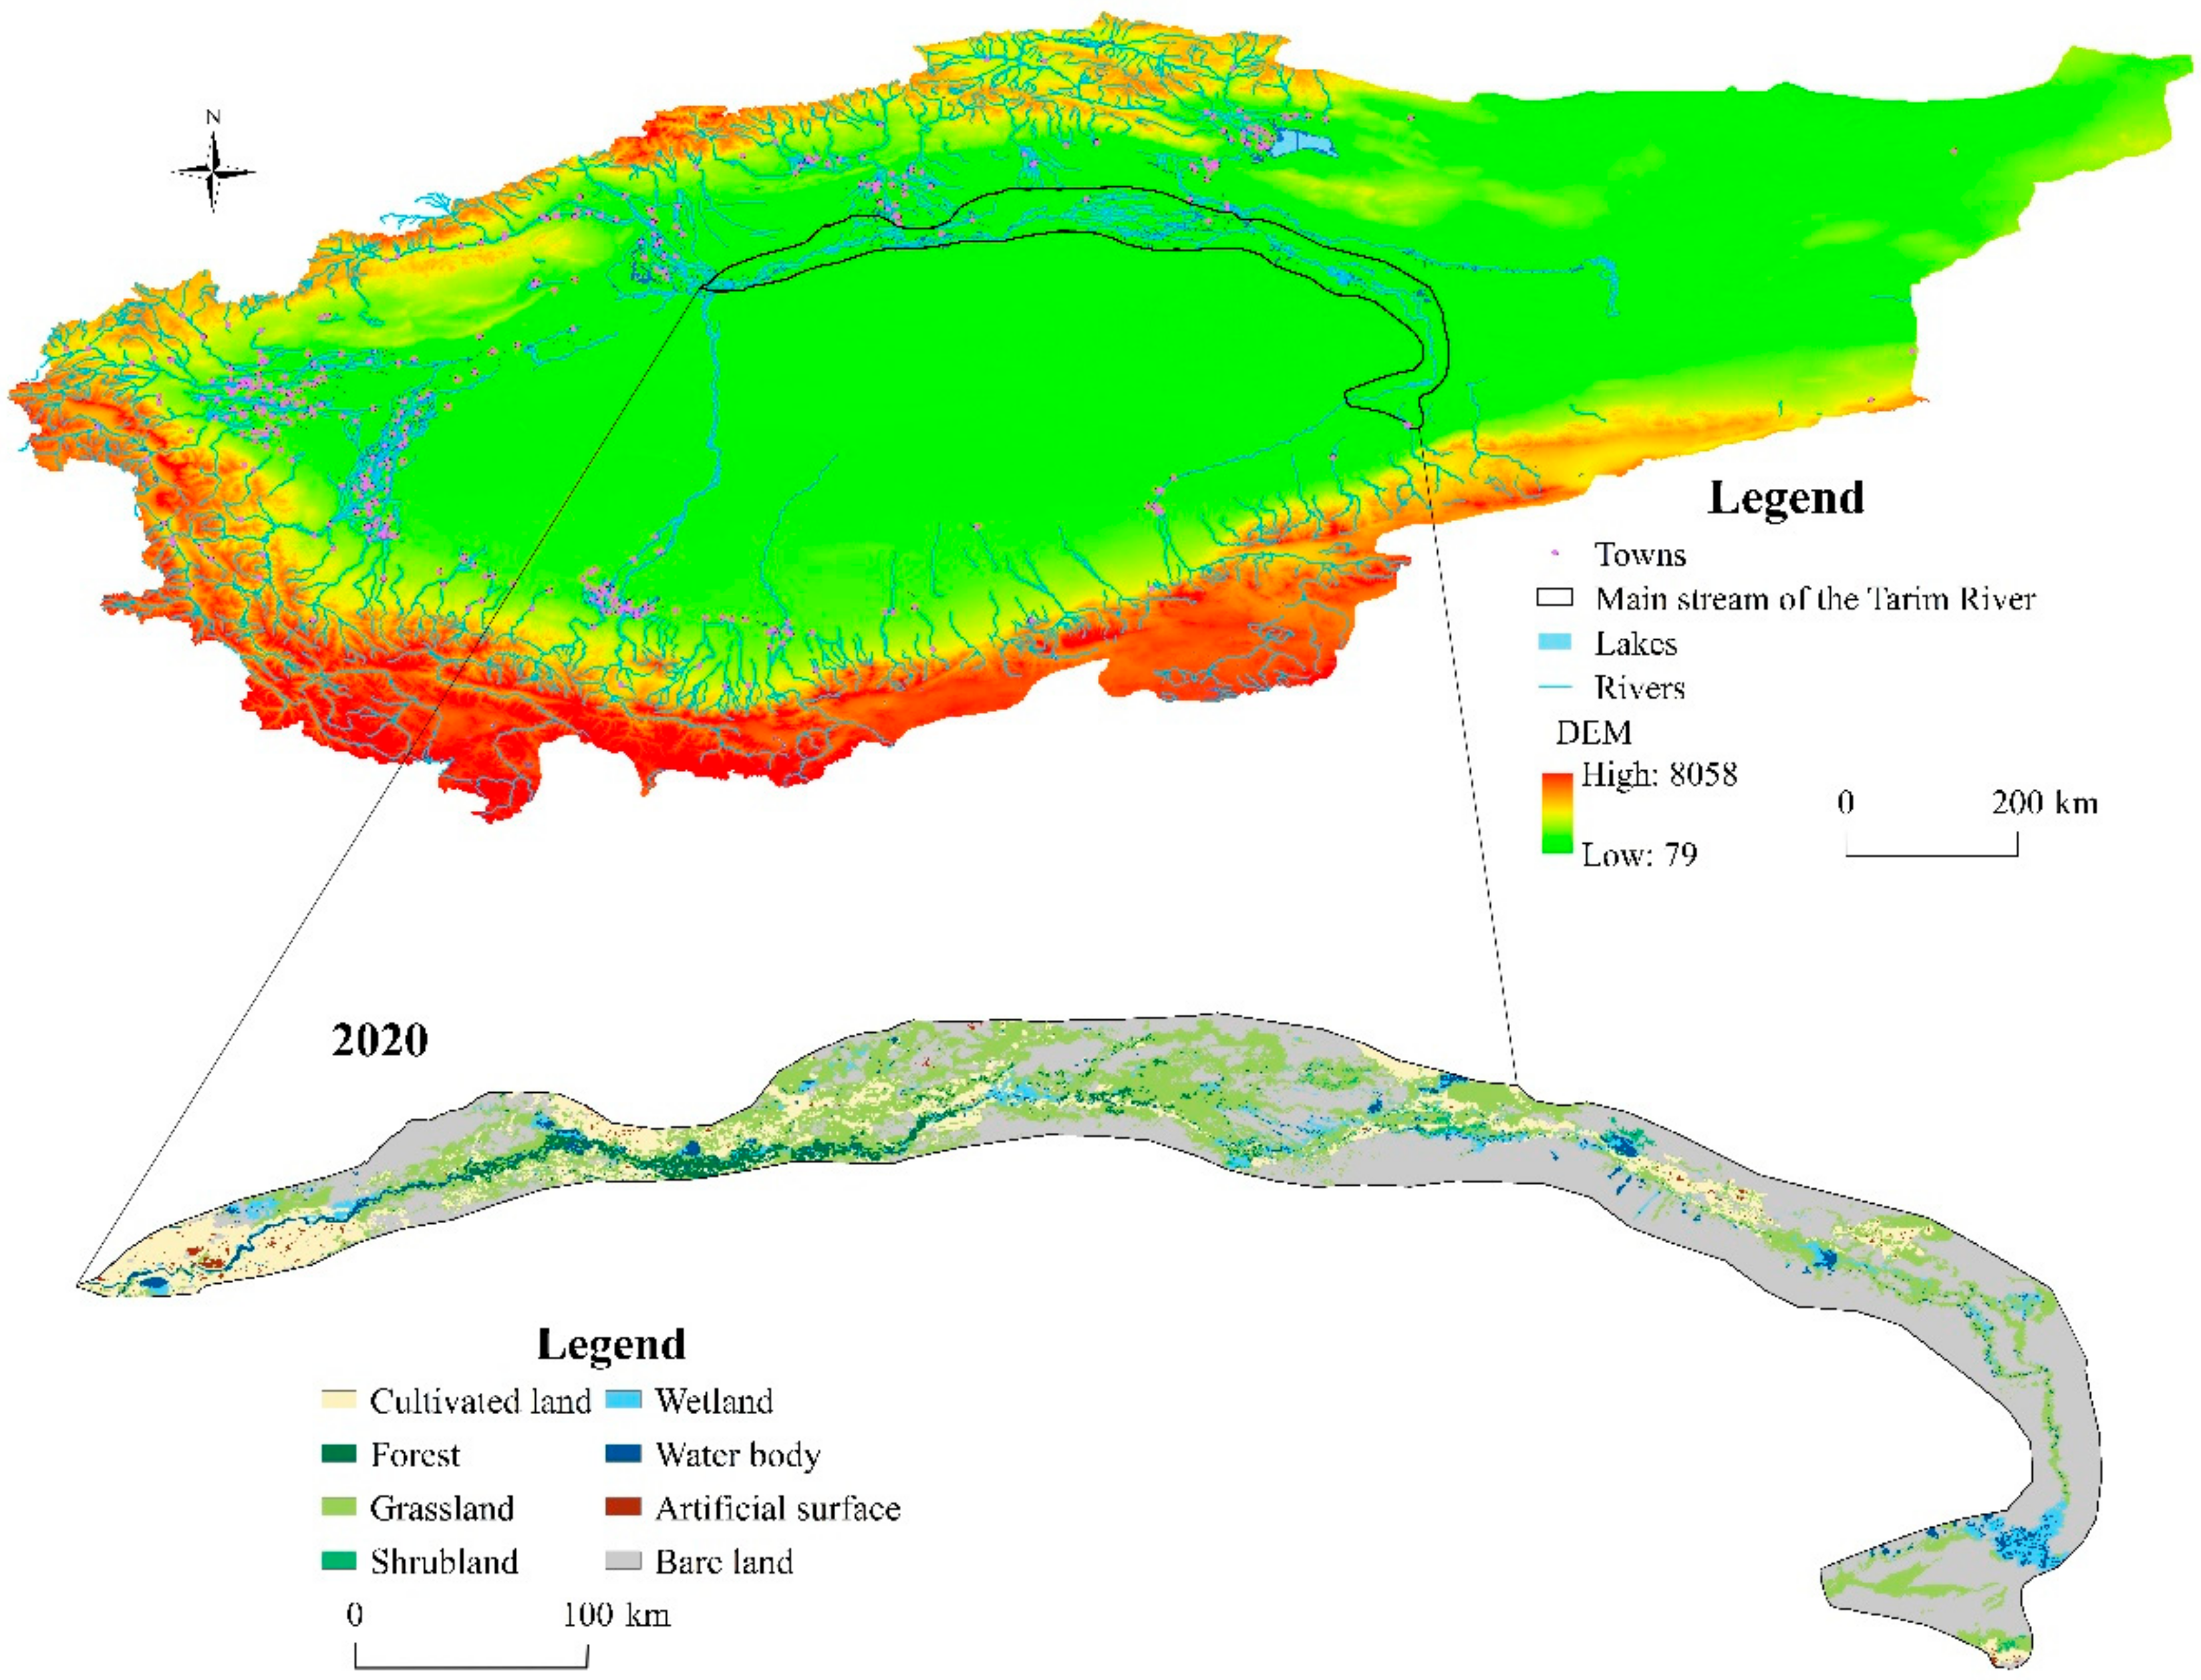
2.1. Study Area

The main stream of the Tarim River is located in the southeastern part of Xinjiang in China. Its full length is 1321 km, and it runs from the confluence of the Aksu, Hetian, and Yarkand Rivers in Xiaojiake to the Taitema Lake (Figure 1), making it the longest continental river in China [36]. The river also famously traverses a range of arid and semi-arid regions, making it an important representative object of study for research into ecologically sensitive areas under the framework of the UN’s SDGs. According to the scope delimited by Wu [37], the main stream of the Tarim River passes through all or part of the counties of Ruoqiang, Weili, Kuerle, Luntai, Kuche, Shaya, Aksu, and Awati, taking in a total area of about 34,000 km2. The main stream of the Tarim River belongs to the extreme arid climate of the continental warm temperate zone, with an annual average temperature of 10.7 °C, an annual average precipitation of 17.4–42.8 mm, and an evaporation capacity that reaches 1121–1636 mm, making it an extremely arid area, with a drought index of 28–80 [31]. Desert, grassland, and cultivated land constitute the main categories of land cover in the main stream of the Tarim River. Water resources are limited, and this is the main constraint experienced by the eco-environment.

2.2. Data

Several types of data are referred to in this paper. Firstly, the study used vector data for the boundary of the main stream of the Tarim River [38]. Secondly, we used land cover data for the three baseline years of 2000, 2010, and 2020, which were obtained from GlobeLand30. GlobeLand30 is a recent product with a much higher resolution (30 m) than previous packages [39], which was developed by means of a pixel classification–object abstraction–knowledge check (POK) method. Thirdly, we also used remote sensing images, which were primarily obtained from Landsat Thematic Mapper (TM) and Enhanced TM plus (ETM+) satellites, for the years 2000, 2010, and 2020. Fourthly, we also used images from the Chinese Environmental and Disaster (HJ-1) satellite [40]. This dataset includes ten types of land cover—namely cultivated land, forests, grassland, shrub land, wetlands, water bodies, tundra, artificial surfaces, bare land, and permanent snow/ice—and has been widely used in academic research [41]. Eight categories of land cover are present in the main stream of the Tarim River: cultivated land, forests, grassland, shrub land, wetlands, water bodies, artificial surfaces, and bare land.

2.3. Methods

2.3.1. Disturbance Degree Model

Different human activities evidence different degrees of utilization in relation to different kinds of ecosystems; as such, they also differ in terms of the degree of disturbance that they produce. Land that is “unused” for human activities tends to have a low disturbance degree, land that is “used” has a higher disturbance degree, and land that is “useable” falls between the two other categories [12]. Based on this idea, we undertook an exercise in downscaling that combined the conditions faced in relation to the main stream of the Tarim River with the disturbance degree of human activities to this area [42]. Since human activities have more serious consequences for water and wetland ecosystems, the values of the disturbance grading index were raised (Table 1).
The degree of disturbance caused by human activities to various ecosystems differs throughout the main stream of the Tarim River. Weighted summation was carried out in order to obtain a total value ranging from 1 to 5 [12]. The total value was then standardized to a value between 0 and 1 as follows:
D = i = 1 5 X i × Y i / 5 / i = 1 5 Y i
where D is the comprehensive disturbance caused by human activities on ecosystems (referred to as “the disturbance index”); its values range from 0–1; Xi is the disturbance index levels of ecosystem type i; Yi is the area proportion of ecosystem type i. A higher disturbance index value indicates a higher level of human disturbance and, consequently, a higher threat to the local ecosystem in terms of human activities.
The measures “disturbance index change extent” and “disturbance index change intensity” are used to describe human activities’ influence on an ecosystem [12]. In this study, the change extent measure was defined as the change value of the disturbance index within a certain period of time, and change intensity was defined as the change ratio of the disturbance index over a ten-year study period. These were calculated as follows:
C i , j = D j D i
R i , j = C i , j / D i × 100 %
where Di and Dj are disturbance index values for the years i and j, C(i,j) is the change extent of disturbance index values during the period spanning year i to year j. R(i,j) is the change intensity of disturbance index values during the period from year i to year j.

2.3.2. The Revised ESV Model

We downscaled the ESV model proposed by Costanza et al. [27] and improved by Xie et al. [28], tailoring the model to reflect the characteristics of the main stream of the Tarim River in order to evaluate the ESV of this ecologically sensitive area. The formula for the model is:
Eij = eijEa
In Equation (4), Eij is the value of ecosystem service function for type i and land cover category j (Yuan/hm2); eij is value of ecosystem service function for type i and land cover category j for the equivalent factor of ecosystem service unit price relative to cultivated land landscape; and Ea is the economic value of unit area cultivated land providing food production services (Yuan/hm2).
E S V = i = 1 9 j = 1 8 A j E i j
In Equation (5), ESV is the total ecosystem service value; Aj is the area (hm2) of land cover category j; Eij is the value of ecosystem service function for type i and land cover category j (Yuan/hm2); i is the type of ecosystem service function; and j is the land cover category.
Referring to the ecosystem services per unit area developed for application in China by Xie et al. [28] and combining this with an ecological system correction coefficient for the different ecological types present in the main stream of the Tarim River [43], which are shown in Table 2, we were able to calculate an equivalent factor table for ESV that accorded with the conditions of the subject site (Table 3).
The ESV equivalent factor refers to the ability of an ecosystem to produce ecological services, and the definition of one equivalent factor is the economic value of average annual grain yield per field of 1 hm2 in the main stream of the Tarim River. We calculated the area of cultivated land for 2000 and 2020 using GlobeLand30 data and combined these values with the local GDP from statistical data to calculate the market value of the cultivated land ecosystem to provide food crop production services in the main stream of the Tarim River (2760.04 Yuan/hm2). We then obtained the unit price of various ecosystem types of ESV for the main stream of the Tarim River (Table 4).

3. Results

3.1. Spatiotemporal Analysis of the Disturbance of Human Activities to the Main Stream of the Tarim River

The disturbance to ecosystems that is brought about by human activities differs in relation to different land cover categories and their degree of utilization. Our analysis reveals that, between 2000 and 2020, human activities exerted a great influence on the subject site, resulting in changes to the area of each land cover category in the main stream of the Tarim River. These changes are particularly clear in the land cover categories that are closely related to human activities—i.e., cultivated land and artificial land, and obvious shifts can be seen in disturbance index values (and their spatiotemporal distribution) within these categories.

3.1.1. Change of Cultivated Land and Its Conversion with Other Land Cover Categories

Disorderly reclamation is known to be the primary reason for ecological deterioration in the main stream of the Tarim River [5]. The momentum of such reclamation, however, has not been effectively curbed despite the implementation of an ecological control project [44]. Using GlobeLand30 data, we found that, of all the land cover categories, cultivated land increased the most in area within the subject site over the study period. This type of change constitutes the most significant disturbance to the ecosystem. Specifically, the category of cultivated land increased in area from 304,850 hm2 (or 8.91% of the total land area) in 2000 to 355,435 hm2 (or 10.42%) in 2010, and then to 465,320 hm2 (or 13.64%) in 2020, with a net increase of 50,585 hm2 and a proportional increase of 16.59% between 2000 and 2010, an increase of 109,759 hm2 or 30.89% between 2010 and 2020, and 160,380 hm2 or 52.61% from 2000 to 2020.
“Roll-in” processes saw a large-scale conversion of other land cover categories to cultivated land between 2000 and 2020. Of the newly added cultivated land, 47.15% encroached on ecological land (that is, on forest, grassland, shrub land, wetlands, and water bodies) and 51.97% encroached on bare land (reaching 53,355.87 hm2). The encroachment of cultivated land on grassland and forest accounted for 33.74% and 4.77%, respectively. Of the areas of cultivated land that were “rolled back,” 55.53% of the decreased cultivated land was converted to ecological land, of which grassland was the greatest winner, reaching 8500.50 hm2 and accounting for 37.30% of the roll-back, whilst the cultivated land that was converted to water bodies accounted for 11.77%, and other land cover categories made up less than 10% (Table 5).
Through a comprehensive analysis of the increase and decrease in the area of cultivated land, we were able to obtain the net conversion between cultivated land and other land cover categories. As a whole, the roll-in of cultivated land was greater than the roll-out; as a result of the net conversion of cultivated land to other land cover categories, the categories of forest, grassland, shrub land, wetland, and bare land all experienced a stronger cultivated land “roll-in” pattern than a cultivated land “roll-out” pattern—that is to say, cultivated land is in a “surplus” state in relation to these five land cover types. The remaining two land cover categories—water bodies and artificial surfaces—experienced less “roll-in” to cultivated land than cultivated land “roll-out,” meaning that cultivated land is in a “deficit” state in relation to these categories.

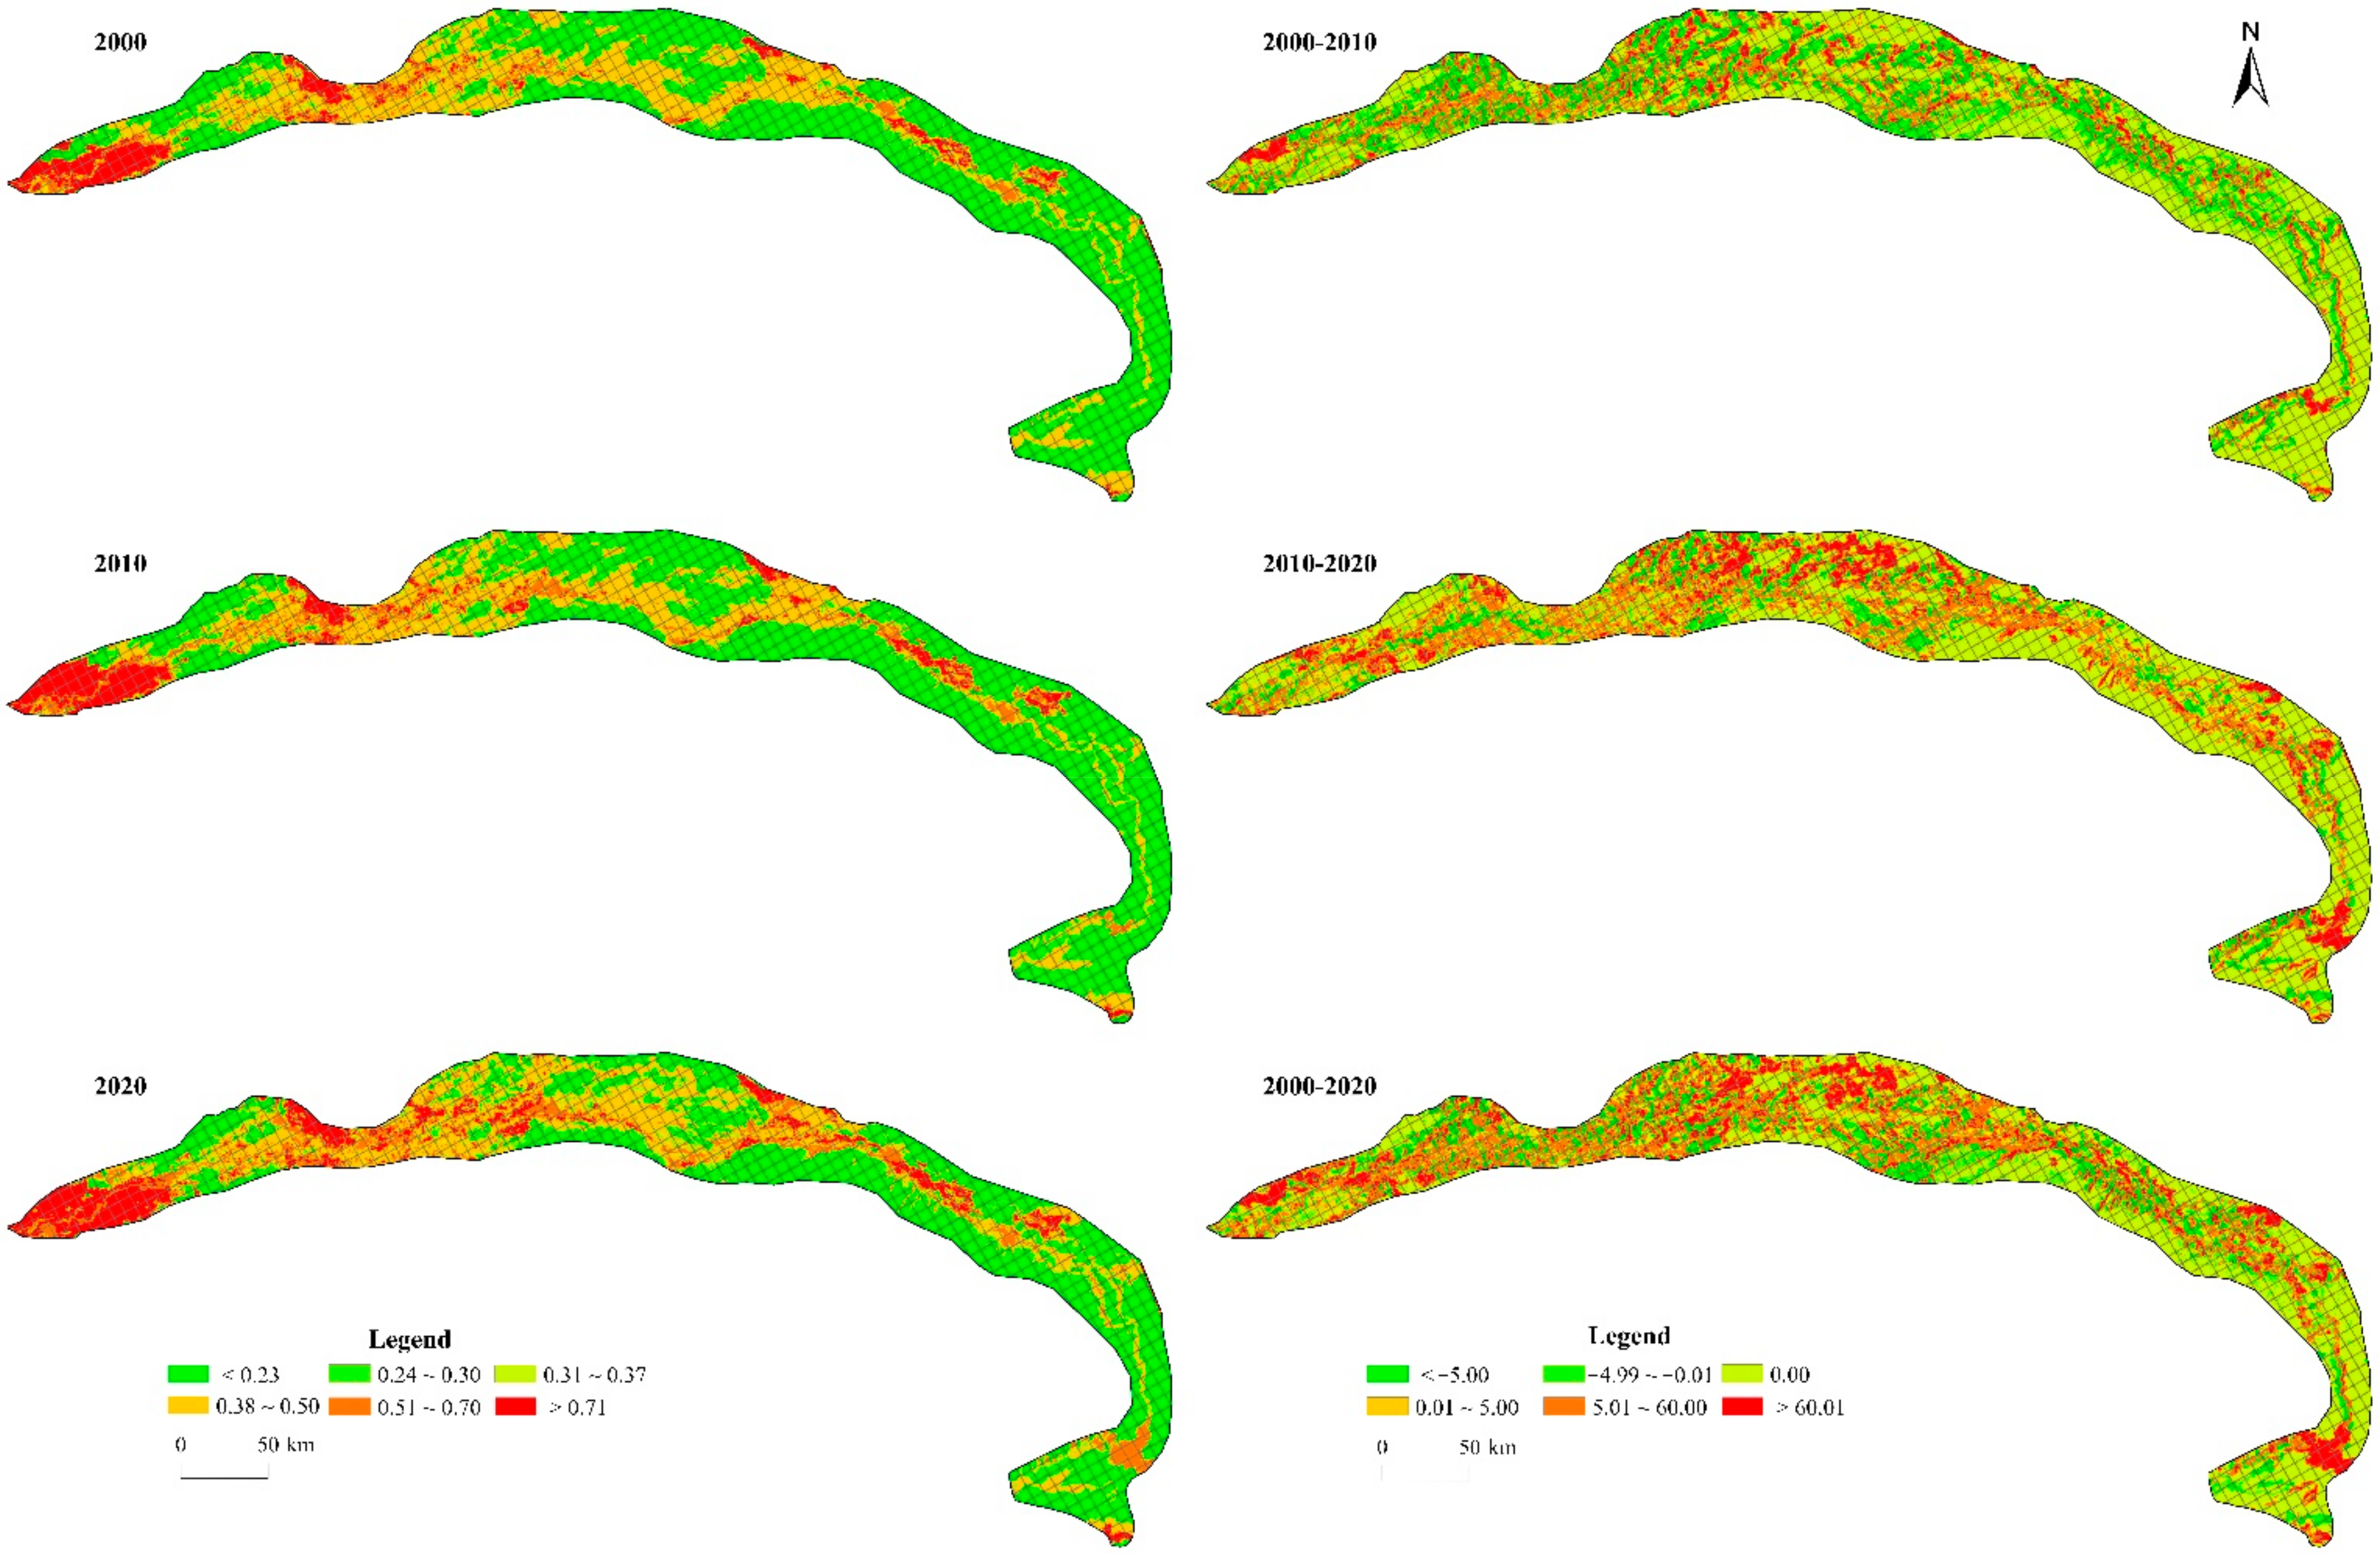
3.1.2. The Spatiotemporal Distribution and Variation of the Disturbance Index

In order to show the spatiotemporal distribution and variation trend at work in the disturbance index for the main stream of the Tarim River between 2000 and 2020 in greater detail, we visualized the index values using a 1-km grid resolution (Figure 2).

The Spatiotemporal Distribution of the Disturbance Index

From the perspective of spatial distribution, in the year 2000, areas with high disturbance index values within the main stream of the Tarim River were mainly distributed in the western and northeastern regions of the river’s upper reaches, the western part of the middle reaches, and the western part of the lower reaches. Especially in the upper reaches, high values followed a rather patchy distribution, but, in the middle and lower reaches, a distribution made up of bands, patches, or dots is evident. The areas with moderate disturbance index values were mainly distributed in the middle reaches and lower reaches, where a band distribution is evident, while the width of the band in the middle reaches was significantly wider than in the lower reaches. Low disturbance index values were mainly located in the eastern of the middle reaches and the lower reaches. Low values were found to be the most widely distributed of the three disturbance index value categories in the mainstream of the Tarim River. The spatial distribution of the index values indicates that the disturbance of human activities to the ecosystem was mainly concentrated in the upper reaches in the study period, and we were able to discern a spatial distribution law whereby the disturbance index values descend from high to low as one moves from the upper reaches > the middle reaches > the lower reaches. The distribution of the disturbance index values in 2010 presented strong continuity and consistency with the values from 2000, and the year 2020 is a continuation of the previous year.
By comprehensively comparing Figure 2, we found that, despite the evident consistency between years, changes in index values could be determined over the study period. The high value area, which was concentrated in the upper reaches of the river, expanded over time; the moderate value area, which was mainly located in the middle and lower reaches, enlarged slightly; while the low value area became smaller. This indicates that the degree of disturbance brought about by human activities in relation to the main stream of the Tarim River increased between 2000 and 2020, and the gradient differentiation law is apparent within the spatial distribution of the disturbance index values.

Spatiotemporal Variation of Disturbance Index

The disturbance index of human activities increased between 2000 and 2020. It increased from 0.3285 in 2000 to 0.3393 in 2010, and then to 0.3744 in 2020 in the area of the main stream of the Tarim River, with an increase of 0.0459 or 13.96% during the 20 years. This indicates that the disturbance to the ecosystem of the region as a result of human activities became increasingly aggravated.
From 2000 to 2020, about half of the Tarim River main stream area showed changes in disturbance index values; this variation can be divided into two types: positive change (the disturbance index increased) and negative change (index decreased). These two types differ in their spatial distribution. From the perspective of numerical values, the range of positive change was greater than that of negative change; the area of positive change was also larger than that of negative change.
From the perspective of spatial distribution, high positive change values presented as patches, bands, and dots across the whole basin, and there was no obvious spatial agglomeration except in the western part of the upper reaches; the median and low value area mainly appeared as bands and patches. Areas of the negative change were mainly located in the middle and eastern parts of the upper reaches, the eastern part of the middle reaches, and the central and western parts of the lower reaches. Moreover, negative change was widely distributed in space and displayed strong continuity. In addition to the above two changes, a vast area can be classified as “no change”; this indicates areas where human activities have no influence on the ecosystem in terms of the degree of disturbance wrought. This area is large, accounting for about 50% of the subject site.

3.2. The Influence of Human Activities on the ESV in the Main Stream of the Tarim River

Upon conducting a follow-up investigation in 2009, researchers concluded that the ecological control project that started in 2001 had made the local eco-environment better [44]. Using GlobeLand30 datasets and a revised ESV model, we calculated the ESV in the main stream of the Tarim River for the years of 2000 to 2020 using quantitative methods, also calculating the change in ESV caused by changes in the area of cultivated land. ESV was used in this paper as an evaluation index of changes in the eco-environment and taken as a quantitative reflection of the influence of human activities on the eco-environment of the typical ecological area.

3.2.1. Changes in ESV Caused by Changes in the Area of Cultivated Land

Our results indicate that, between 2000 and 2020, the area of cultivated land in the main stream of the Tarim River increased by 160,380.09 hm2, a change that we attribute to the opening up of areas of wasteland (Table 6), which accounted for the largest change increment amongst all the land cover categories. Given this finding, the changes to the eco-environment caused by changes in the area of cultivated land needed to be analyzed in depth. Increases in cultivated land, we found, mainly resulted from encroachments on other types of land cover, which has ultimately led to a decrease in local ESV levels to the equivalent of 579.2 million Yuan. This finding indicates that increases in the areas of cultivated land was an important cause of the deterioration of the regional eco-environment during the study period.
Before and after being occupied by cultivated land, the ESV of different land cover categories in the main stream of the Tarim River increased and then decreased. The reduction was larger than the increase. Before being occupied by cultivated land, the total ESV of the other seven land cover categories (forest, grassland, etc.) was 614.07 million Yuan; after being occupied by the cultivated land, whilst the ESV of the bare land category increased, this increase was less than the decrease seen in relation to forests and other categories. We estimate the new ESV (after this change) to be 34.87 million Yuan, representing a net reduction of 579.20 million Yuan. This decrease, we argue, to a certain extent, offset the achievements of the ecological control project in the area. Before and after being occupied by cultivated land, the ESV level of four of the land cover categories (forest, grassland, shrub land, wetland, water bodies, and artificial surfaces) decreased. Among these, water bodies and grassland decreased the most—by 247.91 million Yuan and 231.27 million Yuan. The ESV of bare land increased after being occupied by cultivated land, with an increase of 250.49 million Yuan from 2000 to 2020.

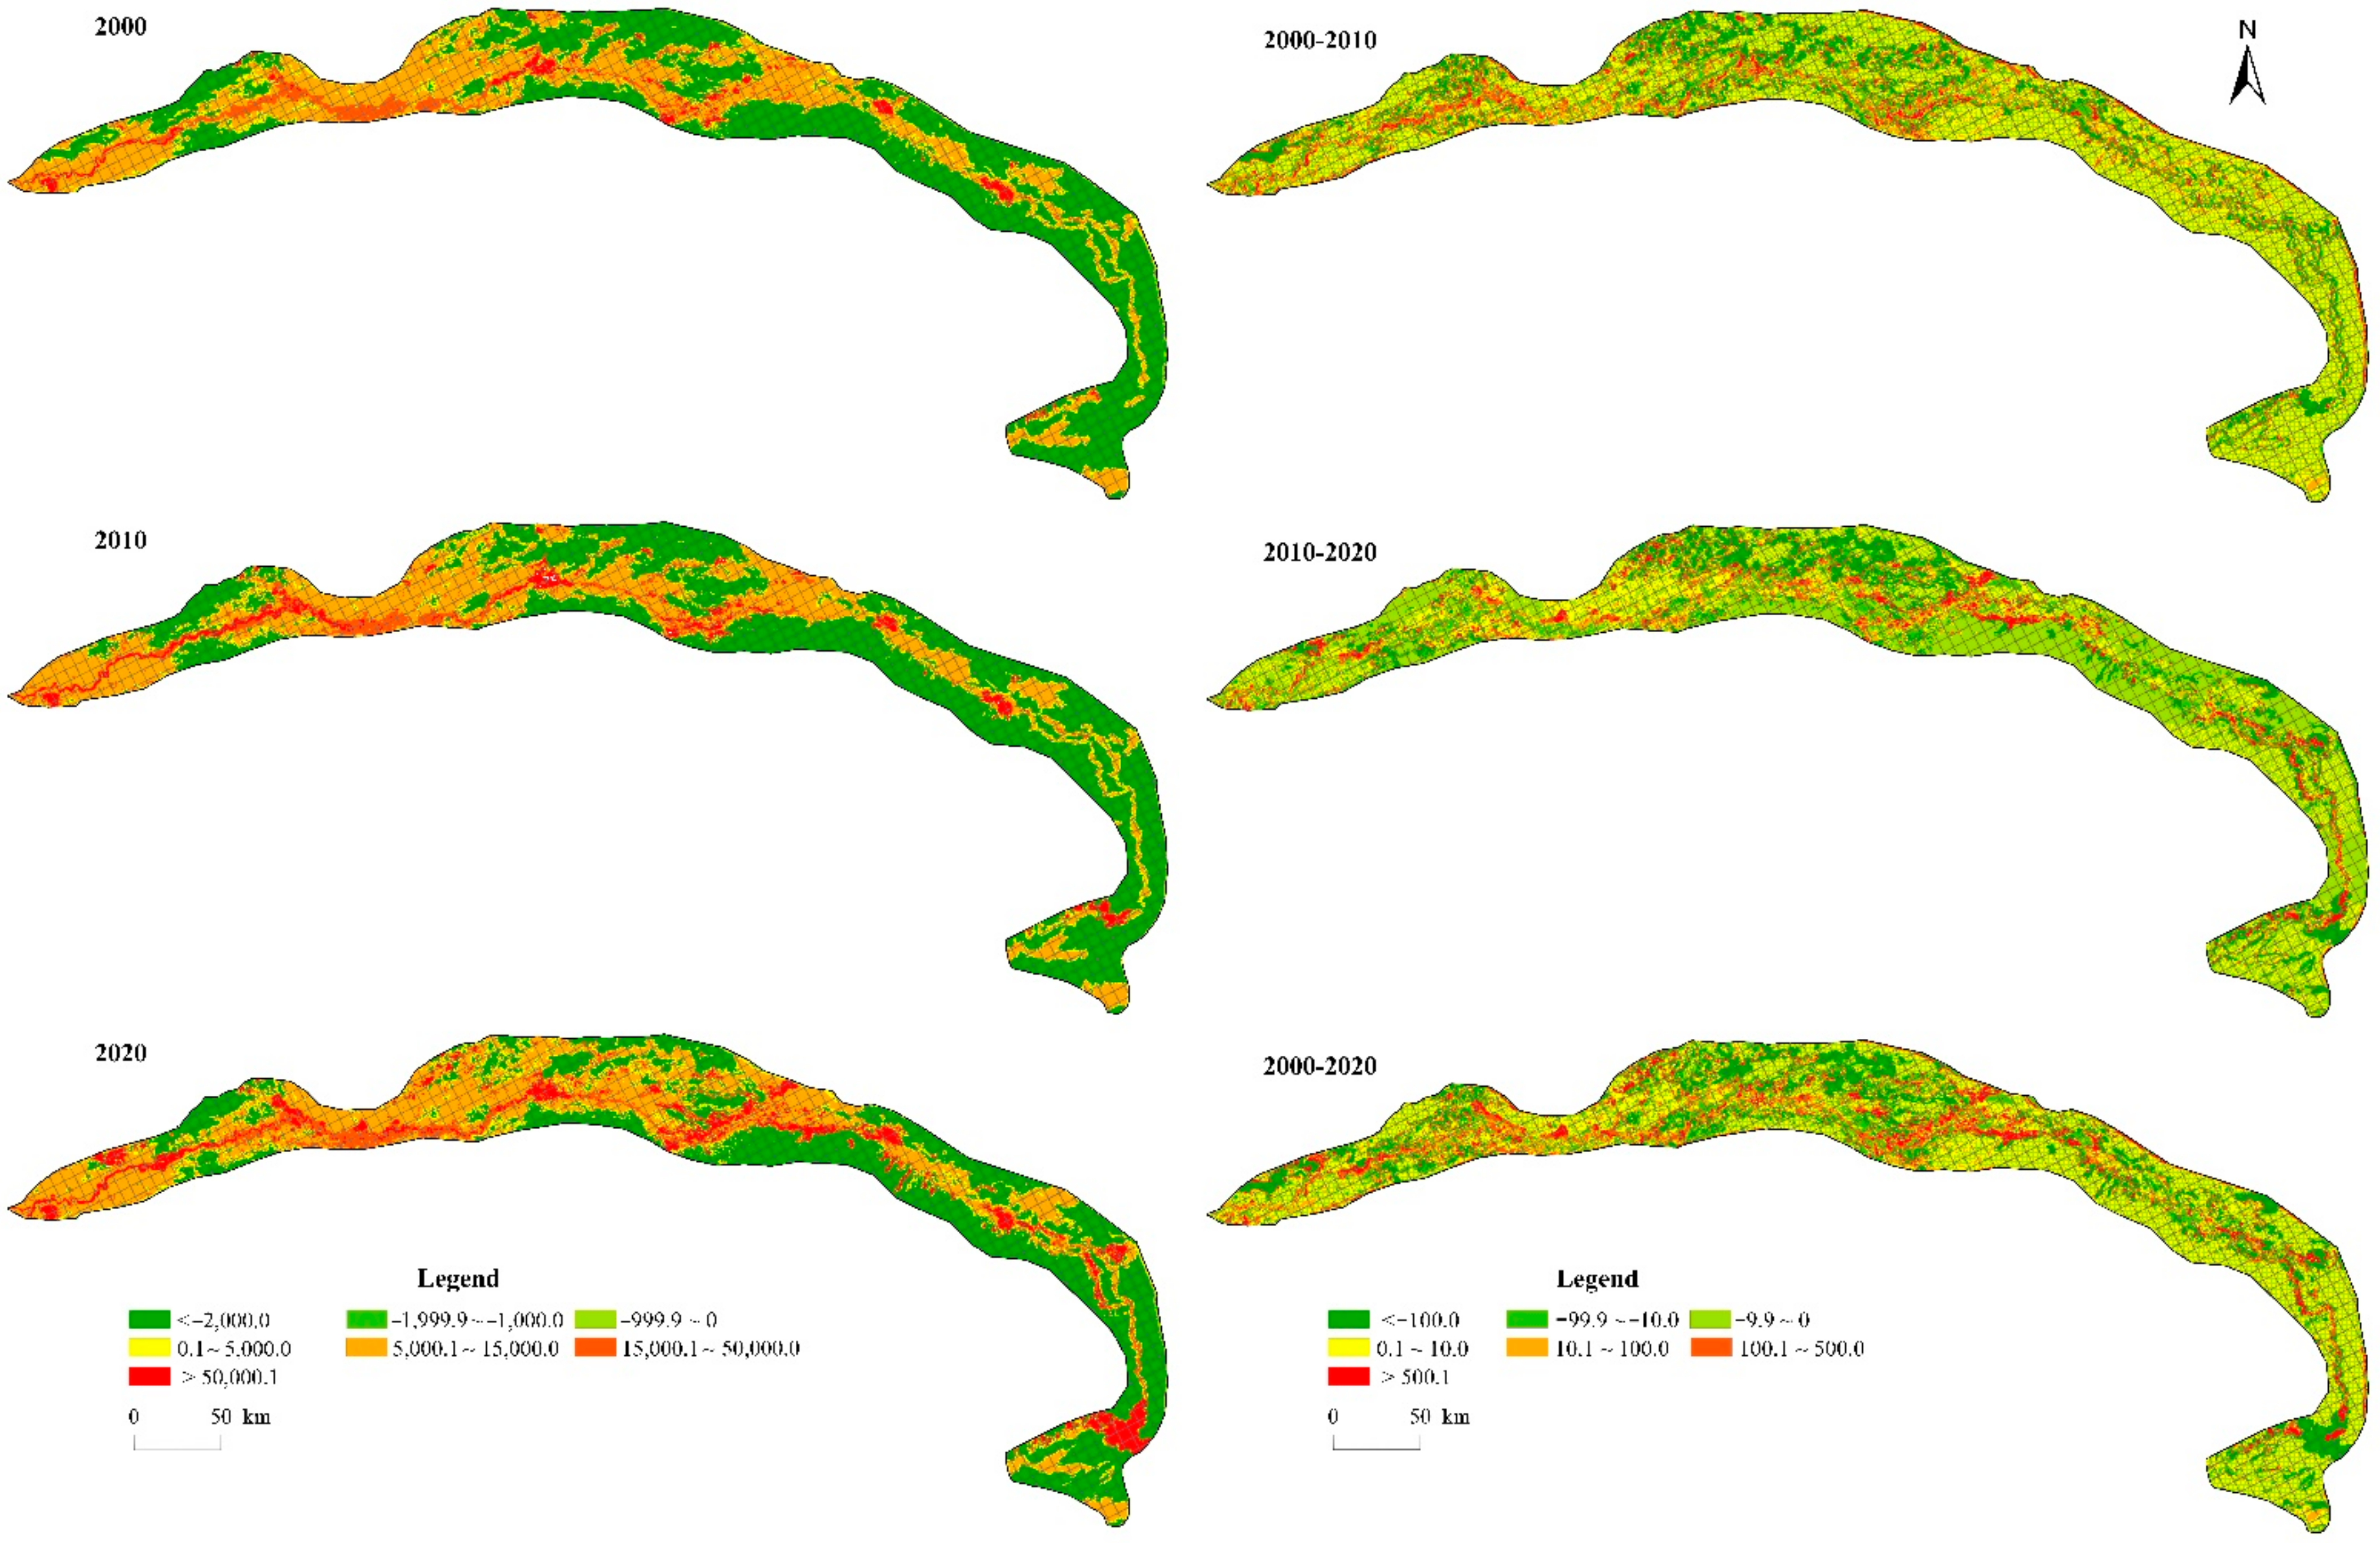
3.2.2. The Spatiotemporal Distribution of and Variation in ESV

We calculated the ESV of the main stream of the Tarim River using a 1 km × 1 km grid, obtaining the spatial distribution pattern for the years 2000 and 2020, which allowed us to demonstrate changes in the ESV over the study period.

The Spatiotemporal Distribution of ESV

The spatial distribution pattern of ESV in the main stream of the Tarim River was consistent for the years 2000, 2010, and 2020 (Figure 3), with high-value regions of ESV mainly being distributed as bands or patches and most regions experiencing low—and, in the case of one (large) region, even negative—ESV values. The high-ESV-value regions were mainly located in the central and western part of the middle reaches of the river, where the bands were relatively wider and patches relatively bigger, while, in the western and eastern parts of the middle reaches and the eastern part of the study area, the distribution took the form of narrow strips. The periphery of the high-value region was adjoined by small areas of sub-high values. Most of the regions of the main stream of the Tarim River were found to be occupied by low and negative ESV values, which indicates that the ecosystem function of the area was low and the eco-environment fragile.
Through the comprehensive comparison of the results shown in Figure 3, we were able to identify the nature of the evolution of the spatial distribution of ESV in the main stream of the Tarim River between 2000 and 2020. Compared with 2000, the ESV in 2020 showed a narrow band of negative value regions and an enlargement of the positive value regions; the spatial scope of high value of ESV expanded, especially in the western regions of the main stream of the Tarim River where this tendency was more obvious and bands of high ESV values became wider and longer; what is more, the distribution of positive value of ESV in 2020 has become more continuous than in 2000 and 2010, when the distributed was highly fragmented. On the whole, these three changes reflect the improvement of the eco-environment in the main stream of the Tarim River in the 20 years studied.

The Spatiotemporal Variation of ESV

Our results indicate that, during the 20 years between 2000 to 2020, the ESV of the main stream of the Tarim River increased, indicating that the local eco-environment improved. This variation shows significant spatial differentiation (Table 7 and Figure 3).
In 2000, the total amount of ESV in the main stream of the Tarim River reached 14,291.34 million Yuan, and grassland, wetland, and water bodies were the top three land cover categories contributing to ESV. The ESV level of bare land, however, was found to be negative, and this offset the total ESV level for the whole region. In 2010, the total amount of ESV had grown, increasing to 19,970.38 million Yuan, and the top three land cover categories that contributed to this change were water bodies, wetlands, and grassland. In 2020, the total amount of ESV had continued to grow, reaching 40,024.54 million Yuan, and the top three land cover categories that contributed to this change were the same as those in 2010.
From 2000 to 2020, the total ESV value of the main stream of the Tarim River experienced a net growth of 25,733.20 million Yuan, rising by 180.06%; this reflects improvements in the eco-environment in the region across the 20-year study period. Of all eight of the land cover categories in this region, cultivated land, wetland, water bodies, artificial surfaces, and bare land, all witnessed increased ESV levels, with wetland increasing the most, not only in quantity but also in proportion. The substantial increase in the ESV level of the category “water bodies” was also an affirmation of the water conveyance measures introduced in relation to the Tarim River during the process of ecological control; forest, grassland, and shrub land experienced a reduction in their ESV values, and shrub land declined in value the most in terms of both quantity and proportion.
We calculated variations in ESV levels between 2000 and 2020 in the main stream of the Tarim River using a 1 km × 1 km grid, obtaining its spatial distribution in the same way that we did in relation to the results reported in Figure 3. For the 20 years between 2000 to 2020, a significant change can be seen in the spatial distribution of ESV in the mainstream of the Tarim River: we found the ESV levels to increase in most parts of the region, albeit at a relatively low rate. The regions with higher growth rates were mainly located in the western part of the study site and in the western part of the middle region, where they presented as bands, and in the eastern and southeastern regions, where they presented as dots. The growth belt tended to take the form of bands along the river. The regions where the ESV levels decreased presented as scattered as dots or patches.

4. Discussion

The main stream of the Tarim River is very ecologically fragile, not only in comparison to other areas in China but also internationally. Since the mid-20th century, various land-use types in this area have undergone dramatic transformations, so much so that the State Council implemented a comprehensive ecological governance plan to improve the ecological conditions from 2001 [6]. The study area is dominated by bare land and grassland, but, due to the combined effect of global warming and the requirements of social and economic development, a large amount of ecological land (such as grassland) has been transformed into cultivated land. The present study shows that both the disturbance index and total ESV increased in this area during the period of 2000 to 2020, indicating that, while the quality of the eco-environment improved on the whole, human activities increasingly aggravated the local ecosystem, leading to increased disturbances and offsetting some of the growth seen in the ESV values of the area. This shows that, while developing the economy of areas located along the main stream of the Tarim River, attention should be paid to the impact of large increases in cultivated land on this fragile eco-environment. If this does not happen, such increases may cause many ecological problems, including an increased wastage of water resources and shortages of ecological water supply in downstream areas [45]. To increase and protect ecological land in the future, high upfront investment may be required in the short term, but, from a long-term perspective, this will deliver benefits for both humans and the environment. Decision makers should seriously consider trade-offs between land market returns, ecological environment restoration, and biodiversity conservation in the allocation of ecosystem services in the main stream of the Tarim River [46].
By comparing our results with those of other existing studies in the same region, it is clear that the change trend is consistent. For example, we note that some researchers found the ESV to have generally grown between 2005 and 2010 [31] and 2007 and 2016 [47]; the groundwater level increased gradually [48] and the vegetation area continued to increase [49] during this period. These studies are also consistent with the findings of this paper and verify the correctness of the conclusions of this study.
Currently, there is no effective method for examining the disturbances brought about by human activities in relation to the eco-environment. The study detailed in this paper took advantage of the possibilities presented by GlobeLand30 data in order to study changes in the eco-environment of the main stream of the Tarim River over a 20-year period from a quantitative perspective. The study is innovative in two ways. Firstly, we were able to address the existing conditions of the main stream of the Tarim River, revising the disturbance degree model in line with those conditions and calculating and mapping the degree of disturbance brought about by human activities on the ecosystem, including the variation and spatial distribution of that disturbance. Second, we used the correction coefficient of different ecological types in the study area, as well as high-resolution remote sensing data and statistical data, in order to calculate the market value of grain crop production services provided by local units within the cultivated landscape. This allowed us to formulate an “ESV table of different ecological types per unit area” that better reflected the conditions on the site, enabled the downscaling of the ESV coefficient, and provided a more accurate ESV model; it may also provide a case demonstration in evaluating the eco-environment changes in the minor watershed area. Despite these achievements, the study still has one shortcoming that should be addressed in future research efforts: in this study, we only used a single ESV index to measure the eco-environment. In order to be more objective and comprehensive, we propose that indexes for landscape and soil erosion should be introduced in order to produce a comprehensive index capable of reflecting changes in the eco-environment.

5. Conclusions

The UN’s SDGs emphasize the importance of monitoring and protecting typical ecological regions. With this goal in mind, this study focused on investigating the eco-environmental effects of major land cover change. The present paper took the main stream of the Tarim River, which is a typical “arid area” ecological region, introducing the concept of disturbance degree and using ESV levels to compose an index that could, in turn, be used to assess changes in the quality of the eco-environment. Based on GlobeLand30 data and by applying the disturbance degree model and a revised ESV model, we quantitatively measured the level of disturbance produced by human activities in relation to the eco-environment in the main stream of the Tarim River (by looking at the influence of such activities on ESV levels) for the period of 2000 to 2020. We then explored the spatiotemporal variation of this disturbance index (again by looking at ESV levels). The study aimed to advance the study of the eco-environment change in a typical ecological region under the framework of the SDGs by considering the eco-environmental effects of major land cover change. The main findings were as follows:
(1)
The disturbance index values increased over the study period, and the values took on a varied spatial distribution. During the 20 years studied, the disturbance index value of human activities in relation to the main stream of the Tarim River increased from 0.3285 to 0.3744, or by 13.96%. Of all the land cover categories addressed, the area of cultivated land increased the most, and its disturbance to the ecosystem was also found to be the most significant. High disturbance index values took on a patchy distribution in the west and a band or dot distribution in the eastern part of the middle reaches of the river; the level of disturbance to the local ecosystem brought about by human activities was found to decrease as one moves downstream. We note that the areas characterized by high and moderate disturbance index values expanded over the period studied but that the area of low values decreased. The growth areas of lower values were scattered in patches, bands, and dots and did not maintain significant spatial continuity.
(2)
The total ESV levels increased over the study period, and the spatial distribution of the ESV levels was uneven. During the 20 years studied, the ESV levels experienced a net growth of 25,733.20 million Yuan, adopting a growth rate of 180.06%; this indicates that the eco-environment improved in the main stream of the Tarim River. Wetland and water bodies were the land cover categories that contributed most to this observed increase in ESV levels. A substantial increase in the area of cultivated land within the subject site resulted in a reduction in ESV to the sum of 579.2 million Yuan, a decrease that, to a large extent, counteracted the effect of ecological governance measures. The distribution of ESV levels was uneven across the subject site, with the high ESV values mainly being located in the western and central parts of the site as bands, while the low values were mainly found in the eastern part of the middle reaches and in the site’s east. The ESV levels increased in most parts of the site, and the regions with higher growth rates were mainly located in the western part of the study area and the western part of the middle reaches of the river and adopted a distribution in the form of bands, while areas of decrease took on a more scattered form, presenting as dots or patches.

Author Contributions

Y.Z., W.Z., X.Z., and H.J. conceived and designed the research; Y.Z., W.Z., C.L., S.M., and X.Z. performed the methodology and wrote the original draft; Y.Z., W.Z., C.L., S.M., X.Z., and H.J. finished the final manuscript. All authors have read and agreed to the published version of the manuscript.

Funding

This work was supported by Natural Science Foundation of Guangdong Province (Grant No. 2019A1515011653; Grant No. 2020A1515011225; Grant No. 2021A1515010894), National Natural Science Foundation of China (Grant No. 42101186; Grant No. 42101273), Science and Technology Program of Guangzhou City, China (Grant No. 201904010465), and the Project Supported by the Open Fund of Key Laboratory of Urban Land Resources Monitoring and Simulation, Ministry of Natural Resources (Grant No. KF-2020-05-010).

Institutional Review Board Statement

Not applicable.

Informed Consent Statement

Not applicable.

Data Availability Statement

Not applicable.

Acknowledgments

Our deepest gratitude goes to Jun Chen at the National Geomatics Center of China for his invaluable advice and help in this research. Many thanks go to the anonymous reviewers and editors for their careful work and thoughtful suggestions that have helped improve this paper substantially.

Conflicts of Interest

The authors declare no conflict of interest.

References

  1. UN. 2015. Available online: http://www.un.org/content/undp/en/home/mdgoverview.html (accessed on 26 October 2020).
  2. UN. 2015. Available online: http://www.un.org/sustainabledevelopment/biodiversity.html (accessed on 26 October 2020).
  3. Xing, Z.; Ma, M.; Wei, Y.; Zhang, X.; Yu, Z.; Yi, P. A new agricultural drought index considering the irrigation water demand and water supply availability. Nat. Hazards 2020, 104, 2409–2429. [Google Scholar] [CrossRef]
  4. Kedzior, M.; Zawadzki, J. SMOS data as a source of the agricultural drought information: Case study of the Vistula catchment, Poland. Geoderma 2017, 306, 167–182. [Google Scholar] [CrossRef]
  5. Qian, Z. A preliminary understanding of the governance of the Tarim River Basin. Chin. Water Resour. 2000, 1, 5–8. (In Chinese) [Google Scholar]
  6. Zhang, M.; Wang, K.; Liu, H.; Zhang, C.; Yue, Y.; Qi, X. Effect of ecological engineering projects on ecosystem services in a karst region: A case study of northwest Guangxi, China. J. Clean. Prod. 2018, 183, 831–842. [Google Scholar] [CrossRef]
  7. Liu, G.; Yin, G. Twenty-five years of reclamation dynamics and potential eco-environmental risks along the Tarim River, NW China. Environ. Earth Sci. 2020, 79, 11. [Google Scholar] [CrossRef]
  8. Zhao, R.; Chen, Y.; Shi, P.; Zhang, L.; Pan, J.; Zhao, H. Land use and land cover change and driving mechanism in the arid inland river basin: A case study of the Tarim River, Xinjiang, China. Environ. Earth Sci. 2013, 68, 591–604. [Google Scholar] [CrossRef]
  9. Pickett, S.; White, P. The Ecology of Natural Disturbance and Patch Dynamics; Academic Press Inc.: Orlando, FL, USA, 1985. [Google Scholar]
  10. Thom, D.; Seidl, R. Natural disturbance impacts on ecosystem services and biodiversity in temperate and boreal forests. Biol. Rev. 2016, 91, 760–781. [Google Scholar] [CrossRef]
  11. Doherty, T.; Hays, G.; Driscoll, D. Human disturbance causes widespread disruption of animal movement. Nat. Ecol. Evol. 2021, 5, 513–519. [Google Scholar] [CrossRef]
  12. Zhao, G.; Liu, J.; Kuang, W.; Ouyang, Z.; Xie, Z. Disturbance impacts of land use change on biodiversity conservation priority areas across China: 1990–2010. J. Geogr. Sci. 2015, 25, 515–529. [Google Scholar] [CrossRef] [Green Version]
  13. Xu, Q.; Yang, R.; Zhuang, D.; Lu, Z. Spatial gradient differences of ecosystem services supply and demand in the Pearl River Delta region. J. Clean. Prod. 2021, 279, 12. [Google Scholar] [CrossRef]
  14. Grondin, P.; Gauthier, S.; Borcard, D.; Bergeron, Y.; Noel, J. A new approach to ecological land classification for the Canadian boreal forest that integrates disturbances. Landsc. Ecol. 2014, 29, 1–16. [Google Scholar] [CrossRef]
  15. Thiffault, N.; Grondin, P.; Noel, J.; Poirier, V. Ecological gradients driving the distribution of four Ericaceae in boreal Quebec, Canada. Ecol. Evol. 2015, 5, 1837–1853. [Google Scholar] [CrossRef]
  16. Zhang, Q.; Wang, S. The characteristics of spatial disturbance of surface processes in oasis on the background of desert. Acta Ecol. Sin. 2005, 25, 2459–2466. [Google Scholar]
  17. Couillard, P.; Payette, S.; Grondin, P. Recent impact of fire on high-altitude balsam fir forests in south-central Quebec. Can. J. For. Res. 2012, 42, 1289–1305. [Google Scholar] [CrossRef]
  18. Sotomayor-Beltran, C. Positive and negative ionospheric disturbances prior to the 2016 christmas earthquake in Chile. Geomat. Nat. Hazards Risk 2019, 10, 622–632. [Google Scholar] [CrossRef]
  19. Chang, W.; Li, W.; Ma, H.; Wang, D.; Bandala, E.; Yu, Y.; Rodrigo-Comino, J. An integrated approach for shaping drought characteristics at the watershed scale. J. Hydrol. 2022, 604, 127248. [Google Scholar] [CrossRef]
  20. Yin, X.; Li, X.; An, J.; Wang, F. Characteristics of ecological distribution of soil microarthropod communities in the wetlands of the Lhasa River on the Qinghai-Tibet Plateau. Wetlands 2015, 35, 589–596. [Google Scholar] [CrossRef]
  21. Wang, X.; Yan, F.; Zeng, Y.; Chen, M.; He, B.; Kang, L.; Su, F. Ecosystem services changes on farmland in response to urbanization in the Guangdong–Hong Kong–Macao Greater Bay Area of China. Land 2021, 10, 501. [Google Scholar] [CrossRef]
  22. Liu, S.; Sun, Y.; Wu, X.; Li, W.; Liu, Y.; Tran, L.-S.P. Driving factor analysis of ecosystem service balance for watershed management in the Lancang River Valley, Southwest China. Land 2021, 10, 522. [Google Scholar] [CrossRef]
  23. Daily, G.C. Nature’s Services: Societal Dependence on Natural Ecosystems; Island Press: Washington, DC, USA, 1997. [Google Scholar]
  24. Woldeyohannes, A.; Cotter, M.; Biru, W.D.; Kelboro, G. Assessing changes in ecosystem service values over 1985–2050 in response to land use and land cover dynamics in Abaya-Chamo Basin, Southern Ethiopia. Land 2020, 9, 37. [Google Scholar] [CrossRef] [Green Version]
  25. Zhong, S.; Geng, Y.; Huang, B.; Zhu, Q.; Cui, X.; Wu, F. Quantitative assessment of eco-compensation standard from the perspective of ecosystem services: A case study of Erhai in China. J. Clean. Prod. 2020, 263, 121530. [Google Scholar] [CrossRef]
  26. La Notte, A.; Dalmazzone, S. Sustainability assessment and causality nexus through ecosystem service accounting: The case of water purification in Europe. J. Environ. Manag. 2018, 223, 964–974. [Google Scholar] [CrossRef]
  27. Costanza, R.; d’Arge, R.; de Groot, R.; Farber, S.; Grasso, M.; Hannon, B.; Limburg, K.; Naeem, S.; O’Neill, R.V.; Paruelo, J.; et al. The value of the world’s ecosystem services and natural capital. Nature 1997, 387, 253–260. [Google Scholar] [CrossRef]
  28. Xie, G.; Lu, C.; Leng, Y.; Zheng, D.; Li, S. Ecological assets valuation of the Tibetan Plateau. J. Nat. Resour. 2003, 18, 189–196. (In Chinese) [Google Scholar]
  29. Liu, B.; Pan, L.; Qi, Y.; Guan, X.; Li, J. Land use and land cover change in the Yellow River Basin from 1980 to 2015 and its impact on the ecosystem services. Land 2021, 10, 1080. [Google Scholar] [CrossRef]
  30. Huang, F.; Wu, S.; Tang, H. Response of ecological environment to land use/cover change in Xinjiang during 1990–2008 based on remote sensing and GIS. J. Desert Res. 2012, 32, 1486–1493. (In Chinese) [Google Scholar]
  31. Bai, Y.; Xu, H.; Ling, H.; Fu, J. Analysis on land use changes and ecosystem services value in the area along the Tarim River. J. Desert Res. 2013, 33, 1912–1920. (In Chinese) [Google Scholar]
  32. Hua, D.; Hao, X. Spatiotemporal change and drivers analysis of desertification in the arid region of northwest China based on geographic detector. Environ. Chall. 2021, 4, 100082. [Google Scholar]
  33. Sannigrahi, S.; Bhatt, S.; Rahmat, S.; Paul, S.K.; Sen, S. Estimating global ecosystem service values and its response to land surface dynamics during 1995–2015. J. Environ. Manag. 2018, 223, 115–131. [Google Scholar] [CrossRef]
  34. Gu, X.; Long, A.; Liu, G.; Yu, J.; Wang, H.; Yang, Y.; Zhang, P. Changes in ecosystem service value in the 1 km lakeshore zone of Poyang Lake from 1980 to 2020. Land 2021, 10, 951. [Google Scholar] [CrossRef]
  35. Rahman, M.M.; Szabó, G. Impact of land use and land cover changes on urban ecosystem service value in Dhaka, Bangladesh. Land 2021, 10, 793. [Google Scholar] [CrossRef]
  36. Jiao, W.; Liu, X.; Zhang, L.; Liang, L. Ecological response to the land development in Tarim River Basin. Arid Land Geogr. 2018, 41, 1396–1404. [Google Scholar]
  37. Wu, L. Administrative Division of the Tarim Rivers. 2014. Available online: http://westdc.westgis.ac.cn/data/0404bef8-04b8-4a9e-8488-075870b7cba1 (accessed on 18 May 2021).
  38. Wu, L. Tarim River Basin Boundary. 2014. Available online: http://westdc.westgis.ac.cn/data/4f8d5d77-0945-4591-a09d-172ddc6d3273 (accessed on 18 May 2021).
  39. Chen, J.; Ban, Y.; Li, S. Open access to earth land-cover map. Nature 2014, 514, 434. [Google Scholar]
  40. Chen, J.; Chen, J.; Liao, A.; Cao, X.; Chen, L.; Chen, X.; He, C.; Han, G.; Peng, S.; Lu, M.; et al. Global land cover mapping at 30 m resolution: A POK-based operational approach. ISPRS J. Photogramm. Remote Sens. 2015, 103, 7–27. [Google Scholar] [CrossRef] [Green Version]
  41. Zhang, W.; Chen, J.; Liao, A.; Han, G.; Chen, X.; Chen, L.; Peng, S.; Wu, H.; Zhang, J. Geospatial knowledge-based verification and improvement of GlobeLand30. Sci. China Earth Sci. 2016, 59, 1709–1719. [Google Scholar] [CrossRef]
  42. Yan, H.; Liu, F.; Liu, J.; Xiao, X.; Qin, Y. Status of land use intensity in China and its impacts on land carrying capacity. J. Geogr. Sci. 2017, 27, 387–402. [Google Scholar] [CrossRef] [Green Version]
  43. Huang, X.; Chen, Y.; Ma, J. Analysis of the ecosystem services value of the typical river basin in desert areas of Northwest China. J. Nat. Resour. 2011, 26, 1364–1376. (In Chinese) [Google Scholar]
  44. Shi, Y. The Anthology of Shi Yulin; Higher Education Press: Beijing, China, 2013. (In Chinese) [Google Scholar]
  45. Li, C.; Zheng, H.; Li, S.; Chen, X.; Li, J.; Zeng, W.; Liang, Y.; Polasky, S.; Feldman, M.; Ruckelshaus, M. Impacts of conservation and human development policy across stakeholders and scales. Proc. Natl. Acad. Sci. USA 2015, 112, 7396–7401. [Google Scholar] [CrossRef] [Green Version]
  46. Nelson, E.; Mendoza, G.; Regetz, J.; Polasky, S.; Tallis, H.; Cameron, D.R.; Chan, K.M.A.; Daily, G.C.; Goldstein, J.; Kareiva, P.M. Modeling multiple ecosystem services, biodiversity conservation, commodity production, and tradeoffs at landscape scales. Front. Ecol. Environ. 2009, 7, 4–11. [Google Scholar] [CrossRef]
  47. Yao, Y.; Ding, J.; Zhang, F.; Lei, L.; Jiang, H. Impact of human driving factors for land use change on ecosystem servise value in Xinjiang Wei Aotunomous Region. Bull. Soil Water Conserv. 2013, 33, 298–304. [Google Scholar]
  48. Wang, W.; Chen, Y.; Wang, W.; Jiang, J.; Cai, M.; Xu, Y. Evolution characteristics of groundwater and its response to climate and land-cover changes in the oasis of dried-up river in Tarim Basin. J. Hydrol. 2021, 594, 125644. [Google Scholar] [CrossRef]
  49. Zhang, H.; Xue, L.; Wei, G.; Dong, Z.; Meng, X. Assessing vegetation dynamics and landscape ecological risk on the mainstream of Tarim River, China. Water 2020, 12, 2156. [Google Scholar] [CrossRef]
Figure 1. The spatial distribution pattern of land cover categories in the main stream of the Tarim River in 2020.
Land 11 00424 g001
Figure 2. The spatial distribution and variation in the disturbance index of human activities in relation to the main stream of the Tarim River.
Land 11 00424 g002
Figure 3. The spatial distribution pattern and variation in the ESV in relation to the main stream of the Tarim River (unit: million Yuan/%).
Land 11 00424 g003
Table 1. The disturbance degree of human activities on different ecosystems.
Use TypeUseable TypeUsed Type
Ecological Type Hard to UseEasy to UseRenewableNon-Renewable
I TypeII Type
Ecosystem typesBare landForests, Grassland, Shrub landWetlands, Water bodiesCultivated landArtificial surfaces
Disturbance index levels12345
Table 2. Ecological system correction coefficient of different ecological types for the main stream of the Tarim River.
Ecosystem TypesCultivated LandForestsGrasslandShrub LandWetlandsWater BodiesArtificial SurfacesBare Land
Correction coefficient0.370.46220.33340.391810.940.310.16
Source: Ref. [43].
Table 3. The equivalent factor table of ESV in the main stream of the Tarim River.
Ecosystem TypesCultivated LandForestGrasslandShrub LandWetlandWater
Bodies
Artificial
Surfaces
Bare Land
Ecosystem Function
Gas regulation0.191.620.270.901.800.00−0.50−0.60
Climate regulation0.331.250.300.7717.10.430.13−0.89
Hydrological regulation0.221.480.270.9615.519.58−0.08−0.60
Soil formation and conservation0.610.610.440.5218.1817.090.010.01
Waste treatment0.541.800.651.101.710.010.060.02
Biodiversity maintenance0.261.510.360.872.502.340.290.34
Food production0.370.050.100.040.300.090.020.01
Raw materials production0.041.200.020.200.070.010.010.00
Aesthetic values0.000.590.010.205.554.082.580.01
Total2.5610.112.425.5662.7143.632.52−1.70
Revised from Refs. [27,28].
Table 4. The ESV of per unit area of different ecological types in the main stream of the Tarim River (unit: Yuan/hm2).
Ecosystem TypesCultivated LandForestGrasslandShrub LandWetlandWater
Bodies
Artificial
Surfaces
Bare Land
Ecosystem Function
Gas regulation524.414471.26745.212484.044968.070.00−1380.02−1656.02
Climate regulation910.813450.05828.012125.2347,196.681186.82358.81−2456.44
Hydrological regulation607.214084.86745.212649.6442,780.6254,041.58−220.80−1656.02
Soil formation and conservation1683.621683.621214.421435.2250,177.5347,169.0827.6027.60
Waste treatment1490.424968.071794.033036.044719.6727.60165.6055.20
Biodiversity maintenance717.614167.66993.612401.236900.106458.49800.41938.41
Food production1021.21138.00276.00110.40828.01248.4055.2027.60
Raw materials production110.403312.0555.20552.01193.2027.6027.600.00
Aesthetic values0.001628.4227.60552.0115,318.2211,260.967120.9027.60
Total7065.7027,904.006679.3015,345.82173,082.11120,420.556955.30−4692.07
Revised from Refs. [27,28].
Table 5. The conversion between cultivated land and other land cover categories (hm2/%).
Land Cover
Category
2000–20102010–20202000–2020
Roll-InRoll-OutNet ConvertRoll-InRoll-OutNet ConvertRoll-InRoll-OutNet Convert
Area%Area%Area%Area%Area%Area%Area%Area%Area%
Forest456.120.77379.893.8676.230.164436.648.24366.841.494069.8013.904899.064.77495.272.174403.795.51
Grassland19,395.2732.925854.5059.4413,540.7727.5918,808.9734.938436.2434.3410,372.7335.4334,638.4933.748500.5037.3026,137.9932.72
Shrub land2045.343.47231.122.351814.223.704313.978.01158.220.644155.7514.195939.915.7975.240.335864.677.34
Wetland124.740.21148.141.50−23.40−0.051337.492.48887.583.61449.911.54872.460.85901.353.96−28.89−0.04
Water bodies284.310.481209.0612.28−924.75−1.883294.456.122247.939.151046.523.572058.752.012681.9111.77−623.16−0.78
Artificial surfaces677.611.151756.0917.83−1078.48−2.20729.901.369675.5439.38−8945.64−30.55902.520.888709.8438.22−7807.32−9.77
Bare land35,940.0660.99269.912.7435,670.1572.6920,926.8038.862797.1111.3818,129.6961.9253,355.8751.971425.246.2551,930.6365.01
Total58,923.451009848.7110049,074.7410053,848.2210024,569.4610029,278.76100102,667.0610022,789.3510079,877.71100
Note: “Roll-in” refers to the roll-in of cultivated land from other category lands, “Roll-out” denotes the roll-out of cultivated land to other category lands, and “Net convert” means net conversion to cultivated land from other category lands.
Table 6. The change in ESV caused by the change in cultivated land, 2000–2020.
Land Cover
Category
Roll-In of Cultivated Land (hm2)ESV before
Conversion
(Million Yuan)
ESV after
Conversion
(Million Yuan)
Change in ESV (Million Yuan)Proportion
(%)
Forest4899.06136.7034.62−102.0917.63
Grassland34,638.49231.360.09−231.2739.93
Shrub land5939.9191.150.02−91.1415.74
Wetland872.46151.010.00−151.0026.07
Water bodies2058.75247.920.01−247.9142.80
Artificial surfaces902.526.280.00−6.271.08
Bare land53,355.87−250.350.14250.49−43.25
Total102,667.06614.0734.87−579.20100.00
Table 7. The variation in ESV.
Land Cover
Category
The Volume of ESVThe Variation of ESV
2000201020202000–20102010–20202000–2020
ESVProportionESVProportionESVProportionVariationVariation RateVariationVariation RateVariationVariation Rate
Cultivated land2153.9815.072511.4012.583287.178.21357.4216.59775.7830.891133.2052.61
Forest2390.4216.732032.0810.182270.805.67−358.34−14.99238.7211.75−119.62−5.00
Grassland6467.4645.256124.6030.676270.4515.67−342.86−5.30145.862.38−197.01−3.05
Shrub land748.025.23700.373.51335.430.84−47.65−6.37−364.95−52.11−412.60−55.16
Wetland6429.8344.997959.2739.8623,828.8359.541529.4323.7915,869.56199.3817,398.99270.60
Water bodies5108.4235.749462.4847.3811,664.8629.144354.0685.232202.3823.276556.44128.35
Artificial surfaces37.310.2640.650.20115.410.293.358.9774.76183.9078.11209.37
Bare land−9044.10−63.28−8860.47−44.37−7748.41−19.36183.63−2.031112.06−12.551295.69−14.33
Total14,291.34100.0019,970.38100.0040,024.54100.005679.0439.7420,054.16100.4225,733.20180.06
Publisher’s Note: MDPI stays neutral with regard to jurisdictional claims in published maps and institutional affiliations.

