Article

High-Resolution Transect Sampling and Multiple Scale Diversity Analyses for Evaluating Grassland Resilience to Climatic Extremes

1
Centre for Ecological Research, Institute of Ecology and Botany, Alkotmány út 2-4, H-2163 Vácrátót, Hungary
2
Institute of Botany and Ecophysiology, Hungarian University of Agriculture and Life Sciences, Páter Károly utca 1, H-2100 Gödöllő, Hungary
3
Balaton-Felvidéki National Park Directorate, Kossuth u. 16, H-8229 Csopak, Hungary
4
Institute for Wildlife Management and Nature Conservation, Hungarian University of Agriculture and Life Sciences, Guba Sándor utca 40, H-7400 Kaposvár, Hungary
5
Department of Pharmacognosy, Faculty of Pharmacy, University of Pécs, Rókus utca 2, H-7624 Pécs, Hungary
6
Department of Botany, University of Veterinary Medicine Budapest, Rottenbiller utca 50, H-1077 Budapest, Hungary
7
Independent Researcher, H-5830 Battonya, Hungary
8
Plant Diversity and Ecosystems Management Unit, School of Biosciences and Veterinary Medicine, University of Camerino, Via Pontoni 5, I-62032 Camerino, MC, Italy
9
Harry Butler Institute, Murdoch University, 90 South Street, Murdoch, Perth, WA 6150, Australia
*
Author to whom correspondence should be addressed.
Land 2022, 11(3), 378; https://doi.org/10.3390/land11030378
Submission received: 7 February 2022 / Revised: 1 March 2022 / Accepted: 2 March 2022 / Published: 4 March 2022

Abstract

:
Diversity responses to climatic factors in plant communities are well understood from experiments, but less known in natural conditions due to the rarity of appropriate long-term observational data. In this paper, we use long-term transect data sampled annually in three natural grasslands of different species pools, soils, landscape contexts and land use histories. Analyzing these specific belt transect data of contiguous small sampling units enabled us to explore scale dependence and spatial synchrony of diversity patterns within and among sites. The 14-year study period covered several droughts, including one extreme event between 2011 and 2012. We demonstrated that all natural grasslands responded to droughts by considerable fluctuations of diversity, but, overall, they remained stable. The plant functional group of annuals showed high resilience at all sites, while perennials were resistant to droughts. Our results were robust to changing spatial scales of observations, and we also demonstrated that within-site spatial synchrony could be used as a sensitive indicator of external climatic effects. We propose the broad application of high-resolution belt transects for powerful and adaptive vegetation monitoring in the future.

1. Introduction

Natural grasslands have evolved with stresses and disturbances (e.g., climatic variability, grazing and fire) that have appeared at multiple spatial and temporal scales [1]. Therefore, grassland vegetation is expected to tolerate considerable environmental variability [2,3]. However, limits of related tolerance are unknown, and recent climate changes with increasing frequency and magnitude of droughts, heavy rains and heat waves [4] might challenge the adaptability of grassland ecosystems. Long-term permanent plot data are rare and crucial for documenting the natural variability of grassland vegetation [5,6]. Correlations between the temporal variability of grassland vegetation and the temporal variability of weather characteristics have been explored by recent studies [7,8,9,10]. However, the number of long-term observational studies is limited, and the patterns they have reported are often controversial [10]. In addition, causal relationships cannot be inferred from the correlations found in observational studies. In contrast, field experiments manipulating the vegetation’s temperature and precipitation provide direct (causal) evidence to improve our understanding of the related mechanisms. Most knowledge has been accumulated about plant productivity responses to manipulated climatic conditions [11,12,13], while diversity responses are less investigated. However, recent meta-analyses reported consistent patterns of diversity responses in field experiments. Species richness decreased with increasing temperature [14,15] and decreasing precipitation [16]. Besides overall trends, variations due to grassland types and different species compositions (different plant functional types) were also reported. Xeric grasslands [8,16] and communities with a higher proportion of annuals [9,17] showed stronger responses to precipitation.
Field experiments have limited duration, and they typically manipulate small plots [18]. Up-scaling results from experimental plots to larger spatial and temporal scales remain problematic [19]. Several studies noted that plot scale versus site or regional scale diversity responses differed [9,14,16]. Some authors suggested that responses to weather fluctuations were stronger at finer scales [14,16,20]. However, the sampling designs used in these studies were not appropriate for direct investigations of scale dependence. A simulation study analyzed the scale dependence of diversity responses [21] and showed that the standardized effect size of diversity responses depended on several parameters, including spatial grain, extent, species pool, and species’ spatial aggregations. They concluded that these modulating factors should have been considered and standardized to obtain better comparisons and more reliable generalizations [21].
Long-term observational data from different grasslands often differ in sampling parameters, such as plot sizes, spatial arrangement of plots, sample sizes, duration of study, etc. [8,10]. To our knowledge, there is a lack of studies that have explored the effects of sampling parameters on the long-term diversity patterns in empirical datasets in the context of climate change. This study analyzes long-term monitoring data sampled along permanent transects of contiguous sampling units. These transect data can be re-sampled by computerized sampling [22,23], and the scale dependence of the results will be explored.
Large-scale exogenous random factors such as temperature and precipitation (acting parallel on spatially separated populations or communities) generate population and community dynamics correlations. Spatial synchrony refers to this phenomenon, i.e., simultaneous changes in time-varying population- and community-level attributes [24]. Spatial synchrony in population dynamics is well documented [25]. However, only a few recent studies assess synchrony at the community level. Walter et al. (2021) [26] analyzed long (10 to 33 years) time series of species richness from 20 marine and terrestrial communities and found that metacommunities often exhibit spatial synchrony of species richness. They also showed that ecosystem stability decreased with increasing synchrony and stability was more strongly correlated with synchrony than with species richness. Another study did not find significant correlations in temporal species-richness variation in rocky shore communities [20]. More studies are necessary to clarify how weather fluctuations are related to the spatial synchrony of community-level attributes and how these relationships respond to global climate change.
We used long-term vegetation monitoring data from three semi-arid natural grasslands in Hungary. Our study sites are protected remnants of the native forest-steppe vegetation. They are located in the Great Hungarian Plain, represent contrasting xeric and semi-dry vegetation types, and have different soils, landscape contexts and land-use histories. All grasslands experienced similar climate changes with increasing annual temperature (2.2 °C increase over the last 40 years) and inter-annual precipitation fluctuation (CV% increased from 18.3% to 25.6% over the last 40 years, cf. Supplementary S1).
Plant communities were sampled annually along transects with a high spatial resolution, which enabled us to analyze the synchrony of species richness time series at multiple scales and link diversity patterns to long-term meteorological data. We addressed the following questions:
Q1
Do temporal diversity patterns (trends or fluctuations) respond significantly to the temporal variation of weather characteristics?
Q2
Are these patterns synchronized and dependent on the spatial scale of observation?
Q3
Do plant functional groups differ in responses, and how do site conditions and the type of plant communities modulate the related patterns?
Based on similar studies, we hypothesized that
Hypothesis 1 (H1).
Ongoing climate change is accompanied by decreasing species richness [9,27].
Hypothesis 2 (H2).
Temporal fluctuations of species richness are correlated with the inter-annual variations of weather [26,28].
Hypothesis 3 (H3).
Responses to weather fluctuations are stronger at finer spatial scales [14,16,20].
Hypothesis 4 (H4).
Annual species and the more xeric vegetation are more sensitive to climate extremes because annuals with shorter life cycles respond directly and promptly to weather conditions and because xeric vegetation has a larger proportion of annuals [8,9,17,29].

2. Materials and Methods
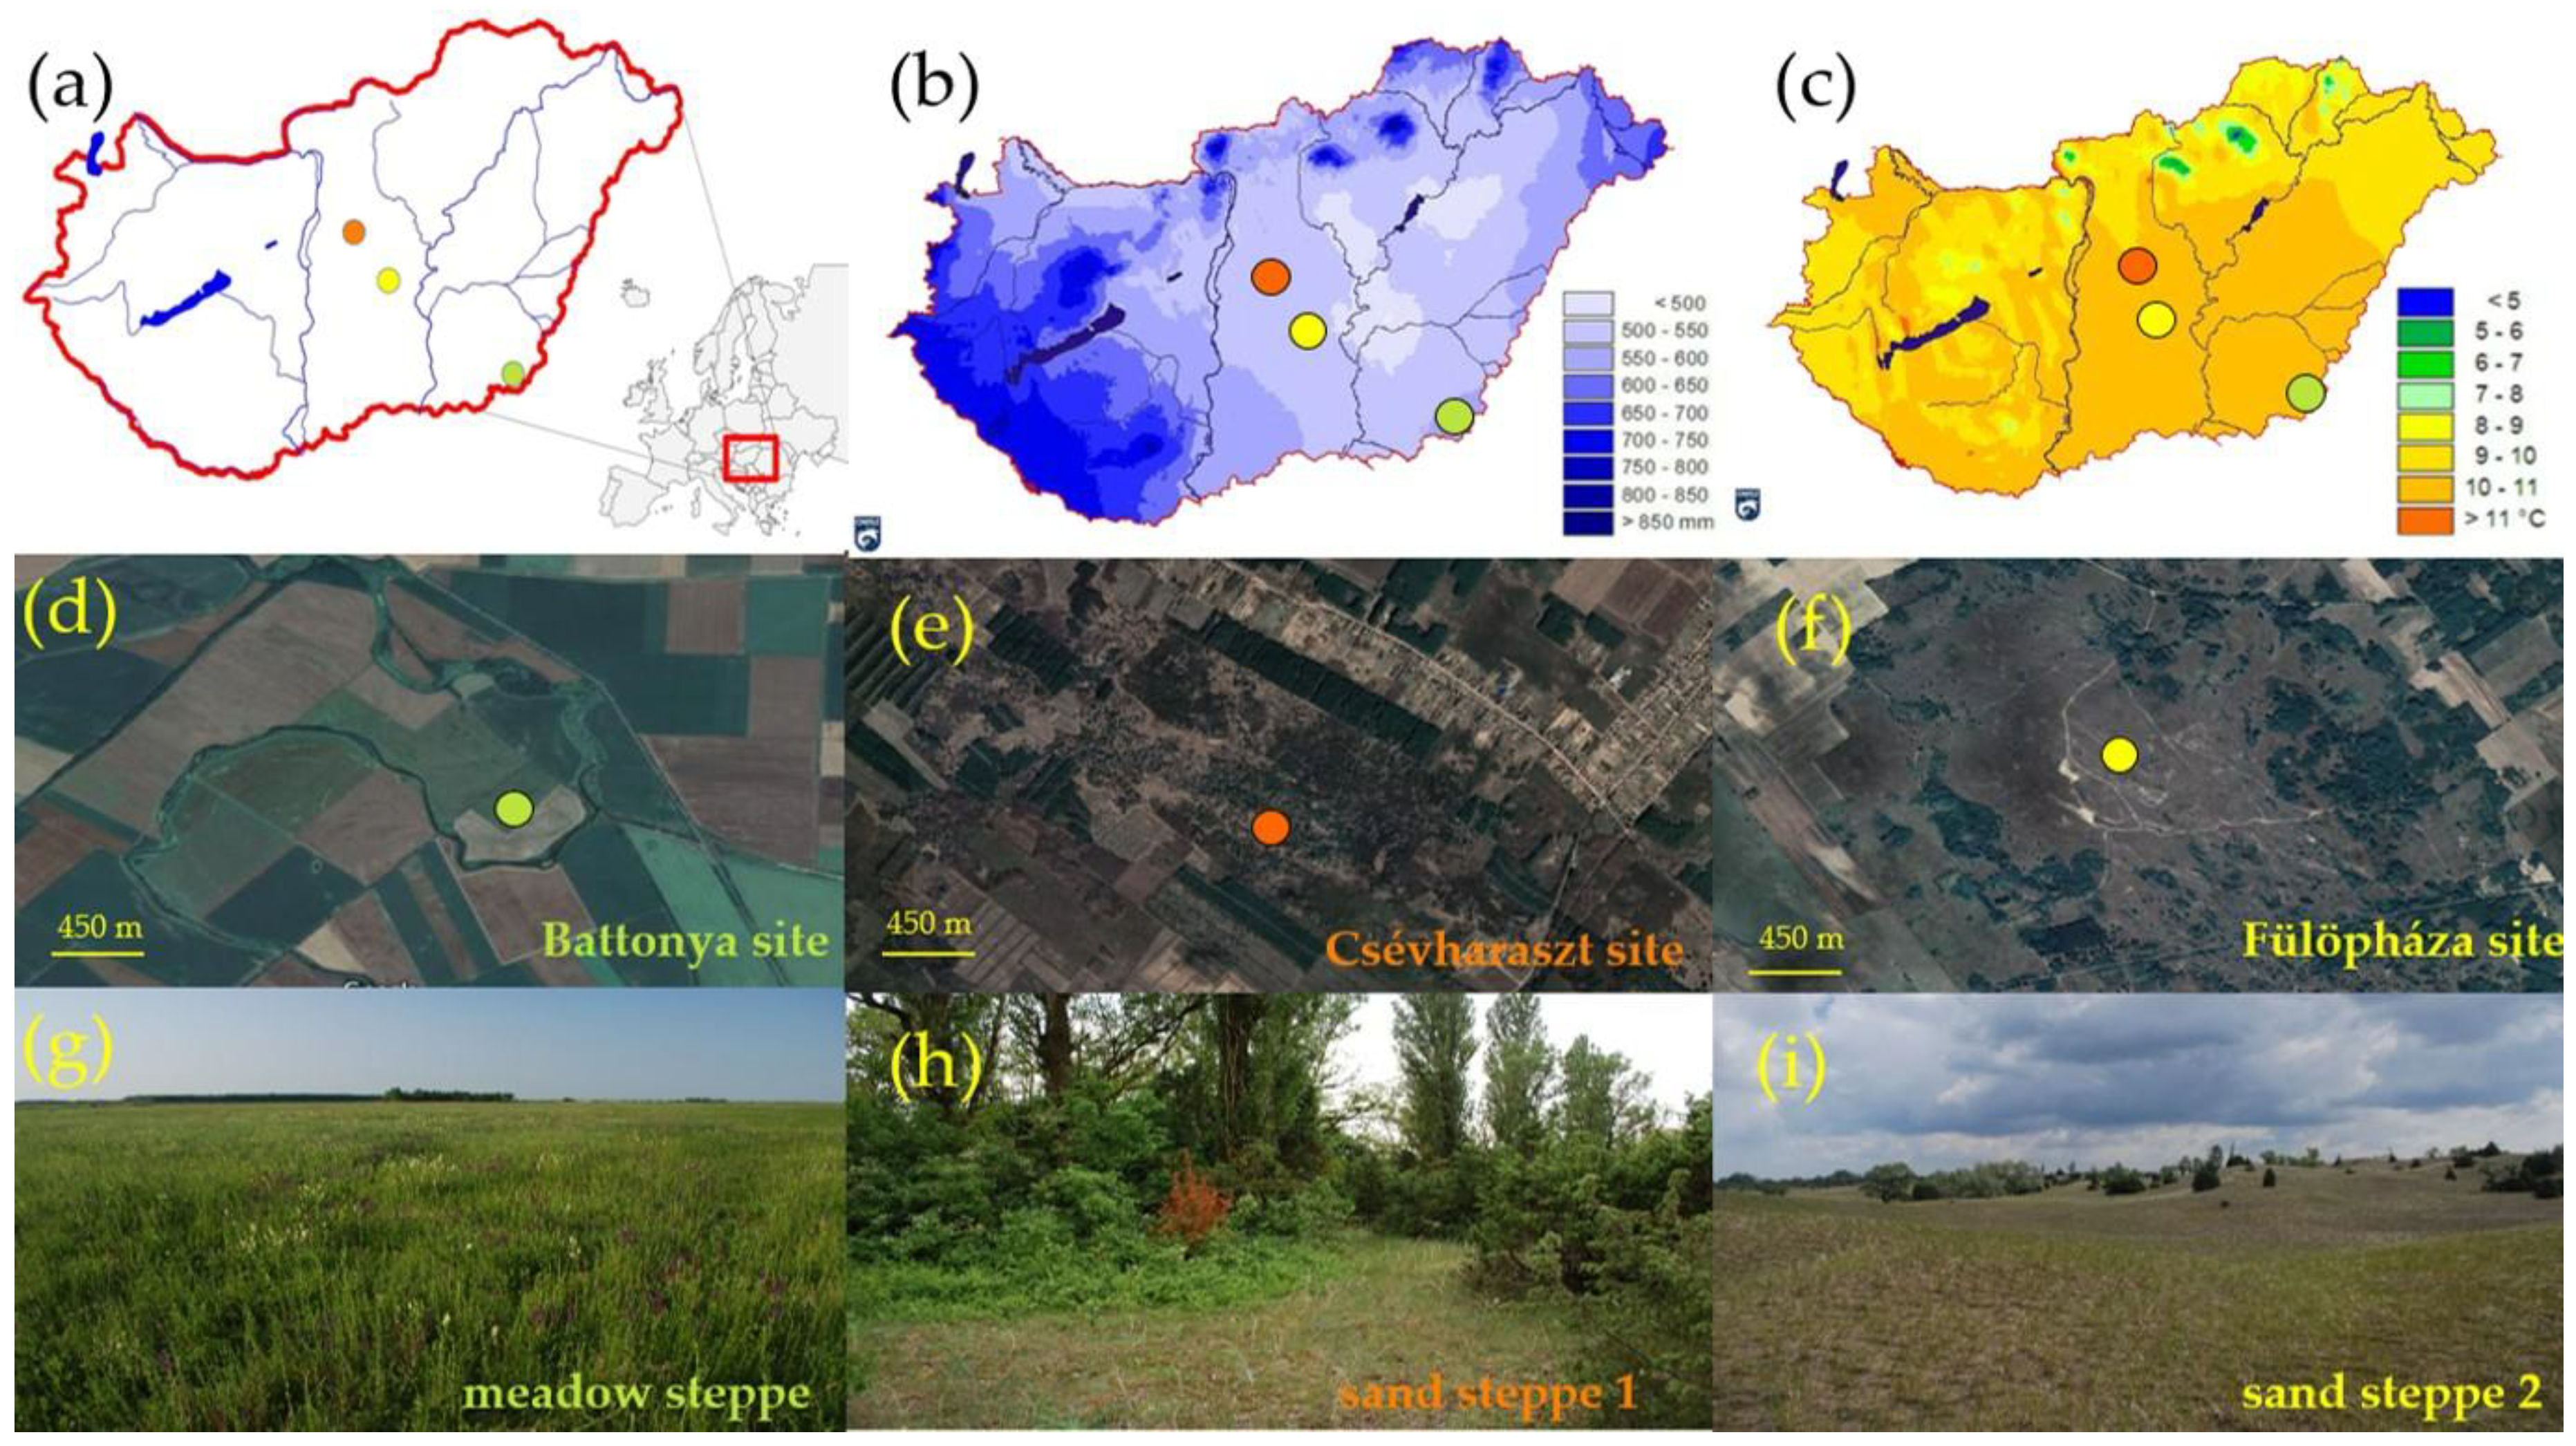
2.1. Study Sites

The study was conducted in the Great Hungarian Plain, Hungary. The Great Hungarian Plain is a lowland area (75–180 m above sea level) with low relative relief [30]. Human activity has caused most of the original forest-steppe vegetation to be converted into arable lands or forest plantations; notwithstanding, few natural grassland remnants (ca. 6.8%) have survived in isolated patches [31]. Three long-term monitoring sites were established within these remaining and well-preserved natural grasslands (Figure 1).
(a) Loess meadow steppe at Tompapuszta (46°36′ N, 20°98′ E, elevation 99 m; Körös–Maros National Park) near Battonya. This site is one of Hungary’s largest well-preserved climatically zonal meadow steppes on humus-rich chernozem soil developed over loess. The dominant species was Festuca valesiaca. Other abundant plant species were perennial grasses Poa angustifolia, Carex praecox, Elymus hispidus, Alopecurus pratensis and perennial forbs Teucrium chamaedrys, Galium verum, Fragaria viridis, Thymus pannonicus and Salvia nemorosa. The proportion of annual species was 29.7%, and the vascular plant species pool (in 20.9 ha) was 274 species [32].
(b) Sand steppe at Csévharaszt (47°17′ N, 19°24′ E, elevation 140 m; Duna–Ipoly National Park). Sand steppes developed on loose, humus-poor sand. The dominant species were tussock grasses Festuca vaginata, Stipa borysthenica and Koeleria glauca. Other abundant species were perennial forbs Artemisia campestris, Euphorbia seguieriana, Fumana procumbens, Centaurea arenaria, Dianthus serotinus and annuals Secale sylvestre, Holosteum umbellatum, Kochia laniflora and Salsola kali. The sand steppes formed a mosaic with the steppe woodlands of Quercus, Juniperus and Populus scrub. The proportion of annual species was 54.3%, and the species pool (in 50 ha) was 108 species [33].
(c) Sand steppe at Fülöpháza (46°53′ N, 19°23′ E, elevation 130 m; Kiskunság National Park). This site also has sand steppe vegetation with soil and species composition similar to the Csévharaszt site. However, the Fülöpháza site is more open with only scattered woody plants (Figure 1). The proportion of annual species was 44.1%, and the species pool (in 50 ha) was 60 species [33].
The sites have similar warm temperate climates, with a sub-Mediterranean influence. The mean annual precipitation (MAP) is 500–550 mm, while the mean annual temperature (MAT) is 10–11 °C (based on 30 years of meteorological data, 1960–1990). However, as we noted in the Introduction, the Great Hungarian Plain experienced considerable climate changes over the last decades with increasing annual temperature and increasing inter-annual precipitation fluctuation (cf. Supplementary S1). All sites were used as grazing land in the past. After they became nature conservation areas, the management changed. The two sand steppe sites became abandoned after protection while the loess meadow steppe was managed by mowing once a year.

2.2. Vegetation Monitoring and Computerized Sampling for Species Richness Data

At each site, two 20 m long permanent belt transects were sampled annually in late May, during the phenological optimum of communities. We took the samples from homogeneous vegetation patches. The two transects run parallel within the same homogeneous vegetation patch separated by ca. 6 m. The endpoints of transects were permanently marked. The presence of vascular plant species rooting in 400 contiguous microquadrats of 0.05 m × 0.05 m size were recorded along the transects. This sampling provides an objective and precise baseline record to follow fine-scale changes in species patterns and diversity [23,34].
The baseline transects were re-sampled with the computer with varying sizes of grain [22,23]. Computerized sampling enabled us to estimate the mean species richness at different scales (Supplementary S2).

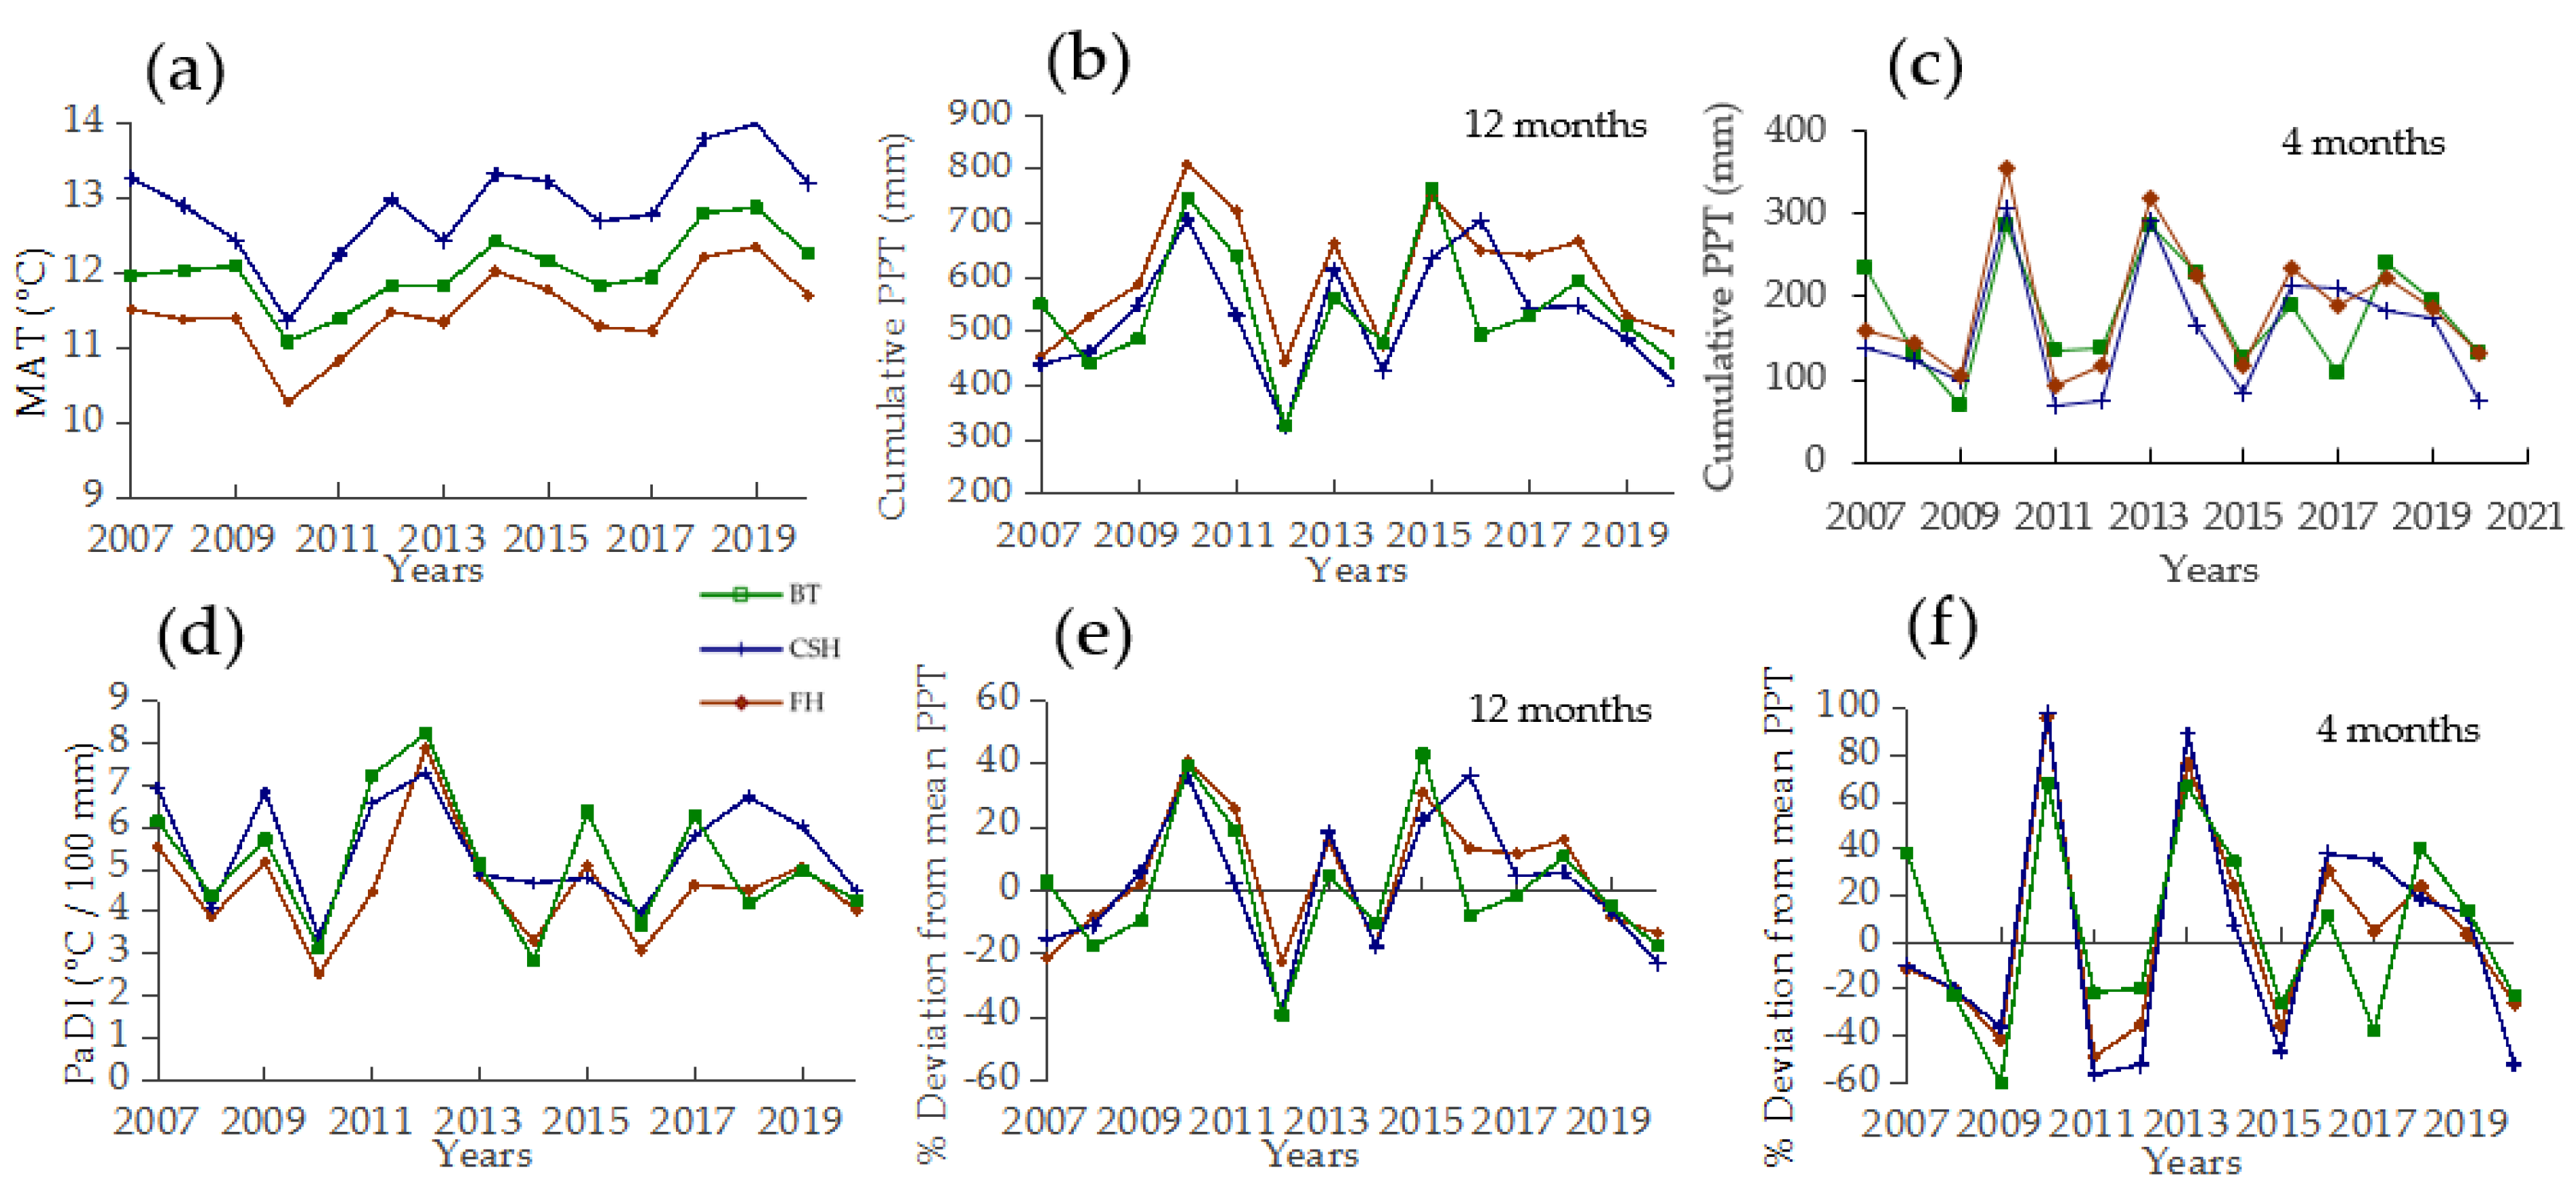
2.3. Meteorological Data

Monthly precipitation and temperature data came from the database of the Hungarian Meteorological Service, which is publicly available (https://odp.met.hu/climate/station_data_series/daily/from_1901/, accessed on 21 October 2021). We used the data of the Budapest station for the Csévharaszt site, and the meteorological station is Szeged for the Battonya site. Data for the Fülöpháza site were collected in the KISKUN LTER Field Station in Fülöpháza. The annual effect of precipitation was determined using the cumulative precipitation occurring 12 months (prec_12) before vegetation sampling in late May; this is contrary to calendar annual (January to December) sums. Early season precipitation was also calculated as the cumulative precipitation of 4 months (Prec_4) before vegetation sampling. The Pálfai aridity index [35,36,37] (Supplementary S3) was used to test the combined effects of temperature and precipitation.

2.4. Analyses

2.4.1. Testing for Trends in Weather and Temporal Diversity Patterns

To establish climatic trends, we performed a series of preliminary linear models (lm) to analyze the long-term trends of weather characteristics in the Great Hungarian Plain using our climate data (Supplementary S1). We used base R’s “lm” function [38] to create the linear models. We also checked the trends in the case of climate variables (precipitation, mean annual temperature and Pálfai Drought Index) during our study period (between 2007 and 2020) using a linear mixed-effect (LME) model [39] with year as the predictor and site as a random factor. We used the “nlme” package’s LME function [40] to create the LMEs. The normality assumption of species-richness data was tested by the Shapiro–Wilk test. First-order autocorrelation was checked with “corAR1” function [40]. R2 value was obtained by “r.squaredGLMM” function in the “MuMIn” package [41]. Similarly, we also tested the trend in species richness using LMEs; specifically, the LMEs were separately prepared for each site, with year as the predictor and scale (10 cm, 2 m and 40 m) as a random factor.

2.4.2. Testing for Spatial Synchrony of Temporal Patterns among and within Sites

For measuring the synchrony of temporal fluctuations between two time series i and j, we used a simple index proposed by Buonaccorsi et al. [24]. The index is the ratio of the number of concurrent increases and decreases over time divided by the number of transitions (Supplementary S4). The synchrony of multiple series was expressed by the average of the pairwise measures. The significance of observed synchrony was tested by null models randomizing the observed values among dates (999 complete randomizations over time) (Supplementary S4).
We used information theory models [42,43] for calculating temporal association (coincidence) between drought events and minima of species richness (for details of the methodology and calculations, see Supplementary S5 [42,43,44,45]). The significance of the observed multiple associations was tested by null models randomizing observed peaks among dates (999 complete randomizations over time). The related calculations have been performed by the “comspat” R package (comspat [44]).

2.4.3. Testing Relationships between Species Richness and Weather Characteristics

We tested the relationship between species richness values, precipitation (prec_4 and prec_12) and the mean annual temperature data with LMEs. Specifically, separate models were prepared for the three spatial scales, and the site was included as a random factor. Normality was checked, p-values were corrected and R2 values were extracted following the methods above.
All analyses were conducted in R version 3.6.3 [38].

3. Results

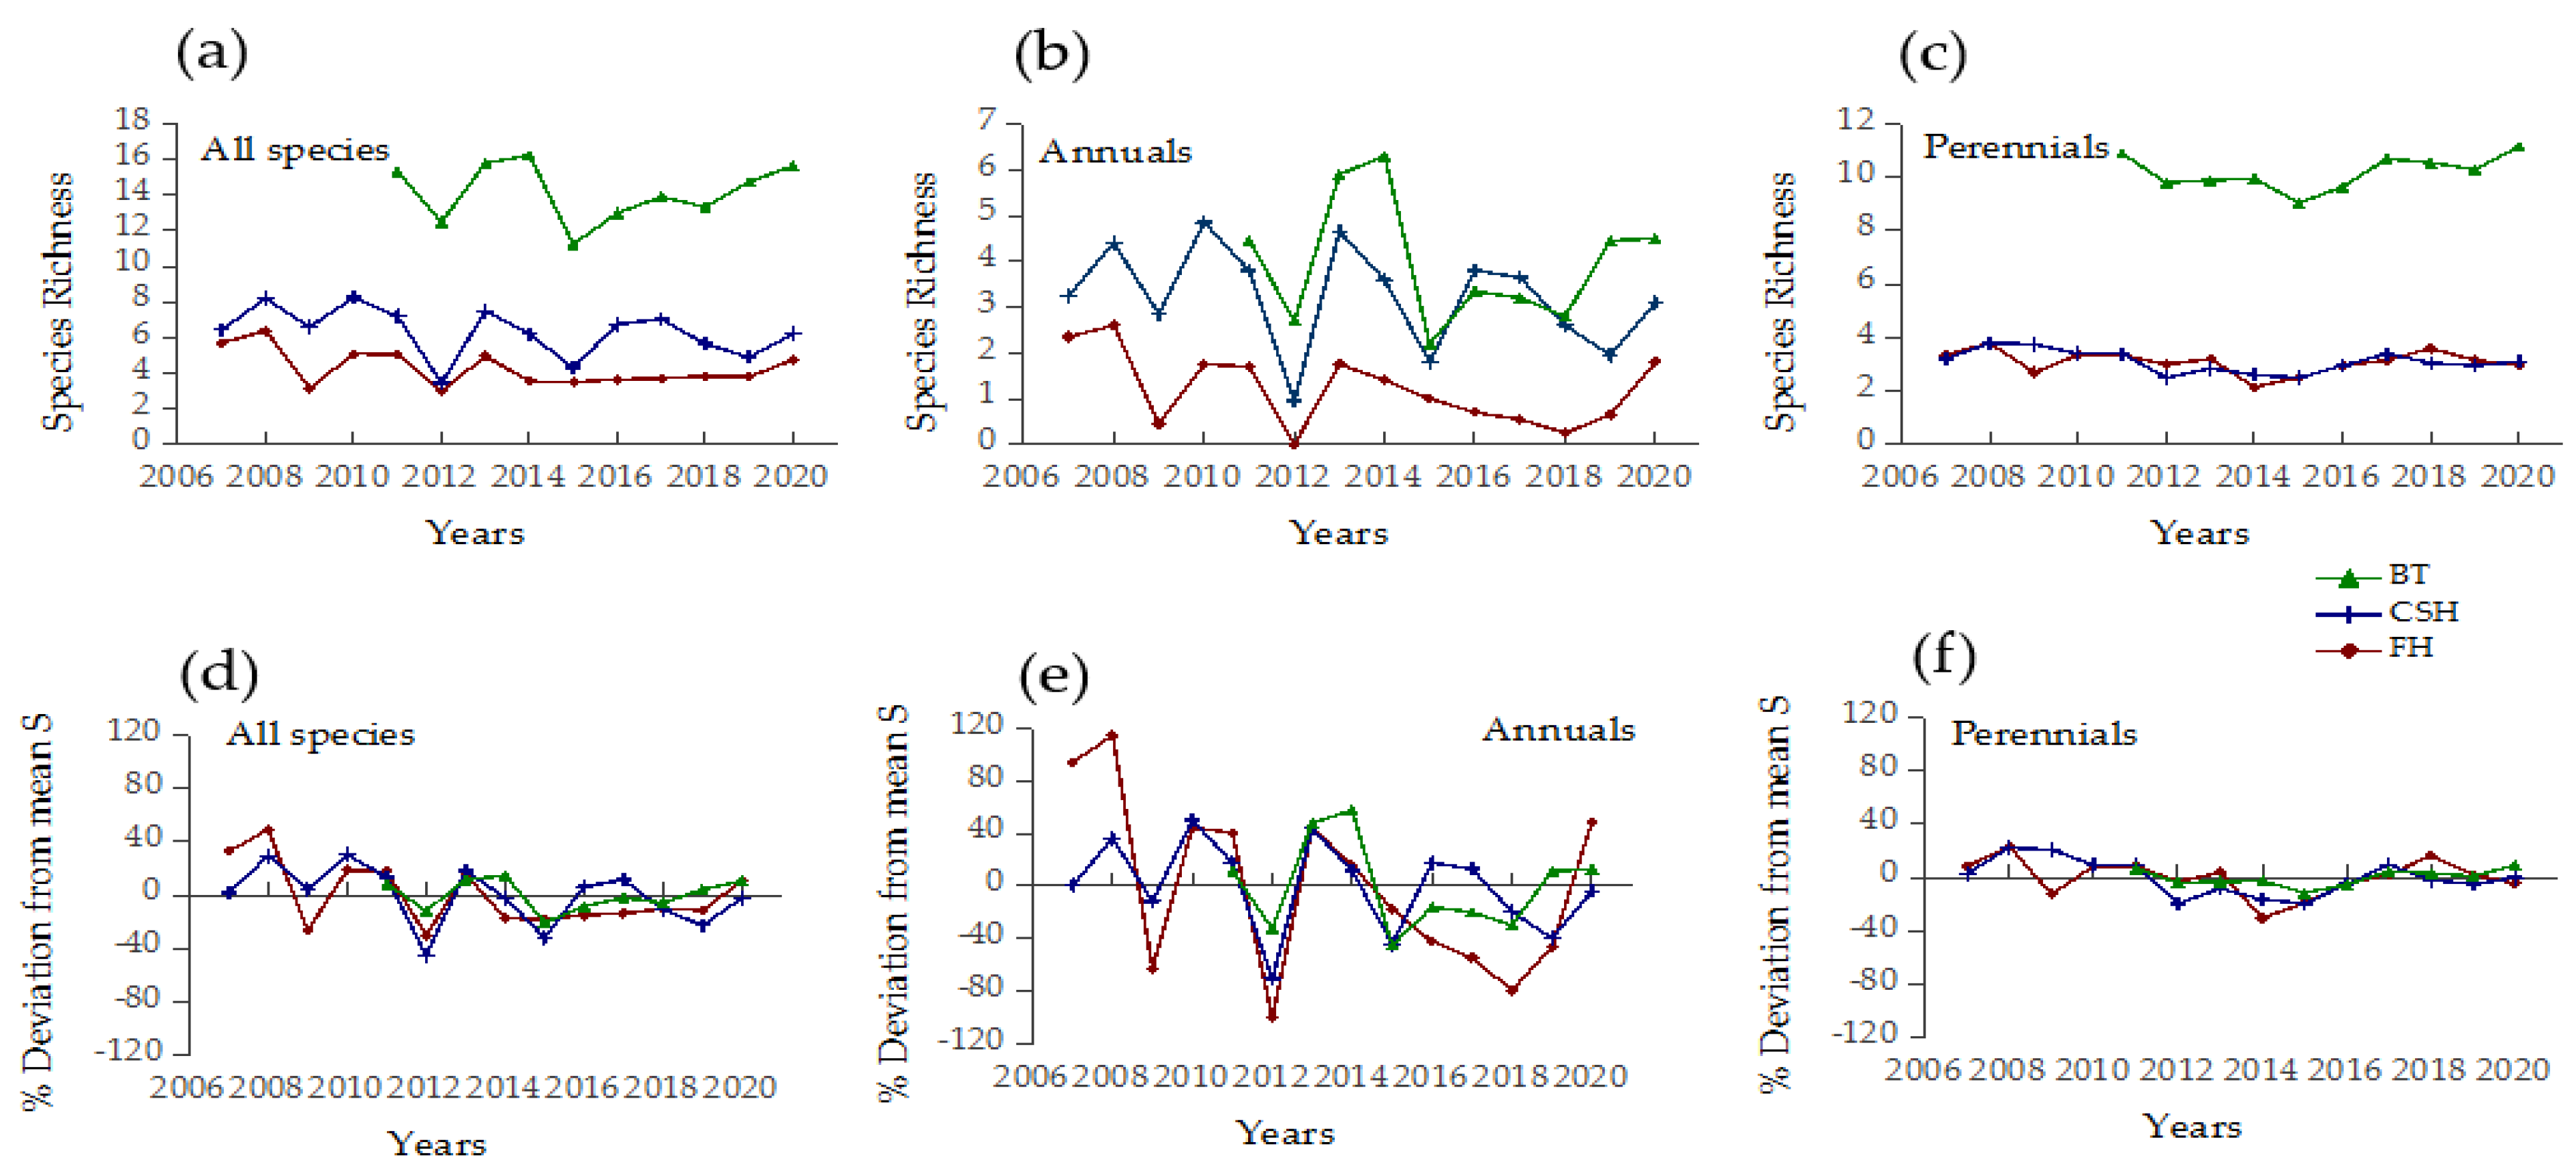
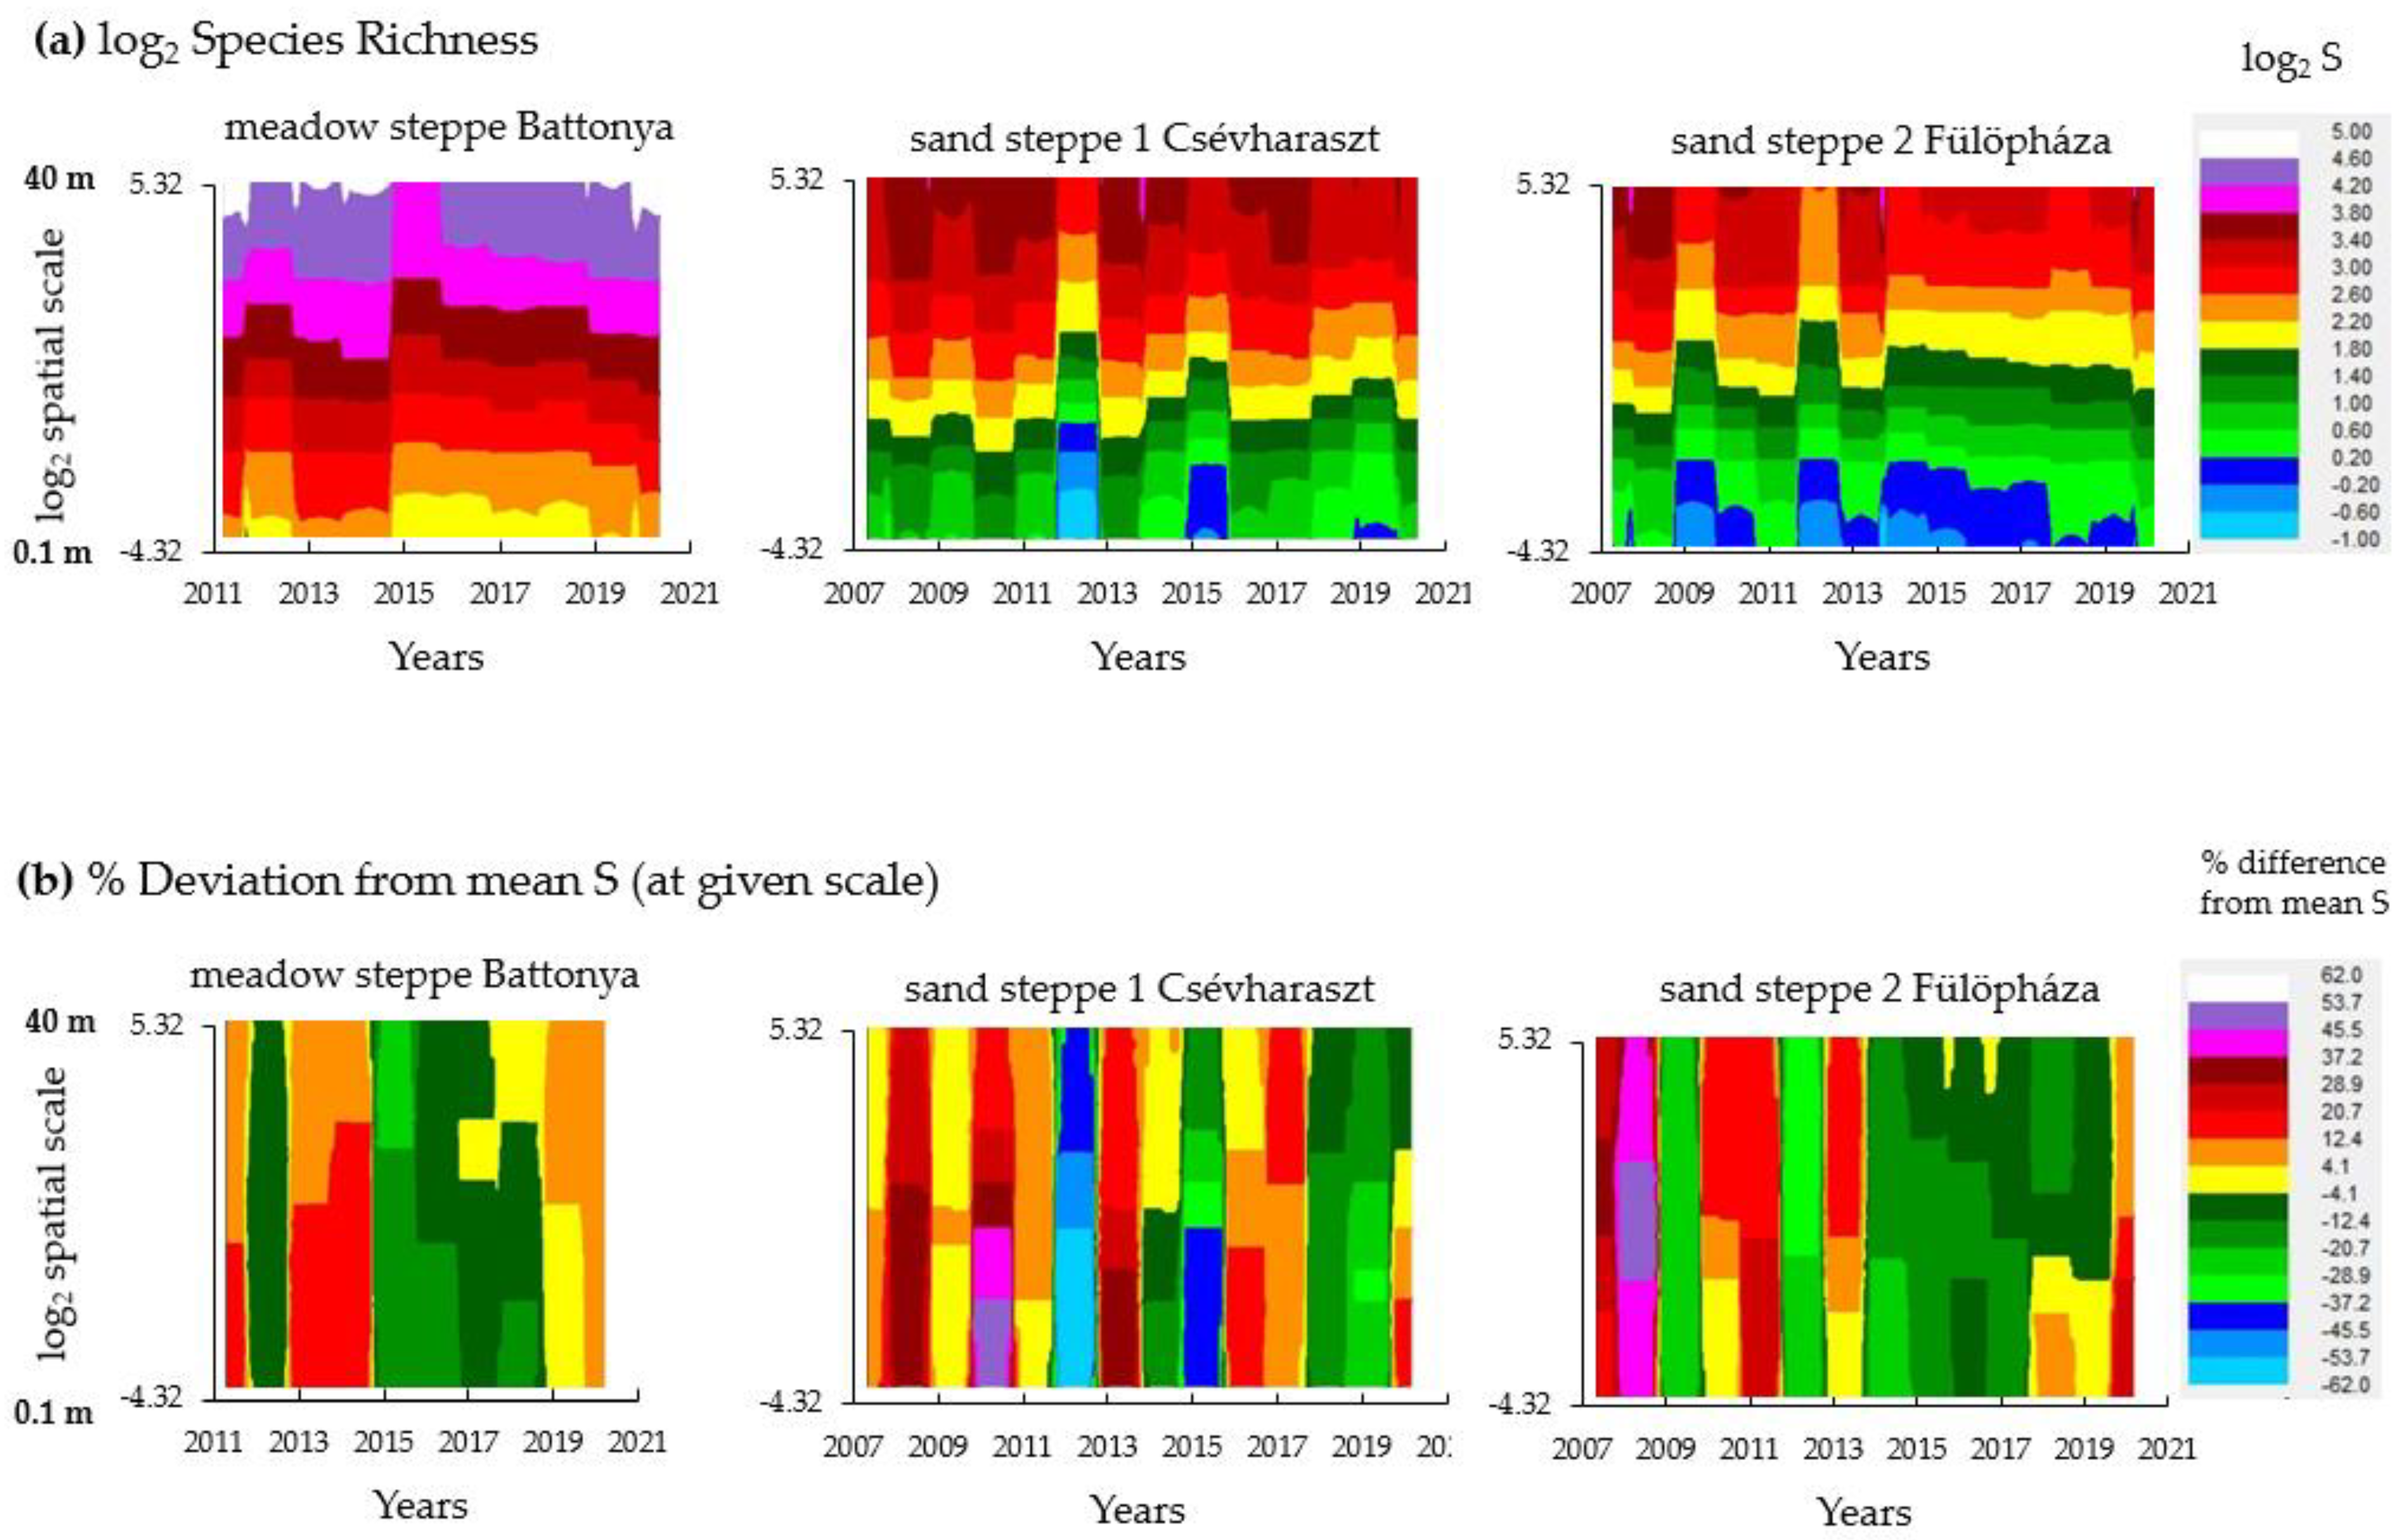
3.1. Weather Fluctuations and Temporal Diversity Patterns

The mean annual temperature varied ca. 2.5–3 °C during the 2007–2020 monitoring period (Figure 2a). There were no significant linear trends in climate through time (Supplementary S6.1 [38,39,40,41,46]). The most prolonged period of drought appeared over two years in 2011 and 2012. The mean precipitation over the study period corresponded to the long-term average reported from the region (500–550 mm). However, fluctuations were large, varying between 322 mm and 809 mm (Figure 3b). The Pálfai aridity index indicated several drought events between 2007 and 2020 (Figure 2d). The percentage annual rainfall deficit (expressed as the percentage deviation from the mean value) was the largest in 2012 (−25, −38 and −39% at the three sites) (Figure 3e). When the early season precipitation was considered (expressed by the total precipitation during four months before our late May vegetation sampling), the magnitude of rainfall variation was even larger, with more than 40% rainfall deficit at four times (in 2009, 2011, 2012, 2020) and 30% deficit once (in 2015) (Figure 3f). In particular, wet years were also present with 90% and 60% surplus rain in 2010 and 2013.
The trend in species richness through time was analyzed using separate LMEs for each site and plant group (whole community, annuals and perennials). There were no significant trends in species richness in either case of regressions (Supplementary S6.2). Considerable fluctuations of species richness were detected at all sites (Figure 3a–c) with +40% and −40% deviations around the mean temporal species richness at the community level (Figure 3d). The species richness of annuals varied even more (from +120% to −100 percentage deviations from the mean) (Figure 3e). In contrast, the fluctuations of perennial species richness were less variable and remained within a range of +20 to −20 deviations around the mean (Figure 3f).

3.2. Spatial Synchrony among Sites

Visual observations suggest spatial synchrony among the three study sites’ temporal weather characteristics (Figure 2). These observations were confirmed by quantitative analyses that showed strong and significant temporal correlations between these patterns (Table 1).
Visual observations also suggest synchrony of temporal species richness patterns among sites (Figure 3). However, this synchrony was scale-dependent. The synchrony index was marginally significant at a 2 m scale. The synchrony index values varied between 0.704 and 0.778, indicating that species richness changed in the same direction at each site in 70–78% of the inter-annual transitions. No synchrony was detected at a coarse 40 m or very fine 0.1 m scales (Table 2).

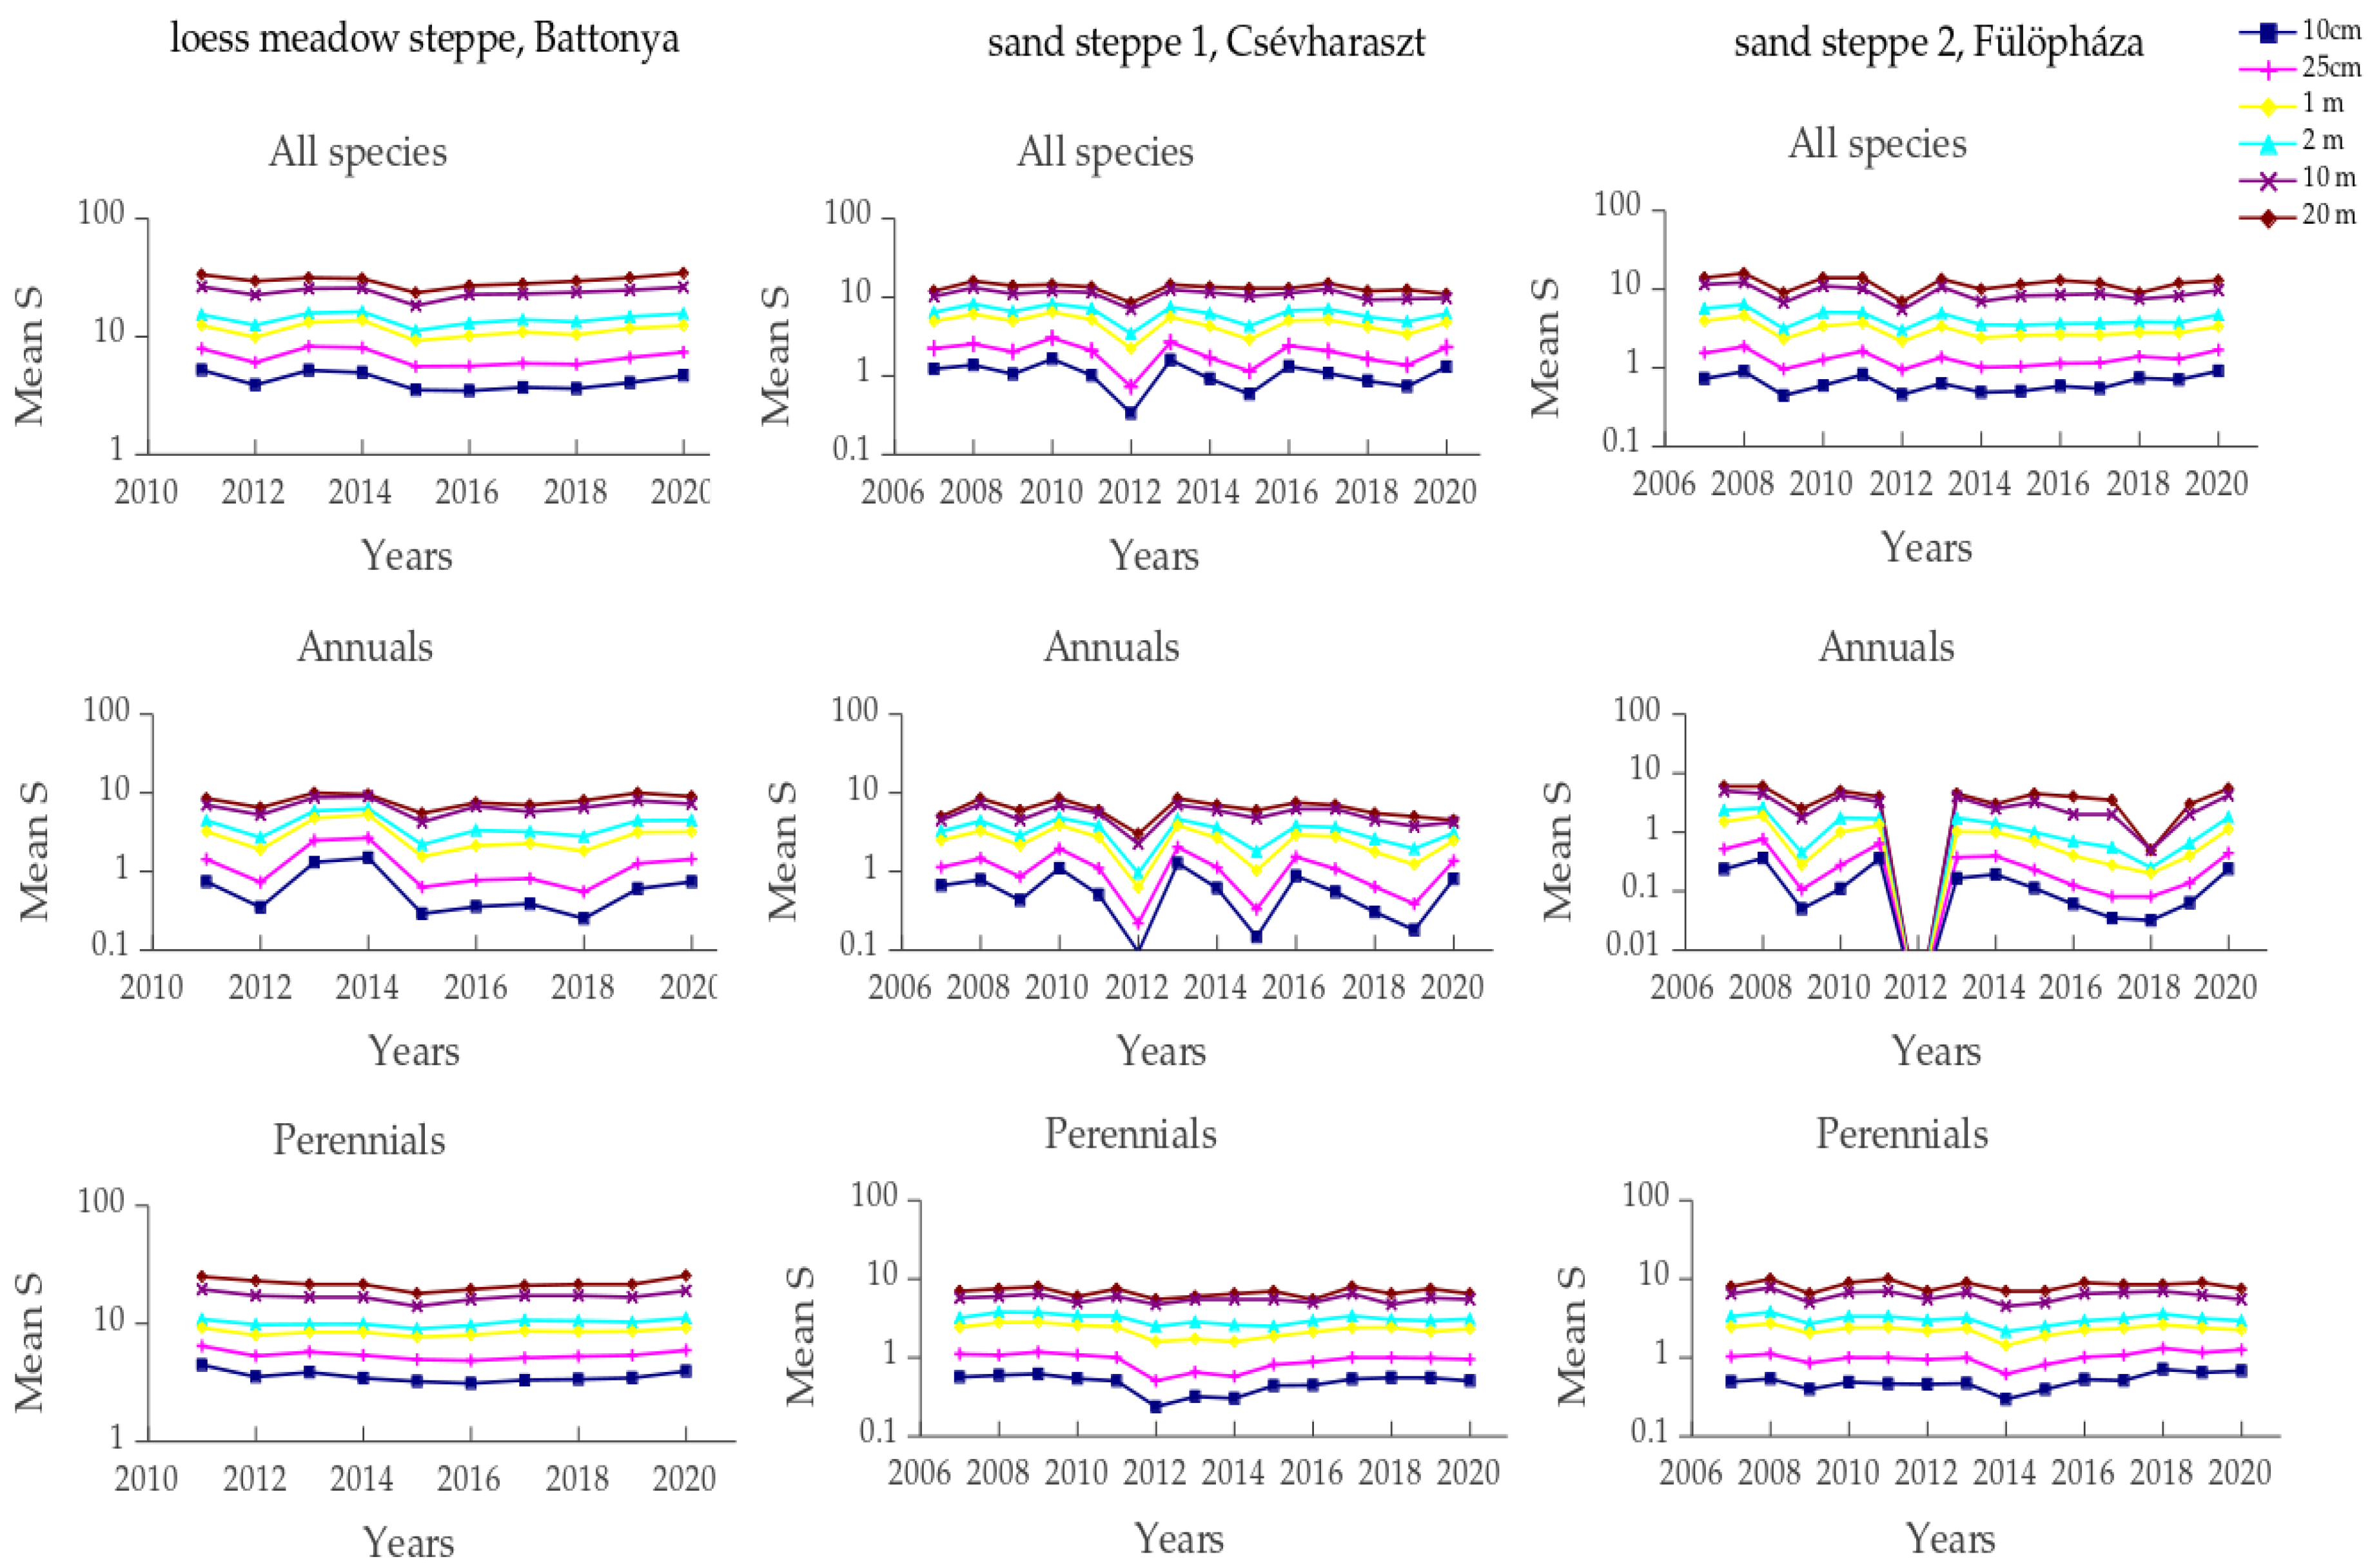
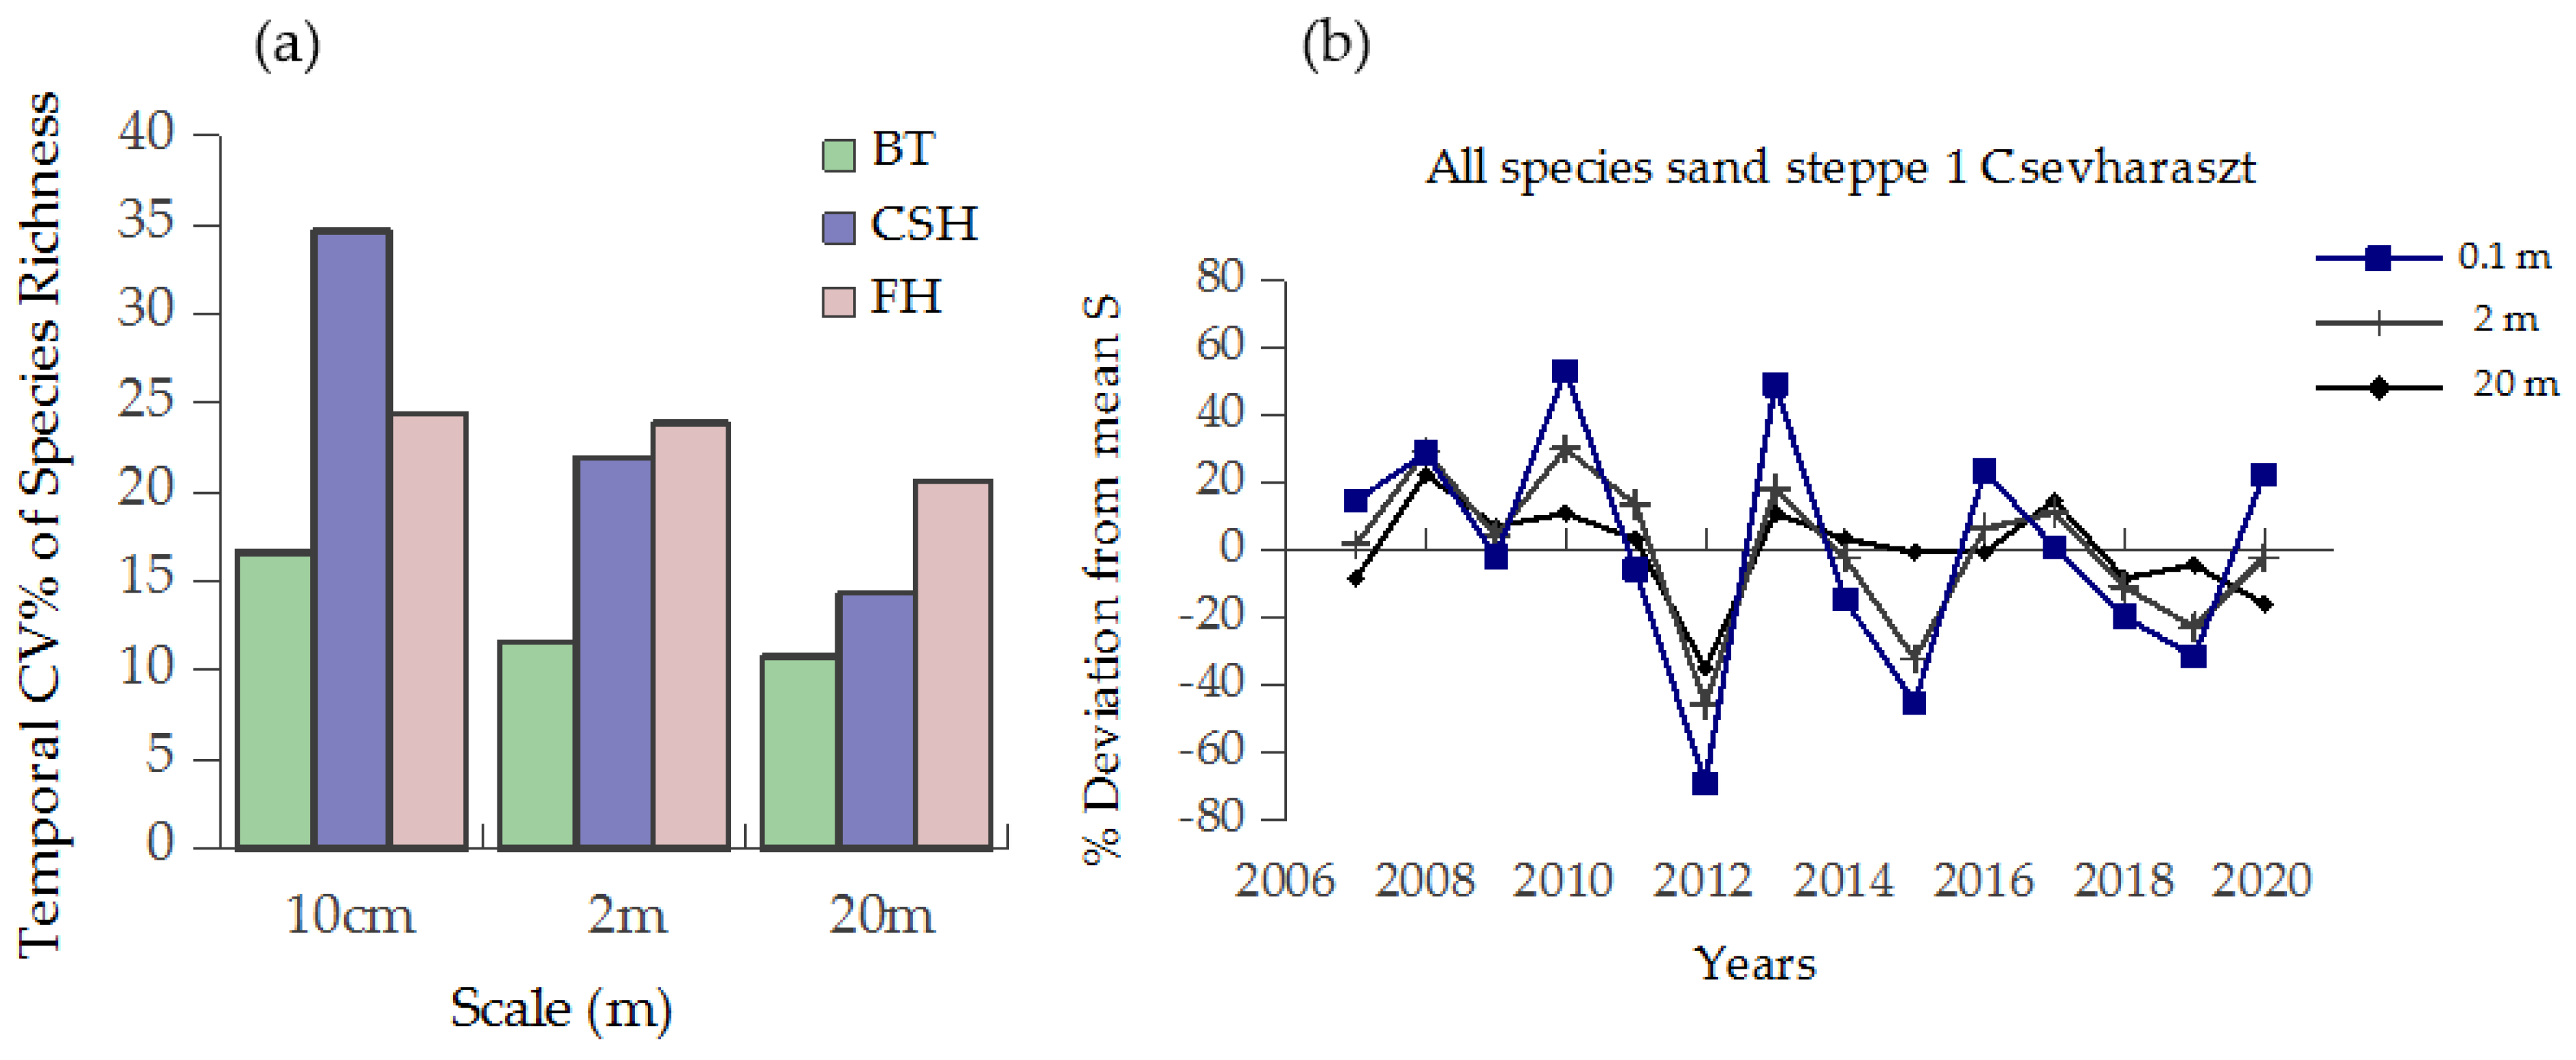
3.3. Synchrony of Species Richness Within-Site over Different Spatial Scales

Temporal patterns of species richness were consistent over scales (see Figure 4 and Figure 5). The local maxima and minima (i.e., dates with the largest and smallest richness values) remained similar after changing the spatial scale of diversity observations.
Significant synchrony of temporal richness patterns was found between scales. Synchrony over scales was significant at all sites and for all species groups. The mean synchrony values ranged from 0.621 and 0.622 for perennial functional groups at the Csévharaszt and Battonya sites to 0.949 for the annual functional group that occurred on Csévharaszt’s open sand steppe (Table 3).
Although the temporal fluctuations of species richness were consistent between spatial scales, some scale dependence could be detected. The results show a slight tendency for a larger relative variability at finer scales. The largest temporal coefficient of variation (CV%) of species richness and the largest local deviations from mean temporal richness appeared at the finest scale at 0.1 m in all the three sites (Figure 6). CV% gradually decreased with increasing plot sizes, and the variation was higher in the xeric sand steppe sites (at Csévharaszt and Fülöpháza).

3.4. Relationships between Weather Fluctuations and Diversity Patterns

We tested relationships between species richness values and potential climatic drivers (precipitation, aridity index and mean annual temperature) with linear mixed effect models. Only the Pálfai index showed a significant negative relationship with species richness at a 2 m spatial scale (p = 0.025). However, after adjusting for multiple tests, none of the tested relationships remained significant (Supplementary S7). When the coincidence of peaks was tested, significant temporal associations were found between the minima of precipitations, the maxima of the aridity index and the local minima of species richness at each site (Table 4). These patterns were consistent for all species groups.

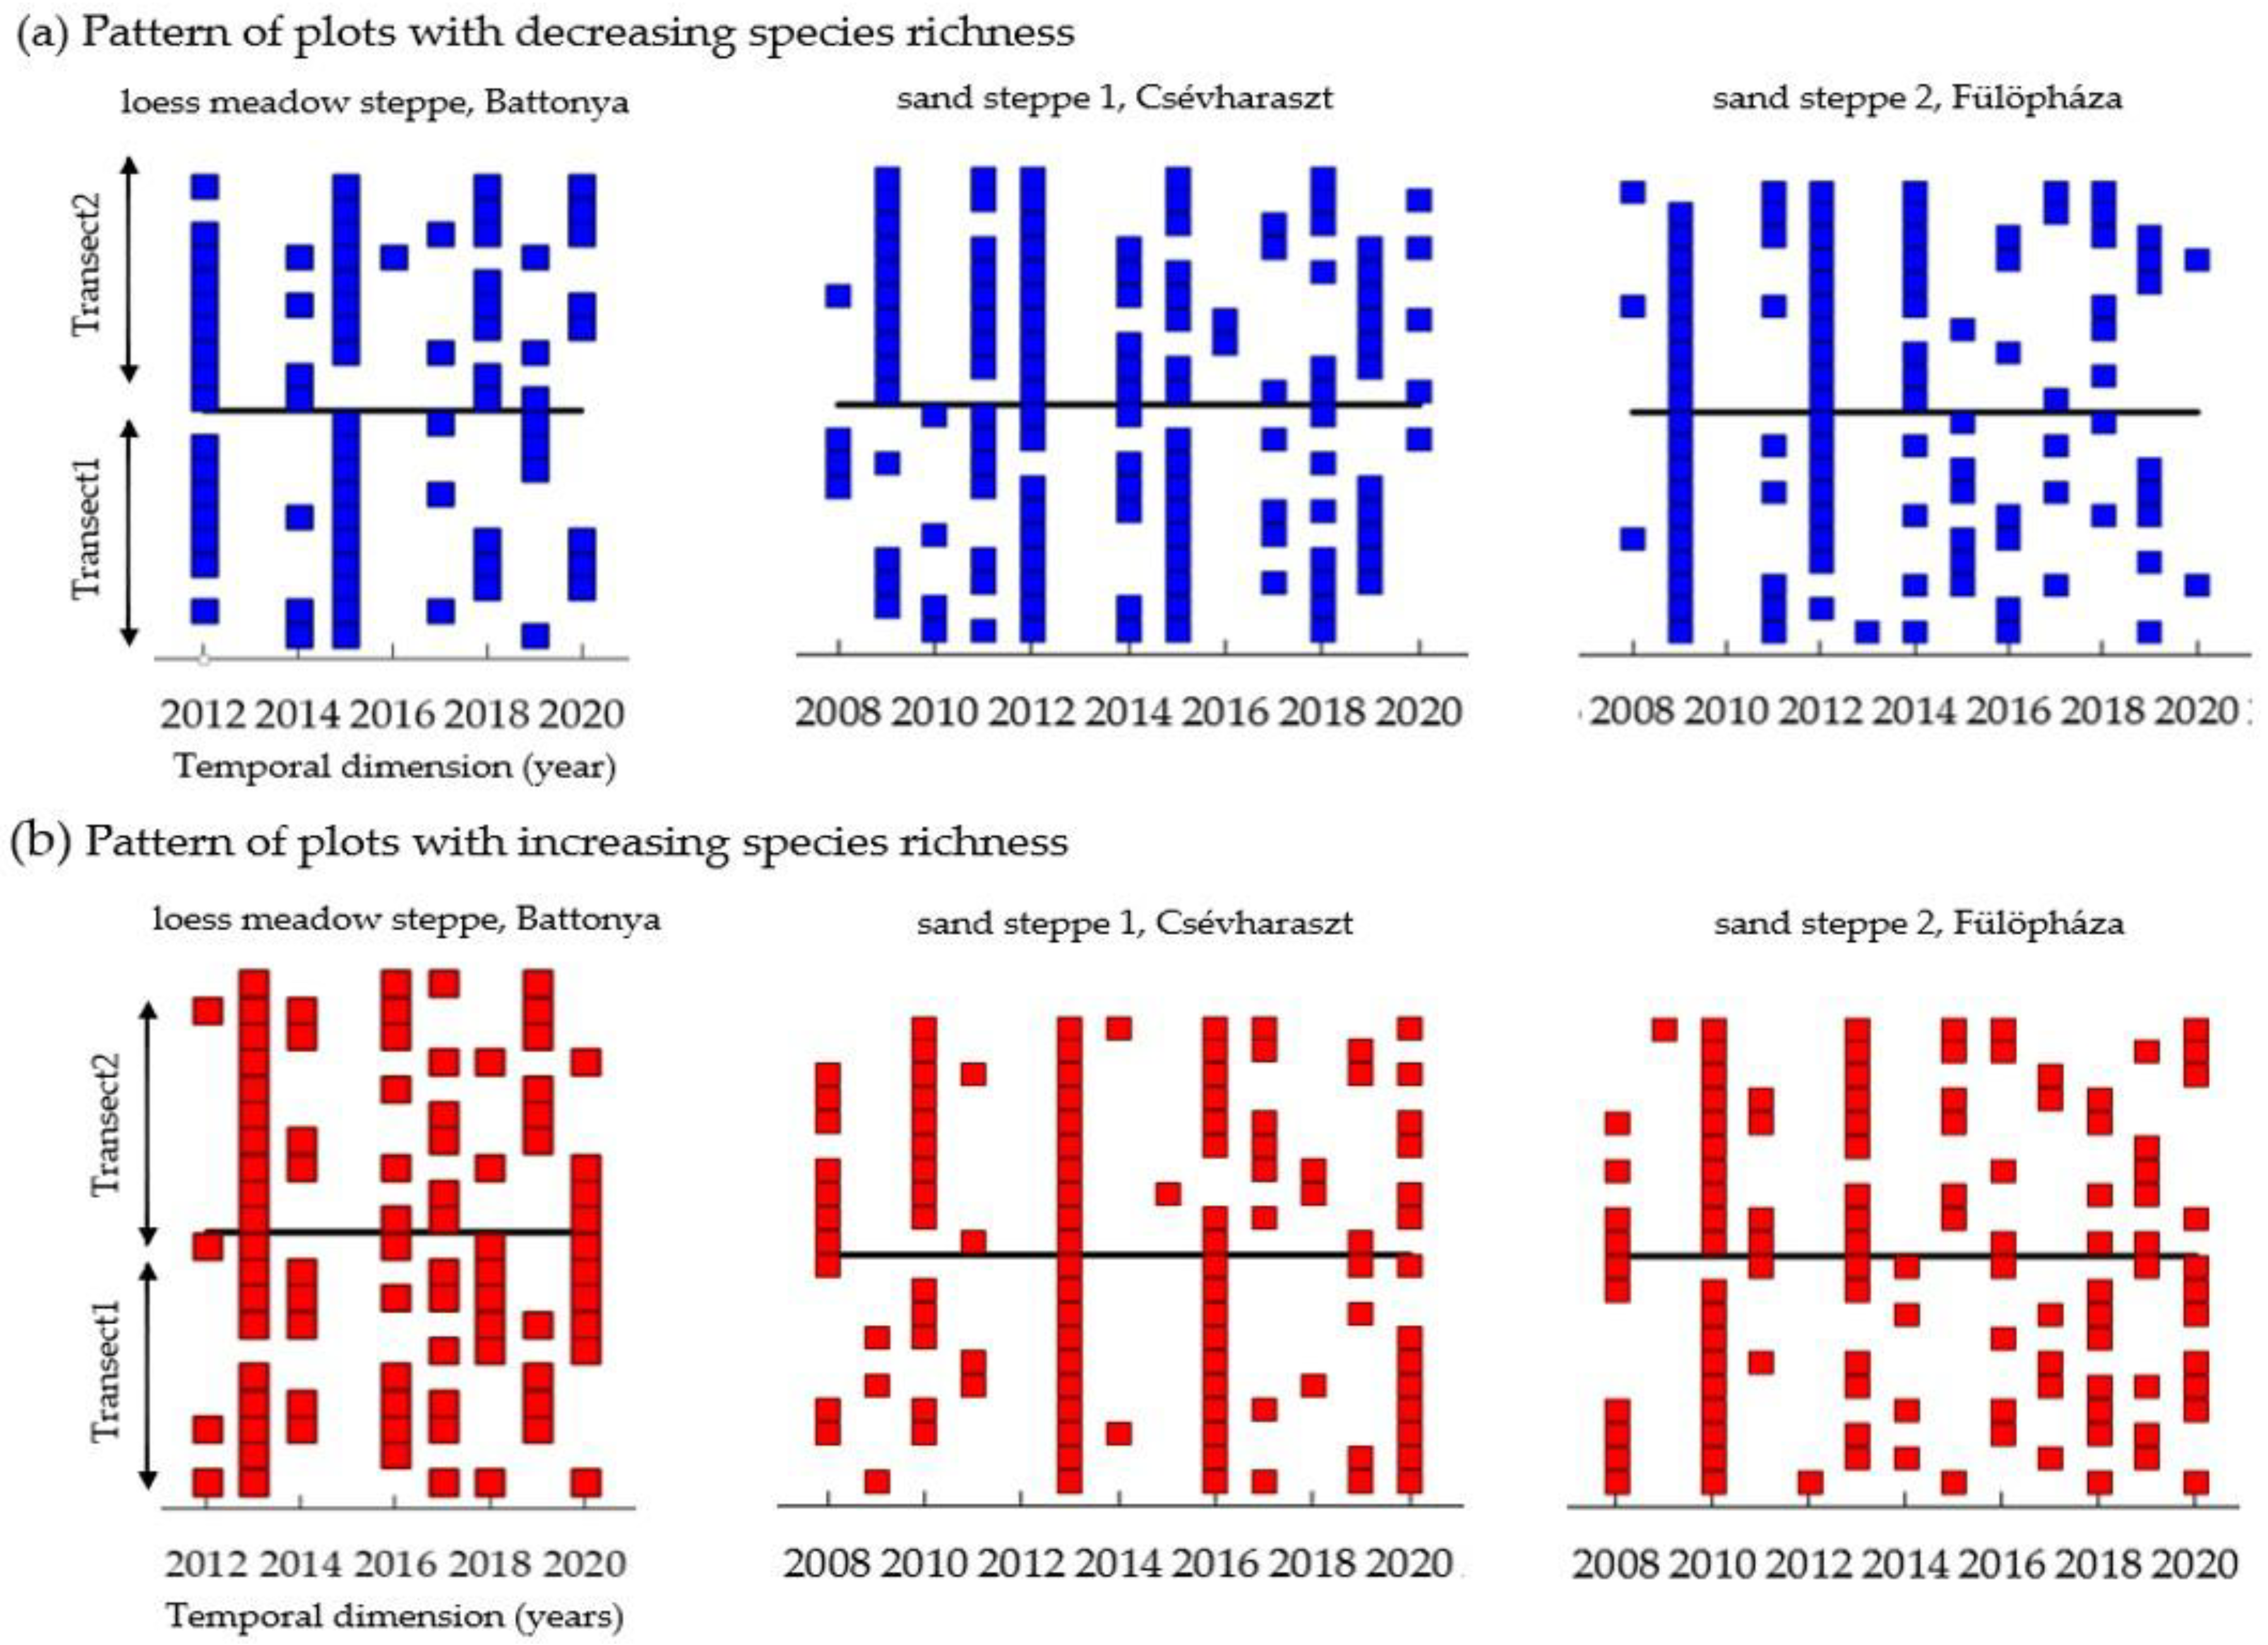
3.5. Micro-Scale Spatial Synchrony of Inter-Annual Diversity Changes

The long-term (10–14 years) diversity patterns were analyzed in previous sections. Here we focus on the spatial synchrony of short-term inter-annual changes. Permanent transect data enabled us to test patterns of species-richness changes in contiguous plots. The number of plots (tested at 2 m scale) with decreasing local species richness was higher in drought years (e.g., in 2009, 2012, 2015) compared to other years (Figure 7a). These results indicate that species richness changes became spatially synchronized in these years. An opposite trend appeared in wet years after droughts (e.g., in 2010, 2013 or 2016) when the increasing species richness became spatially synchronized (Figure 7b). The degree of short-term synchrony varied between years. However, short-term diversity changes become synchronized in 70–100% of plots in years with extreme weather. These patterns were consistent between sites and vegetation types (Figure 7).

4. Discussion

By analyzing the long-term time series of diversity patterns in plant communities at multiple spatial scales, our results showed that diversity changes were associated with the variability of weather events. Diversity collapsed during droughts but recovered fast in subsequent years. Larger effects appeared in the more xeric sand steppes compared to the more mesic humus-rich loess meadow steppe, and annual species showed the strongest responses. We found no degradation signals or other directional diversity changes between 2007 and 2020.

4.1. Diversity Patterns Indicate Stable Vegetation despite Extreme Weather Fluctuations

Regarding our first hypothesis (H1), we found no trends but considerable inter-annual variability of weather and similarly considerable temporal fluctuations of species richness. Annual rainfall and the community-level species richness varied at the same magnitude ( X ¯ ± 40%). The mean annual temperature varied about 2.5–3 °C. Our study’s diversity responses were similar to the magnitude of responses found in other observational studies [8,28,47]. However, the temporal variation of diversity was ca. three times higher than diversity responses reported from manipulated field experiments [14,15]. The direction of diversity responses to weather fluctuations was consistent within and between sites and consistent with the patterns described from field experiments [16].
The species richness of annual species varied highly (−100 to +120% around the mean), while only slight ( X ¯ ± 20%) variation was found in the functional group of perennial plants. These patterns are in line with our expectation (H4) and with previous studies [9,16,27,29] and can be attributed to the specific traits of this functional group [2,47,48]. Like other studies [8,16], we found a slightly higher relative inter-annual diversity variation in the more xeric open sand steppe than the loess meadow steppe.
Weather data from 2007 to 2020 support the conclusion of a previous study [30] that recurrent droughts are among the major environmental hazards in the Great Hungarian Plain. In our study, droughts occurred every 3–5 years, with one severe drought occurring between 2011 and 2012. Not all extreme climatic events induce extreme ecosystem responses [13]. The ecology of extreme events is a new research field with emerging and still-debated concepts [49,50]. In our study, annual species completely disappeared in 2012 (during the second year of severe drought) in one of the investigated xeric sites (in Fülöpháza). We consider this event an extreme vegetation response, and therefore, the related weather event can also be regarded as an extreme climatic event (ECE sensu [50]). Little is known about the long-term dynamics of ecosystem responses after such extreme events in nature. Experiments applying extreme drought treatments focused on productivity and found that productivity recovered fast after one year [51]. In contrast, in a field study, species richness recovered very slowly (only over eight years) after extreme drought [47]. Despite similar magnitudes of severe drought (50% precipitation decrease in Tilman’s study and 40% decrease in our study) and similar magnitudes of diversity collapse (38% vs. 40%), our study showed rapid post-drought diversity recovery compared to [47]. In our study, species richness declined sharply but quickly recovered (over about one year) after the drought. This finding was consistent across the three studied natural grasslands, i.e., the fast recovery of diversity was independent of the soil, species pool, landscape context and land-use history of these grasslands.
At a larger temporal scale (between 1980 and 2020), there are clear trends of increasing mean annual temperature (ca. 1 °C per 20 years) and increasing inter-annual variability of precipitation (ca. 2% increase over 20 years) in our study area (cf. Supplementary S1). However, we did not find temporal trends in species richness over the study period (2007–2020). Observational studies with a similar temporal extent (15–20 years) reported decreasing species richness [9,27] due to similar climate changes. However, these studies investigated annual grasslands with many exotic species [9] or grasslands that were overgrazed in the past [27]. In contrast, other studies [52,53] found no temporal diversity trends in natural grasslands. Comparing various grasslands with different managements, disturbance regimes, and land-use histories, Jonas et al. (2015) [10] found inconsistent results and concluded that weather effects on long-term diversity patterns vary with location and management.
Our study’s overall stability (fast and successful recovery of grasslands after diversity collapses) suggests that these natural grasslands were pre-adapted to the recent environmental variability. It implies that weather extremes induced by recent climate changes were probably within the range of variation these grasslands experienced during their evolutionary history. This conclusion is in line with Gotelli et al. (2017) [54], who found widespread evidence for the community-level regulation of temporal biodiversity patterns, and it supports the suggestions of Virágh et al. (2008) [34] and Kröel-Dulay et al. (2015) [55], who emphasized the increased vulnerability of degraded ecosystems to climate changes.

4.2. Scale Dependence of Diversity Responses

In contrast to our expectation (H3), the temporal patterns of species richness were consistent across spatial scales, i.e., temporal richness minima and maxima appeared in the same years when results were assessed at different scales. The species richness patterns were significantly synchronized across spatial scales. Still, we found a tendency for larger relative variability at finer scales. This has a practical consequence because, in this case, it was easier to determine the positions of temporal richness minima and maxima at a finer spatial resolution. We are not aware of a similar study that has tested the scale dependence of spatial synchrony within the same range of scales from 0.1 m to 40 m. Our methodological test within this domain of scale is important because sampling unit sizes in the available long-term grassland diversity datasets vary in a similar range between 0.1 m and 10 m [8,26]. The spatial scales of our transect data (lengths in m) cannot be directly translated to area data (to m2 data). However, methodological studies [22,23,56], proved that one- and two-dimensional spatial analyses led to the same qualitative conclusions, and results were comparable within the same domain of scales (from 0.1 m to 40 m in our study). Our study provides the first empirical evidence that long-term temporal patterns detected at different plot sizes can be compared in cross-site studies (or in meta-analyses), and the related conclusions are reliable.
The strong correlation (synchrony) between scales can be explained based on species-area relationships (SAR). A recent empirical study (assessing thousands of individual SAR estimates in various grasslands) proved that in continuous vegetation, the power law is the best model for SAR at fine grains (like the scales investigated in our study) [57]. The power law has the form S = cAz with two parameters c (species density at 1 m2) and z (the rate of species accumulation with the increasing area). In the ideal case, synchrony will reach maximum if the z parameter is constant over time and the inter-annual fluctuation of species richness is driven only by the variation of the c parameter. A central assumption of the power-law model is that the z parameter does not depend on scale. Recently, this assumption has been tested and supported empirically for “snapshot data” (i.e., for spatial data without temporal replicates) [58]. However, the temporal behavior of the z parameter has not been explored. In a macroecological survey, the z parameter was variable among sites, and a larger z parameter was found in grasslands exposed to high environmental stress or disturbances [59]. Consequently, we might expect an increase in the z parameter during extreme droughts. However, the strong synchrony over spatial scales suggests that the rate of species accumulation (z parameter) probably did not change significantly between 2007 and 2020 in our study.
Other studies reported stronger diversity responses to changing weather conditions at smaller spatial scales [9,14,16,20]. However, the scale dependence found in these studies could be a statistical artifact because they estimated the larger scale diversity (at the site or regional scale) by merging fine-scale data from a few distant small plots. These aggregated measures (averaged from smaller plot sizes) are less precise than our upscaled data, where the entire transect has been sampled by contiguous sampling units [21,60].

4.3. Synchrony between Weather Fluctuations and Diversity Changes

In accordance with our second hypothesis (H2), we found significant temporal associations between the extrema of weather events (minima and maxima of weather characteristics) and local minima and maxima of species richness. Our results showed that species richness minima appeared with dry years and species richness maxima in wet years. These patterns were consistent at all sites and agreed with previous studies [28,47,61]. We found strong spatial synchrony of each weather characteristic at a regional scale. This finding highlights that extreme weather events (especially droughts) are broad-scale phenomena influencing large areas in the Great Hungarian Plain of the Carpathian Basin [30]. This strong synchrony supports the reliability of our available meteorological data for interpreting vegetation patterns.
In contrast to the strong synchrony of meteorological data, the temporal richness patterns were not synchronous among our sites. We tested synchrony among sites using species-richness time series assessed at different scales (0.1 m, 2 m, 40 m). One dataset (at 2 m) showed marginal significance. For testing the validity of this relationship, we need longer time series data in the future. Few studies analyzed spatial synchrony of diversity patterns. We found only one recent study testing synchrony at a similar regional scale [20]. This study tested synchrony of species richness in rocky shore communities across scales and found low, non-significant correlations.
Another study analyzed the synchrony of diversity patterns at a finer spatial scale [26] and found significant spatial synchrony between plots within the same grassland. We also found evidence for significant micro-scale synchrony. By analyzing how synchronous the plot-scale diversity changes were, we found high synchrony in particular years but low synchrony in other years. Strong synchrony of plots with decreasing species richness appeared in years of severe droughts, while the opposite patterns (synchrony of plots with increasing species richness) were typical in the next year during recovery. Based on the result of this study, we suggest exploring the phenomenon of micro-scale synchrony of decreasing species richness as a potential indicator of environmental stresses. Multiple factors influence fine-scale species richness in plant communities [62]. Most of these factors are endogenous, act locally and induce spatially heterogeneous and asynchronous dynamics. Using transect data and analyzing the micro-scale spatial synchrony of diversity patterns in contiguous sampling units might help to disentangle the effects of exogenous (e.g., climatic) factors from other spatially more variably endogenous factors.

4.4. Climatic Drivers and Vegetation Responses

Contrary to our expectation (H2), there were no significant relationships between species richness and weather characteristics. The mean annual temperature, cumulative precipitation (of 4 months and 12 months) and aridity index were poor predictors of diversity. This is surprising because weather characteristics varied broadly between 2007 and 2020. For example, mean annual temperature varied between 10.3 °C and 14.0 °C, and the 12-month cumulative precipitation varied between 322 mm and 809 mm. Among the few long-term studies that searched for similar patterns, Adler and Levine (2007) [7] and Cleland et al. (2013) [8] also found no relationships in natural grasslands at a similar range of weather data (above ca. 350 mm mean annual precipitation). In contrast, positive correlations were found between species richness and annual precipitation in some xeric grasslands (short grass prairie and desert grasslands) in the U.S. [8], and a negative relationship was found between species richness and the mean April temperature in a dry steppe grassland in Germany [52]. These analyses were based on long time-series data (from 19 years to 35 years). Other studies [9,27] analyzed shorter time-series data (15 to 20 years), yet they found significant relationships. Therefore, we believe that the lack of relationships in our study cannot be explained by the slightly shorter (10–14 years) length of our time series.
There were three contrasting types of studies. In semiarid and mesic natural grasslands (e.g., mixed-grass and tallgrass prairie in the U.S. [8], sand steppe and loess meadow steppe in our study), diversity was stable over time and there were no linear relationships between species richness and precipitation. In the second type (e.g., degraded annual grasslands in California [9] and previously overgrazed grasslands in China [27]), species richness decreased over time and the weather characteristics were significant drivers of diversity. Very xeric natural grasslands (e.g., desert grasslands) with a large proportion of annuals belong to the third type, where diversity is stable over a longer time; still, actual species richness is driven by the actual precipitation [8].
Our study found a strong temporal association (coincidence) between extrema of precipitation and extrema of species richness. In contrast, we found no linear relationships between precipitation and species richness. To explain this apparent contradiction, we should consider the two types of relationships. In the case of a linear regression between species richness and precipitation, all species richness values should have been driven by the actual precipitation values. In contrast, the coincidence of diversity minima and drought events means that drought only became a limiting factor in particular years, and even in that year, several other factors might influence the actual species richness values. Most grasslands have multiple drivers of diversity [62] that explain the lack of simple relationships with weather characteristics.

4.5. Implication for Future Monitoring

Our study used time series of species-richness data assessed in permanent transects of small contiguous sampling units. Due to high spatial resolution, this sampling design provides high-quality vegetation data [23,63]. Long transects offer large sample sizes and ensure representative data about within-stand variability of species composition [3,34]. Species richness is sensitive to the hidden influence of species abundance distribution, spatial aggregation and association of species [21]. However, using transect data, there are several opportunities for testing and adjusting these methodological problems. Transect sampling with the contiguous spatial arrangement of sampling units offers opportunities for spatial pattern analyses to quantify these hidden factors. Additionally, with our use of transects, exact species richness patterns can be calculated at various scales using all of the measured transect data [22,23]; other more common approaches rely on the estimation of species richness patterns (e.g., rarefaction, see [5]).
Our study demonstrated that fine-scale within-stand synchrony could also be assessed from transect data. Existing studies evaluating temporal patterns of biodiversity [5] are constrained by the available long-term permanent plot data type. Sampling designs were initially developed to address the specific aims in these studies, and they usually have small sample sizes and samples with a single plot size. However, diversity patterns detected at a single plot size give biased results if characteristic scales of vegetation patterns change over time [23,42].
During long-term vegetation dynamics, when species composition, plant traits and spatial patterns might change considerably, monitoring should be adjustable to the related changes. Lindenmayer and Likens (2009) [64] suggested “adaptive monitoring” for this type of flexible monitoring scheme. Our high-resolution transect sampling design has fixed parameters. However, because transect data can be re-sampled by computerized sampling [22], transect data offer a vast opportunity for adaptive rescaling according to the changing vegetation patterns [34,65].

4.6. Limitations and Needs for Future Research

Our study was constrained by the limited availability of long-term monitoring data (both vegetation data and meteorological data). We had only three sites and a limited length of observations. Our sites represent well-preserved grasslands in protected National Parks. However, it would be important to extend the scope of monitoring and establish similar regular observations in various seminatural and man-made habitats for assessing the adaptive capacity and threshold of resilience in these ecosystems.

5. Conclusions

We analyzed long-term diversity patterns in natural grasslands undergoing recent climate change. The weather showed considerable inter-annual variation with droughts every 3–5 years. Diversity in semi-arid grasslands was associated with weather fluctuations with minimum diversity in dry years. Plant functional groups showed specific responses. Perennial species richness was more resistant (i.e., it changed to a small extent due to weather), while annual species richness collapsed during drought but recovered fast, already one year after drought (resilience response). Overall, all native grasslands did not show any directional trend during the study period.
We used transects of high spatial resolution for vegetation monitoring that allowed multiple-scale diversity analyses and allowed studying micro-scale synchrony. We found strong synchrony of diversity patterns over scales. This novel result has important implications for the cross-site evaluation of long-term monitoring data and supports comparing data collected with different plot sizes within the range of 0.1 m and 10 m scales. However, we also found that monitoring at smaller grain sizes was slightly more sensitive for detecting temporal diversity patterns.
Analyzing the micro-scale synchrony of diversity patterns is a new approach with perspectives for linking diversity, productivity and stability in empirical studies. We found evidence that the synchrony of fine-scale diversity is very dynamic, and the degree of micro-scale synchrony can be used as an indicator in climate change research. Understanding diversity responses to the changing climate remains a central topic in ecology. Based on the results presented here, we recommend implementing high-resolution transect sampling in monitoring networks in the future.

Supplementary Materials

The following supporting information can be downloaded at: https://www.mdpi.com/article/10.3390/land11030378/s1. Supplementary S1. Long-term trends of weather characteristics in the Great Hungarian Plain based on 120 years of meteorological data; Supplementary S2. Estimating species richness from transect data at different scales; Supplementary S3. Definition and calculation of the Pálfai aridity index; Supplementary S4. Calculation and testing the synchrony index; Supplementary S5. Calculation of temporal associations between peaks (extrema) of weather events and species richness; Supplementary S6. Temporal trends of weather characteristics and species richness; Supplementary S7. Relationships species richness and weather characteristics.

Author Contributions

Conceptualization, Z.Z., G.C., R.C., G.K.-D., S.B.; methodology, S.B., R.C., G.C. and S.C. (Sándor Csete); software, S.B., J.L.T.; formal analysis, Z.Z., S.B.; investigation, S.B., Z.Z., G.S., S.C. (Sándor Csete), J.H., D.P., R.C., G.C., S.C. (Stefano Chelli), J.L.T., A.I.C.; data curation, G.Ó., G.S., A.I.C., Z.Z., S.C. (Sándor Csete), J.H., D.P.; writing—original draft preparation, S.B., Z.Z.; writing—review and editing: all authors; visualization, S.B., Z.Z. All authors have read and agreed to the published version of the manuscript.

Funding

This study was supported by the NKFI K 72561, K 105608, K 129068 project and the GINOP-2.3.2-15-2016-00019 project. J.L.T., G.C. and R.C. were supported by the LIFE MODERn (NEC) project (LIFE20 GIE/IT/000091).

Institutional Review Board Statement

Not applicable.

Informed Consent Statement

Not applicable.

Data Availability Statement

The metadata of the dataset that supports the findings of this study are available on DEIMS (https://deims.org/dataset/3cd76d66-cadc-4d10-9fa7-75fe8d60663c, accessed on 25 January 2022) and the dataset on the website of KISKUN LTER site, with the permission of the data owner (https://www.kiskun.lter.hu/node/1058, accessed on 25 January 2022). The climate data are publicly available in the database of the Hungarian Meteorological Service (https://odp.met.hu/climate/station_data_series/daily/from_1901/, accessed on 25 January 2022).

Acknowledgments

This study is part of the KISKUN Long-Term Ecological Research Programme. We thank Klára Virágh, Szilárd Szentes, Zsuzsanna Sutyinszki, Cecília Komoly, Róbert Kun, Tsvetelina Terziyska, Csaba Molnár and András János Csathó for assistance during the field work. We acknowledge the general support of the Körös–Maros National Park Directorate, Kiskunság National Park Directorate and Duna–Ipoly National Park Directorate.

Conflicts of Interest

The authors declare no conflict of interest.

References

  1. Blair, J.; Nippert, J.; Briggs, J. Grassland Ecology. In Ecology and the Environment; The Plant Sciences 8, Chapter 14; Monson, R.K., Ed.; Springer: New York, NY, USA, 2014; pp. 389–423. [Google Scholar] [CrossRef]
  2. Chesson, P.; Gebauer, R.L.E.; Schwinning, S.; Huntly, N.; Wiegand, K.; Ernest, M.S.K.; Sher, A.; Novoplansky, A.; Weltzin, J.F. Resource pulses, species interactions, and diversity maintenance in arid and semi-arid environments. Oecologia 2004, 141, 236–253. [Google Scholar] [CrossRef] [PubMed]
  3. Collins, S.L.; Chung, Y.A.; Baur, L.E.; Hallmark, A.; Ohlert, T.J.; Rudgers, J.A. Press–pulse interactions and long-term community dynamics in a Chihuahuan Desert grassland. J. Veg. Sci. 2020, 31, 722–732. [Google Scholar] [CrossRef]
  4. IPCC. Climate Change 2013: The Physical Science Basis. Contribution of Working Group I to the Fifth Assessment Report of the Intergovernmental Panel on Climate Change 2013; Stocker, T.F., Qin, D., Plattner, G.K., Tignor, M., Allen, S.K., Boschung, J., Nauels, A., Xia, Y., Bex, V., Midgley, P.M., Eds.; Cambridge University Press: Cambridge, UK; New York, NY, USA, 2013; p. 1535. Available online: https://www.ipcc.ch/site/assets/uploads/2018/02/WG1AR5_all_final.pdf (accessed on 16 December 2021).
  5. Magurran, A.E.; Baillie, S.R.; Buckland, S.T.; Dick, J.M.P.; Elston, D.A.; Scott, E.M.; Smith, R.I.; Somerfield, P.J.; Watt, A.D. Long-term datasets in biodiversity research and monitoring: Assessing change in ecological communities through time. Trends Ecol. Evol. 2010, 25, 574–582. [Google Scholar] [CrossRef] [PubMed]
  6. De Bello, F.; Valencia, E.; Ward, D.; Hallett, L. Why we still need permanent plots for vegetation science. J. Veg. Sci. 2020, 31, 679–685. [Google Scholar] [CrossRef]
  7. Adler, P.B.; Levine, J.M. Contrasting relationships between precipitation and species richness in space and time. Oikos 2007, 116, 221–232. [Google Scholar] [CrossRef]
  8. Cleland, E.E.; Collins, S.L.; Dickson, T.L.; Farrer, E.C.; Gross, K.L.; Gherardi, L.A.; Hallett, L.M.; Hobbs, R.J.; Hsu, J.S.; Turnbull, L.; et al. Sensitivity of grassland plant community composition to spatial vs. temporal variation in precipitation. Ecology 2013, 94, 1687–1696. [Google Scholar] [CrossRef] [Green Version]
  9. Harrison, S.P.; Gornish, E.S.; Copeland, S. Climate-driven diversity loss in a grassland community. Proc. Natl. Acad. Sci. USA 2015, 112, 8672–8677. [Google Scholar] [CrossRef] [Green Version]
  10. Jonas, J.L.; Buhl, D.A.; Symstad, A.J. Impacts of weather on long-term patterns of plant richness and diversity vary with location and management. Ecology 2015, 96, 2417–2432. [Google Scholar] [CrossRef]
  11. Wilcox, K.R.; Shi, Z.; Gherardi, L.A.; Lemoine, N.P.; Koerner, S.E.; Hoover, D.L.; Bork, E.; Byrne, K.M.; Cahill, J., Jr.; Collins, S.L.; et al. Asymmetric responses of primary productivity to precipitation extremes: A synthesis of grassland precipitation manipulation experiments. Glob. Chang. Biol. Bioenergy 2017, 23, 4376–4385. [Google Scholar] [CrossRef]
  12. Gao, J.; Zhang, L.; Tang, Z.; Wu, S. A synthesis of ecosystem aboveground productivity and its process variables under simulated drought stress. J. Ecol. 2019, 107, 2519–2531. [Google Scholar] [CrossRef]
  13. Zhang, F.; Quan, Q.; Ma, F.; Tian, D.; Hoover, D.L.; Zhou, Q.; Niu, S. When does extreme drought elicit extreme ecological responses? J. Ecol. 2019, 107, 2553–2563. [Google Scholar] [CrossRef]
  14. Gruner, D.S.; Bracken, M.E.S.; Berger, S.A.; Eriksson, B.K.; Gamfeldt, L.; Matthiessen, B.; Moorthi, S.; Sommer, U.; Hillebrand, H. Effects of experimental warming on biodiversity depend on ecosystem type and local species composition. Oikos 2017, 126, 8–17. [Google Scholar] [CrossRef] [Green Version]
  15. Piseddu, F.; Bellocchi, G.; Picon-Cochard, C. Mowing and warming effects on grassland species richness and harvested biomass: Meta-analyses. Agron. Sustain. Dev. 2021, 41, 74. [Google Scholar] [CrossRef]
  16. Korell, L.; Auge, H.; Chase, J.M.; Harpole, W.S.; Knight, T.M. Responses of plant diversity to precipitation change are strongest at local spatial scales and in drylands. Nat. Commun. 2021, 12, 2489. [Google Scholar] [CrossRef]
  17. Morris, W.F.; Pfister, C.A.; Tuljapurkar, S.; Haridas, C.V.; Boggs, C.L.; Boyce, M.S.; Bruna, E.M.; Church, D.R.; Coulson, T.; Doak, D.F.; et al. Longevity can buffer plant and animal populations against changing climatic variability. Ecology 2008, 89, 19–25. [Google Scholar] [CrossRef] [Green Version]
  18. De Boeck, H.J.; Vicca, S.; Roy, J.; Nijs, I.; Milcu, A.; Kreyling, J.; Jentsch, A.; Chabbi, A.; Campioli, M.; Callaghan, T.; et al. Global change experiments: Challenges and opportunities. BioScience 2015, 65, 922–931. [Google Scholar] [CrossRef] [Green Version]
  19. Leuzinger, S.; Luo, Y.; Beier, C.; Dieleman, W.; Vicca, S.; Körner, C. Do global change experiments overestimate impacts on terrestrial ecosystems? Trends Ecol. Evol. 2011, 26, 236–241. [Google Scholar] [CrossRef]
  20. Arribas, L.P.; Gutiérrez, J.L.; Bagur, M.; Soria, S.A.; Penchaszadeh, P.E.; Palomo, M.G. Variation in aggregate descriptors of rocky shore communities: A test of synchrony across spatial scales. Mar. Biol. 2019, 166, 44. [Google Scholar] [CrossRef]
  21. Chase, J.M.; Knight, T.M. Scale-dependent effect sizes of ecological drivers on biodiversity: Why standardised sampling is not enough. Ecol. Lett. 2013, 16, 17–26. [Google Scholar] [CrossRef]
  22. Podani, J. Analysis of mapped and simulated vegetation patterns by means of computerized sampling techniques. Acta Bot. Hung. 1984, 30, 403–425. [Google Scholar]
  23. Bartha, S.; Campatella, G.; Canullo, R.; Bódis, J.; Mucina, L. On the importance of fine-scale spatial complexity in vegetation restoration. Int. J. Ecol. Environ. Sci. 2004, 30, 101–116. Available online: https://ecolres.hu/sites/default/files/IJEES2004.pdf (accessed on 16 December 2021).
  24. Buonaccorsi, J.P.; Elkinton, J.S.; Evans, S.R.; Liebhold, A.M. Measuring and testing for spatial synchrony. Ecology 2001, 82, 1668–1679. [Google Scholar] [CrossRef]
  25. Liebhold, A.; Koenig, W.D.; Bjornstad, O.N. Spatial synchrony in population dynamics. Annu. Rev. Ecol. Evol. Syst. 2004, 35, 467–490. [Google Scholar] [CrossRef] [Green Version]
  26. Walter, J.A.; Shoemaker, L.G.; Lany, N.K.; Castorani, M.C.N.; Fey, S.B.; Dudney, J.C.; Gherardi, L.; Portales-Reyes, C.; Rypel, A.L.; Cottingham, K.L.; et al. The spatial synchrony of species richness and its relationship to ecosystem stability. Ecology 2021, 102, e03486. [Google Scholar] [CrossRef]
  27. Li, Z.; Ma, W.; Liang, C.; Liu, Z.; Wang, W.; Wang, L. Long-term vegetation dynamics driven by climatic variations in the Inner Mongolia grassland: Findings from 30-year monitoring. Landsc. Ecol. 2015, 30, 1701–1711. [Google Scholar] [CrossRef]
  28. Aronson, J.; Shmida, A. Plant species diversity along a Mediterranean-desert gradient and its correlation with interannual rainfall fluctuations. J. Arid Environ. 1992, 23, 235–247. [Google Scholar] [CrossRef]
  29. Chelli, S.; Simonetti, E.; Campetella, G.; Chiarucci, A.; Cervellini, M.; Tardella, F.M.; Tomasella, M.; Canullo, R. Plant diversity changes in a nature reserve: A probabilistic sampling method for quantitative assessments. Nat. Conserv. 2019, 34, 145–161. [Google Scholar] [CrossRef] [Green Version]
  30. Mezősi, G.; Bata, T.; Meyer, B.C.; Blanka, V.; Ladányi, Z. Climate change impacts on environmental hazards on the Great Hungarian Plain, Carpathian Basin. Int. J. Disaster Risk Sci. 2014, 5, 136–146. [Google Scholar] [CrossRef] [Green Version]
  31. Molnár, Z.; Biró, M.; Bartha, S.; Fekete, G. Past trends, present state and future prospects of Hungarian forest-steppes. In Eurasian Steppes. Ecological Problems and Livelihoods in a Changing World; Werger, M., Ed.; Springer: Dordrecht, The Netherlands, 2012; Chapter 7; pp. 209–252. [Google Scholar]
  32. Csathó, A.J.; Csathó, A.I. The flora list of the Külső-gulya meadow of Battonya-Tompapuszta (SE Hungary). Crisicum 2009, 5, 51–70. Available online: https://docplayer.hu/20471202-A-battonya-tompapusztai-kulso-gulya-floralistaja.html (accessed on 16 December 2021).
  33. Kovács-Láng, E.; Kröel-Dulay, G.; Kertész, M.; Fekete, G.; Bartha, S.; Mika, J.; Dobi-Wantuch, I.; Rédei, T.; Rajkai, K.; Hahn, I. Changes in the composition of sand grasslands along a climatic gradient in Hungary and implications for climate change. Phytocoenologia 2000, 30, 385–407. [Google Scholar] [CrossRef]
  34. Virágh, K.; Horváth, A.; Bartha, S.; Somodi, I. A multiscale methodological approach for monitoring the effectiveness of grassland management. Community Ecol. 2008, 9, 237–246. [Google Scholar] [CrossRef]
  35. Pálfai, I. Description and forecasting of droughts in Hungary. In Proceedings of the 14th Congress on Irrigation and Drainage (ICID), Rio de Janeiro, Brazil, 30 April–4 May 1990; Volume 1-C, pp. 151–158. [Google Scholar]
  36. Pálfai, I. Probability of drought occurence in Hungary. Q. J. Hung. Meteorol. Serv. 2002, 106, 265–275. [Google Scholar]
  37. Kozák, P.; Pálfai, I.; Herceg, Á. Palfai Drought Index (PaDI)—The extension of the adaptability of Pálfai Index (PAI) for South East Europe. In DMCSEE—Summary of the Project Results; Bihari, Z., Ed.; Hungarian Meterological Service: Budapest, Hungary, 2012. (In Hungarian) [Google Scholar]
  38. R Core Team. R: A language and Environment for Statistical Computing. R Foundation for Statistical Computing, Vienna, Austria. 2020. Available online: https://www.R-project.org/ (accessed on 12 December 2020).
  39. Pinheiro, J.C.; Bates, D.M. Mixed-Effects Models in S and S-PLUS; Springer: Berlin/Heidelberg, Germany, 2000; pp. 235–397. [Google Scholar]
  40. Pinheiro, J.; Bates, D.; DebRoy, S.; Sarkar, D. R Core Team_nlme: Linear and Nonlinear Mixed Effects Models. R Package Version 3. 2020, pp. 1–144. Available online: https://CRAN.R-project.org/package=nlme (accessed on 12 December 2020).
  41. Bartoń, K. MuMIn: Multi-Model Inference. R Package Version 1.43.17. 2020. Available online: https://CRAN.R-project.org/package=MuMIn (accessed on 13 December 2020).
  42. Juhász-Nagy, P.; Podani, J. Information theory methods for the study of spatial processes and succession. Vegetatio 1983, 51, 129–140. [Google Scholar] [CrossRef]
  43. Juhász-Nagy, P. Spatial dependence of plant populations. Part 2. A family of new models. Acta Bot. Acad. Sci. Hung. 1984, 30, 363–402. [Google Scholar]
  44. Tsakalos, J.L. An R Package to Analyze within-Community Spatial Organization Using Species Combinations. GitHub Repository. 2022. Available online: https://github.com/jamestsakalos/comspat (accessed on 16 December 2021).
  45. Tsakalos, J.L.; Chelli, S.; Campetella, G.; Canullo, R.; Simonetti, E.; Bartha, S. An R package to analyze within-community spatial organization using species combinations. Ecography 2022. Manuscript Resubmitted after Minor Revision. [Google Scholar]
  46. Holm, S. A simple sequentially rejective multiple test procedure. Scand. J. Stat. 1979, 6, 65–70. Available online: https://www.jstor.org/stable/4615733 (accessed on 16 December 2021).
  47. Tilman, D.; El Haddi, A. Drought and biodiversity in grasslands. Oecologia 1992, 89, 257–264. [Google Scholar] [CrossRef]
  48. Doležal, J.; Altman, J.; Jandová, V.; Chytrý, M.; Conti, L.; Méndez-Castro, F.E.; Klimešová, J.; Zelený, D.; Ottaviani, G. Climate warming and extended droughts drive establishment and growth dynamics in temperate grassland plants. Agric. For. Meteorol. 2022, 313, 108762. [Google Scholar] [CrossRef]
  49. Jentsch, A.; Kreyling, J.; Beierkuhnlein, C. A new generation of climate-change experiments: Events, not trends. Front. Ecol. Environ. 2007, 5, 365–374. [Google Scholar] [CrossRef]
  50. Smith, M.D. An ecological perspective on extreme climatic events: A synthetic definition and framework to guide future research. J. Ecol. 2011, 99, 656–663. [Google Scholar] [CrossRef]
  51. Jentsch, A.; Kreyling, J.; Elmer, M.; Gellesch, E.; Glaser, B.; Grant, K.; Hein, R.; Lara, M.; Mirzae, H.; Nadler, S.E.; et al. Climate extremes initiate ecosystem-regulating functions while maintaining productivity. J. Ecol. 2011, 99, 689–702. [Google Scholar] [CrossRef]
  52. Matesanz, S.; Brooker, R.W.; Valladares, F.; Klotz, S. Temporal dynamics of marginal steppic vegetation over a 26-year period of substantial environmental change. J. Veg. Sci. 2009, 20, 299–310. [Google Scholar] [CrossRef]
  53. Jones, S.K.; Ripplinger, J.; Collins, S.L. Species reordering, not changes in richness, drives long-term dynamics in grassland communities. Ecol. Lett. 2017, 20, 1556–1565. [Google Scholar] [CrossRef] [PubMed]
  54. Gotelli, N.J.; Shimadzu, H.; Dornelas, M.; McGill, B.; Moyes, F.; Magurran, A.E. Community-level regulation of temporal trends in biodiversity. Sci. Adv. 2017, 3, e1700315. [Google Scholar] [CrossRef] [Green Version]
  55. Kröel-Dulay, G.; Ransijn, J.; Schmidt, I.K.; Beier, C.; De Angelis, P.; De Dato, G.; Dukes, J.S.; Emmett, B.; Estiarte, M.; Garadnai, J.; et al. Increased sensitivity to climate change in disturbed ecosystems. Nat. Commun. 2015, 6, 6682. [Google Scholar] [CrossRef] [Green Version]
  56. Bartha, S.; Horváth, F. Application of long transects and information theoretical functions to pattern detection. I. Transects versus isodiametric sampling units. Abstr. Bot. 1987, 11, 9–26. Available online: https://www.jstor.org/stable/43519147 (accessed on 16 December 2021).
  57. Dengler, J.; Matthews, T.J.; Steinbauer, M.J.; Wolfrum, S.; Boch, S.; Chiarucci, A.; Conradi, T.; Dembicz, I.; Marcenò, C.; García-Mijangos, I.; et al. Species–area relationships in continuous vegetation: Evidence from Palaearctic grasslands. J. Biogeogr. 2020, 47, 72–86. [Google Scholar] [CrossRef] [Green Version]
  58. Zhang, J.; Gillet, F.; Bartha, S.; Alato, J.M.; Biurrun, I.; Dembicz, I.; Grytnes, J.-A.; Jaunatre, R.; Pielech, R.; Van Meerbeek, K.; et al. Scale dependence of species–area relationships is widespread but generally weak in Palaearctic grasslands. J. Veg. Sci. 2021, 32, e13044. [Google Scholar] [CrossRef]
  59. Dembicz, I.; Dengler, J.; Steinbauer, M.J.; Matthews, T.J.; Bartha, S.; Burrascano, S.; Chiarucci, A.; Filibeck, G.; Gillet, F.; Janišová, M.; et al. Fine-grain beta diversity of Palaearctic grassland vegetation. J. Veg. Sci. 2021, 32, e13045. [Google Scholar] [CrossRef]
  60. Güler, B.; Jentsch, A.; Apostolova, I.; Bartha, S.; Bloor, J.M.; Campetella, G.; Canullo, R.; Házi, J.; Kreyling, J.; Pottier, J.; et al. How plot shape and dispersion affect plant species richness counts: Implications for sampling design and rarefaction analyses. J. Veg. Sci. 2016, 27, 692–703. [Google Scholar] [CrossRef] [Green Version]
  61. Bartha, S.; Meiners, S.J.; Pickett, S.T.A.; Cadenasso, M.L. Plant colonization windows in a mesic old field succession. Appl. Veg. Sci. 2003, 6, 205–212. [Google Scholar] [CrossRef]
  62. Chesson, P. Mechanisms of maintenance of species diversity. Annu. Rev. Ecol. Syst. 2000, 31, 343–366. [Google Scholar] [CrossRef] [Green Version]
  63. Koncz, P.; Vadász-Besnyői, V.; Csathó, A.I.; Nagy, J.; Szerdahelyi, T.; Tóth, Z.; Pintér, K.; Fóti, S.; Papp, M.; Balogh, J.; et al. Carbon uptake changed but vegetation composition remained stable during transition from grazing to mowing grassland management. Agric. Ecosyst. Environ. 2020, 304, 107161. [Google Scholar] [CrossRef]
  64. Lindenmayer, D.B.; Likens, G.E. Adaptive monitoring: A new paradigm for long-term research and monitoring. Trends Ecol. Evol. 2009, 24, 482–486. [Google Scholar] [CrossRef] [PubMed]
  65. Chen, X.; Li, B.; Collins, S.L. Multiscale monitoring of a multispecies case study: Two grass species at Sevilleta. Plant Ecol. 2005, 179, 149–154. [Google Scholar] [CrossRef]
Figure 1. Location of the study sites at ca. 1:250 k spatial scale within Hungary (ac), within the landscape matrix at ca. 1:10 k viewed from Google Earth (df) and at local sites at ca. 1:5 scale (gi). Modeled long-term precipitation (b,c) mean annual temperature surfaces were sourced from https://www.met.hu/en/eghajlat/magyarorszag_eghajlata (accessed on 21 October 2021).
Land 11 00378 g001
Figure 2. Temporal patterns of weather characteristics at the three study sites. BT = Battonya site (loess meadow steppe), CSH = Csévharaszt site (sand steppe 1), FH = Fülöpháza site (sand steppe 2). (a) MAT = Mean annual temperature (°C); (b,c) PPT cumulative precipitation (mm) over 12 months and 4 months before the vegetation sampling date; (d) PaDI0 = Pálfai aridity index (°C/100 mm); (e,f) = Relative variability of cumulative precipitation expressed as a percentage deviation from the temporal mean values. Mean values were calculated separately for each site.
Land 11 00378 g002
Figure 3. Temporal patterns of species richness observed at 2 m scale. BT = Battonya site (loess meadow steppe), CSH = Csévharaszt site (sand steppe 1), FH = Fülöpháza site (sand steppe 2). (ac) Mean species richness; (df) Relative variability of species richness expressed as a percentage deviation from the temporal mean values. Mean values were calculated separately for each site.
Land 11 00378 g003
Figure 4. Temporal patterns of species richness observed at six spatial scales. Community-level patterns (all species) and species richness of functional types (annuals and perennials) are printed separately at each site.
Land 11 00378 g004
Figure 5. Spatial scaling of the temporal species richness patterns at continuously increasing scales.
Land 11 00378 g005
Figure 6. Scale-dependent relative temporal variance of species richness. (a) Temporal CV% (coefficient of variation) of species richness at the three study sites. BT = Battonya site (loess meadow steppe), CSH = Csévharaszt site (sand steppe 1), FH = Fülöpháza site (sand steppe 2) estimated at three different scales. (b) Scale dependence of percentage deviation from mean species richness over time. Example observed in sand steppe at Csévharaszt.
Land 11 00378 g006
Figure 7. Spatiotemporal patterns of fine-scale diversity change between subsequent years at 2 m scale. (a) Blue squares mark the plots where local species richness decreased from the previous years. (b) Red squares mark the plots where local species richness increased from the previous years.
Land 11 00378 g007
Table 1. Synchrony of weather characteristics among sites. Bold numbers indicate significant associations.
CharacteristicsObserved
Synchrony
Null Model
Synchrony
p-Value
Mean annual temperature0.7900.5090.000
Pálfai aridity index0.9300.5030.000
Precipitation 4 months0.8600.5050.000
Precipitation 12 months0.7890.5000.000
Table 2. Synchrony of species richness among sites. Corrected p-values were adjusted for multiple tests by the Bonferroni–Holm method. Bold numbers indicate marginally significant associations.
Spatial
Scale
CharacteristicsObserved
Synchrony
Null Model
Synchrony
p-ValueAdjusted
p-Value
0.1 mAll species0.6300.4980.1811.000
Annuals0.7040.4890.0490.441
Perennials0.6300.4890.1641.000
2 mAll species0.7780.4950.0120.108
Annuals0.7780.4860.0130.117
Perennials0.7040.4750.0460.419
40 mAll species0.4440.4090.4151.000
Annuals0.5190.3920.1601.000
Perennials0.2960.3590.7511.000
Table 3. Local synchrony of species richness time series recorded at different scales. Corrected p-values were adjusted for multiple tests by the Bonferroni–Holm method. Bold numbers indicate significant associations.
SitesCharacteristicsObserved
Synchrony
Null Model
Synchrony
p-ValueAdjusted
p-Value
BattonyaAll species0.8370.4970.0000.000
meadowAnnuals0.7780.4880.0000.000
steppePerennials0.6220.4540.0070.007
CsévharasztAll species0.8670.4890.0000.000
sandAnnuals0.9490.4760.0000.000
steppe1Perennials0.6210.4460.0040.008
FülöpházaAll species0.7900.4860.0000.000
sandAnnuals0.7740.4730.0000.000
steppe2Perennials0.7850.4540.0000.000
Table 4. Temporal associations between drought events and the local minima of species richness. Corrected p-values were adjusted for multiple tests by the Bonferroni–Holm method. Bold numbers indicate significant associations.
Species Richness
Type
Weather
Characteristic
Observed
Association
Null Model
Association
p-Valuep after
Correction
All speciesPrecipitation 4 months2.4671.5150.00000.0000
Precipitation 12 months2.0821.3080.00100.0040
Pálfai aridity index1.6801.2230.01900.0380
AnnualsPrecipitation 4 months2.6251.6290.00000.0000
Precipitation 12 months1.9441.3900.00700.0210
Pálfai aridity index2.1331.3190.00000.0000
PerennialsPrecipitation 4 months2.3481.2770.00000.0000
Precipitation 12 months1.9641.1090.00000.0000
Pálfai aridity index1.3931.0360.05510.0551
Publisher’s Note: MDPI stays neutral with regard to jurisdictional claims in published maps and institutional affiliations.

