Abstract
In the era of big data, advances in relevant technologies are profoundly impacting the field of real estate appraisal. Many scholars regard the integration of big data technology as an inevitable future trend in the real estate appraisal industry. In this paper, we summarize 124 studies investigating the use of big data technology to optimize real estate appraisal through the hedonic price model (HPM). We also list a variety of big data resources and key methods widely used in the real estate appraisal field. On this basis, the development of real estate appraisal moving forward is analyzed. The results obtained in the current studies are as follows: First, the big data resources currently applied to real estate appraisal include more than a dozen big data types from three data sources; the internet, remote sensing, and the Internet of things (IoT). Additionally, it was determined that web crawler technology represents the most important data acquisition method. Second, methods such as data pre-processing, spatial modeling, Geographic information system (GIS) spatial analysis, and the evolving machine learning methods with higher valuation accuracy were successfully introduced into the HPM due to the features of real estate big data. Finally, although the application of big data has greatly expanded the amount of available data and feature dimensions, this has caused a new problem: uneven data quality. Uneven data quality can reduce the accuracy of appraisal results, and, to date, insufficient attention has been paid to this issue. Future research should pay greater attention to the data integration of multi-source big data and absorb the applications developed in other disciplines. It is also important to combine various methods to form a new united evaluation model based on taking advantage of, and avoiding shortcomings to compensate for, the mechanism defects of a single model.
1. Introduction
Big data is defined as a large amount of data, and it requires new technology and architecture to extract value from it—this is done via the capture and analysis process [1]. Big data contains a large amount of organized, semi-structured, and unstructured useful information that can be mined [2]. It has become the focus of the times, as the proper management and use of big data can generate profound and comprehensive insights for enterprises, as well as increase decision-making ability [3,4]. Specifically, the collection, collation, and mining of big data can help draw conclusions that are more scientific and useful compared with the analysis of small data, which refers to purposive sampling data [5].
Therefore, big data provides huge potential and opportunities for most industries that require data analysis. Pei et al., (2020) stated that the essence of big data is full-coverage sampling, and “full” sampling is much larger than the purposive sampling of traditional small data, which can inevitably lead to a research-mode revolution [5]. The rapid growth of big data and its promising applications have led to the passionate pursuit of big data technology in various fields such as economic management, the internet, medicine, and geography [6,7,8,9]. Consequently, a series of standout achievements have also appeared. For example, Ginsberg et al., (2009) used search engine data to predict the influenza epidemic [8]; Fina et al., (2020) used mobile phone network data to monitor the travel patterns of different regions in Germany [10]; and He et al., (2020) used big geographic data to investigate the growth in outlying expansion development zones in 275 Chinese cities [11]. As a typical information-intensive industry, big data is increasingly playing a significant role in the real estate appraisal industry. Its value in this industry is demonstrated through the ways in which the decisions made via big data analysis are more scientific and efficient compared with more traditional empirical methods. Additionally, big data technology can assist with the real-time dynamic monitoring of appraised property value toward achieving an effect similar to that on the stock market. This means bankers’ and corporate investors’ requirements for current real estate appraisal value can be met.
The drastic changes arising around big data (i.e., its comprehensive application and ensuing impacts) have forced the entire real estate industry to find ways to create higher efficiency for appraisal and dynamic monitoring. Additionally, external threats and opportunities have forced enterprises to transition to big data. While enterprises are making new attempts to progress in this area, the world of academia is also increasingly paying attention to the vast number of achievements in the big data technology realm. This has encouraged researchers to learn by analogy from other disciplines and combine new technologies with traditional industries to help build information dominance. Therefore, combined with the existing research, we systematically reviewed the big data resources that can be used for real estate appraisal and appraisal method reform in the era of big data. In this context, many important achievements have been made. To the authors’ knowledge, however, the number of studies that systematically investigate the changes and progress made in the real estate appraisal field from the perspective of big data is limited. We therefore believe that providing greater insight in this area to build on the existing studies is vital. Accordingly, this paper focuses on big data, reviewing the emerging big data types relevant to real estate appraisal. Furthermore, since various types of emerging data inevitably generate new requirements for appraisal methods, the improvements that can be made in this area through the coupling of data characteristics with appraisal methods are summarized. Additionally, this paper presents the achievements that have been made to date in applying big data to the field of real estate appraisal. Finally, we outline the shortcomings in the current research and make recommendations for future research directions.
The HPM was first proposed by Court in 1939 [12]. Since being introduced by Rosen (1974) to the residential market, it has developed into one of the most widely used models in the real estate industry [13]. The theoretical foundation underpinning HPM predominantly comprises Lancaster’s preference theory and Rosen’s market supply and demand equilibrium model [14]. Lancaster (1966) argued that product demand is based on a product’s characteristics rather than on itself and that goods are sold as collections of intrinsic characteristics [15]. Rosen (1974) established the market supply and demand equilibrium model based on hedonic theory, a theory that helps to value the characteristics of differentiated products [16]. The HPM focuses on the impact of property characteristics on its price, including location, housing structure, and neighborhood factors. Using this understanding, the regression relationship between price and asset-related attributes can successfully be established. Economic theory, however, does not reveal how the functional form of such price regression should be chosen [17]. Consequently, researchers have attempted to use various functional forms to explore optimal solutions.
Mass appraisal is the valuation of a group of properties using common data, standardized methods and statistical testing [18]. As property transaction and mortgage frequency increase, so too are the costs associated with appraisals. The traditional single valuation is not only inefficient but also subjective. Specifically, it depends on the professional ability and experience of the appraiser. The mass appraisal model is a widely accepted tool in the real estate industry for property valuation for taxation- or mortgage-related purposes [19]. The traditional model is the HPM, which is based on the ordinary least squares (OLS) linear regression [19]. With advancements in computer technology and the increasing application of such advancements in the real estate industry, scholars are no longer satisfied with linear hedonic pricing models with low stability and accuracy [19,20,21,22]. Fuzzy logic in real estate valuation was originally applied by Bagnoli and Smith (1998) [23]. According to Peterson and Flanagan (2009), the nonlinear modeling method (which can be represented by an artificial neural network) is superior to the linear appraisal method [22]. Additionally, with rapid developments in related research, some researchers have begun to compare various advanced models toward determining the conditions for their optimal application [20].
In this paper, the methodology, including the methods for the literature search and screening rules, is described first (Section 2). In Section 3, the main method used to obtain big data is outlined, and the sources and types of big data applied to real estate appraisal are classified in detail. Next, the different real estate appraisal approaches used to meet the new requirements of data analysis in the era of big data are analyzed in Section 4. The big data analysis achievements made by enterprises are presented in Section 5. In Section 6, we share our views on some technical issues we believe are worthy of attention. Finally, in Section 7, we summarize the main contributions and implications of this study.
2. Methodology
In the beginning, we searched the keywords “housing prices”, “real estate prices”, “real estate appraisal”, and “big data” across all databases in the Web of Science. A total of 311 records were searched. In the Web of Science database, we used the following keyword combination:
- “(((TS = (housing prices)) OR TS = (real estate prices)) OR TS = (real estate appraisal)) AND TS = (big data)”
We found that 101 of the 311 search records in Web of science were from China, accounting for 32.48 of the total records searched, far ahead of the 43 records in the United States, which ranked second. Therefore, we concluded that China’s research in this field is relatively rich and diverse. Further considering that China’s internet companies and big data technologies are continuing to experience rapid development [24], the Chinese national knowledge infrastructure (CNKI) resources database, the largest Chinese full-text database with more than 9000 journals [24], was selected as an additional source. We reviewed international and Chinese peer-reviewed literature as well as Chinese Masters and Philosophiae doctor (Ph.D.) theses on big data resources and key methods used in real estate appraisal. All Chinese publications had English titles and abstracts.
The studies outlined above helped us gain a structural understanding of real estate appraisal related to big data. We then conducted a more targeted literature search based on the research directions highlighted in the records. Since most types of big data used in real estate appraisal fall under big geographical data, the accessibility calculation based on big geographical data is the most important way to apply them to real estate appraisal. At the same time, remote sensing data and environmental monitoring data have also attracted us. These types of data can improve real estate appraisal from the perspective of environmental conditions, which has been lacking in traditional appraisal work in the past. Additionally, image data, as a new type of big data, has been applied to experimental research and has been published recently due to the development of computer vision technology. Therefore, we believed it was necessary to add “big geographic data”, “remote sensing”, “environmental monitoring data”, and “image data” as topic words to the literature search, strengthening the comprehensiveness and originality of our research. In subsequent research, we conducted targeted searches and supplemented the supporting literature to reinforce some arguments. Keywords such as “real estate”, “GIS”, “internet search”, “spatial econometric”, “neural network”, ”mass real estate appraisal”, and ”Zillow” were added for the topic search. Accordingly, we used the following keyword combination:
- “((((TS = (geographic big data)) OR TS = (remote sensing)) OR TS = (environmental monitoring data)) OR TS = (image data)) AND TS = (housing prices)”
- “TS = (mass real estate appraisal)”
- “TS = (housing prices GIS)”
- “TS = (housing prices Internet search)”
- “TS = (housing prices spatial econometric)”
- “TS = (housing prices neural network)”
- “TS = (zillow)”
Since the Chinese database only played a supplementary role in our research, we used several keywords restricted to the topic: ”internet”, “big data”, “housing prices”, ”web search”, ”web keywords search”, “cloud computing”, “batch valuation system”, “neural network”, “data mining”, “support vector machine (SVM),“ ”least absolute shrinkage and selection operator (Lasso)” and “real estate appraisal”.
In the Web of Science and CNKI databases, we found 1603 and 237 records, respectively. First, since big data technology has not undergone rapid development until recently, and the records in the 15 years from 2006 to 2021 exceed 90% of all records, we excluded records from other years (before 2006). Second, according to document type, articles, meetings, theses, and reviews were retained, and other types of records (e.g., patents) were excluded. Third, papers written in English and Chinese were retained, and other languages were excluded. Fourth, duplicate records were removed. A total of 1335 studies were identified. Next, irrelevant papers were excluded, and 551 studies were identified. In the early stages of the research, we established the framework to be presented in the paper based on the earliest 311 papers and several studies on big data in similar fields [5,25]. The later papers were searched to support this framework. Therefore, some papers that did not meet the framework and were not sufficiently important were not cited. All the Chinese papers, except those that played an important supplementary role in the current study, were removed. Finally, 69 of the 541 identified records were cited. We also tracked 91 cited papers in the records that were sought for retrieval, and another seven websites were used for query reports or to browse internet real estate appraisal platforms. A report and 55 papers were additionally cited after a similar screening process. Finally, 125 records in the real estate appraisal field were cited (Figure 1).
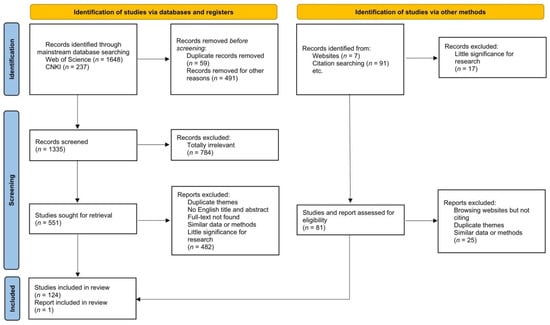
Figure 1.
Preferred reporting items for systematic reviews and meta-analyses (PRISMA) flow diagram.
3. Big Data Resources for Real Estate Appraisal
The advent of the internet information era has generated massive data resources, which, inevitably, have had a profound impact on the real estate appraisal industry. For example, intelligent information databases have replaced tedious manual survey operations, and mass appraisal systems have replaced traditional manual appraisal to some extent [26,27]. However, the biggest impact of the information age is that big data technology has greatly expanded the amount and dimension of data available for real estate appraisal. Previous research data on urban housing or rental prices predominantly came from statistical data and manual surveys provided by officials or real estate agencies. For example, Rondinelli and Veronese (2011) used census and detailed rental data provided by real estate developers to estimate the change of rental prices [28], Feng et al., (2011) obtained the original data of commercial residential buildings in Beijing through survey [29], and Roy (2017) studied the housing demand of six major cities in India through the use of household-level data from the National Sample Survey Organization Housing Survey in India [30]. However, the data collection in traditional statistical methods is performed via a single source, which predominantly comprises transaction information recorded by real estate intermediary companies or official records and leads to the problems of small data samples and limited researchable features [26,31]. The manual survey method also has some limitations, such as high cost and inapplicability to large-scale research [32,33,34].
Most of the real estate big data resources used today are provided via the internet, and many housing transaction platforms have reshaped the way people exchange information in housing economics [35]. Most researchers’ real estate data sources have been transformed into well-known real estate information websites, such as China’s Lianjia.com (accessed on 11 February 2022) [36], Craigslist in the United States [37], and Idealista in Spain [38]. In addition, big geographic data resources are an important data source for housing price research in the era of big data. Most of these are spontaneously provided by internet users, including non-structural information such as addresses, community names, geo-tagged photos, and geo-text comments. This information has been difficult to obtain in previous housing surveys.
3.1. Acquisition of Real Estate Big Data
In the era of big data, the value of data is self-evident, but internet users’ big data is generally owned by internet giants, resulting in poor data sharing and few public access channels. At present, the public’s convenient and free access to big data predominantly stems from internet search engines. However, for tens of billions of web pages, it is unfeasible to collect information manually. The birth of web crawler technology, however, has made it easy to obtain big data from the internet [39]. Generally speaking, a crawler is a technology that simulates the browser to surf the internet and collect data via writing programs [40]. This is efficient and inexpensive because it automatically (versus manually) collects internet data and only consists of computer codes. Therefore, crawler technology solves the data source problem. For the field of real estate appraisal, web crawler technology, which can help researchers quickly obtain tens of thousands of real estate transaction cases and information on surrounding environmental facilities within the geographical scope of a city, has become the most important data acquisition method.
3.2. Data Sources and Types of Real Estate Big Data
Based on the findings of the abovementioned studies, this paper is divided into sections detailing the big data resources that are widely used in the field of real estate appraisal and further into more than ten data types. It then organizes these data types into three data sources—the internet, remote sensing, and the IoT—according to their acquisition methods and sources.
3.2.1. Internet Big Data
The development of the internet has generated huge data resources. People can get almost anything they want on the internet, and therefore, the internet has become the most important source of big data information [24,40]. From the perspective of real estate appraisal, the most widely used internet big data types include intermediary platform data, internet map data, internet search behavior data, image data, and text information data. The following are detailed descriptions of these big data types.
- (1)
- Intermediary platform data: This refers to data related to real estate transactions or leases provided by various internet intermediary platforms. In the current research, bulk transaction information, including data on transactions, house prices, real estate location, and building features (all of which represent the main source of real estate big data), was predominantly obtained via automatic web crawlers [26,41,42,43]. Specifically, the transaction data provided by the intermediary platform includes the transaction time and quantity of real estate, which reflects the transaction trend of the market and whether the real estate price needs to be adjusted according to the transaction time. Price data refers mainly to the listing price of the real estate or lease. Since the actual transaction price is confidential and difficult to obtain, it is usually replaced by the listing price. Location data generally refers to the latitude and longitude coordinates of the property location after coordinate conversion and the attribute information of the area. For example, “WoAiWoJia” provides location attributes, including the comprehensive distance between the piece of real estate and city center, whether it is within 2 km of key primary schools and key hospitals, and 1 km from subway stations [44]. Such data provides location information and is also the basis of the spatial visualization of real estate-related information (e.g., information on housing structure, location, neighborhood, and price). Building feature data give information about the features of a house such as building area, construction ratio, room orientation, room layout, house age, and decoration style (among others), as well as community-level features such as community developers, properties, floor-area ratio, and greening rate. The aforementioned data contain many important feature parameters, and, therefore, it is possible to evaluate real estate in batches via big data information on internet intermediary platforms. Accurate information can be achieved based on choosing a proper appraisal method, where the efficiency of real estate appraisal is then greatly improved.
- (2)
- Internet map data: Internet mapping platforms provide two important data types in real estate appraisal. First, the mainstream internet map platforms can provide point of interest (POI) data with (near) real-time availability for real estate appraisal. The POI includes latitude and longitude coordinates, names, and addresses, all of which can provide time-sensitive neighborhood and location information for real estate appraisal. Based on POI data, users can accurately quantify the neighborhood and location characteristics of the property to be estimated based on the property location data provided by the internet intermediary platform. For example, Liu (2019) collected the number of infrastructure POI points within a certain radius around a house and the distance from the nearest infrastructure POI point to the house to be appraised through the Baidu map application programming interface (API). This was done before quantifying the so-called “school district house” and “business district house” [45] and greatly improves the efficiency of real estate appraisal. Second, with the city transportation vector map well-established now, the data can provide a more accurate level of travel cost for real estate appraisal, which is more consistent with the actual situation than the traditional residential accessibility based on Euclidean distance. To a large extent, travel cost is a realistic reflection of location and plays a very important role in home buyer consideration. For example, Xue et al., (2020a) used spatial syntax theory to calculate the accessibility of public transportation based on the road transportation network data provided by AutoNavi, a web-mapping platform and location-based service provider in China [46], which greatly improved the accuracy of the housing price prediction [47]. Therefore, a more accurate measurement of travel costs will almost certainly generate more accurate appraisal results.
- (3)
- Internet search behavior data: As consumers will collect relevant information before purchasing commodities such as real estate, for example, the proportion of home buyers using the internet to search for houses in the United States reached an all-time high of 97% in 2020 [48]. Therefore, internet users’ search behavior has become a hot topic in commercial big data research [49,50]. Generally speaking, scholars believe that data on internet search behavior data reflects searchers’ consumption intention and the demand changes of the real estate market in advance [51,52]. The existing research also confirms that whether in mature markets with high transparency, such as in the United States, or emerging markets with high information asymmetry such as in India and China, the changes to online keyword search volume reflect the fluctuation of housing prices several months in advance [52,53,54]. The specific application directions of such data can help predict changes in the real estate market rather than individual properties [52,53,55]. The existing real estate price index lacks timeliness and has a long-release cycle. What internet search behavior data can do for real estate appraisal is predict the residential sales price index to make up for its timeliness [56]. Finally, a more time-sensitive index can be used to replace the real estate price index to adjust real estate transaction times with a long interval [57]. Although internet search behavior data are superior in predicting changes in real estate prices, these data are relatively infrequently applied to real estate appraisal. One reason for this is that the data predominantly reflect future demand in a large geographical area and is not helpful in individual real estate valuation.
- (4)
- Image data: The visual experience of a house plays a vital role in its market value, but visual perception is a subjective experience that is difficult to quantify. Thanks to the significant progress made by computer vision technology in recent years, image data has begun to be used in real estate appraisal, and some important achievements have been made. According to the relevant information shown in the images, the data can be divided into residential and street-view image data. The former shows the exterior and interior images of the house to reflect the appearance, interior design, decoration process, and other information about the house. Researchers have used convolutional neural networks to quantify these features and integrate them into existing valuation models, finding that the addition of visual features can improve the accuracy of valuation through comparative research [58,59,60]. The latter reflects the environmental characteristics of the streets near the house rather than the house itself. Because the main function of remote sensing imagery is also to reflect the property’s surrounding environment, the role of street-view images is similar to that of remote sensing imagery, and the difference between the two essentially lies in a difference of scale. For example, Law et al., (2019) used street-view and satellite images to reflect neighborhood information at the street scale and aerial level, respectively [61]. Law et al.’s study helped quantify some intangible housing features, such as the visual impression of a neighborhood, which was difficult to measure in the past. It has also been shown that street-view images can be used as a beneficial complement to HPM [62].
- (5)
- Text information data: Kang et al., (2019) believe that housing prices are impacted by human psychological attitudes [63]. Text information data consists of words edited by people and contains rich sentimental information to be extracted. The type of data used by scholars include online housing advertisements and real estate news. First, online housing advertisements are generally released by real estate owners to sell or rent houses; therefore, they are used for individual properties. Such data is different from other data because it contains rich semantic and sentimental information. The information contained within roughly reflects a real estate owner’s view of the property, including not only their attitude towards selling the house but also their preferences for various features of the property. Specifically, some researchers have paid attention to the textual information that reflects the seller’s mentality, such as “sincere sale” and “at any time to see the house”, and have quantitatively analyzed the influence of the seller’s mentality on the housing price [31]. In the past, the impact of psychological factors on house prices could only be judged by experience, but this study offers many benefits. Other researchers have extracted landlords’ clear opinions and sentiments on the surrounding environment, and through rent analysis, have captured the importance of the environment to rent [64]. For the traditional HPM, this kind of data makes it possible to not only think about housing-related information but also the seller factor. Second, real estate news reflects the market’s attitude toward real estate, and its analysis can be used to predict short-term housing price trends. However, data mining technology is needed to extract information before analysis [63]. Moreover, it is difficult to judge the sentiment expressed in real estate news (e.g., whether in real estate news there is a positive, negative or vague attitude towards the real estate market or a real estate policy) [65]. Generally speaking, the two data types correspond with different research purposes, but both support investigations into housing prices related to individuals’ attitudes.
3.2.2. Remote Sensing Big Data
Remote sensing technology can provide multi-resolution, multi-spectrum, and multi-temporal image data. Remote sensing technology has become one of the few technologies that can help perceive the external environmental conditions of a house, because it provides a top-down aerial view of the property to be assessed and its surrounding community environment [66]. Specifically, it has three application directions, as follows:
- (1)
- Multispectral images: The surface environment information brought by multi-spectral images is much richer than true color images. This can help to more effectively evaluate the surrounding environmental conditions of the property, which is very important for real estate appraisal. The concrete application predominantly reflects the urban green space vegetation by calculating the normalized difference vegetation index (NDVI) and adopts it as an important index capturing information on environmental factors [32,67]. Additionally, some researchers use the normalized spectral mixture analysis (NSMA) method to calculate the vegetation-impermeable surface-soil fraction to measure environmental conditions [68]. Generally speaking, the application of multispectral remote sensing images is predominantly focused on calculating the environmental index. This undoubtedly offers more convincing neighbor-related attributes.
- (2)
- Night-time light: As real estate appraisal has strong social and economic attributes, cultivating a focus on the social and economic characteristics surrounding real estate is necessary. Furthermore, it has been found that night-time light (NTL) is highly spatially correlated with Gross domestic product (GDP) and population density [69,70]. Compared with the traditional total economic and social data provided by the government, NTL effectively displays the prosperity of cities and, therefore, it has also been used by some researchers to model housing prices with some promising results [34,71].
- (3)
- Laser radar: Unlike remote sensing images, which can only present the two-dimensional features of ground objects, laser radar can provide some new three-dimensional space-based parameters for the appraisal model. To date, relevant studies have included the use of airborne lidar to measure the floor area and volume of houses [72] and have also investigated the impact of sea-viewing angle on the value of beach houses via the use of the geomorphic information of coastal areas lidar provides [73]. Although lidar can provide some valuable feature information for real estate appraisal, it is currently difficult to apply it to large areas due to its costliness and low efficiency [73]
Generally speaking, the price of real estate is closely related to the neighborhood environment in which the house is located. The comparative study shows that the combination of remote sensing images and other geospatial data can significantly improve the accuracy of real estate appraisal [42]. Therefore, it is beneficial to introduce remote sensing images in this appraisal process.
The direct use of remote sensing big data is difficult in the valuation model, as it requires a cumbersome feature-information extraction process [32,67,68,69,71]. Many researchers are no longer satisfied with the simple and extensive application method of extracting NDVI. They are tending to mine more detailed information on the environment from remote sensing images—for example, using satellite images to extract information on the property’s relationship to the neighborhood and its surrounding features (e.g., expensive houses may have larger yards, green spaces, ponds, and swimming pools nearby, whereas the space around cheaper houses may be more compact and contain more roads and concrete) [66,74]. In the hope of extracting more information, methods such as the convolutional neural network model—previously used in the field of computer vision—is being used by scholars to extract large-scale information regarding the natural environment that is contained in aerial photography or high-resolution satellite images, indicating that more computer technology will be applied in further developments. Others are focusing on how to better integrate remote sensing data into other types of big data so that the big data containing different property information are better placed to complement each other, including the fusion of remote sensing images with other raster images that reflect the geographical information of economic and social conditions [42]. The combination of satellite images and street-view images reflects how visually attractive a given residential area is [61]. This, however, poses a difficulty in current research, which is discussed later.
3.2.3. IoT Big Data
The IoT has been widely used in various fields (e.g., intelligent transportation, smart homes, positioning and navigation, logistics management, food safety, digital medical care, and population mobility) due to its real-time and interactive characteristics. The advantage of real-time information exchange is that it enables people to track the location and status of all devices in the IoT and provides real-world individual and environmental information for big data research. This cannot be provided by internet big data and, therefore, it is irreplaceable. As a result of these advantages, the IoT has also been experimentally investigated in the field of real estate appraisal. Specifically, it includes smart card data (SCD), Global position system (GPS) positioning data, and environmental monitoring data, as follows:
- (1)
- Smart card data: At present, SCD, or anonymous human travel data, is commonly used to represent the accessibility of various public resources in the areas where people live. By calculating accessibility indicators, the relationship between these and housing prices can be explored. For example, Siripanich et al., (2019) linked this emerging data source with the HPM, estimated the accessibility index through SCD, and incorporated it into the HPM [33]. They used big data to reveal the performance of nearby transit nodes, which improved the interpretation ability of the model. Liu et al., (2021) used SCD to calculate the accessibility of medical services and discussed its relationship with the spatial distribution characteristics of housing prices in Beijing, China [75]. Moreover, SCD, which reflects people’s mobility, should not only be limited to residential accessibility but should also be used to characterize the socio-economic attributes of smart card users. Zhu et al., (2018) found that subway commuter distance and passenger travel frequency are significantly negatively correlated with individuals’ income [76], while others suggest the mobility trend and the time spent on travel by people in cities are related to regional house prices [77,78]. These indicate that human travel, or tourism behavior, is closely related to individuals’ socio-economic status. Therefore, big data on travel can be used to a certain extent to represent the social status or economic power of house buyers, which in turn can help to further explore the impact of potential housing demanders’ economic conditions on housing prices.
- (2)
- GPS positioning data: The biggest feature of this data is that it can track the position of the device equipped with a GPS module in real time, and each GPS device represents the position or activity trajectory of one or more individuals. In real estate-related fields, car GPS and mobile phone GPS are used to provide human activity information, which can then be analyzed to determine people’s preferences for real estate from a demand perspective. Generally speaking, vehicle-borne GPS is used by enterprises to track the travel path of target customers to achieve more precise marketing. For example, The Windermere Real Estate Company obtains information on drivers’ travel path via GPS to pinpoint their commuting route and the time cost of potential buyers [79]. On the other hand, mobile phone GPS is used to collect location-based big data. For example, although traditional appraisal work takes into account the impact of public transportation responses to accessibility on housing prices, Qin et al., (2019) obtained hourly positioning data without personal information in Tokyo, Japan, via mobile GPS to investigate the relationship between traffic congestion (another perspective of accessibility) and housing rental prices [80]. Arguably, the application of GPS positioning data in the real estate appraisal field is similar to the role of SCD, both of which reflect people’s travel trajectories and provide new characteristic parameters for the HPM.
- (3)
- Environmental monitoring data: Applied to the real estate appraisal, this data is predominantly provided by government departments and through the use of environmental sensors, including those for noise intensity, air quality, water pollution, and other environmental information [81,82,83,84]. There is no doubt this environmental factor plays an important role in house value. For example, Mei et al., (2020) found an obvious negative correlation between urban air pollution and house prices in Beijing, China [81]. A study conducted by Zambrano-Monserrate and Ruano (2019) in Machala City, Ecuador, shows that every 1 decibel increase in environmental noise reduces house prices by 1.97% [83]. These studies selected as their location developing countries with high pollution to raise awareness within respective governments regarding the need for effective environmental policies. Another study found that introducing environmental pollution variables in the study of house prices in high environmental risk areas can improve the explanatory power of the HPM [85]. However, it is difficult to accurately estimate environmental parameters due to the difficulty of obtaining environmental information in the traditional appraisal work. Therefore, they are rarely considered in the traditional real estate appraisal process. Moreover, existing research shows obvious differences in people’s attention to environmental factors across different regions due to the differences in natural environmental conditions in those regions [64]. Therefore, the background of a study area and its contextual factors should be properly considered when using environmental monitoring data.
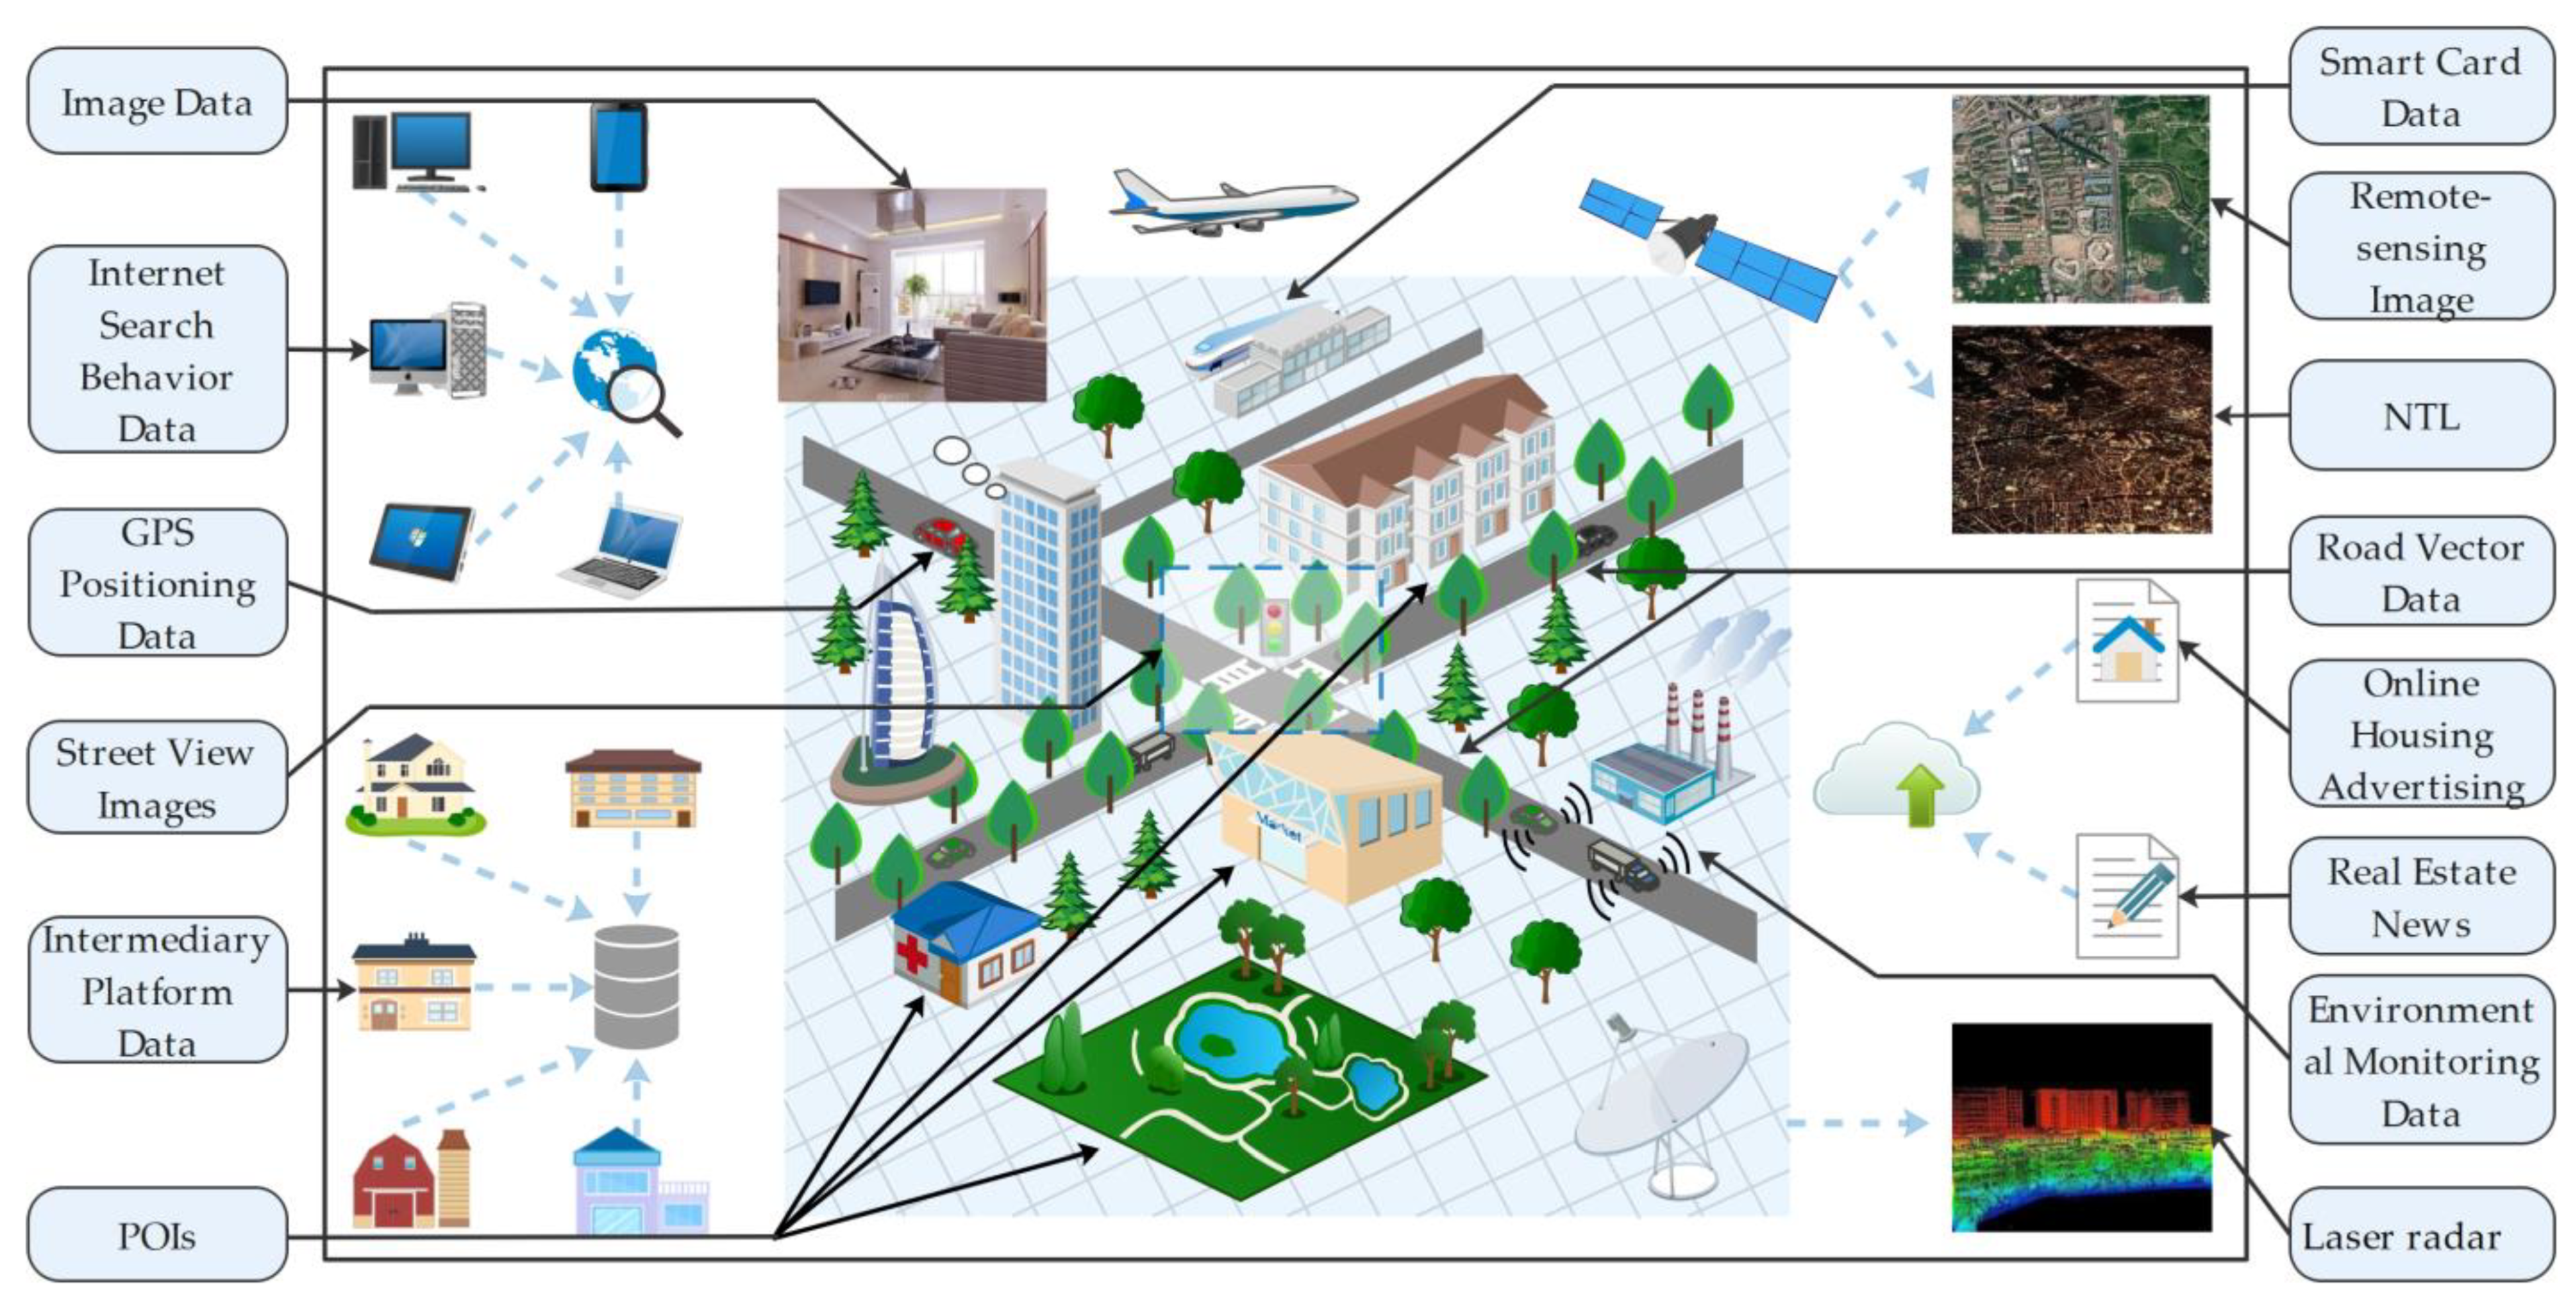
Finally, A atlas is presented to show the relationship between big data and research themes (Figure 2). Accordingly, representative case studies are provided for Table 1. Additionally, Figure 3 is used to enhance the cognition of the application of big data in real world.
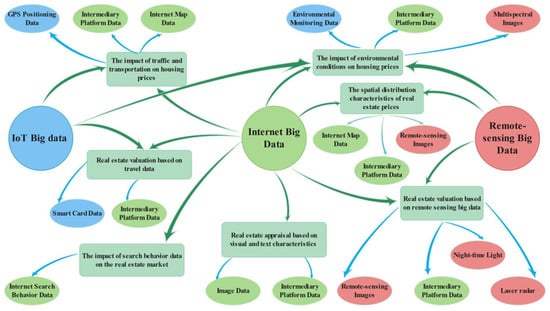
Figure 2.
Big data atlas for real estate appraisal.
Figure 2.
Big data atlas for real estate appraisal.
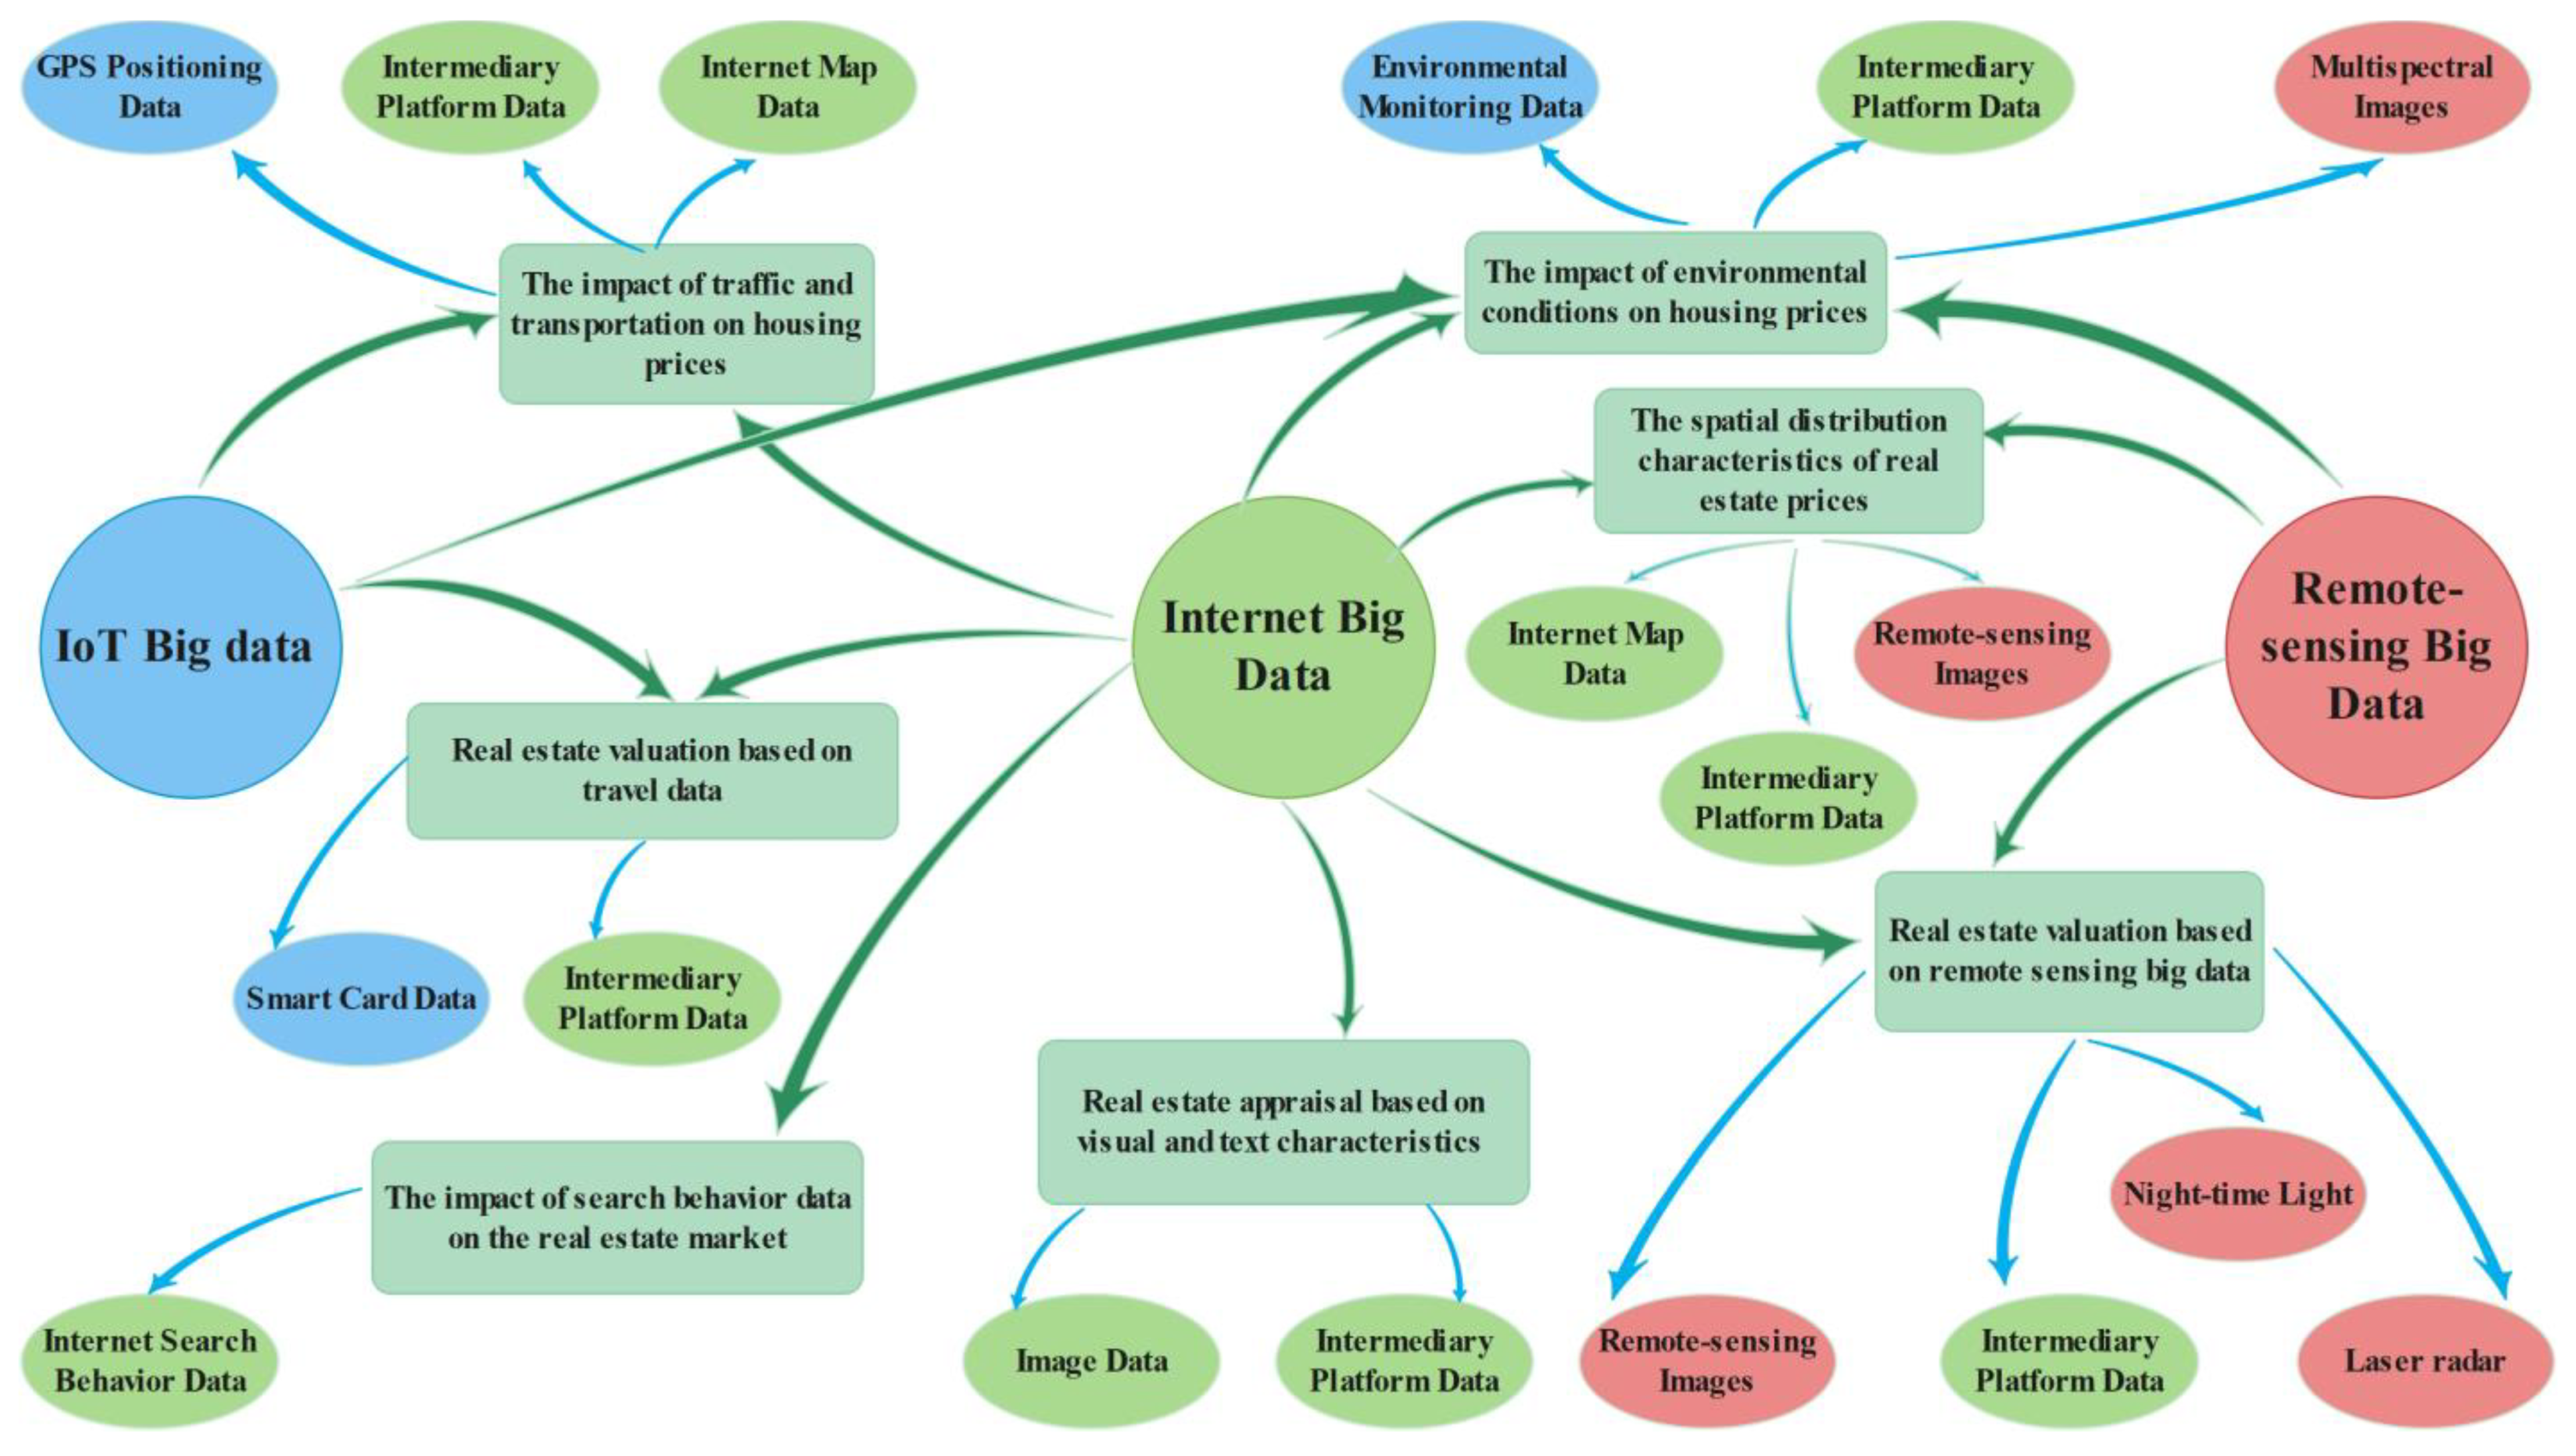

Table 1.
Typical big data applied in real estate appraisal.
Table 1.
Typical big data applied in real estate appraisal.
| Author | Time | Research Topic | Main Types of Big Data Applied |
|---|---|---|---|
| Liu et al. [26] | 2015 | Temporal and spatial effects of urban rail transit on housing prices | Intermediary platform data, POI data |
| Mei et al. [32] | 2018 | The impact of urban green space on housing prices | Multispectral images |
| Zhang et al. [34] | 2021 | Modeling fine-scale residential land price distribution based on open data and machine learning | POI data, NTL |
| Zhu et al. [41] | 2020 | Analysis of the spatial distribution characteristics of urban rental housing supply and demand hotspots | Intermediary platform data, POI data |
| Yao et al. [42] | 2018 | Mapping fine-scale urban housing prices | Remote-sensing image, intermediary platform data, POI data, transportation vector map |
| Lee et al. [43] | 2018 | Prediction of the value of buildings | Intermediary platform data |
| Xue et al. [47] | 2020 | Research on accurate housing prices based on transportation accessibility | Intermediary platform data, POI data |
| Beracha & Wintoki [52] | 2013 | Predicting changes in housing prices based on Internet search behavior | Internet search behavior data |
| Venkataraman et al. [53] | 2018 | Applying Internet search intensity to predict housing prices in emerging markets | Internet search behavior data |
| Liu [56] | 2019 | Predicting China’s commodity housing price index based on Internet search keywords | Internet search behavior data |
| Lee & Park [58] | 2021 | Using photos and metadata to estimate housing prices | Residential images |
| Ahmed & Moustafa [59] | 2016 | Estimating housing prices based on visual and textual features | Residential image, text information data |
| Law et al. [61] | 2019 | Using street-view and satellite imagery to estimate housing prices | Internet housing price dataset, residential images, satellite images |
| Fu et al. [62] | 2019 | Constructing an open-access dataset-based hedonic price model (OADB-HPM) framework to quantify street-view perception and analyze the impact on housing prices | Intermediary platform data, POI data, street-view images, road-network data |
| Su et al. [64] | 2021 | Using big data around housing advertising to study the impact of landscape facilities on rent | Online housing ads |
| Ma et al. [65] | 2018 | Research on real estate confidence index based on real estate news | Real estate news |
| Bency et al. [66] | 2017 | Predicting housing prices with satellite imagery | Intermediary platform data, POI data, satellite images |
| Li et al. [71] | 2019 | Analyzing the potential of using night light images to estimate residential prices | NTL, intermediary platform data, community vector dataset |
| Lu et al. [72] | 2013 | Remote sensing-based house value estimation | Laser radar data, transportation vector map |
| Hamilton and Morgan [73] | 2010 | Measuring the amenity value of urban beach residential property | Laser radar data |
| Liu et al. [75] | 2021 | Relationship between medical service accessibility and residential value based on smart card data | POI data, SCD, intermediary platform data, population distribution data |
| Zhu et al. [76] | 2018 | Inferring the economic attributes of passengers by individual mobility | SCD, intermediary platform data, shop consumer data |
| Du et al. [79] | 2014 | Application of big data in real estate companies | Various types of big data |
| Qin et al. [80] | 2019 | Research on the relationship between rent and congestion time based on mobile phone GPS data | Mobile phone GPS data, intermediary platform data |
| Mei et al. [81] | 2020 | Discussing the impact of air pollution on real estate value | Intermediary platform data, environmental monitoring data, multispectral image |
| Zambrano-Monserrate & Ruano [83] | 2019 | Impact of environmental noise on rent | Environmental monitoring data |
| Zhang et al. [86] | 2020 | Heterogeneous demand of urban parks between homebuyers and renters | Intermediary platform data |
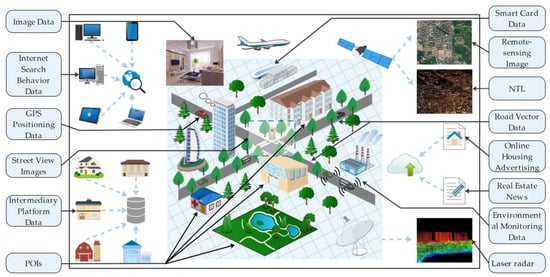
Figure 3.
Schematic diagram of big data applied to real estate appraisal (Adapted from Kong et al. [87]).
Figure 3.
Schematic diagram of big data applied to real estate appraisal (Adapted from Kong et al. [87]).
4. Real Estate Appraisal Methods in the Era of Big Data
The real estate appraisal method has always been a popular topic in economic geography, urban land economics, and real estate economics. Compared with the three most widely used traditional methods in real estate appraisal (i.e., the cost, market, and income methods), the HPM has the advantages of flexible modeling, and it is intuitive in terms of the economic significance of variables. It also makes it easy to observe the impact of increasing and decreasing variables in the modeling process. In the era of big data, a large number of housing price transaction cases have consistently led to an urgent need for data processing and analysis capabilities. This makes the HPM, with its strong multi-parameter processing capability more favorable among scholars [26,61,62,88]. However, the traditional HPM adopts the ordinary least squares method, which no longer meets the demand of real estate appraisal in the new era [68,89]. Therefore, the HPM in the new era has attracted and integrated the advanced theoretical achievements of many disciplines and is continually improving and innovating based on actual demand. At present, researchers are predominantly adopting new algorithms to replace the kernel-least squares regression of the traditional HPM, and the new algorithm kernel can bring significant improvements to model stability and prediction accuracy. Multiple linear regression has disadvantages such as its inability to solve the collinearity of parameters, its insufficient consideration of the spatiality of housing price data, its sensitivity to noise, and it can also easily fall into over-fitting and have poor-fitting accuracy [83,89]. Therefore, improvement ideas for the HPM can roughly be divided into three types: data preprocessing to address high data dimensionality, spatial modeling to address the spatial characteristics of housing price data, and machine learning to improve valuation accuracy. No matter which method types are used, however, GIS spatial analysis needs to be included in the auxiliary analysis. Therefore, the four methods are discussed below.
4.1. Data Pre-Processing
In the past, the number of residential characteristics was limited, and only some important features were considered. However, the massive data brought by the era of big data allows us to greatly expand the number of feature parameters when building models. Some scholars have even considered more than 1000 factors when using the HPM to investigate land price [90]. Although big data has brought a lot of high-dimensional data, it can cause serious problems in terms of multicollinearity and overfitting if directly applied to statistical models. In response to this problem, researchers generally adopt three method types to preprocess the data or improve the model: feature selection, dimensionality reduction, and regularization [91,92,93,94]. In addition, because the data captured by the internet is inevitably full of “dirty” data, data cleaning becomes the precondition of big data analysis, representing an important part of preprocessing.
4.2. Spatial Modeling
Due to the strong spatial autocorrelation and spatial heterogeneity of housing price data, the classic hedonic price regression model cannot be used to deal well with these spatial factors [95]. Therefore, researchers improved the model by considering spatiality, and two spatial modeling paradigms have emerged. First, many researchers have introduced spatial econometrics models into classic hedonic price regression [95,96]. Specifically, some researchers have modeled for the consideration of spatial stability. For example, Long et al., (2009) used the spatial lag and spatial error model to examine the housing prices in Beijing, China, and obtained higher accuracy than the OLS model [97]. Others have predominantly considered the impact of spatial heterogeneity on housing prices. Cao et al., (2019), for instance, used smart card big data to examine the price of public housing in Singapore, finding that the performance of the geographically weighted regression (GWR) model was much better than traditional linear regression [98]. Second, in addition to spatial econometric models, some researchers use spatial interpolation to estimate housing prices [99]. The biggest advantage of this method is that it enables the price surface of the whole region to be obtained with only a few sampling points. Overall, the accuracy of spatial modeling has been greatly improved compared to that of multiple linear regression models. However, the method is still based on traditional statistical methods, and, therefore, the advantages of big data remain under-utilized.
4.3. GIS Spatial Analysis
As researchers use big data as a data source, much of the unstructured data needs to be converted into quantitative data. For example, before they can be used, POIs and road vector data need to be converted into quantitative accessibility indicators of the property to be appraised. Therefore, GIS technology with powerful spatial data management and analysis functions has become the primary tool for analyzing real estate big data. In the era of big data, the development of the internet and the combination of GIS technology have enabled a large amount of real estate and infrastructure information to be openly and transparently displayed on maps, which establishes a strong data foundation for more detailed and accurate research. Specifically, the spatial analysis function provided by the GIS system can assist researchers in quantifying some location-influencing factors, including using the GIS system’s point, line, and surface as well as nuclear density analysis to obtain the distribution of infrastructure and transportation around real estate [43,45,47,100,101]. It also enables an analysis of the impact of important infrastructure on housing prices via buffer analysis [43,102,103] and interpolation analysis to show the spatial distribution of housing prices and so on [99,104].
4.4. Machine Learning
How to best use massive amounts of data has become an important issue in the era of big data. The large-scale data processing and denoising capabilities of machine learning perfectly fit the information features of the large quantity and uneven quality of big data. Machine learning can significantly reduce the difficulty of modeling because it can learn via self-adaptive ways without giving a specific mathematical model [105,106], and the flow chart of machine learning is attached (Figure 4). Simultaneously, its strong generalization ability, fitting accuracy, and nonlinear mapping ability make it more favorable among scholars in the real estate appraisal field [105,107]. In terms of accuracy, several studies have also shown that machine learning (ML) regression has better out-of-sample predictive ability compared with OLS regression [107,108]. The most commonly used methods of machine learning algorithms in the field include artificial neural networks (ANNs), SVM, deep learning (DL), and ensemble learning (EL) [85,105,107]. These four machine learning methods are discussed below.

Figure 4.
Flow chart of applying machine learning to real estate appraisal.
- (1)
- The artificial neural network: This method is the longest-serving and most frequently used of the four machine learning methods in the real estate appraisal field [85,109,110]. Limited by technology, early researchers were unable to obtain enough data. It was not until the explosion of internet big data that its superiority gradually manifested. In recent years, machine learning methods, especially ANN algorithms, have gradually been replacing other methods and are becoming a mainstream real estate appraisal method in the era of big data. Specific applications predominantly include the use of the ANN to predict changes in regional housing prices or housing price indexes [111,112,113], as well as the appraisal of individual property [22,85,88,114]. However, the model also has limitations, such as slow convergence speed, a tendency to overfit when processing high-dimensional data, and easily falling into local minimums during iteration. Researchers usually adopt two approaches to optimize it, including mining the correlation between different data to reduce the correlation and complexity between the data via dimensionality reduction [115,116,117], and integrating some excellent algorithms into neural network models to improve the inherent limitations, such as wavelet transform, genetic algorithm, and so on [118,119].
- (2)
- Support vector machine: This method is a small-sample learning method. Its decision solely depends on a few support vectors instead of the dimension of the sample, and therefore, it avoids the dimension disaster. As an excellent machine learning algorithm, SVM are also widely used to forecast housing prices [120]. Through comparative research, some researchers have found that the short-term forecasting ability of SVM for housing prices is significantly stronger than the classic time-series analysis model and the autoregressive integrated moving average (ARIMA) model [121]. For example, because of the advantages in terms of small sample learning, some researchers have used the SVM model to predict changes in the Shanghai real estate price market given China’s real estate marketization and lack of comparable time series in a short time, which has achieved some good results [122].
- (3)
- Deep learning: DL is considered an extension of the traditional neural network model. The biggest advantage of DL is that, compared with traditional machine learning models, it avoids the cumbersome manual feature engineering process, thereby greatly reducing the modeling threshold. However, it also has the disadvantages of excessive data demand and computation. DL is predominantly applied to recommendation algorithms, medicine, and image recognition. At the same time, applications related to evaluation are now increasing. Although there are researchers who have used DL to handle simple residential features, finding the performance of the DL model to be superior to other machine learning models [123], most use it to solve the difficulty of quantifying the feature information contained in data, such as image and text [37,42,58,60,61,62,66,74,124]. In general, DL is represented by the deep neural network (DNN) model, but more recently, the deep forest (DF) model has been proposed and applied. Because the DF model is derived from the random forest (RF) model, it is better at dealing with classification problems. For example, Ma et al., (2020) regarded house price prediction as a classification problem of interval prediction and used the DF model to predict housing rent and prices in the United States. It achieved a better overall performance than the traditional RF model [125].
- (4)
- Ensemble learning: EL does not refer to a single machine learning algorithm but a strategy of combining multiple weak classifiers with preferences to obtain a strong classifier with improved accuracy. The advantage of this method relates to integrating the learning results and absorbing the errors of each classifier to reduce the overall error rate. The strategies can be divided into three types: boosting, bagging and stacking.
Boosting: The working mechanism here combines a series of weak learners into a strong learner by reducing the bias in supervised learning. In other words, each base learner pays more attention to the error of the previous base learner, and this strategy is used to serialize the base learner into a strong classifier by continuously forcing the next weak learner to make up for the previous error. The gradient boosting decision tree (GBDT) and its two improved variants, the light gradient boosting machine (LightGBM) and eXtreme gradient boosting (XGBoost), are typical representatives of this strategy in the field of real estate or land valuation [31,47,90,124].
Bagging: The working mechanism here is completely different from that of boosting. Weak learners have no dependencies and can be generated in parallel simultaneously. The training set of individual weak learners can be obtained via the bootstrap sampling so that multiple weak learners can be trained, and then a strong learner can be obtained by combining all of them. The most representative model of this strategy is RF, which is obtained via the combination of bagging and the use of the decision tree. This has the advantages of fewer parameters needing to be improved, high calculation efficiency, no overfitting; strong anti-noise ability; good performance in processing high-dimensional and large sample data; and it can rank the importance of input variables and, therefore, the application is very wide. Compared with the neural network model, which usually needs dimensionality reduction, RF is suitable for processing high-dimensional data without feature pre-selection. The comparative studies show that the accuracy of RF is not only much higher than OLS regression but even more superior than the ANN and SVM [19,126,127]. Therefore, although the RF appeared and was applied later than ANN, its superior performance also makes it a method that is increasingly being used in the field of real estate appraisal. In general, a comparative study of many machine learning models has found that bagging ensemble learning methods such as RF and bagged decision trees perform better than others [37].
Stacking: Since every type of machine learning model has its own limitations, some researchers have taken advantage of the stacking strategy so that the models can complement each other—and some strong performances in the real estate appraisal field have been achieved. For example, Neloy et al., (2019) selected a variety of commonly used machine learning models and advanced linear regression as the basic models when studying the apartment rental prices in Dhaka, Bangladesh, before comparing the prediction accuracy of the multiple ensemble learning methods [128]. The findings by Xu and Li (2021) show that the evaluation accuracy of the spatial econometric model is higher than that obtained via multiple linear regression, the accuracy of the machine learning model is much higher than the spatial econometric model. The performance of the two-tier stacking framework model comprising multiple machine learning models was better than all the individual machine learning models it comprised [31]. Xue et al., (2020b) also used a similar stacking algorithm when studying housing prices in Xi’an, China. Although they obtained a prediction accuracy that was better than that of all individual machine learning models, the higher complexity resulted in longer operation hours [129]. Therefore, the stacking strategy has several shortcomings, but the superior performance in accuracy has not prevented it from becoming an important development direction for real estate appraisal methods in the era of big data.
The combination of machine learning modeling and big data technology has made achievements, but we still need to acknowledge several problems with machine learning modeling. First, the machine learning model analyzes each case as an independent case due to its own limitations in logic, but there is no doubt these housing price cases are connected in time and space. To some extent, researchers can avoid the problem of timing by analyzing panel data or adjusting transaction data according to transaction time and network search data, but there seems to be no feasible way to reflect spatiality in machine learning models. At present, it is common practice to directly import the longitude and latitude coordinates as an important feature into the machine model to quantitatively analyze the impact of absolute positions on housing prices. However, the machine learning models belong to the “black box” models and currently lack comparative studies; therefore, the contribution of latitude and longitude coordinate data in the model cannot be clearly defined. Second, another big disadvantage of the machine learning models is that their calculation process is similar to a black box. Thus, they cannot give a clear calculation formula such as that given using the traditional HPM. Therefore, they are essentially unable to explore the relationship between housing prices and the influential factors underpinning them. Third, the performance of some machine models is generally superior in many housing price prediction cases, but it is not sufficiently stable, and the optimal model cannot directly be expected due to differences in research objects, areas, purposes, and data types across different research cases. For example, Lee et al., (2018) showed that the optimal algorithm changes with changes in the research area [43]. Therefore, most researchers use several machine learning algorithms simultaneously when predicting house prices before comparing the errors to choose the best algorithm. Additionally, representative case studies are provided for Table 2.
Table 2.
Real estate appraisal methods in the era of big data.
5. Development of Real Estate Appraisal Enterprises in the Era of Big Data
Mass appraisal of real estate is also known as automatic appraisal of real estate assets. Appraisers need to introduce mathematical statistics, computer technology, and geographic information technology based on traditional real estate valuation theory and models to establish a mathematical model, systematically evaluate a real estate group, and obtain its market value [21]. For tax purposes in the United States, Computer Assisted Mass Appraisal (CAMA), a computer software and system for large-scale appraisal, has been adopted by almost all practitioners [19]. The easy accessibility and low cost of big data allow the real estate appraisal field to develop in the direction of mass appraisal [126,130], of which the rapid development of the internet cloud appraisal platform is the most representative. The main reason for this is that the industrial revolution brought about by the reform of information technology has enabled public cloud computing to significantly lower the threshold of social informatization. Because the cloud platform based on cloud computing can promote resource sharing among appraisal agencies and has the advantages of improving resource utilization efficiency and reducing repetitive investment, many scholars and enterprises are attempting to build cloud platforms to facilitate the informatization development of the real estate appraisal industry. For example, Chen (2013) designed and constructed a real estate appraisal cloud platform based on the open source platform, Cloud Foundry [131]. Additionally, Garcia-Gonzalez et al., (2019) demonstrated an architectural prototype that combined big data with stream processing, which achieved the viewing and processing of real-time and non-real-time real estate big data [132]. However, Zillow in the United States remains the most successful internet appraisal platform. The following section takes Zillow as an example to demonstrate the development status and deficiencies of the real estate appraisal platform.
Zillow has established a huge real estate information database by obtaining the permission of the Multiple Listing Service (MLS) database in many areas of the United States. It has also developed an automatic valuation system called ‘Zestimate’, which is supported by big data. All information is integrated, and the estimated value of a house is given for free, which provides information support for house buyers and sellers. The Wall Street Journal compared the actual sale prices of 1000 properties in seven states in the United States with Zillow’s appraisals. The results showed a median deviation of 7.8%, close to the 7.2% median deviation claimed by Zillow in the whole region, but the report also pointed out that Zillow’s valuation accuracy for areas or property types with less comparable sales data is lower [133]. In the appraisal process, major internet platforms require sellers to provide information about the house to be appraised. For example, Zillow and Meilleurs Agents, the two largest online real estate appraisal platforms in North America and France, respectively, require sellers to provide the location and type of property, ancillary facilities, type and quantity of rooms, building area, decoration status, and style, and surrounding environment (among others). Compared with Meilleurs Agents, Zillow pays closer attention to the decoration and depreciation status of the house and requires sellers to answer questions such as when the house was constructed, occupancy time, decoration materials and style, whether to renovate the entire house or part of the room, and even the abrasion of the ceramic tile floor. Detailed and diverse survey questions enable the automatic appraisal system to gain more relevant information about the house. An increasing number of housing sales cases also make the system smarter, which is also the source of the accuracy of the automatic appraisal system. However, the accuracy of Zillow has also been questioned. First, due to the differences in the databases and appraisal algorithms of each platform, there may be big differences in the valuation of the same house in the United States between Zillow and Redfin, which is also a well-known platform in the United States. This means that the results between different platforms may not be comparable, which can confuse customers in terms of knowing the exact value of the house to be assessed. Second, the appraisal system only values a house based on the limited number or option information filled in by the customer due to a lack of manual on-site observation processes. Of course, this is also because the machine algorithm cannot perceive the environment as humans do, which may result in large errors. Third, the appraisal model may ignore some key variables due to a limited understanding of the influential factors underpinning housing prices. This can lead to the possibility that the automatic appraisal system may overestimate or underestimate some real estate types. For example, Hollas et al., (2010) investigated the accuracy of Zillow. They found that the system did not seem to care about the occupancy of a house, resulting in the overestimation of the value of vacant properties [134]. Finally, because the valuation system cannot know an owner’s motivation to sell their house, and other factors unrelated to real estate, research has found that homeowners versus Zestimate tend to value their homes more accurately [134].
On the other hand, Zillow’s development and the problems it encounters represent future research directions, and some problems have somewhat been solved. For example, satellite images and street view images can improve one’s knowledge of a housing community’s surrounding environmental characteristics. Further, there is no doubt the actual images inside a house reflect the interior status more accurately than the questionnaire filled out by the landlord. The wording in a sales advertisement for a house issued by the landlord can also, to some extent, represent the house owner’s motivation for selling their property. All of the abovementioned factors undoubtedly impact housing transaction prices. Therefore, the successful link between academia and industry can help to increase the role of big data technology in promoting valuation and the sound development of the industry, as well as providing the public with more convenient, efficient, and accurate real estate appraisal services.
6. Discussion
Although scholars have made great progress in applying big data technology in real estate appraisal, there are many limitations. Based on previous research, we share some views as follows.
First, we found that the direction of current research on big data in real estate can broadly be divided into two categories. The first is the use of big data on the internet (internet search behavior data and real estate news data) to monitor changes in the real estate market, as these reflect people’s attitudes to the real estate market and housing price expectations [63]. Online big data can be sensitive to changes in market sentiment, and scholars can directly measure public attitudes to the real estate market by measuring internet search behavior data and real estate news data [63,65]. Compared with the housing price index calculated using traditional statistical methods, the real estate-related index calculated via online big data has the advantage of rapid and sensitive responses to price changes. Therefore, the internet real estate index can be used to predict changes in the market in advance, which can play an important role in the implementation of real estate policy. For example, it is well known that China’s real estate market is strictly controlled by the government. To curb the excessively high housing prices in some hotspot areas, the government has frequently implemented real estate regulation policies. Although this reflects major efforts by the government to protect housing fairness, it also reflects the government’s underestimation of the effects of policies. Since network big data can help monitor public sentiment, it can monitor changes in market sentiment at the beginning of policy promulgation, as well as provide predictive support for market regulation. Even after accumulating enough regulatory data, predictive models can be built to help the government formulate policies more efficiently. Although there is a bright future for research in the real estate appraisal field, most current research is limited to the specific application of big data to predicting various indexes and language processing techniques. We believe the use of big data to help governments better regulate the macroeconomy represents a great application of big data technology. Another is the valuation of individual properties. Although many scholars have included various types of big data in their valuation datasets, the field is still a new area of research. While the profusion of big data has brought innovations to real estate appraisal, there is still a lack of systematic research that shows that the continuous addition of various big data types invariably introduces positive effects. Perhaps there may also be a negative effect between different types of big data? Since big data is spontaneous, there are cases where several big data types point to the same residential characteristics. What are the synergies between these? Such questions are not covered by the existing research. If future research shows that the synergies between big data are not good, or that they have negative side effects, what might the trade-offs be? Therefore, we need to quantify how much big data has helped valuation and influenced valuation results. Finally, the next steps should be clarified—that is, how can big data to build evaluation data sets be selected, and how can criteria be established to apply big data to evaluation?
Second, for real estate appraisal methods, when scholars study their performance, they often refer to the multiple linear regression method or the same type among the early methods [31,98,103,121,125,129]—and they have also achieved some good results. There have also been reports that the results of the automatic valuation system are close to the actual transaction price. However, these all lack comparisons with credible appraisers. Moreover, the precision of the evaluation involved in the research is in the form of the overall performance of researchers’ models (such as average precision). We are concerned that there is a lack of reporting on the reliability of various methods for assessing extreme cases. Therefore, we should think about how mass appraisal systems can be moved from low-risk valuations with sufficiently comparable data to more complex valuations for all property types. Researchers of real estate appraisal methods also need more case studies rather than overall performance to find support for the reliability of their models.
Third, in the face of so many types and sources of big data, integrating and effectively supporting real estate appraisal is important for big data applications. The issue is unavoidable in big data applications, and it is also a hot topic.
- (1)
- We need to establish the basic status of HPM and emphasize its concept, given that most of the research now is based on it. Since the characteristic price corresponding to residential characteristics cannot directly be obtained, it is necessary to collect information on residential characteristics and market transaction data to build a functional model [13]. Chen (2017) believed that the hedonic pricing model uses the regression technique to determine the prices home buyers have paid for different characteristics [82]. The hedonic theory assumes all essential characteristics are considered in the hedonic equation, which is seldom fulfilled due to limited data availability. Therefore, we need to transform big data into quantitative indicators that reflect the characteristics of residences and import them into the HPM with a similar method of stepwise regression to supplement the key indicators missing in traditional models. Alternatively, we could replace the residential characteristics calculated by small data with more accurate big data characteristics to make up for limitations of traditional HPM to a certain extent and improve its accuracy and interpretation capabilities.
- (2)
- We need to clarify the purpose of the research since different purposes will lead to different types and quantities of big data, which will create significant differences in data mining solutions. First, suppose the purpose is to explore whether the introduction of new data has a positive impact on the accuracy of the valuation model and the magnitude of the contribution, or to apply HPM to assess the value of non-marketed goods or environmental externalities based on the characteristics of housing prices that easily reflect people’s willingness to pay for basic public facilities [82,135,136,137,138]. In these scenarios, the research focuses on extracting the characteristic residential information required by the researcher from the new data. These studies rarely involved the aggregation of multi-source big data. Secondly, suppose the purpose is to predict the real estate market trend [52,53,54]. If so, the research focuses on internet search behavior data, real estate news, and macro indicators, and it does not involve other big data types. Third, if the purpose of a given study is to evaluate the value of a property or draw a global housing price map of a key city [33,42,58,59,61,64,71,73,80,83], the goal would be to generate more accurate results than would be generated by traditional methods.
- (3)
- More types of big data that can reflect housing structural, locational, and neighbor-hood-related attributes are introduced into the valuation models to achieve this goal. These need to be integrated into one model. Because the generation of big data is somewhat spontaneous, Pei et al., (2020) called it the “involuntary” generation [139]. Although big data can provide a new perspective for research, the large amount of unstructured data has caused significant problems for users since its generation is not “designed” according to its purpose [139]. However, the development of spatial analysis, computer vision, remote sensing, natural language processing, and their combination with HPM make it possible to extract information on residential characteristics from big data. Further, large amounts of big unstructured data (such as images, text, satellite images, POI, and air quality) are converted into quantitative indicators and integrated into the evaluation system to achieve the goal of transforming multi-source big data to form a multi-data set focused on the research object. In particular, the big data that describes a house itself (including images that reflect the house) can be extracted directly into hedonic values. However, there are some difficulties in fusing big geographic data in the form of vector data and remote sensing data in the form of raster data. This is also an area to which multi-source big data fusion research does not pay much attention. The common practice is directly converting big geographic data into hedonic values through GIS spatial analysis. However, the method inevitably loses a large part of the spatial information contained in the big data. Therefore, the best way to address this is to use the spatial interpolation method to transform big geographic data into global distance and density raster maps.
- (4)
- Remote sensing images are also transformed into commonly used environmental indicator raster maps that can accurately reflect the environment surrounding a piece of real estate. This approach unifies the two types of big data in data form. Subsequently, two fusion methods are adopted. One is the common and less difficult spatial overlay analysis. The other involves using the neural network model CNN, which performs well when extracting image information to fuse the remote sensing image with the raster map generated from big geographic data.
Finally, we give some optimization suggestions based on the characteristics of real estate appraisal methods in the era of big data. Among the real estate appraisal methods in the era of big data, the advantage of spatial modeling is that it makes good use of the spatial autocorrelation and spatial heterogeneity of housing prices. Compared with the OLS model, it significantly improves the accuracy of real estate appraisal; however, it is still inferior to the ML. Nonetheless, the lack of spatiality considerations for housing prices is one of the major drawbacks of mainstream ML. Therefore, we believe that the future direction of HPM is to improve the specificity of machine learning rather than limit it to some general ML models. For example, we believe that the superior performance of RF in many ML methods may be due to the computational logic of randomly generated decision trees with different characteristics which reproduce real-world scenarios, where the value of the real estate is determined by the psychological expectation of many decision-makers who have different preferences. In this case, we could give each decision tree a geographic coordinate at random, or when generating a decision tree, base it on urban population density from a random forest to simulate a large number of homebuyers in a city. Next, each decision tree would be given a certain range of influence (e.g., 10 km). The surrounding decision trees would then only determine the appraised value of each property instead of all decision trees in the entire domain. The advantage of such a development would be that it naturally completes the segmentation of the real estate sub-market. This, however, would not produce an obvious market boundary, which in turn would not reflect the characteristics of the spatial heterogeneity of house prices well. Because market segmentation is performed indirectly, the approach could be used to achieve the transmission effect of real estate prices, taking into account the characteristics of spatial autocorrelation.
7. Conclusions and Research Implications
7.1. Conclusions
In summary, with many important research achievements, real estate appraisal in the era of big data has made significant progress. With the support of big data technology, the data resources of valuation work have been effectively diversified and improved, and data acquisition efficiency has also greatly improved. Appraisal methods are gradually diversifying, but they are also unswervingly moving toward more intelligent directions. The relevant research is gradually deepening with the support of diversified data types and progressive data analysis technology. On this basis, we took the new data resources in the real estate appraisal field in the era of big data and the appraisal methods adapted to the needs of data analysis as the research objects in the current study. We also reviewed the development status of relevant academic research and enterprise applications before drawing conclusions.
The major findings of the current study are as follows. First, the data sources and acquisition methods in the big data era are essentially different from traditional ones. Internet companies are actively establishing large real estate information databases and constantly accumulating transaction data or linking with other real estate transaction databases [140,141]. In the context of the internet’s rapid development, most internet users have become used to releasing demand and searching for information via the internet. Therefore, the internet can provide most of the required data for related research, and efficient and convenient web crawling technology has become the most important means for users to obtain real estate data in the era of big data.
Second, from the perspectives shared in the extant research, the introduction of most new residential features can somewhat improve the accuracy of the HPM. Therefore, the statement “data is king” is also applicable to the real estate appraisal industry. Today, when the potential of traditional residential data is exhausted, only the new characteristics brought by big data mining can fundamentally improve the accuracy of valuation and help researchers understand the important and complex phenomenon of housing prices at a deeper level by exploring the relationship between various big data types and housing prices. This can help to provide a theoretical basis for realizing housing equity and optimizing socio-economic structure. On the other hand, although a wide variety of big data types can provide a systematic and multi-dimensional perspective for investigating housing prices, its disadvantage of low data quality also needs to be treated with caution.
Third, the characteristics of the large amount of data in the big data era, as well as the logical arithmetic independent variables corresponding to the dependent variables of the HPM, determine the superior application prospects of machine learning through the training sample-modeling prediction method. In particular, the advantages of the machine learning algorithm, such as its simple modeling, high accuracy of appraisal, and rapid rate of development, are increasing its usability and application in the field of real estate appraisal. While machine learning approaches are imperfect, Zillow’s Zestimate automated appraisal system is becoming smarter [142]. Experts in artificial intelligence are developing new models that are smarter and more efficient, and advancing machine learning algorithms are pushing the conventions of the real estate appraisal industry, in turn moving it forward.
7.2. Research Implications
The arrival of the big data era means a change in how we think. The large amount of information generated via big data can evaluate real estate more accurately [85]. Data mining based on full samples can help master the overall rules and discover potential phenomena that are difficult to identify in analyses conducted using traditional small data samples, representing future directions in the real estate appraisal field. In the future, the direction of development in this field should keep pace with the times and expand to hot-topic areas, focusing on the areas outlined below.
First, the quality of big data should be tested and improved. Internet big data provides us with incomparable advantages to conveniently study housing prices, but it also has several limitations. Compared with traditional small data, the lower quality of data is the biggest disadvantage of big data. Although some scholars have begun to question the quality of real estate big data [143], most researchers have not paid attention to the impact of data quality on the accuracy of appraisal in the process of using big data. Since data quality has an extremely important impact on the accuracy of appraisal, we believe that necessary data preprocessing and pre-analysis should become the standard prerequisite for the use of big data resources. Although there have been some recent studies on improving the quality of real estate big data [38,144], related research is still scarce. Therefore, scholars should pay attention to research related to improving the quality of real estate big data.
Second, strengthening research on multi-source data integration should be continued. Although many scholars have been strengthening the comprehensive utilization of heterogeneous multi-source big data, most researchers’ utilization of real estate big data is usually limited to a certain type of big data. The joint evaluation of real estate using multi-source big data can achieve comprehensive evaluation, which is of great benefit to improving the performance of the appraisal system. Moreover, the research on the correlation between multiple factors can also reveal some deep-seated potential phenomena. On the other hand, although there are many benefits of using multi-source big data for real estate appraisal, it is difficult to quantify a large number of heterogeneous data and integrate them into a unified evaluation system, and scholars’ use of methods to date has not been unified [42,145]. Therefore, strengthening the research on multi-source data integration can play an important role in effectively mining the information potential of big data.
Third, it is important to take advantage of various regression methods and establish a more accurate and reasonable joint appraisal model. The characteristics of housing appraisal cases determine that spatiality is an important attribute that distinguishes housing price data from other non-geographical data. This can be seen from the notion that the accuracy of spatial modeling is much higher than that generated using the OLS method. However, the arithmetic logic of the machine learning model with the best performance of big data appraisal determines that it cannot account for the spatiality of housing price data. Therefore, future researchers can attempt to establish a joint model of spatial regression and machine learning, combining the advantages of the two modeling methods to further improve evaluation accuracy.
Next, looking for more reliable big data resources that can be used for real estate appraisal will be beneficial. It is difficult to develop new big data resources that can be used for real estate appraisal. Restricted by various factors such as data type, availability, difficulty in processing, and significance for real estate appraisal work, relevant research has lagged. However, due to the rapid development of computer technology, learning from mature big data mining technology in other fields has become a more convenient method. For example, in recent years, scholars have introduced increasingly mature computer vision technology into the real estate appraisal field, making the analysis of humans’ visual perceptions of real estate through image data possible.
Finally, for the real estate appraisal industry, the opportunities and challenges created by the big data era will cause the entire industry to either actively or passively develop in the direction of informatization. More specifically, the application of various data platforms can help to achieve the automation of data collection, and cloud computing platforms move us toward the intelligence of valuation work. This replaces the collection and collation of data, selection of appraisal methods, and calculations in traditional appraisal work with an automatic appraisal system. Therefore, the focus of appraisers’ work should shift from collecting data, selecting methods, and calculating prices to data processing, analysis, and database management. Simultaneously, with the continuous accumulation of data related to real estate, appraisal institutions can also develop from a single real estate appraisal business to an appraisal consulting agency that provides data analysis services. In the future, the real estate appraisal industry could take this opportunity to pursue new technologies, establish standardized processes, integrate resources, and transform promptly toward promoting the continuous development and progress of the industry.
Author Contributions
Conceptualization, C.W. and M.F.; methodology, M.F.; software, H.Y.; validation, C.W., M.F. and L.W.; formal analysis, F.T.; investigation, H.Y.; resources, L.W.; data curation, Y.X.; writing—original draft preparation, C.W.; writing—review and editing, C.W.; visualization, M.F.; supervision, L.W.; project administration, L.W.; funding acquisition, L.W. All authors have read and agreed to the published version of the manuscript.
Funding
This research was supported by the National Key Research and Development Project of China (Grant No. 2021YFE010097) and the National Natural Science Foundation of China (Grant No. 41871347).
Data Availability Statement
Not applicable.
Acknowledgments
The authors would like to thank editors and anonymous reviewers for their constructive comments and suggestions.
Conflicts of Interest
The authors declare no conflict of interest.
References
- Nagdive, A.S.; Tugnayat, R.M.; Tembhurkar, M.P. Overview on performance testing approach in big data. Int. J. Adv. Res. Comput. Sci. 2014, 5, 165–169. [Google Scholar]
- Singh, A.; Sharma, A.; Dubey, G. Big data analytics predicting real estate prices. Int. J. Syst. Assur. Eng. Manag. 2020, 11, 208–219. [Google Scholar] [CrossRef]
- Kościelniak, H.; Puto, A. BIG DATA in decision making processes of enterprises. Procedia Comput. Sci. 2015, 65, 1052–1058. [Google Scholar] [CrossRef] [Green Version]
- Bhavna, A. Big data analytics: The underlying technologies used by organizations for value generation. In Understanding the Role of Business Analytics; Chahal, H., Jyoti, J., Wirtz, J., Eds.; Springer: Singapore, 2018; pp. 9–30. [Google Scholar]
- Pei, T.; Song, C.; Guo, S.; Shu, H.; Liu, Y.; Du, Y.; Ma, T.; Zhou, C. Big geodata mining: Objective, connotations and research issues. J. Geogr. Syst. 2020, 30, 251–266. [Google Scholar] [CrossRef]
- Raut, R.D.; Mangla, S.K.; Narwane, V.S.; Gardas, B.B.; Priyadarshinee, P.; Narkhede, B.E. Linking big data analytics and operational sustainability practices for sustainable business management. J. Clean. Prod. 2019, 224, 10–24. [Google Scholar] [CrossRef]
- Blazquez, D.; Domenech, J. Big data sources and methods for social and economic analyses. Technol. Forecast. Soc. Chang. 2018, 130, 99–113. [Google Scholar] [CrossRef]
- Ginsberg, J.; Mohebbi, M.H.; Patel, R.S.; Brammer, L.; Smolinski, M.S.; Brilliant, L. Detecting influenza epidemics using search engine query data. Nature 2009, 457, 1012–1014. [Google Scholar] [CrossRef]
- Liu, Z.; Ma, T.; Du, Y.; Pei, T.; Yi, J.; Peng, H. Mapping hourly dynamics of urban population using trajectories reconstructed from mobile phone records. Trans. GIS 2018, 22, 494–513. [Google Scholar] [CrossRef]
- Fina, S.; Joshi, J.; Wittowsky, D. Monitoring travel patterns in German city regions with the help of mobile phone network data. Int. J. Digit Earth 2021, 14, 379–399. [Google Scholar] [CrossRef]
- He, Q.; Zhou, J.; Tan, S.; Song, Y.; Zhang, L.; Mou, Y.; Wu, J. What is the developmental level of outlying expansion patches? A study of 275 Chinese cities using geographical big data. Cities 2020, 105, 102395. [Google Scholar] [CrossRef]
- Goodman, A.C. Andrew Court and the Invention of Hedonic Price Analysis. J. Urban Econ. 1998, 44, 291–298. [Google Scholar] [CrossRef] [Green Version]
- Xuyu, W. The Research of Housing Characteristic Price in Shanghai Based on Hedonic Model. Ph.D Thesis, Tongji University, Shanghai, China, 2006. [Google Scholar]
- Wen, H.; Lu, J.; Fu, Y. Product differentiation and hedonic prices: An empirical analysis. In Proceedings of the 2005 International Conference on Services Systems and Services Management (ICSSSM), Chongqing, China, 13–15 June 2005; pp. 1259–1263. [Google Scholar]
- Lancaster, K.J. A New Approach to Consumer Theory. J. Political Econ. 1966, 74, 132–157. [Google Scholar] [CrossRef]
- Rosen, S. Hedonic Prices and Implicit Markets: Product Differentiation in Pure Competition. J. Political Econ. 1974, 82, 34–55. [Google Scholar] [CrossRef]
- Wang, D.; Huang, W. Effect of urban environment on residential property values by hedonic method: A case study of Shanghai. City Plan. Rev. 2007, 31, 34–41, 46. [Google Scholar] [CrossRef]
- Let Me Introduce: Mass Appraisal. Available online: https://www.rics.org/oceania/news-insight/future-of-surveying/data-technology/mass-appraisal/ (accessed on 11 February 2022).
- Hong, J.; Choi, H.; Kim, W.-S. A house price valuation based on the random forest approach: The mass appraisal of residential property in South Korea. Int. J. Strateg. Prop. Manag. 2020, 24, 140–152. [Google Scholar] [CrossRef]
- Torres-Pruñonosa, J.; García-Estévez, P.; Prado-Román, C. Artificial Neural Network, Quantile and Semi-Log Regression Modelling of Mass Appraisal in Housing. Mathematics 2021, 9, 783. [Google Scholar] [CrossRef]
- Zhou, G.; Ji, Y.; Chen, X.; Zhang, F. Artificial neural networks and the mass appraisal of real estate. Int. J. Online Eng. 2018, 14, 180–187. [Google Scholar] [CrossRef] [Green Version]
- Peterson, S.; Flanagan, A. Neural network hedonic pricing models in mass real estate appraisal. J. Real Estate Res. 2009, 31, 147–164. [Google Scholar] [CrossRef]
- Bagnoli, C.; Smith, H. The Theory of Fuzz Logic and its Application to Real Estate Valuation. J. Real Estate Res. 1998, 16, 169–200. [Google Scholar] [CrossRef]
- Guo, J.; Chiang, S.-H.; Liu, M.; Yang, C.; Guo, K. Can mchine learning algorithms associated with text mining from Internet data improve housing price prediction performance? Int. J. Strateg. Prop. Manag. 2020, 24, 300–312. [Google Scholar] [CrossRef]
- Huiping, H.; Qiangzi, L. Opportunities, data sources, and potential applications of land use optimization in the big data era. China Land Sci. 2017, 31, 74–82. [Google Scholar] [CrossRef]
- Liu, K.; Li, Z.; Zhang, X. Empirical research based on web data: An analysis on spatio-temporal effect of city rail transit on residential house prices. Comput. Sci. 2015, 42, 199–203, 213. [Google Scholar] [CrossRef]
- Kettani, O.; Oral, M. Designing and implementing a real estate appraisal system: The case of Québec Province, Canada. Socio-Econ. Plan. Sci. 2015, 49, 1–9. [Google Scholar] [CrossRef]
- Rondinelli, C.; Veronese, G. Housing rent dynamics in Italy. Econ. Model. 2011, 28, 540–548. [Google Scholar] [CrossRef]
- Feng, C.; Li, W.; Zhao, F. Influence of rail transit on nearby commodity housing prices:A case study of Beijing Subway Line Five. Acta Geogr. Sin. 2011, 66, 1055–1062. [Google Scholar] [CrossRef]
- Roy, D. Housing demand in Indian metros: A hedonic approach. Int. J. Hous. Mark. Anal. 2018, 13, 19–55. [Google Scholar] [CrossRef]
- Xu, L.; Li, Z. A new appraisal model of second-hand housing prices in China’s first-tier cities based on machine learning algorithms. Comput. Econ. 2021, 57, 617–637. [Google Scholar] [CrossRef]
- Mei, Y.; Zhao, X.; Lin, L.; Gao, L. Capitalization of urban green vegetation in a housing market with poor environmental quality: Evidence from Beijing. J. Urban Plan. Dev. 2018, 144, 05018011. [Google Scholar] [CrossRef]
- Siripanich, A.; Rashidi, T.H.; Moylan, E. Interaction of public transport accessibility and residential property values using smart card data. Sustainability 2019, 11, 2709. [Google Scholar] [CrossRef] [Green Version]
- Zhang, P.; Hu, S.; Li, W.; Zhang, C.; Yang, S.; Qu, S. Modeling fine-scale residential land price distribution: An experimental study using open data and machine learning. Appl. Geogr. 2021, 129, 102442. [Google Scholar] [CrossRef]
- Geoff, B.; Paul, W. New insights into rental housing markets across the United States: Web scraping and analyzing Craigslist rental listings. J. Plan. Educ. Res. 2017, 37, 457–476. [Google Scholar] [CrossRef] [Green Version]
- Han, L.; Wei, Y.D.; Wu, Y.; Tian, G. Analyzing housing prices in Shanghai with open data: Amenity, accessibility and urban structure. Cities 2019, 91, 165–179. [Google Scholar] [CrossRef]
- Zhou, X.; Tong, W.; Li, D. Modeling housing rent in the Atlanta metropolitan area using textual information and deep learning. ISPRS Int. J. Geo-Inf. 2019, 8, 349. [Google Scholar] [CrossRef] [Green Version]
- García-Magariño, I.; Medrano, C.; Delgado, J. Estimation of missing prices in real-estate market agent-based simulations with machine learning and dimensionality reduction methods. Neural. Comput. Appl. 2020, 32, 2665–2682. [Google Scholar] [CrossRef]
- Meng, J.; Qin, H.; Liu, J.; Gan, Y. Design and research of distributed web crawler. Mod. Comput. 2017, 24, 62–65. [Google Scholar] [CrossRef]
- Zheng, M. Research on Beijing Housing Prices Based on Web Crawlers. Master’s Thesis, Yangtze University, Jingzhou, China, 2018. [Google Scholar]
- Zhu, L.; Yu, T.; Liu, Y.; Zhou, L. Analyses on the spatial distribution characteristics of urban rental housing supply and demand hotspots based on social media data. In Proceedings of the 2020 5th IEEE International Conference on Big Data Analytics (ICBDA), Xiamen, China, 8–11 May 2020; pp. 126–130. [Google Scholar]
- Yao, Y.; Zhang, J.; Hong, Y.; Liang, H.; He, J. Mapping fine-scale urban housing prices by fusing remotely sensed imagery and social media data. Trans. GIS 2018, 22, 561–581. [Google Scholar] [CrossRef]
- Lee, W.; Kim, N.; Choi, Y.H.; Kim, Y.S.; Lee, B.D. Machine learning based prediction of the value of buildings. KSII Trans. Internet Inf. Syst. (TIIS) 2018, 12, 3966–3991. [Google Scholar] [CrossRef]
- Xu, Y.; Zhang, Q.; Zheng, S.; Zhu, G. House age, price and rent: Implications from land-structure decomposition. J. Real Estate Financ. 2018, 56, 303–324. [Google Scholar] [CrossRef] [Green Version]
- Liu, Y. Investigastion of Method for Predicting House Price Based on BP Neural Network and BAIDU Map API. Master’s Thesis, Inner Mongolia University, Huhhot, China, 2019. [Google Scholar]
- Wu, C.; Ye, X.; Ren, F.; Du, Q. Check-in behaviour and spatio-temporal vibrancy: An exploratory analysis in Shenzhen, China. Cities 2018, 77, 104–116. [Google Scholar] [CrossRef]
- Xue, C.; Ju, Y.; Li, S.; Zhou, Q. Research on the sustainable development of urban housing price based on transport accessibility: A case study of Xi’an, China. Sustainability 2020, 12, 1497. [Google Scholar] [CrossRef] [Green Version]
- National Association of Realtors Report-2020 Profile of Home Buyers and Sellers. Available online: https://www.nar.realtor/research-and-statistics/research-reports (accessed on 30 October 2021).
- Dutta, C.B.; Das, D.K. What drives consumers’ online information search behavior? Evidence from England. J. Retail. Consum. Serv. 2017, 35, 36–45. [Google Scholar] [CrossRef]
- Jani, D.; Jang, J.-H.; Hwang, Y.-H. Big five factors of personality and tourists’ Internet search behavior. Asia Pac. J. Tour. Res. 2014, 19, 600–615. [Google Scholar] [CrossRef]
- Van Dijk, D.W.; Francke, M.K. Internet search behavior, liquidity and prices in the housing market. Real Estate Econ. 2018, 46, 368–403. [Google Scholar] [CrossRef]
- Beracha, E.; Wintoki, M.B. Forecasting residential real estate price changes from online search activity. J. Real Estate Res. 2013, 35, 283–312. [Google Scholar] [CrossRef]
- Venkataraman, M.; Panchapagesan, V.; Jalan, E. Does internet search intensity predict house prices in emerging markets? A case of India. Prop. Manag. 2018, 36, 103–118. [Google Scholar] [CrossRef]
- Yang, S.; Dong, J.; Li, X. A study of factors influencing real estate price based on network keywords search. J. Xinjiang Univ. Financ. Econ. 2013, 2013, 5–12. [Google Scholar] [CrossRef]
- Rizun, N.; Baj-Rogowska, A. Can web search queries predict prices change on the real estate market? IEEE Access 2021, 9, 70095–70117. [Google Scholar] [CrossRef]
- Liu, C. Research on Prediction of Commodity Housing Price Index Based on Web Search Keywords. Master’s Thesis, Yunnan University of Finance and Economics, Kunming, China, 2019. [Google Scholar]
- Guan, X. The Application Research of Web Search Index in Real Estate Comparsion Method. Master’s Thesis, Capital University of Economics and Business, Beijing, China, 2018. [Google Scholar]
- Lee, C.; Park, K.-H. Using photographs and metadata to estimate house prices in South Korea. Data Technol. Appl. 2021, 55, 280–292. [Google Scholar] [CrossRef]
- Ahmed, E.H.; Moustafa, M. House price estimation from visual and textual features. In Proceedings of the NCTA, 8th International Conference on Neural Computation Theory and Applications, Porto, Portugal, 9–11 November 2016; pp. 62–68. [Google Scholar]
- Poursaeed, O.; Matera, T.; Belongie, S. Vision-based real estate price estimation. Mach. Vis. Appl. 2018, 29, 667–676. [Google Scholar] [CrossRef] [Green Version]
- Law, S.; Paige, B.; Russell, C. Take a look around: Using street view and satellite images to estimate house prices. ACM Trans. Intell. Syst. Technol. 2019, 10, 1–19. [Google Scholar] [CrossRef] [Green Version]
- Fu, X.; Jia, T.; Zhang, X.; Li, S.; Zhang, Y. Do street-level scene perceptions affect housing prices in Chinese megacities? An analysis using open access datasets and deep learning. PLoS ONE 2019, 14, e0217505. [Google Scholar] [CrossRef] [PubMed]
- Kang, H.; Lee, K.; Shin, D.H. Short-term forecast model of apartment Jeonse prices using search frequencies of news article keywords. KSCE J. Civ. Eng. 2019, 23, 4984–4991. [Google Scholar] [CrossRef]
- Su, S.; He, S.; Sun, C.; Zhang, H.; Hu, L.; Kang, M. Do landscape amenities impact private housing rental prices? A hierarchical hedonic modeling approach based on semantic and sentimental analysis of online housing advertisements across five Chinese megacities. Urban For. Urban Green. 2021, 58, 126968. [Google Scholar] [CrossRef]
- Ma, Y.; Xu, B.; Xu, X. Real estate confidence index based on real estate news. Emerg. Mark. Financ. Trade 2018, 54, 747–760. [Google Scholar] [CrossRef]
- Bency, A.J.; Rallapalli, S.; Ganti, R.K.; Srivatsa, M.; Manjunath, B.S. Beyond Spatial Auto-Regressive models: Predicting housing prices with satellite imagery. In Proceedings of the 2017 IEEE Winter Conference on Applications of Computer Vision (WACV), Santa Rosa, CA, USA, 24–31 March 2017; pp. 320–329. [Google Scholar]
- Liu, Y.; Chen, Y.; Liu, Y.; Wang, J.; Zhang, H. Unit rent appraisal in community-scale and spatial pattern mapping in a metropolitan area using online real estate data:A case study of Shenzhen. Trop. Geogr. 2019, 39, 188–195. [Google Scholar] [CrossRef]
- Yu, D.; Wei, Y.D.; Wu, C. Modeling spatial dimensions of housing prices in Milwaukee, WI. Environ. Plan. B Plan. Des. 2007, 34, 1085–1102. [Google Scholar] [CrossRef]
- Han, X.; Zhou, Y.; Wang, S.; Liu, R.; Yao, Y. GDP spatialization in China based on DMSP/OLS data and land use data. Remote Sens. Technol. Appl. 2012, 27, 396–405. [Google Scholar]
- Song, J.; Tong, X.; Wang, L.; Zhao, C.; Prishchepov, A.V. Monitoring finer-scale population density in urban functional zones: A remote sensing data fusion approach. Landsc. Urban Plan. 2019, 190, 103580. [Google Scholar] [CrossRef]
- Li, C.; Zou, L.; Wu, Y.; Xu, H. Potentiality of using Luojia1-01 night-time light imagery to estimate urban community housing price—A case study in Wuhan, China. Sensors 2019, 19, 3167. [Google Scholar] [CrossRef] [Green Version]
- Lu, Z.; Im, J.; Quackenbush, L.J.; Yoo, S. Remote sensing-based house value estimation using an optimized regional regression model. Photogramm. Eng. Remote Sens. 2013, 79, 809–820. [Google Scholar] [CrossRef]
- Hamilton, S.E.; Morgan, A. Integrating lidar, GIS and hedonic price modeling to measure amenity values in urban beach residential property markets. Comput. Environ. Urban Syst. 2010, 34, 133–141. [Google Scholar] [CrossRef] [Green Version]
- Wang, P.Y.; Chen, C.T.; Su, J.W.; Wang, T.Y.; Huang, S.H. Deep learning model for house price prediction using heterogeneous data analysis along with joint self-attention mechanism. IEEE Access 2021, 9, 55244–55259. [Google Scholar] [CrossRef]
- Liu, X.; Lin, Z.; Huang, J.; Gao, H.; Shi, W. Evaluating the inequality of medical service accessibility using smart card data. Int. J. Environ. Res. Public Health 2021, 18, 2711. [Google Scholar] [CrossRef] [PubMed]
- Zhu, Y.; Chen, F.; Li, M.; Wang, Z. Inferring the economic attributes of urban rail transit passengers based on individual mobility using multisource data. Sustainability 2018, 10, 4178. [Google Scholar] [CrossRef] [Green Version]
- Zhu, K.; Yin, H.; Qu, Y.; Wu, J. Group travel behavior in metro system and its relationship with house price. Phys. A Stat. Mech. Its Appl. 2021, 573, 125957. [Google Scholar] [CrossRef]
- Lin, P.; Weng, J.; Alivanistos, D.; Ma, S.; Yin, B. Identifying and segmenting commuting behavior patterns based on smart card data and travel survey data. Sustainability 2020, 12, 5010. [Google Scholar] [CrossRef]
- Du, D.; Li, A.; Zhang, L. Survey on the applications of big data in Chinese real estate enterprise. Procedia Comput. Sci. 2014, 30, 24–33. [Google Scholar] [CrossRef] [Green Version]
- Qin, Y.; Akiyama, Y.; Ogawa, Y.; Shibasaki, R.; Sato, T. Study on the relationship between house rent and people congestion by time in Tokyo based on mobile phone GPS data. In Proceedings of the 2019 IEEE International Conference on Big Data (Big Data), Los Angeles, CA, USA, 9–12 December 2019; pp. 5313–5320. [Google Scholar]
- Mei, Y.; Gao, L.; Zhang, J.; Wang, J. Valuing urban air quality: A hedonic price analysis in Beijing, China. Environ. Sci. Pollut. Res. Int. 2020, 27, 1373–1385. [Google Scholar] [CrossRef]
- Chen, W.Y. Environmental externalities of urban river pollution and restoration: A hedonic analysis in Guangzhou (China). Landsc. Urban Plan. 2017, 157, 170–179. [Google Scholar] [CrossRef]
- Zambrano-Monserrate, M.A.; Ruano, M.A. Does environmental noise affect housing rental prices in developing countries? Evidence from Ecuador. Land Use Policy 2019, 87, 104059. [Google Scholar] [CrossRef]
- Landajo, M.; Bilbao, C.; Bilbao, A. Nonparametric neural network modeling of hedonic prices in the housing market. Empir. Econ. 2012, 42, 987–1009. [Google Scholar] [CrossRef]
- Chiarazzo, V.; Caggiani, L.; Marinelli, M.; Ottomanelli, M. A neural network based model for real estate price estimation considering environmental quality of property location. In Proceedings of the 17th Meeting of the EURO Working Group on Transportation, EWGT2014, Sevilla, Spain, 2–4 July 2014; pp. 810–817. [Google Scholar]
- Zhang, T.; Zeng, Y.; Zhang, Y.; Song, Y.; Li, H. The heterogenous demand for urban parks between home buyers and renters: Evidence from Beijing. Sustainability 2020, 12, 9058. [Google Scholar] [CrossRef]
- Kong, L.; Liu, Z.; Wu, J. A systematic review of big data-based urban sustainability research: State-of-the-science and future directions. J. Clean. Prod. 2020, 273, 123142. [Google Scholar] [CrossRef]
- Selim, H. Determinants of house prices in Turkey: Hedonic regression versus artificial neural network. Expert Syst. Appl. 2009, 36, 2843–2852. [Google Scholar] [CrossRef]
- Yu, D.; Wu, C. Incorporating remote sensing information in modeling house values: A regression tree approach. Photogramm. Eng. Remote Sens. 2006, 72, 129–138. [Google Scholar] [CrossRef]
- Ma, J.; Cheng, J.C.P.; Jiang, F.; Chen, W.; Zhang, J. Analyzing driving factors of land values in urban scale based on big data and non-linear machine learning techniques. Land Use Policy 2020, 94, 104537. [Google Scholar] [CrossRef]
- Shi, W. The Price Factor Analysis of Second-Hand House Based on the Method of Data Mining and LASSO. Master’s Thesis, Beijing University Of Technology, Beijing, China, 2017. [Google Scholar]
- Oladunni, T.; Sharma, S.; Tiwang, R. A spatio-temporal hedonic house regression model. In Proceedings of the 2017 16th IEEE International Conference on Machine Learning and Applications (ICMLA), Cancun, Mexico, 18–21 December 2017; pp. 607–612. [Google Scholar]
- Bárcena, M.J.; Menéndez, P.; Palacios, M.B.; Tusell, F. Alleviating the effect of collinearity in geographically weighted regression. J. Geogr. Syst. 2014, 16, 441–466. [Google Scholar] [CrossRef]
- Wu, C.; Ye, X.; Ren, F.; Du, Q. Modified data-driven framework for housing market segmentation. J. Urban Plan Dev. 2018, 144, 04018036. [Google Scholar] [CrossRef]
- Liv, O. An Application of Spatial Econometrics in Relation to Hedonic House Price Modeling. J. Real Estate Res. 2010, 32, 289–320. [Google Scholar]
- Wen, H.; Zhang, Z.; Zhang, L. An empirical analysis on spatial effects of the housing price based on spatial econometric models:Evidence from Hangzhou City. Syst. Eng. Theory Pract. 2011, 31, 1661–1667. [Google Scholar] [CrossRef]
- Long, F.; Zheng, S.; Wang, Y.; Guo, M. Value estimates of local public services using a spatial econometric model. J. Tsinghua Univ. Sci. Technol. 2009, 49, 2028–2031. [Google Scholar] [CrossRef]
- Cao, K.; Diao, M.; Wu, B. A big data-based geographically weighted regression model for public housing prices: A case study in Singapore. Ann. Am. Assoc. Geogr. 2019, 109, 173–186. [Google Scholar] [CrossRef]
- Kuntz, M.; Helbich, M. Geostatistical mapping of real estate prices: An empirical comparison of kriging and cokriging. Int. J. Geogr. Inf. Sci. 2014, 28, 1904–1921. [Google Scholar] [CrossRef]
- Tang, J.; Liu, Z.; Wang, Y.; Yang, J.; Wang, Q. Using geographic information and point of interest to estimate missing second-hand housing price of residential area in urban space. In Proceedings of the 2018 IEEE International Smart Cities Conference (ISC2), Kansas City, MO, USA, 16–19 September 2018; pp. 1–8. [Google Scholar]
- Jang, M.; Kang, C.-D. Retail accessibility and proximity effects on housing prices in Seoul, Korea: A retail type and housing submarket approach. Habitat Int. 2015, 49, 516–528. [Google Scholar] [CrossRef]
- Liebelt, V.; Bartke, S.; Schwarz, N. Urban green spaces and housing prices: An alternative perspective. Sustainability 2019, 11, 3707. [Google Scholar] [CrossRef] [Green Version]
- Chica-Olmo, J.; Cano-Guervos, R.; Tamaris-Turizo, I. Determination of buffer zone for negative externalities: Effect on housing prices. Geogr. J. 2019, 185, 222–236. [Google Scholar] [CrossRef]
- Zhang, Z.; Lu, X.; Zhou, M.; Song, Y.; Luo, X.; Kuang, B. Complex spatial morphology of urban housing price based on digital elevation model: A case study of Wuhan city, China. Sustainability 2019, 11, 348. [Google Scholar] [CrossRef] [Green Version]
- Liu, R. Research on the PSO-LSSVR Predication Model of Urban Housing Prices. Ph.D Thesis, Chongqing University, Chongqing, China, 2014. [Google Scholar]
- Liu, X.; Deng, Z.; Wang, T. Real estate appraisal system based on GIS and BP neural network. Trans. Nonferrous Met. Soc. China 2011, 21, 626–630. [Google Scholar] [CrossRef]
- Embaye, W.T.; Zereyesus, Y.A.; Chen, B. Predicting the rental value of houses in household surveys in Tanzania, Uganda and Malawi: Evaluations of hedonic pricing and machine learning approaches. PLoS ONE 2021, 16, e0244953. [Google Scholar] [CrossRef]
- Simlai, P.E. Predicting owner-occupied housing values using machine learning: An empirical investigation of California census tracts data. J. Prop. Res. 2021, 38, 305–336. [Google Scholar] [CrossRef]
- Kauko, T. On current neural network applications involving spatial modelling of property prices. J. Hous. Built Environ. 2003, 18, 159–181. [Google Scholar] [CrossRef]
- Borst, R.A. Artificial neural networks: The next modelling/calibration technology for the assessment community. Prop. Tax J. 1991, 10, 69–94. [Google Scholar]
- Lim, W.T.; Wang, L.; Wang, Y.; Chang, Q. Housing price prediction using neural networks. In Proceedings of the 2016 12th International Conference on Natural Computation, Fuzzy Systems and Knowledge Discovery (ICNC-FSKD), Changsha, China, 13–15 August 2016; pp. 518–522. [Google Scholar]
- Azadeh, A.; Sheikhalishahi, M.; Boostani, A. A flexible neuro-fuzzy approach for improvement of seasonal housing price estimation in uncertain and non-linear Environments. S. Afr. J. Econ. 2014, 82, 567–582. [Google Scholar] [CrossRef]
- Daradi, S.A.M.; Yusof, U.K.; Ab Kader, N.I.B. Prediction of housing price index in Malaysia using optimized artificial neural network. Adv. Sci. Lett. 2018, 24, 1307–1311. [Google Scholar] [CrossRef]
- Wu, H.; Jiao, H.; Yu, Y.; Li, Z.; Peng, Z.; Liu, L.; Zeng, Z. Influence factors and regression model of urban housing prices based on Internet open access data. Sustainability 2018, 10, 1676. [Google Scholar] [CrossRef] [Green Version]
- Shao, W.; Li, X.; Zhang, T.; Wang, Y. Application on real estate price prediction based on a method of data mining. Math. Pract. Theory 2020, 50, 306–311. [Google Scholar]
- Li, B.; Ji, L.; Song, Y.; Shao, J. Research on housing hedonic price model based on PCA and BP neural network. J. Qingdao Univ. Technol. 2017, 38, 108–113. [Google Scholar] [CrossRef]
- Wilson, I.D.; Jones, A.J.; Jenkins, D.H.; Ware, J.A. Predicting housing value: Genetic algorithm attribute selection and dependence modelling utilising the Gamma test. In Applications of Artificial Intelligence in Finance and Economics; Binner, J.M., Kendall, G., Chen, S.-H., Eds.; Advances in Econometrics; Emerald Group Publishing Limited: Bingley, UK, 2004; Volume 19, pp. 243–275. [Google Scholar]
- Li, R.; Hu, J. Prediction of housing price along the urban rail transit line based on GA-BP model and accessibility. In Proceedings of the 2020 IEEE 5th International Conference on Intelligent Transportation Engineering (ICITE), Beijing, China, 11–13 September 2020; pp. 487–492. [Google Scholar]
- Li, D.; Xu, W.; Chen, R. Real estate price forecast using rough sets and wavelet neural netwoks. Manag. Rev. 2009, 21, 18–22. [Google Scholar]
- Chen, J.-H.; Ong, C.F.; Zheng, L.; Hsu, S.-C. Forecasting spatial dynamics of the housing market using Support Vector Machine. Int. J. Strateg. Prop. Manag. 2017, 21, 273–283. [Google Scholar] [CrossRef]
- Xie, X.; Hu, G. A Comparison of Shanghai Housing Price Index Forecasting. In Proceedings of the Third International Conference on Natural Computation (ICNC 2007), Haikou, China, 24–27 August 2007; pp. 221–225. [Google Scholar]
- Shen, R.; Cao, C.; Fan, C. Support vector machine model based on principal component analysis for the Shanghai real estate price of prediction. Math. Pract. Theory 2013, 43, 11–16. [Google Scholar] [CrossRef]
- Xu, L. Research on Real Estate Price Batch Evaluation Based on Deep Neural Network. Master’s Thesis, Jiangxi University of Finance and Economics, Nanchang, China, 2020. [Google Scholar]
- Zhao, Y.; Chetty, G.; Tran, D. Deep learning with XGBoost for real estate appraisal. In Proceedings of the 2019 IEEE Symposium Series on Computational Intelligence (SSCI), Xiamen, China, 6–9 December 2019; pp. 1396–1401. [Google Scholar]
- Ma, C.; Liu, Z.; Cao, Z.; Song, W.; Zhang, J.; Zeng, W. Cost-sensitive deep forest for price prediction. Pattern Recogn. 2020, 107, 107499. [Google Scholar] [CrossRef]
- Antipov, E.A.; Pokryshevskaya, E.B. Mass appraisal of residential apartments: An application of Random forest for valuation and a CART-based approach for model diagnostics. Expert Syst. Appl. 2012, 39, 1772–1778. [Google Scholar] [CrossRef] [Green Version]
- Masías, V.; Valle, M.; Crespo, F.; Crespo, R.; Vargas, A.; Laengle, S. Property valuation using machine learning algorithms: A study in a Metropolitan-Area of Chile. In Proceedings of the AMSE Conference, Santiago, Chile, 20–21 January 2016; p. 97. [Google Scholar]
- Neloy, A.A.; Haque, H.M.S.; Islam, M.M.U. Ensemble learning based rental apartment price prediction model by categorical features factoring. In Proceedings of the 2019 11th International Conference on Machine Learning and Computing, Zhuhai, China, 22–24 February 2019; pp. 350–356. [Google Scholar]
- Xue, C.; Ju, Y.; Li, S.; Zhou, Q.; Liu, Q. Research on accurate house price analysis by using GIS technology and transport accessibility: A case study of Xi’an, China. Symmetry 2020, 12, 1329. [Google Scholar] [CrossRef]
- Yun, L. Research and Development of Batch Valuation System Based on Hedonic Model. Master’s Thesis, China University of Geosciences, Beijing, China, 2017. [Google Scholar]
- Chen, X. Design and Construction of Real Estate Appraisal Platform Based on Cloud Computing. Master’s Thesis, Huaqiao University, Xiamen, China, 2013. [Google Scholar]
- Garcia-Gonzalez, H.; Fernandez-Alvarez, D.; Emilio Labra-Gayo, J.; Ordonez de Pablos, P. Applying big data and stream processing to the real estate domain. Behav. Inf. Technol. 2019, 38, 950–958. [Google Scholar] [CrossRef]
- Hagerty, J.R. How Good Are Zillow’s Estimates? Wall Str. J. 2007. Available online: https://www.wsj.com/articles/SB117142055516708035 (accessed on 11 February 2022).
- Hollas, D.R.; Rutherford, R.C.; Thomson, T.A. Zillow’s estimates of single-family housing values. Apprais. J. 2010, 78, 26–32. [Google Scholar]
- Tapsuwan, S.; Ingram, G.; Burton, M.; Brennan, D. Capitalized amenity value of urban wetlands: A hedonic property price approach to urban wetlands in Perth, Western Australia. Aust. J. Agric. Resour. Econ. 2009, 53, 527–545. [Google Scholar] [CrossRef] [Green Version]
- Nilsson, P. Natural amenities in urban space—A geographically weighted regression approach. Landsc. Urban Plan. 2014, 121, 45–54. [Google Scholar] [CrossRef]
- Kim, S.G.; Cho, S.-H.; Lambert, D.M.; Roberts, R.K. Measuring the value of air quality: Application of the spatial hedonic model. Air Qual. Atmos. Health 2010, 3, 41–51. [Google Scholar] [CrossRef] [Green Version]
- Donovan, G.H.; Butry, D.T. The effect of urban trees on the rental price of single-family homes in Portland, Oregon. Urban For. Urban Green 2011, 10, 163–168. [Google Scholar] [CrossRef]
- Tao, P.; Qiang, H.; Xi, W.; Xiao, C.; Yaxi, L.; Ci, S.; Jie, C.; Chenghu, Z. Big geodata aggregation: Connotation, classification, and framework. Natl. Remote Sens. Bull. 2021, 25, 2153–2162. [Google Scholar] [CrossRef]
- Ba, S.; Yang, X. Zillow—Online Media Tycoon in US Real Estate Brokerage Industry. In “Internet Plus” Pathways to the Transformation of China’s Property Sector; Ba, S., Yang, X., Eds.; Springer: Singapore, 2016; pp. 67–84. [Google Scholar] [CrossRef]
- Walker, R. Neighborhood Watch: The Rise of Zillow. Kellogg Sch. Manag. Cases 2017, 1–7. [Google Scholar] [CrossRef]
- Sangani, D.; Erickson, K.; Hasan, M.A. Predicting Zillow estimation error using linear regression and gradient boosting. In Proceedings of the 2017 IEEE 14th International Conference on Mobile Ad Hoc and Sensor Systems (MASS), Orlando, FL, USA, 22–25 October 2017; pp. 530–534. [Google Scholar]
- Li, M.; Zhang, G.; Chen, Y.; Zhou, C. Evaluation of residential housing prices on the Internet: Data pitfalls. Complexity 2019, 2019, 5370961. [Google Scholar] [CrossRef] [Green Version]
- Sanjar, K.; Bekhzod, O.; Kim, J.; Paul, A.; Kim, J. Missing data imputation for geolocation-based price prediction using KNN–MCF method. ISPRS Int. J. Geoinf. 2020, 9, 227. [Google Scholar] [CrossRef] [Green Version]
- Hu, L.; He, S.; Han, Z.; Xiao, H.; Su, S.; Weng, M.; Cai, Z. Monitoring housing rental prices based on social media:An integrated approach of machine-learning algorithms and hedonic modeling to inform equitable housing policies. Land Use Policy 2019, 82, 657–673. [Google Scholar] [CrossRef]

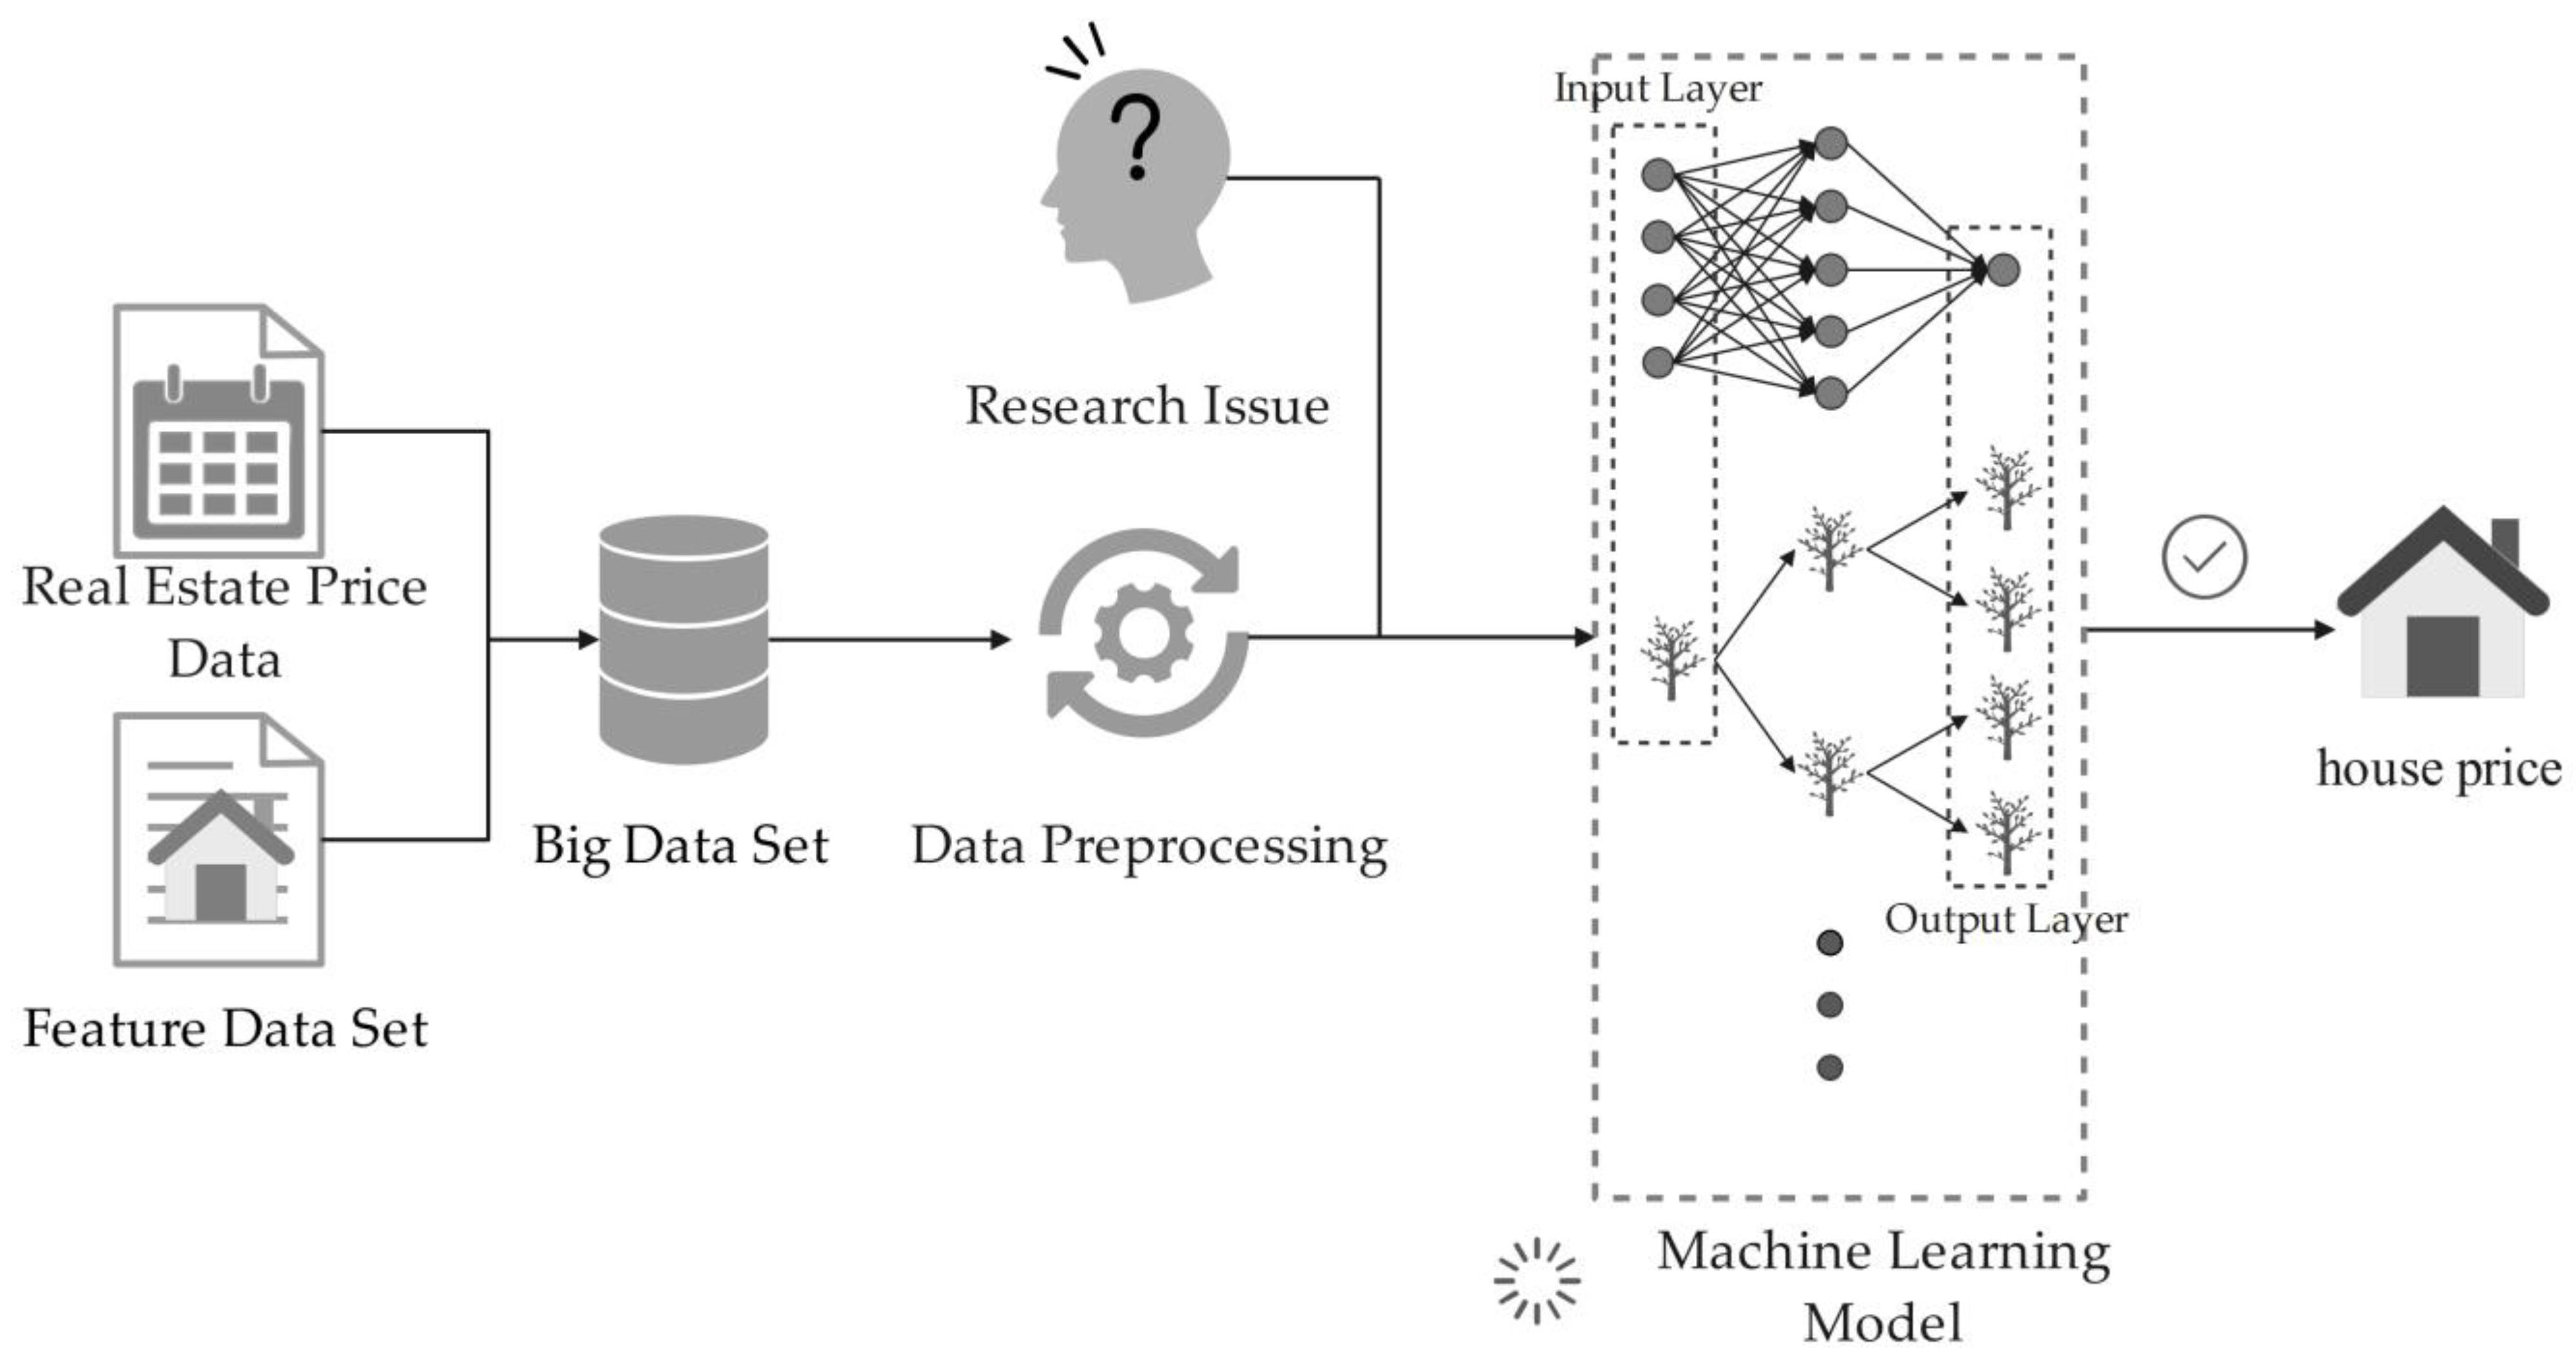
Publisher’s Note: MDPI stays neutral with regard to jurisdictional claims in published maps and institutional affiliations. |
© 2022 by the authors. Licensee MDPI, Basel, Switzerland. This article is an open access article distributed under the terms and conditions of the Creative Commons Attribution (CC BY) license (https://creativecommons.org/licenses/by/4.0/).