
Provision of Allotment Gardens and Its Influencing Factors: A Case Study of Tokyo, Japan


Abstract
1. Introduction
2. Study Area and Materials
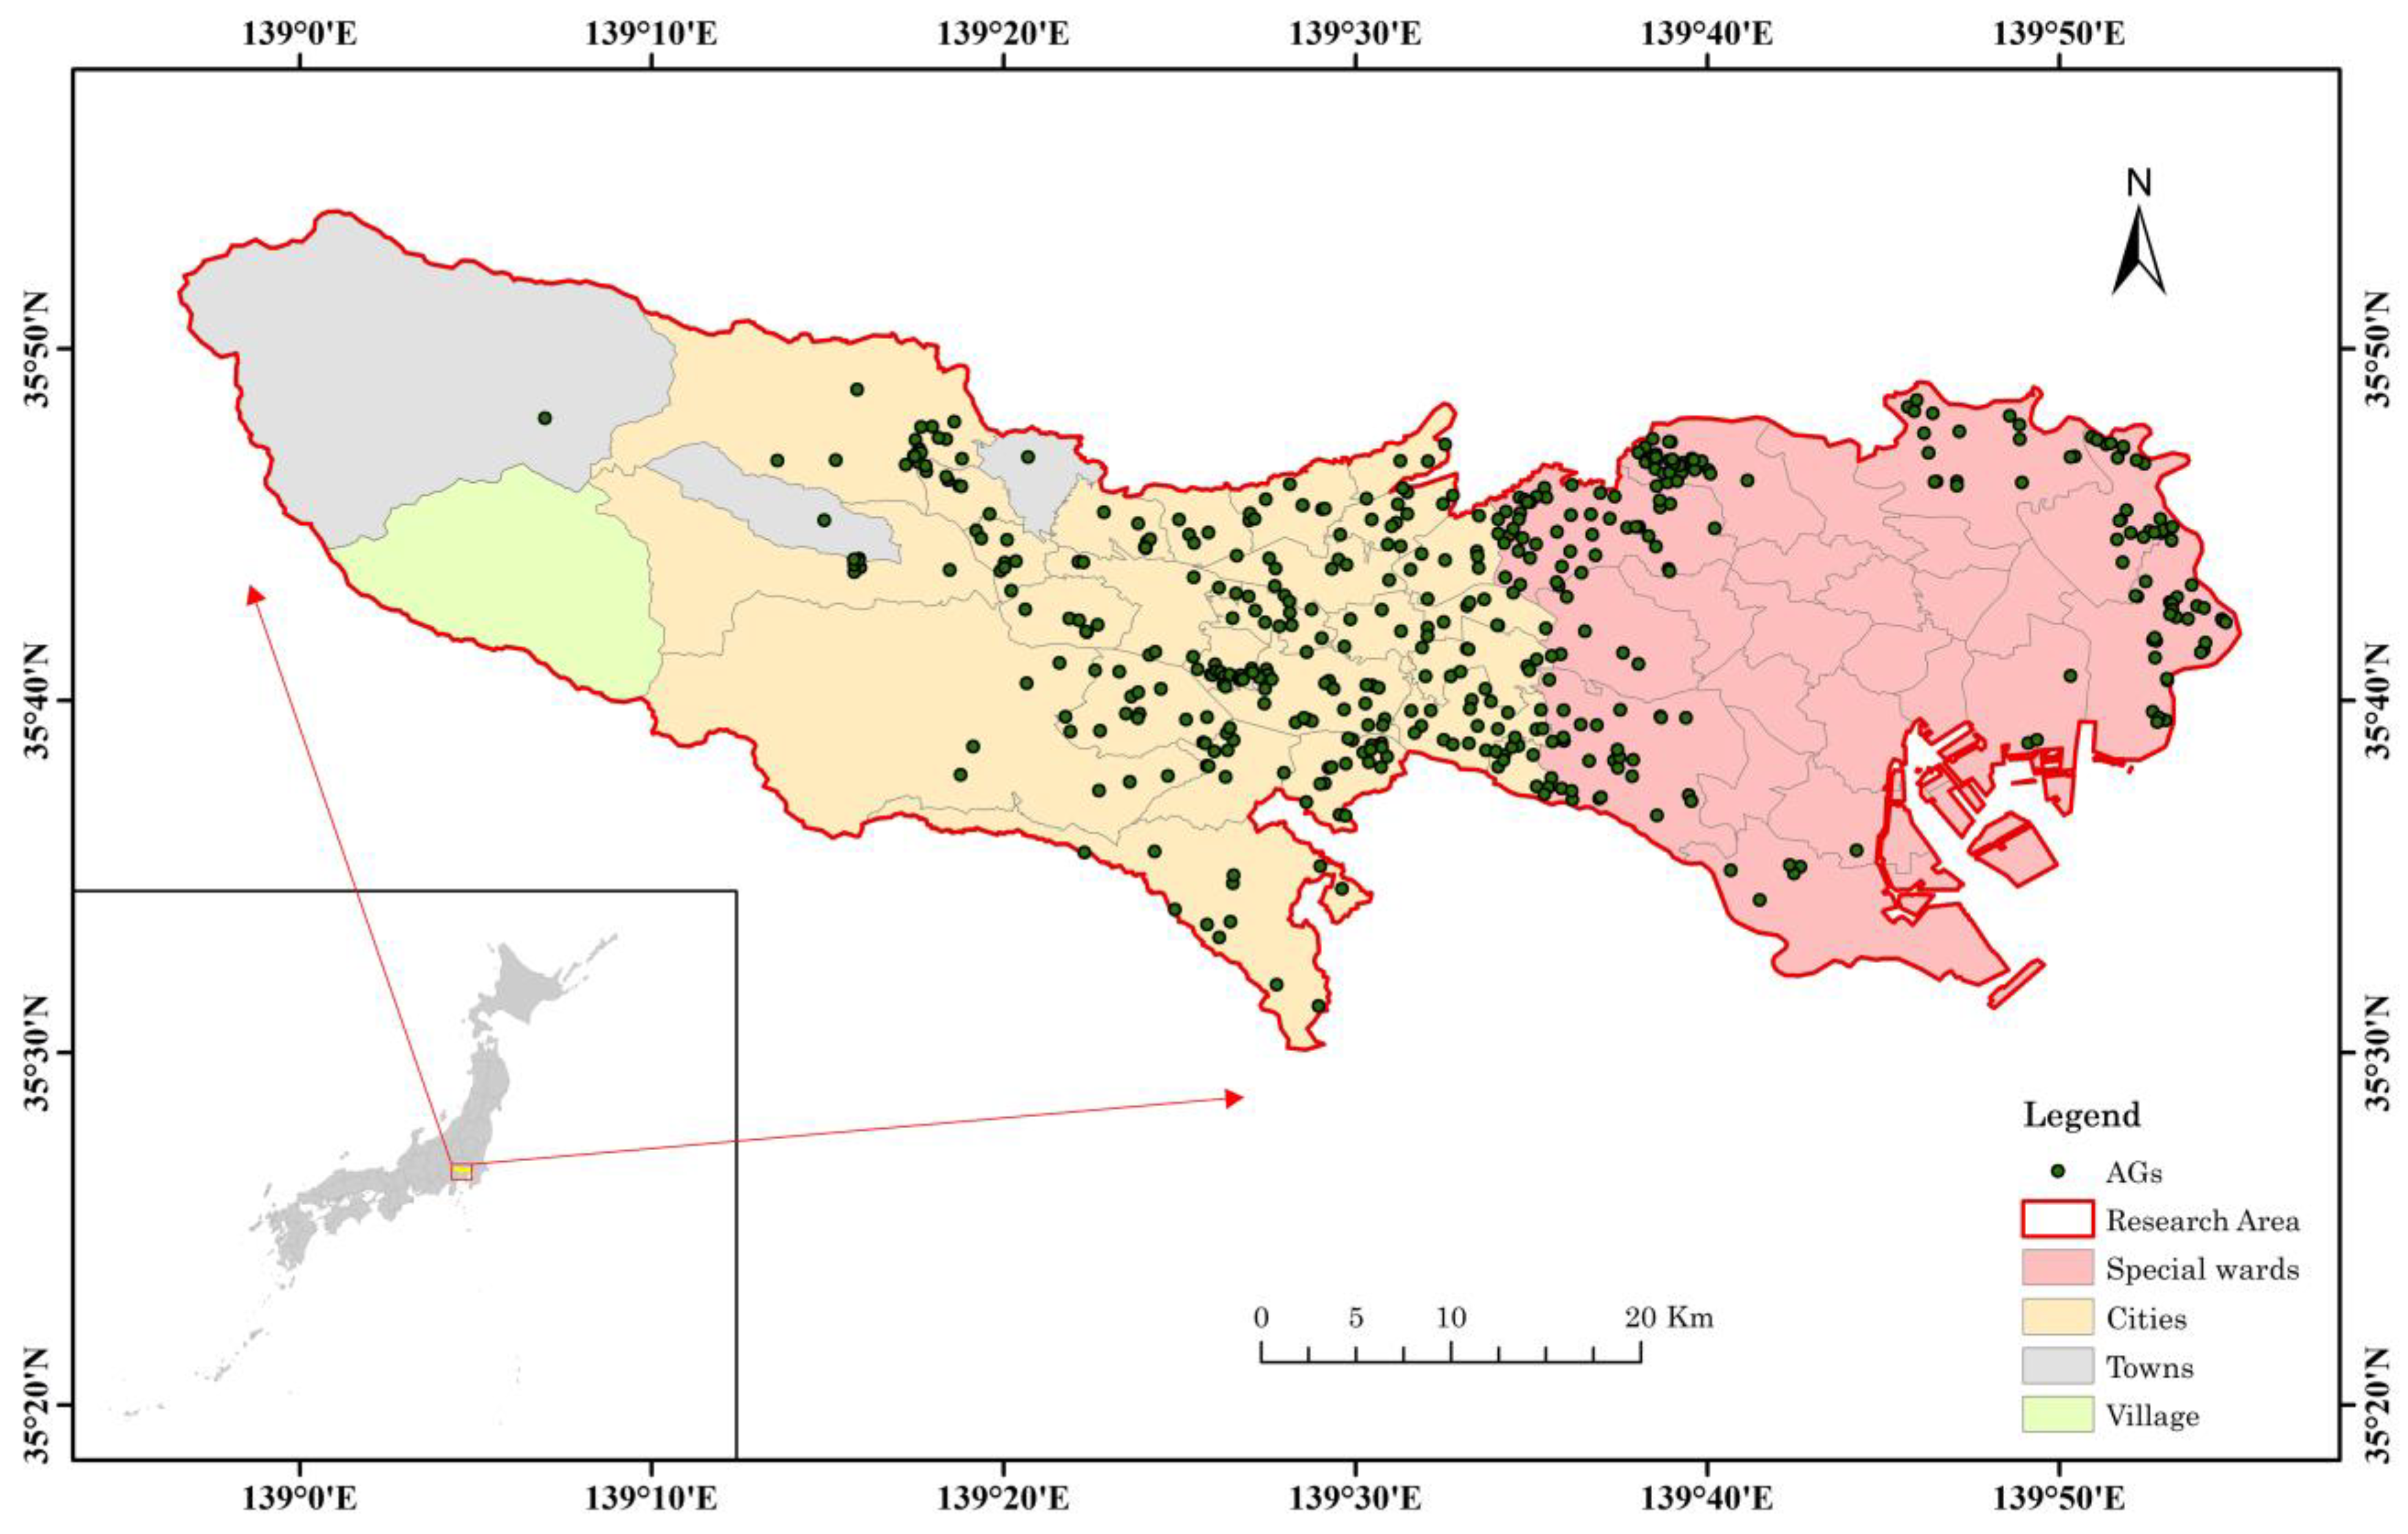
2.1. Study Area
2.1.1. Development of AGs in Japan
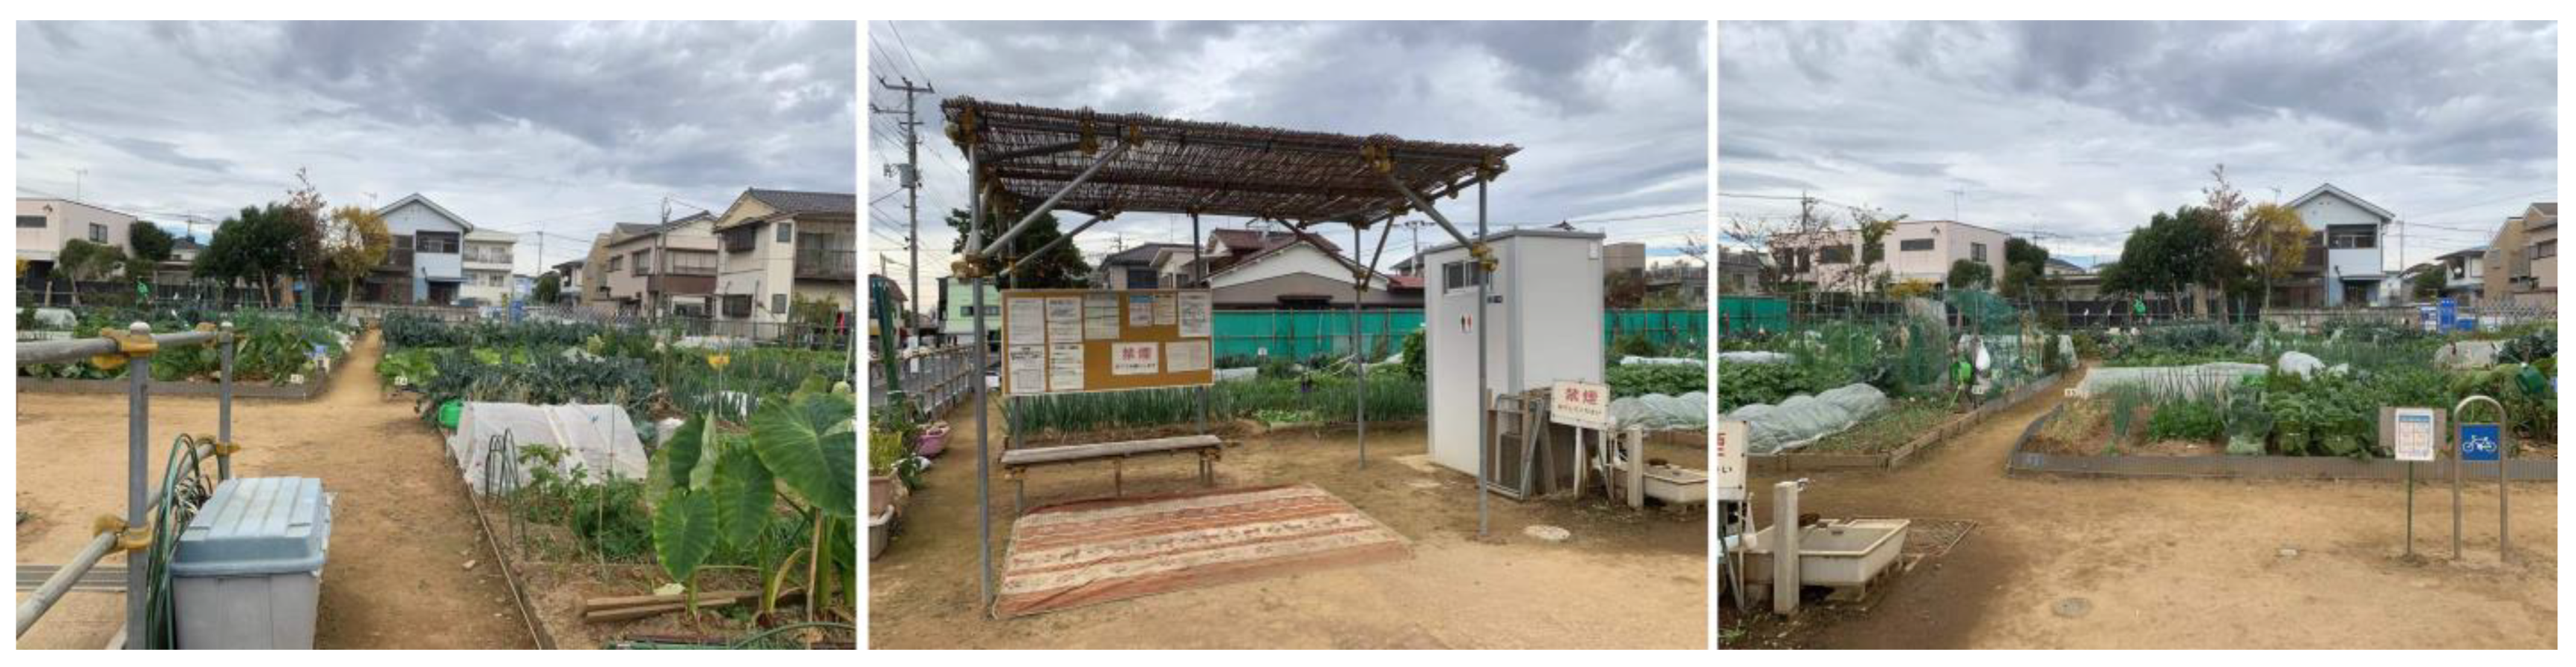
2.1.2. Overview of AGs in Tokyo, Japan
2.2. Data Source
2.2.1. AGs Data
2.2.2. Municipal Data
3. Methodology
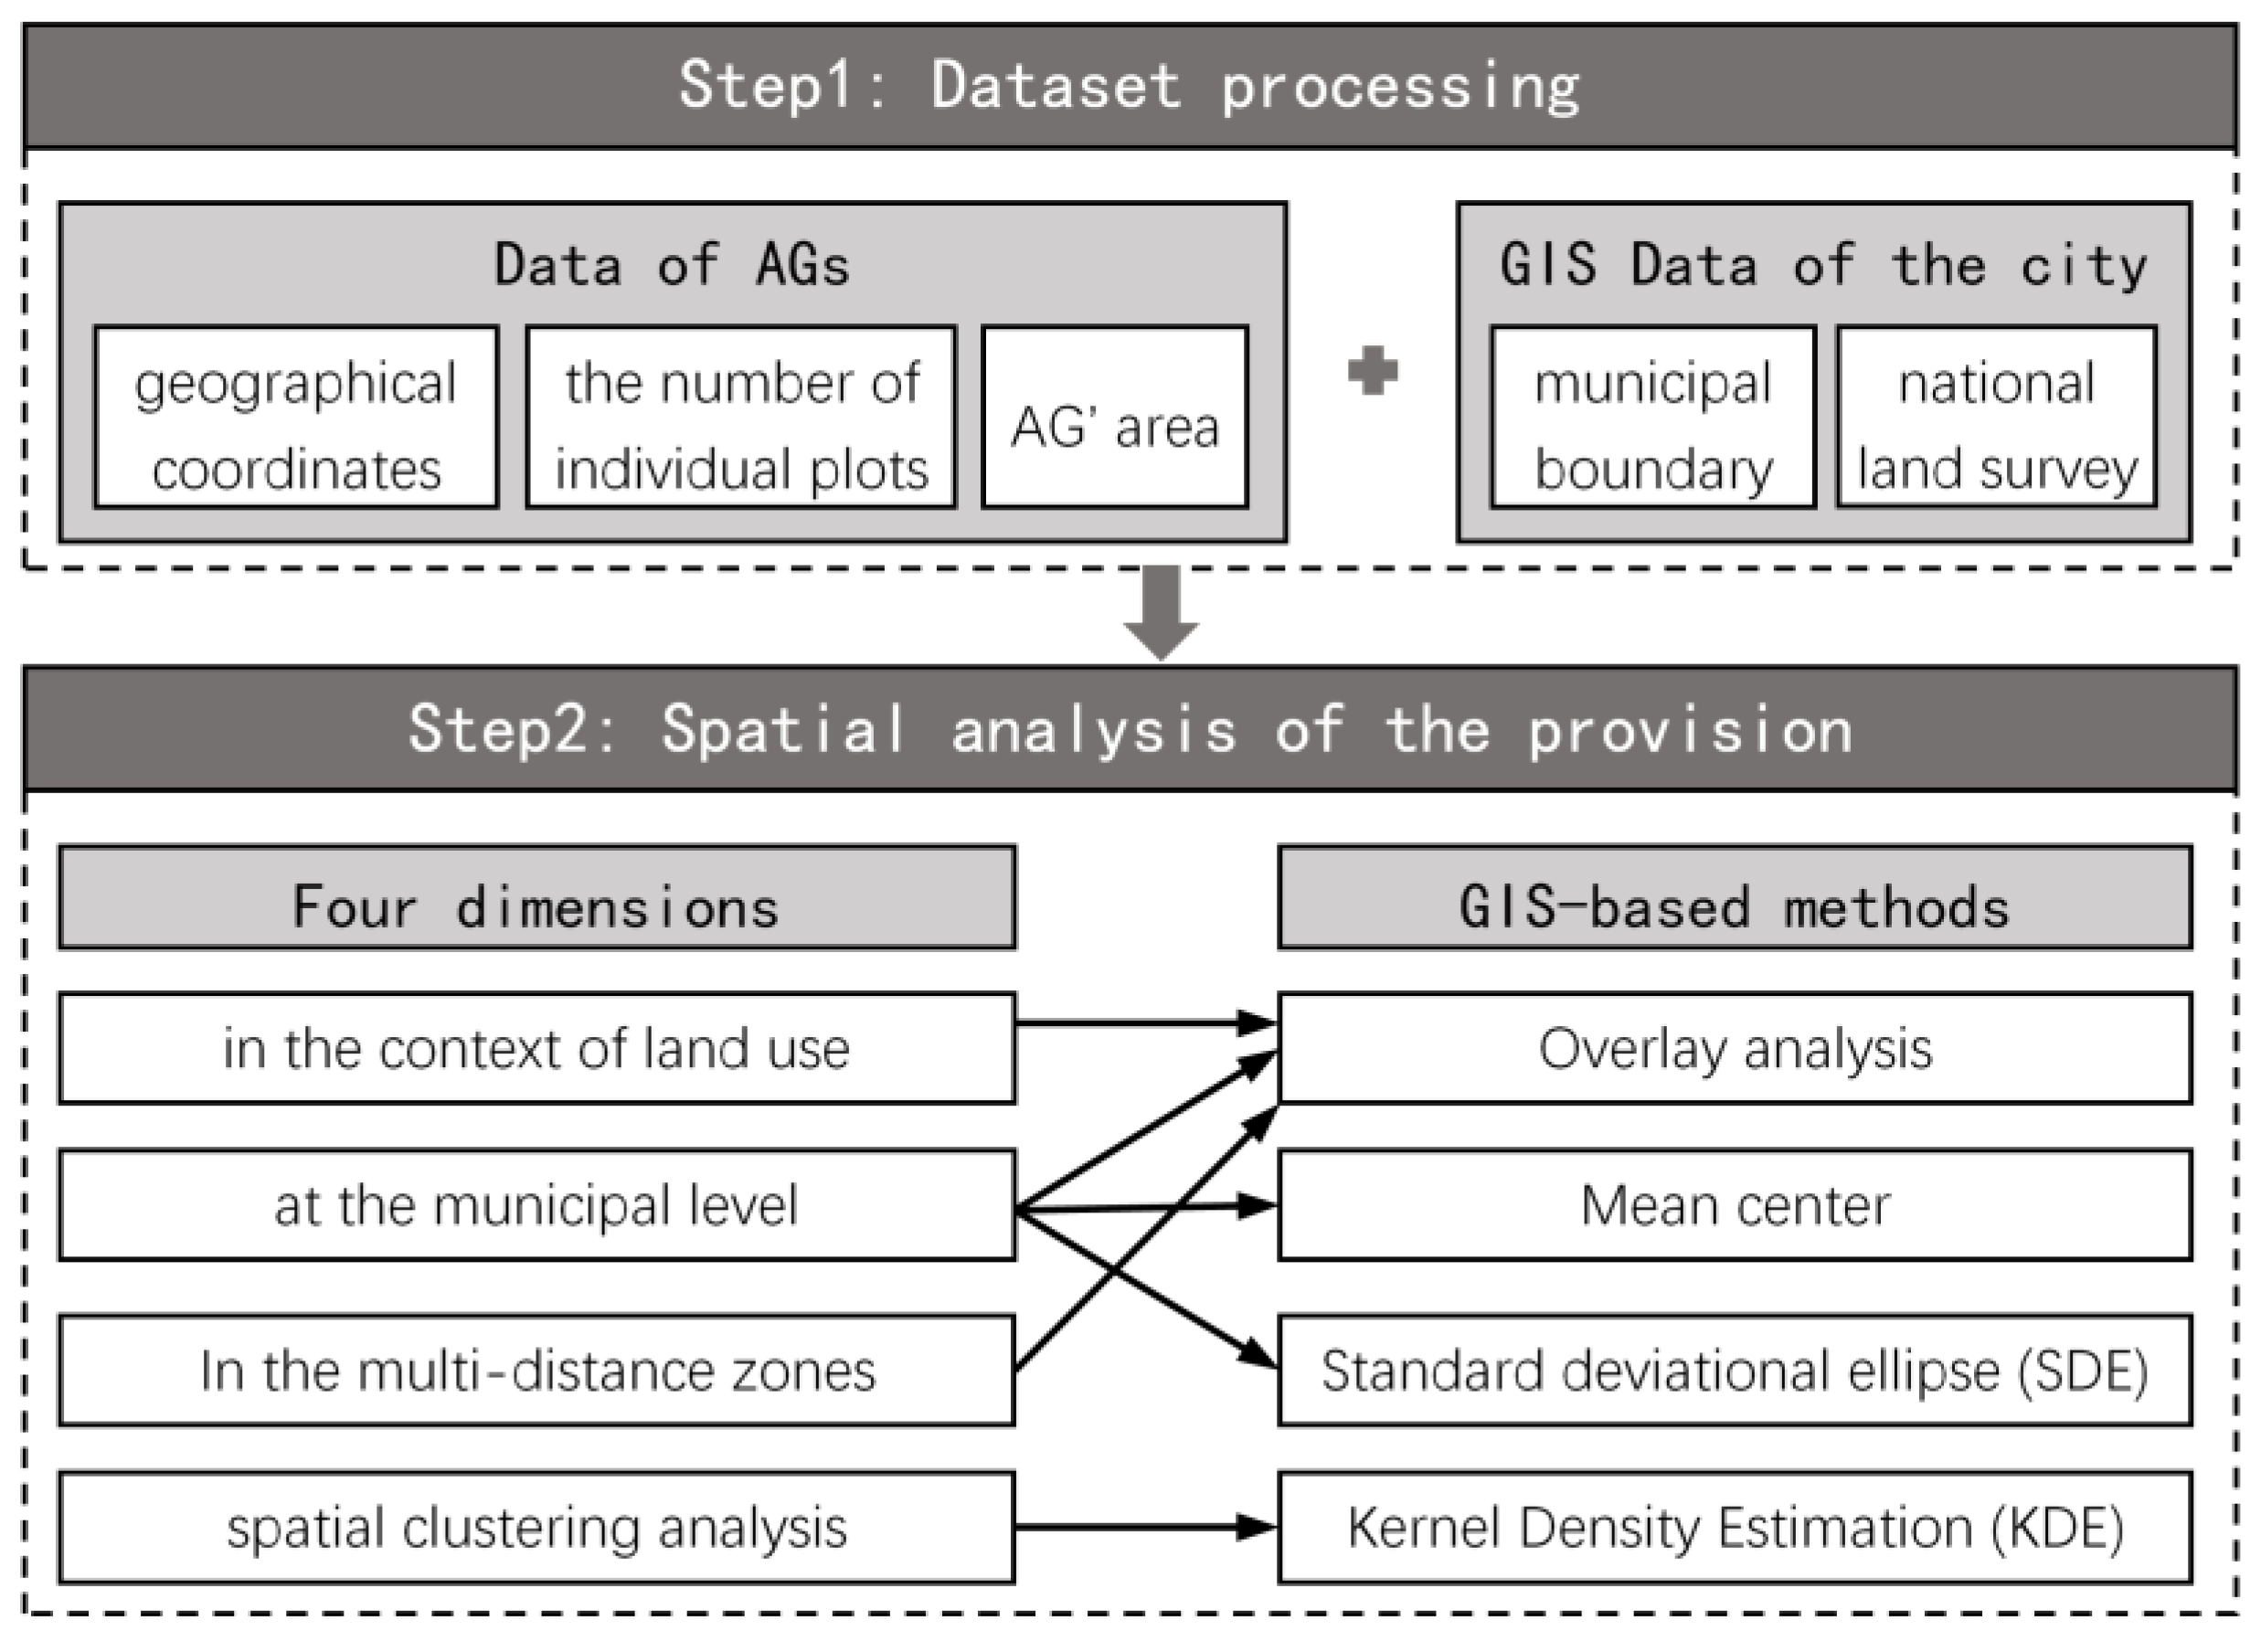
3.1. Method for Dataset Processing
3.2. GIS-Based Spatial Analysis Methods
3.2.1. Overlay Analysis
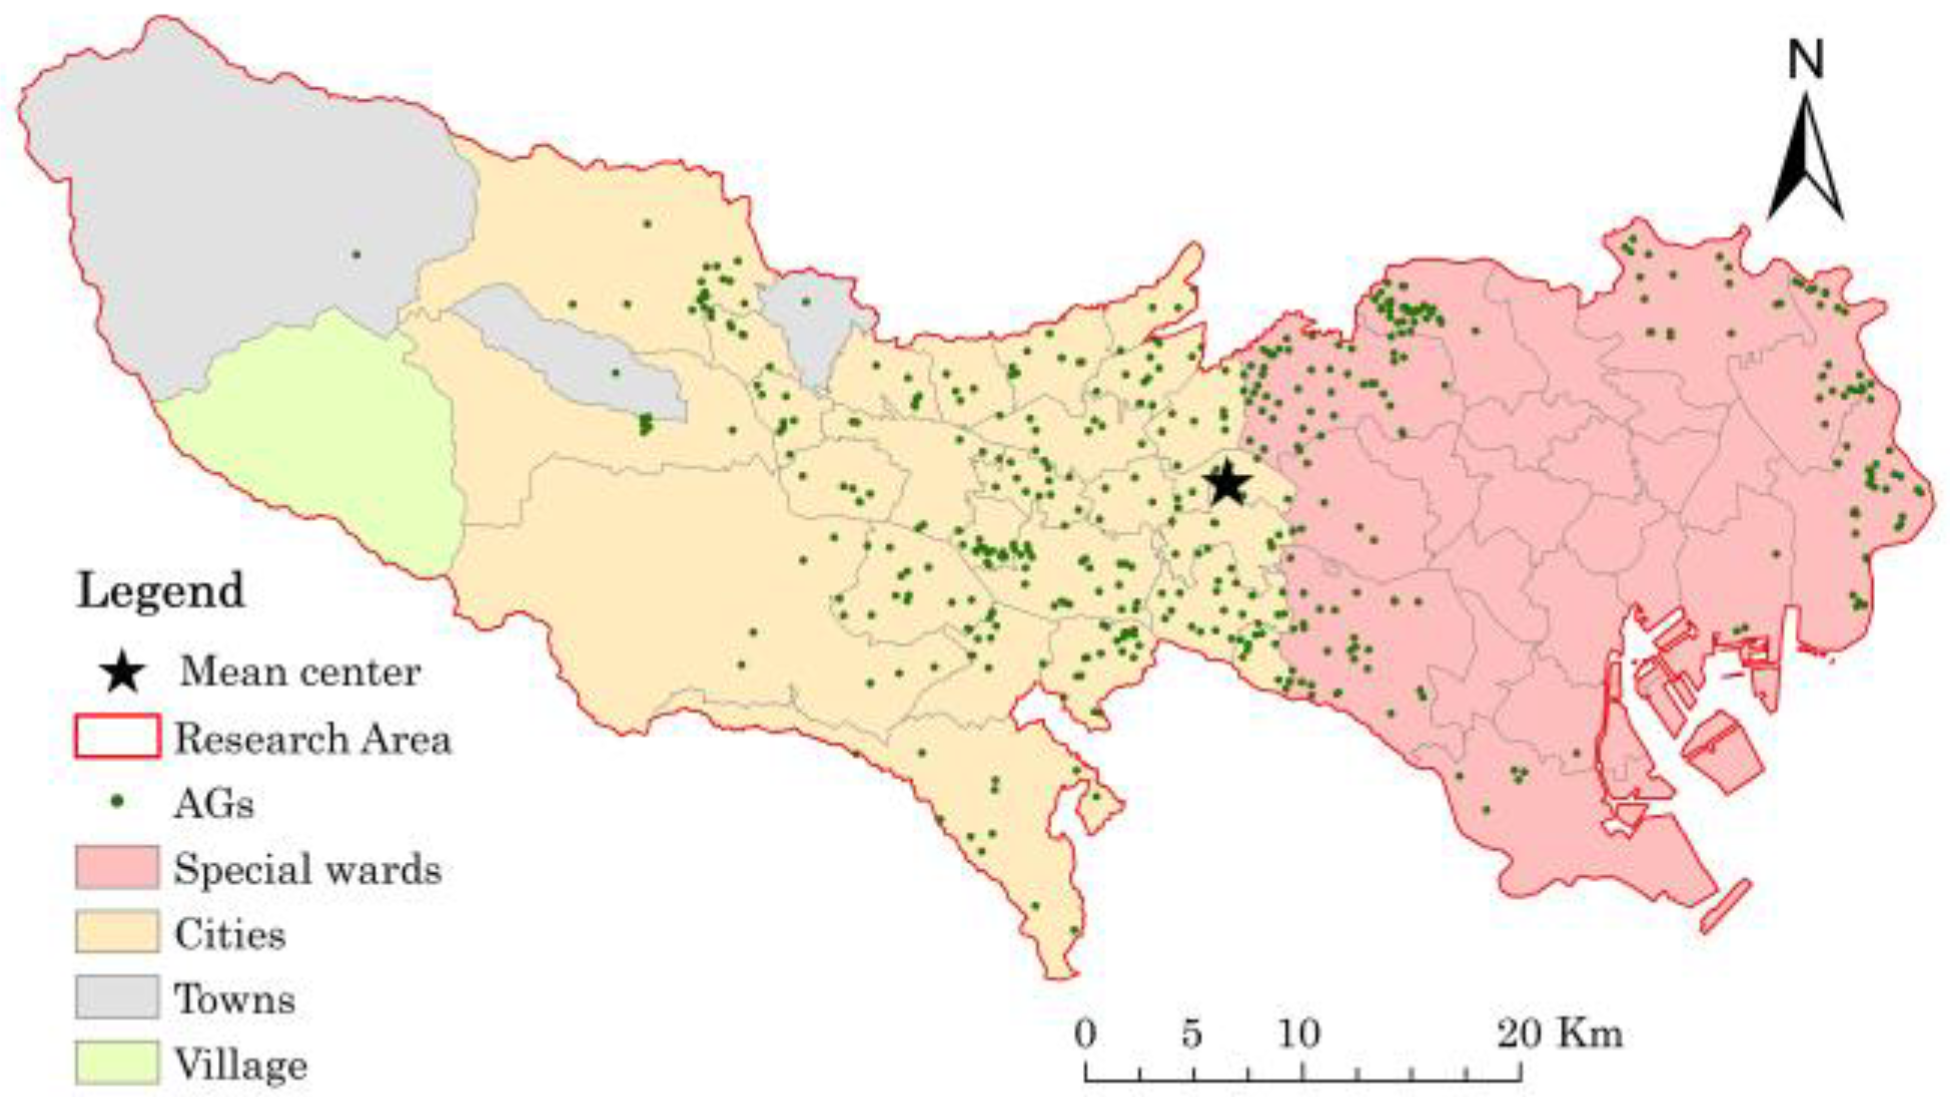
3.2.2. Mean Center
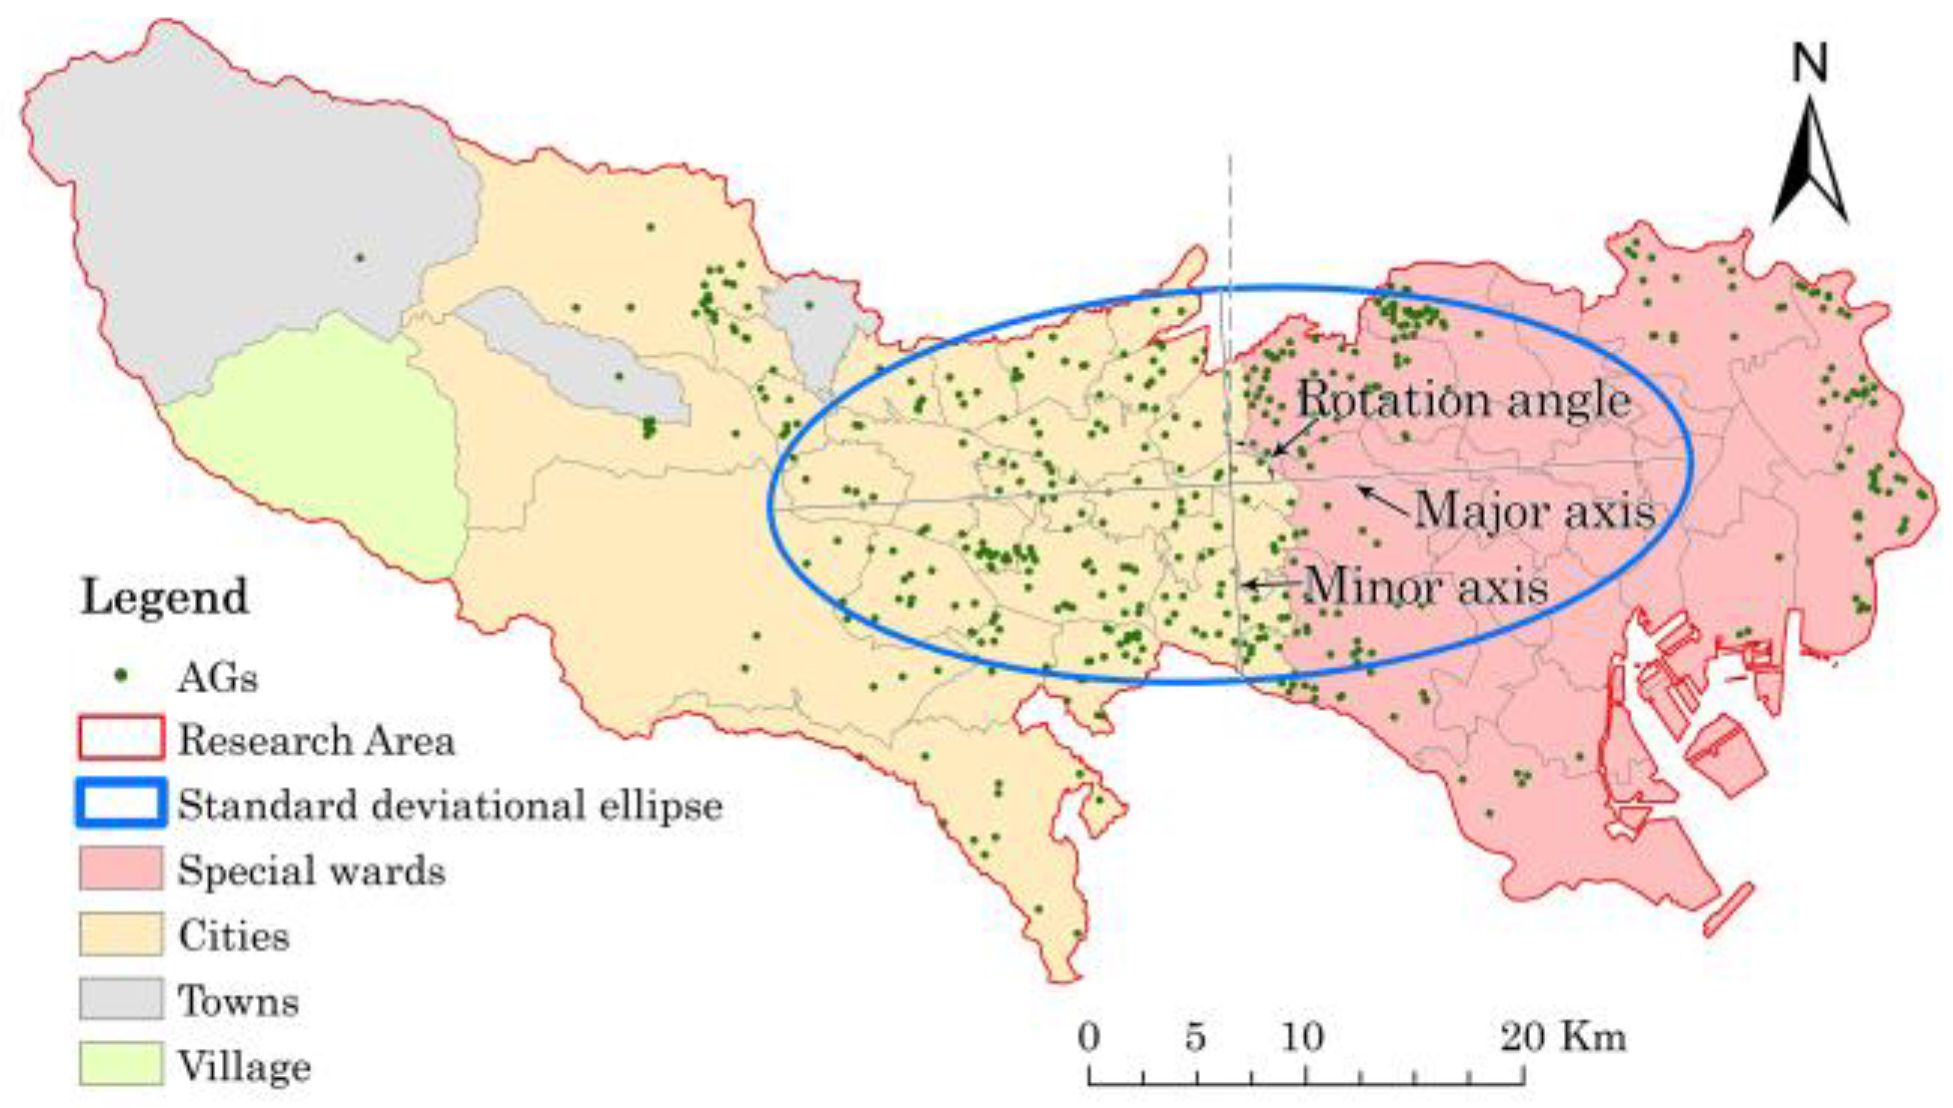
3.2.3. Standard Deviational Ellipse (SDE)
3.2.4. Kernel Density Estimation (KDE)
3.3. Regression Analysis
4. Results
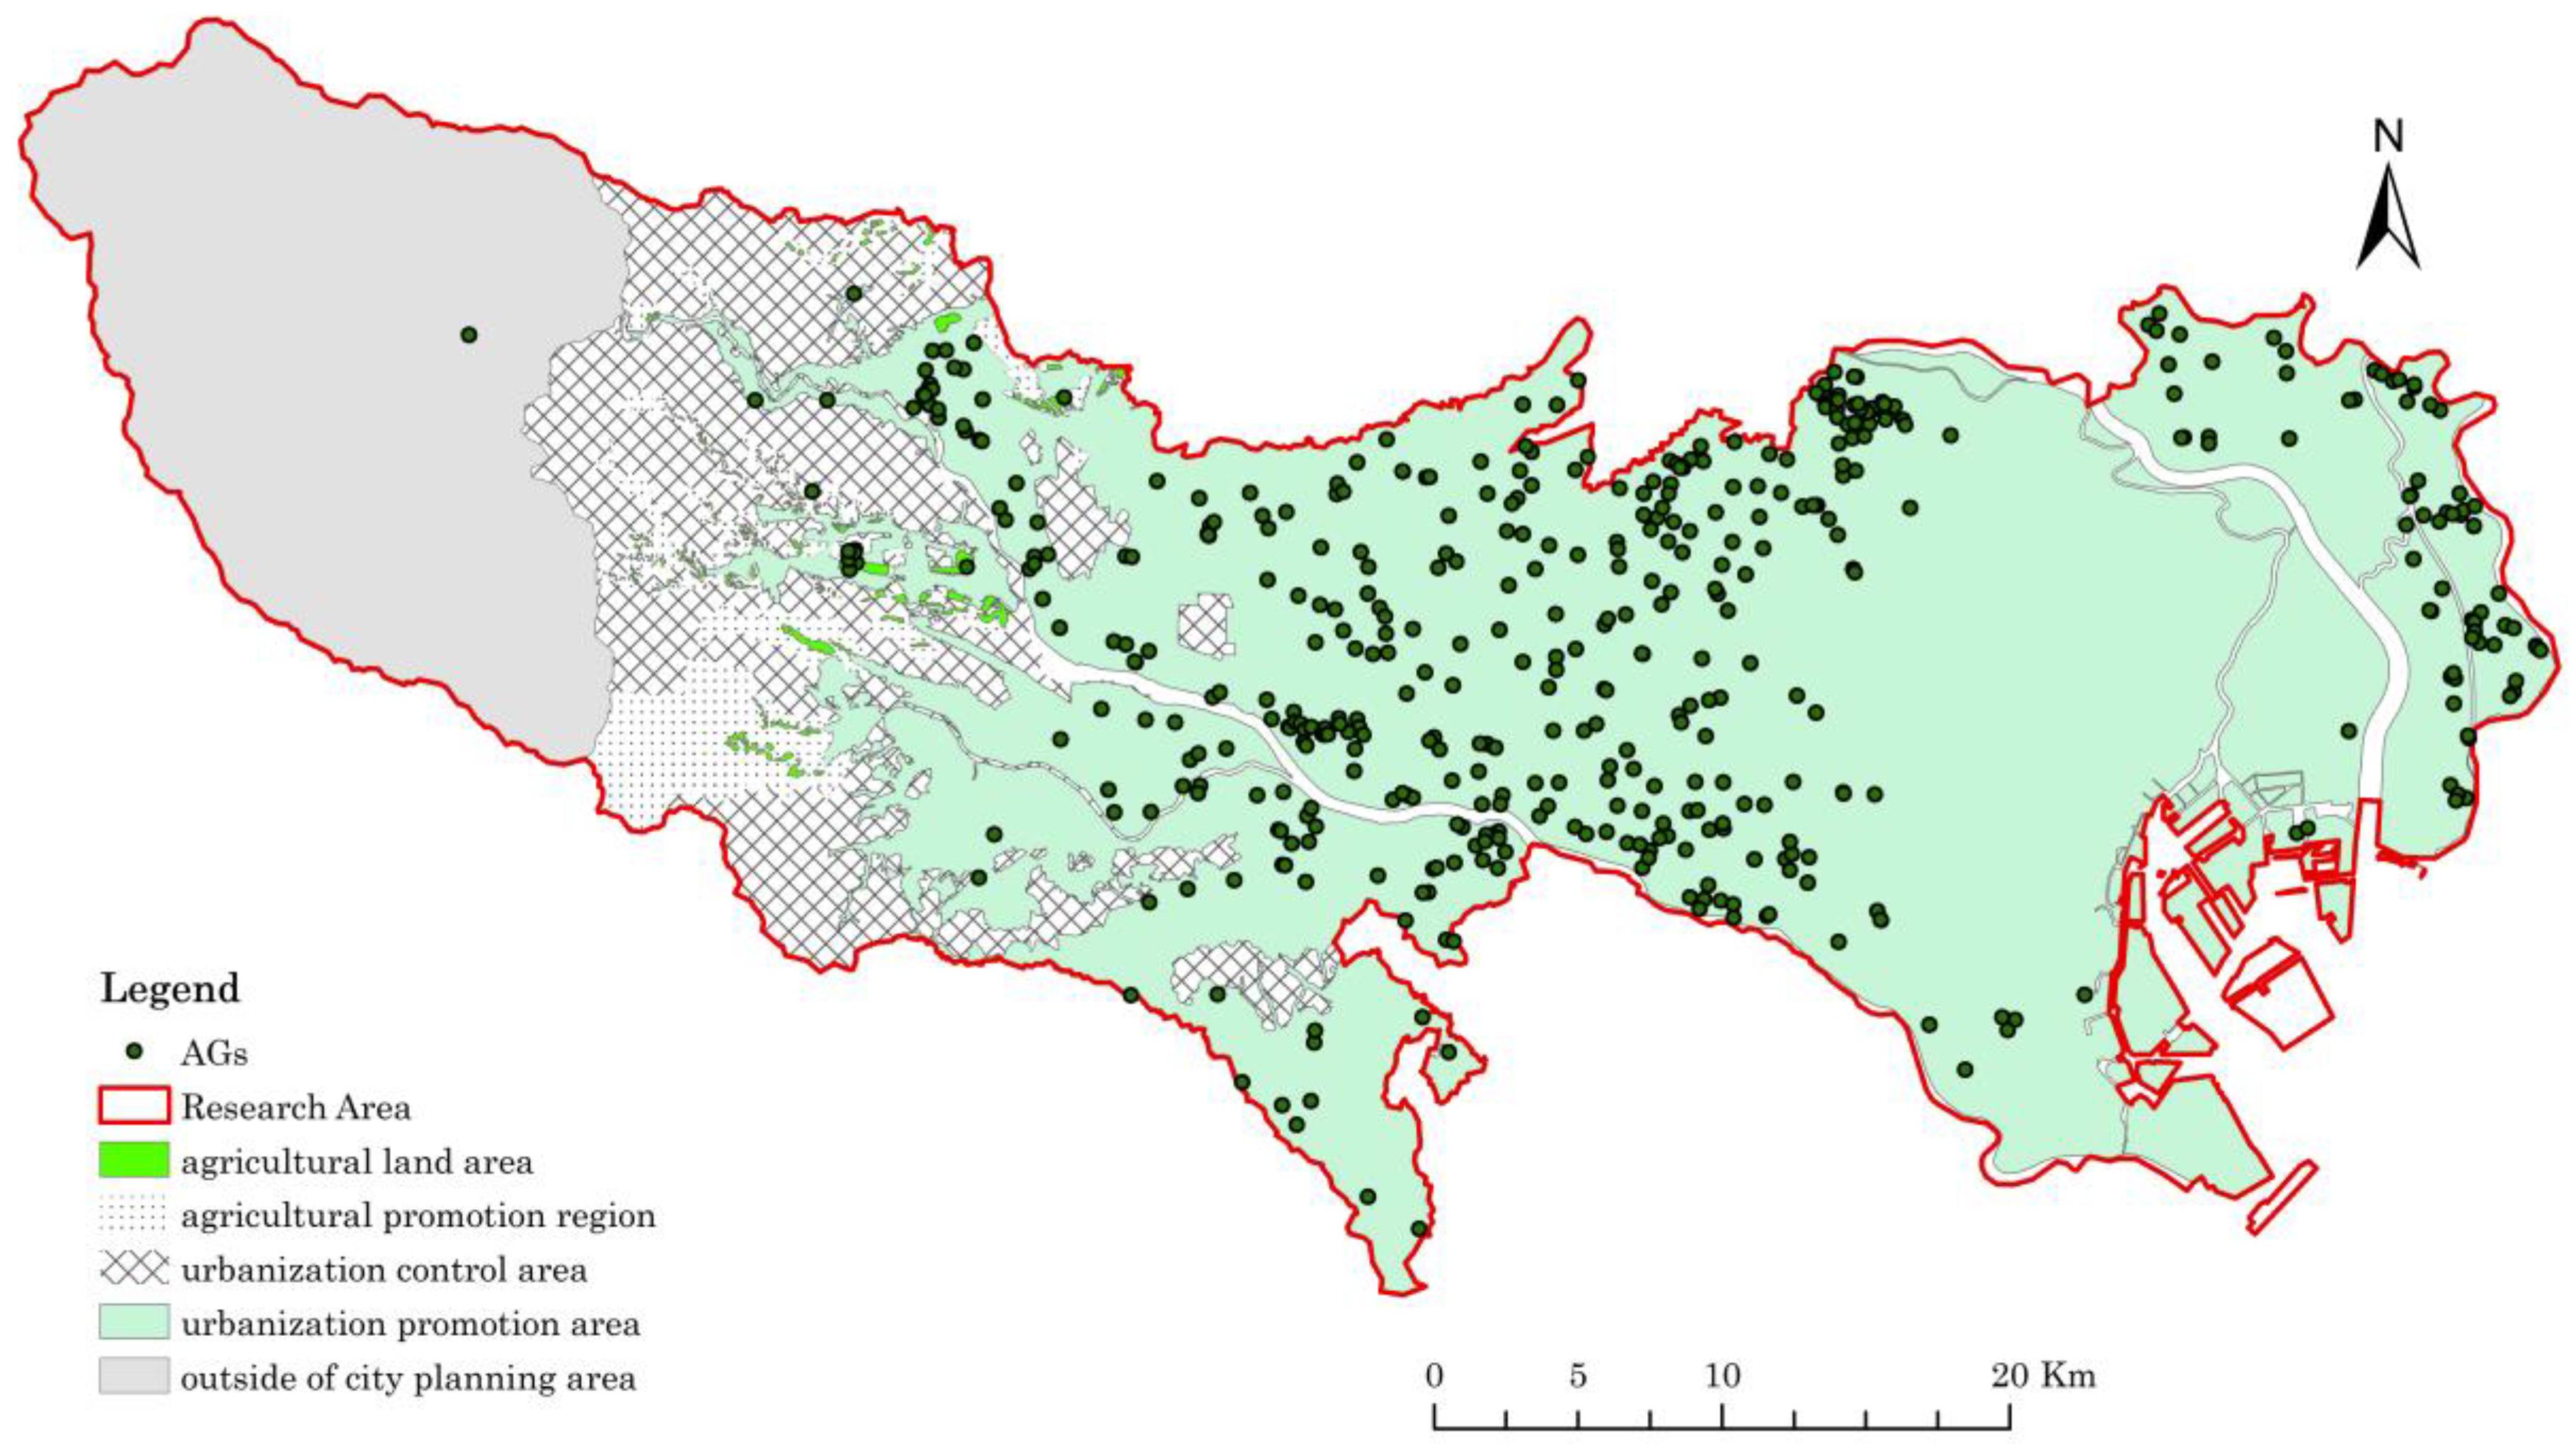
4.1. In the Context of Land Use
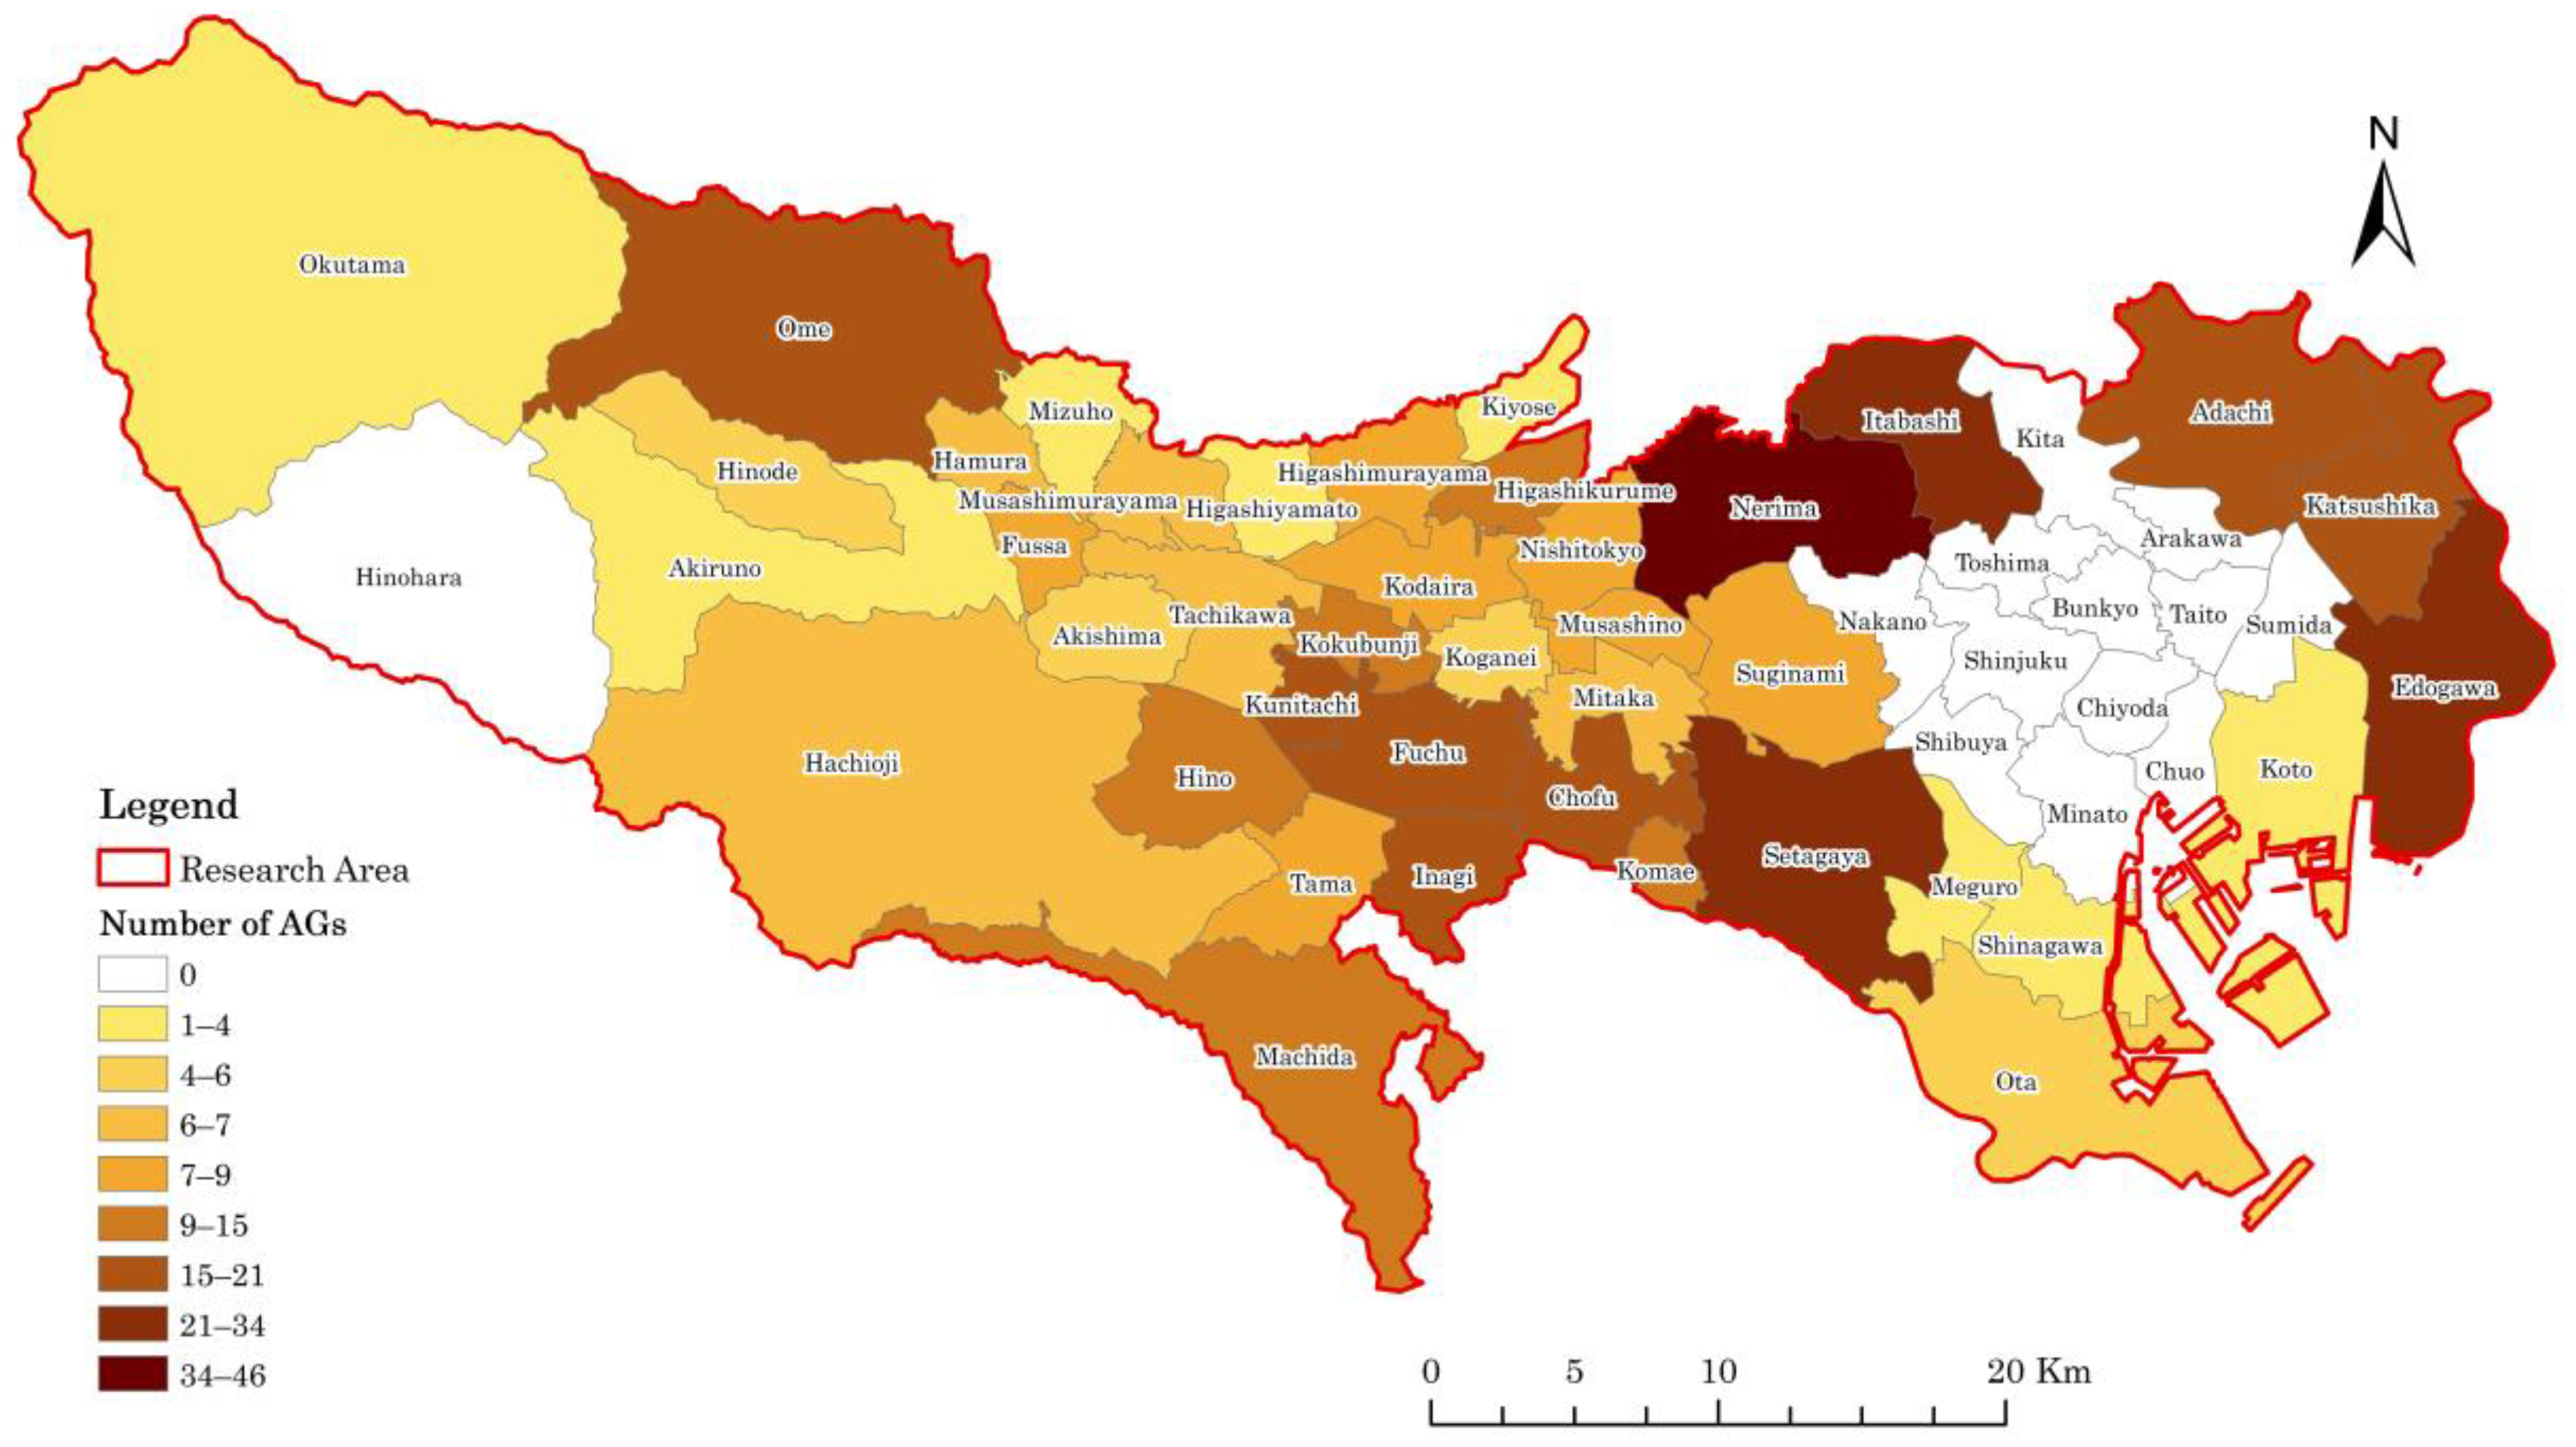
4.2. At the Municipal Level
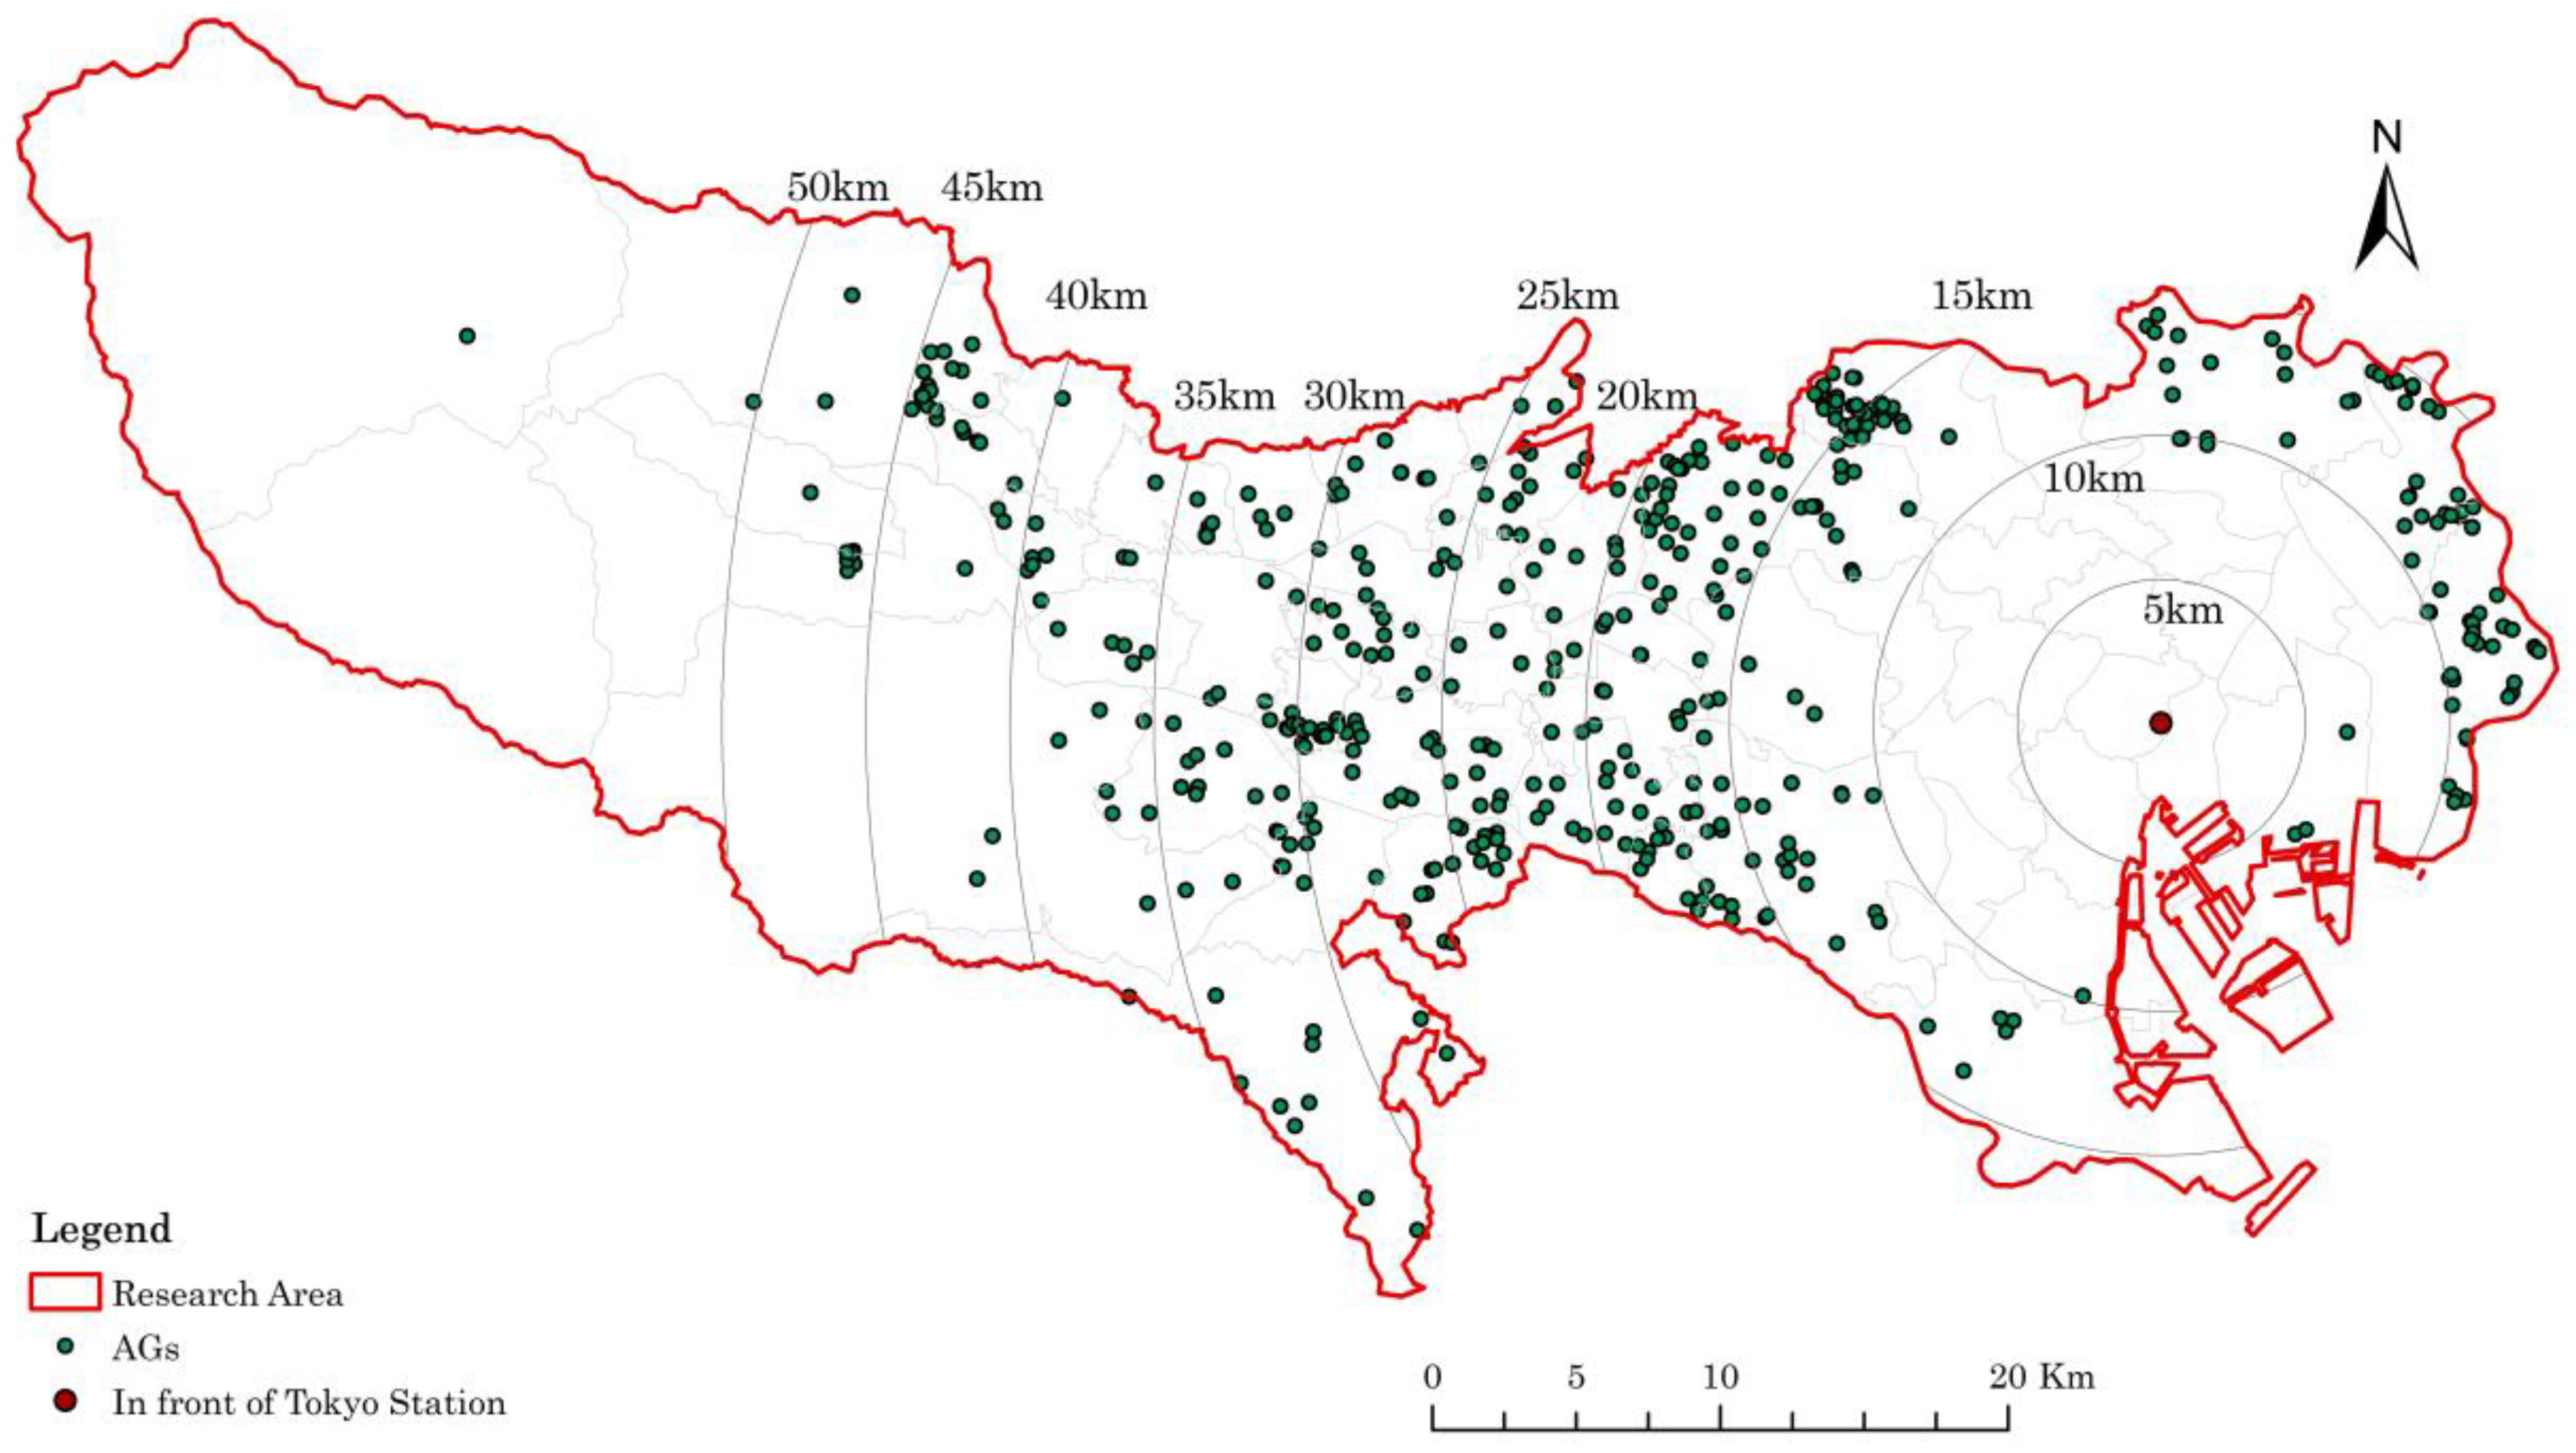
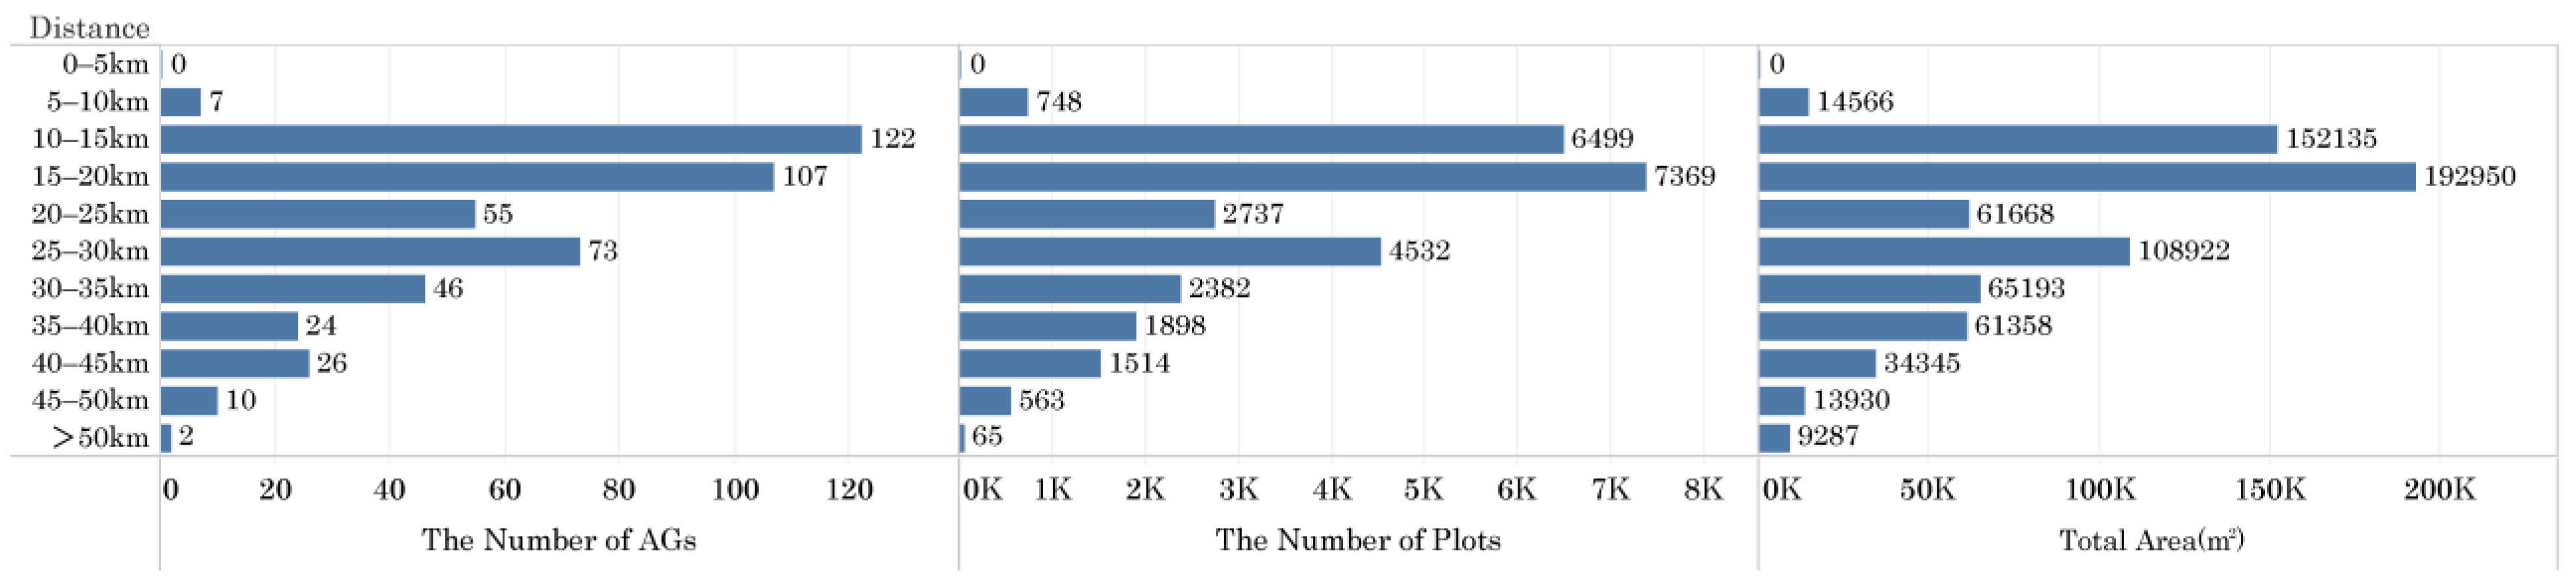
4.3. In the Multi-Distance Zones from the Center of Tokyo
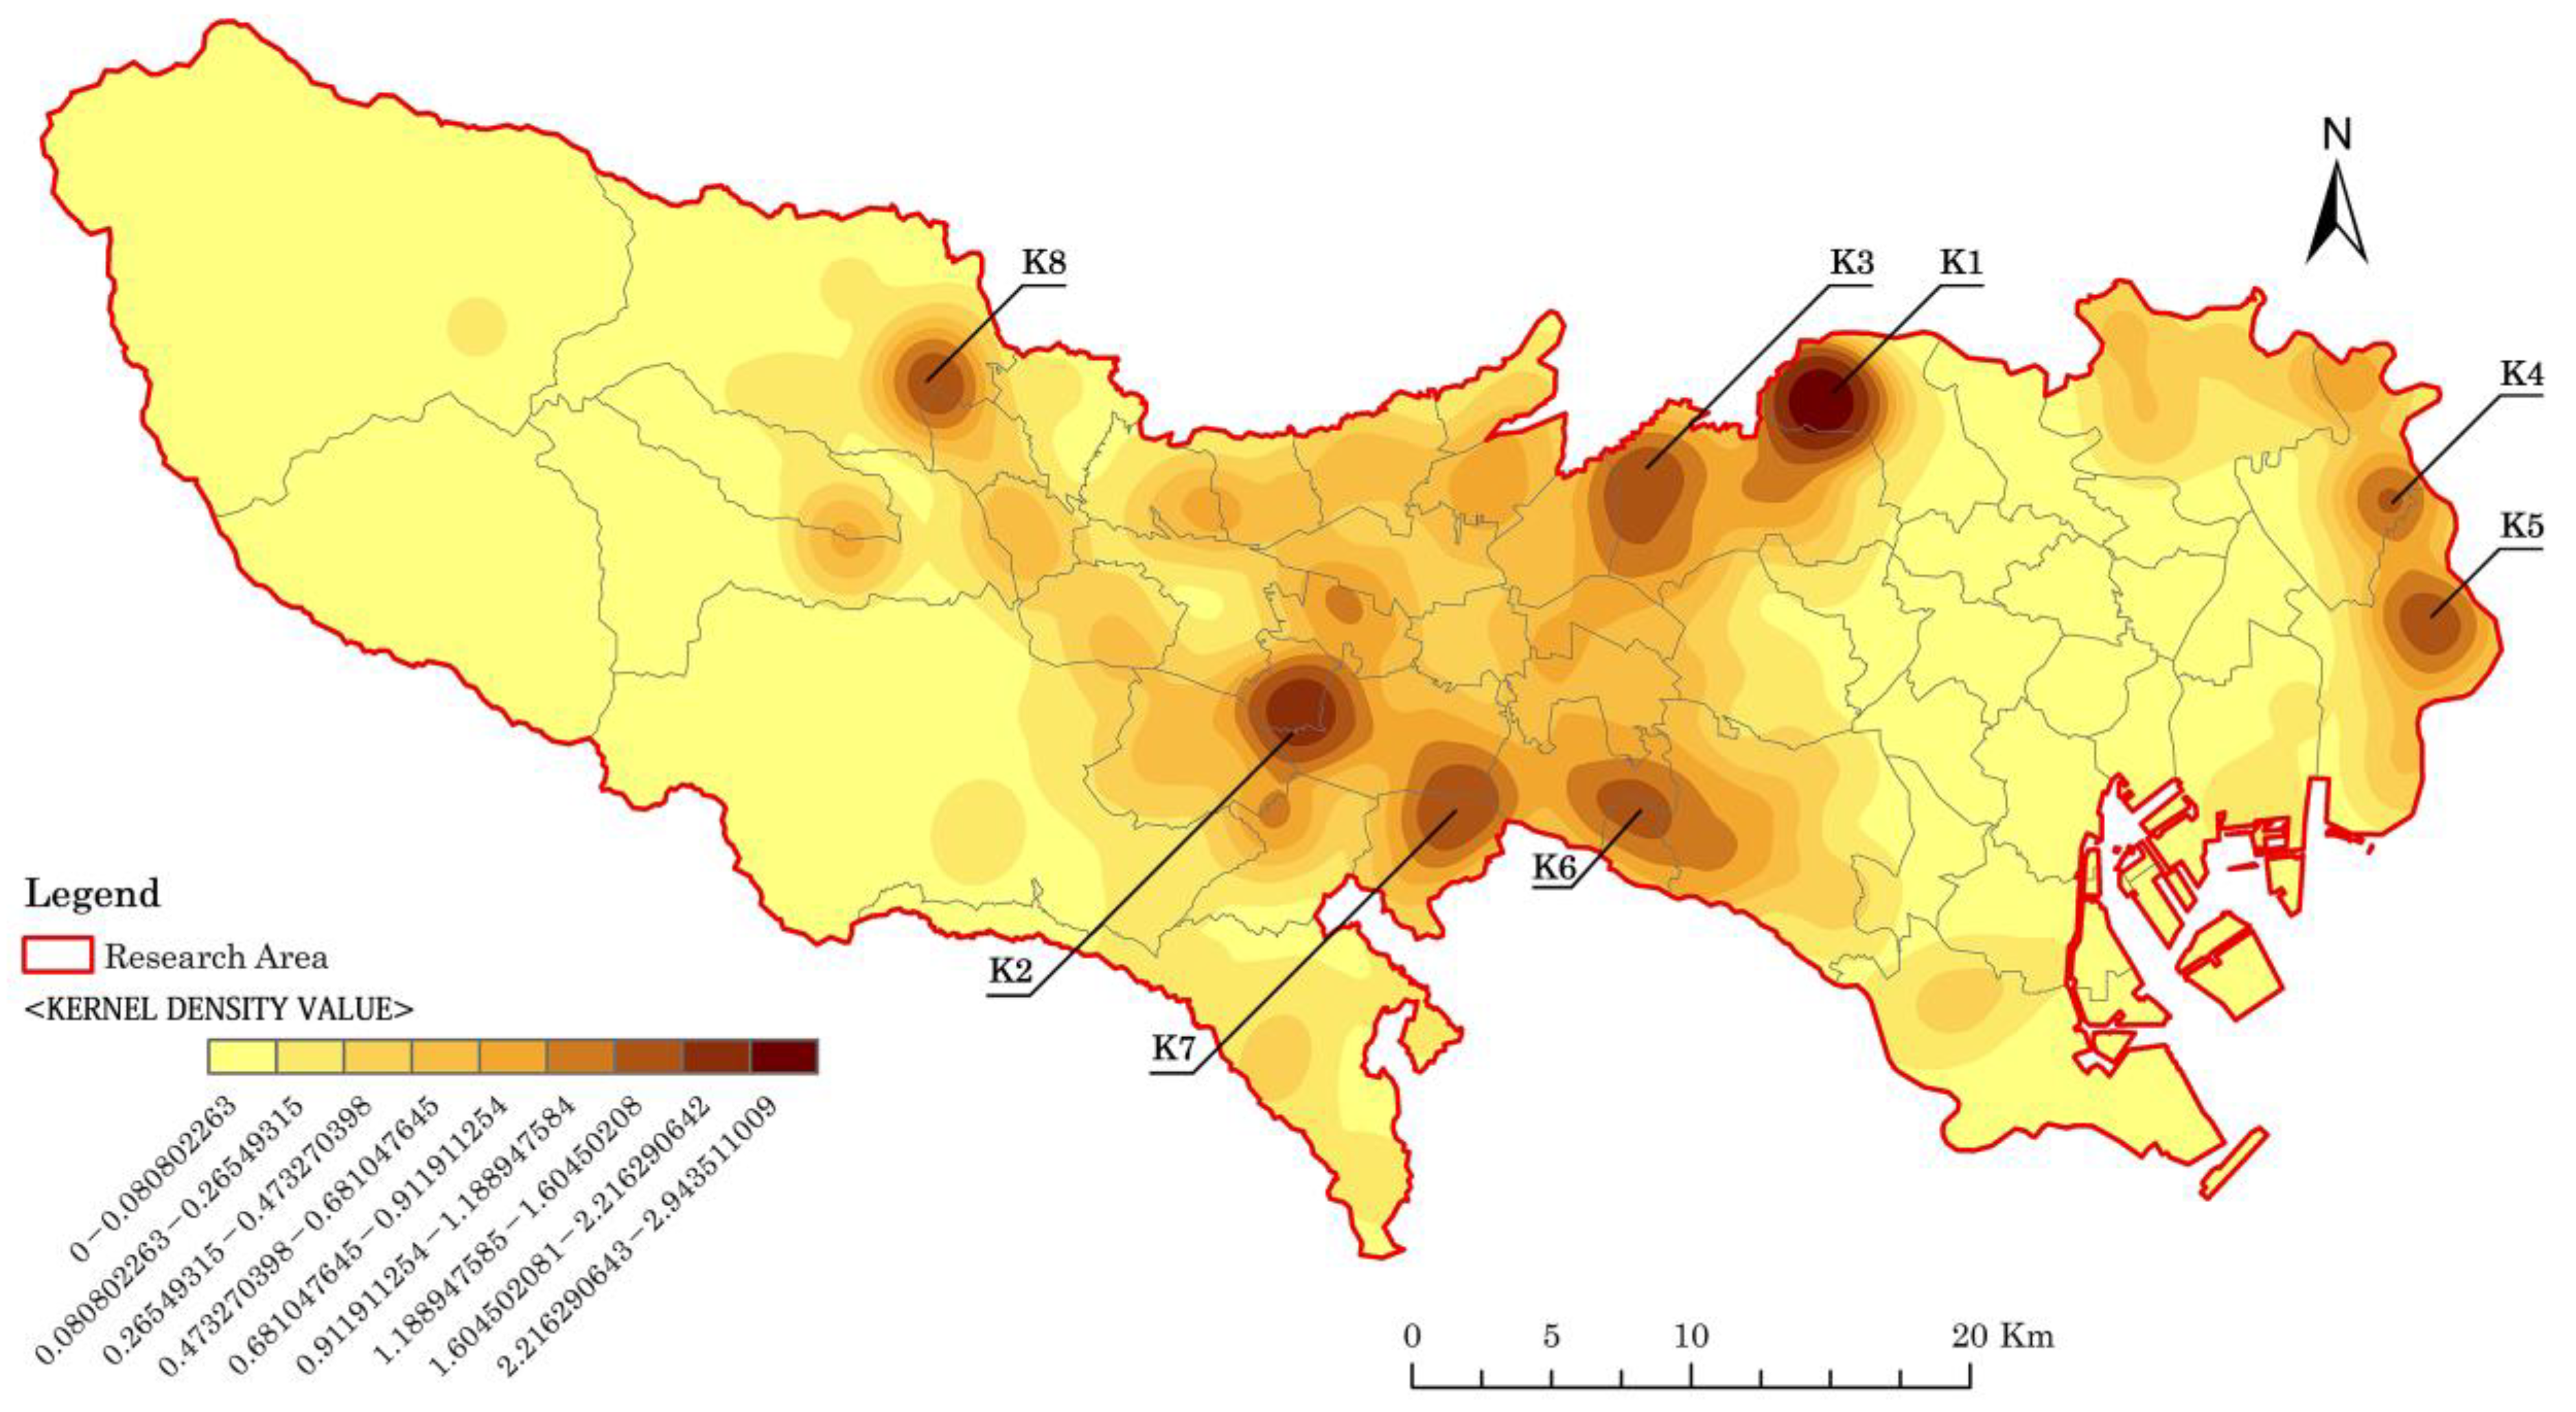
4.4. Spatial Clustering
4.5. Regression Analysis
5. Discussion
5.1. Differences in the Provision of AGs
5.2. Factors Affecting Provision at the Municipal Level
5.3. Towards Solutions from Practical Experience
5.4. Study Limitations
6. Conclusions
Author Contributions
Funding
Institutional Review Board Statement
Informed Consent Statement
Data Availability Statement
Acknowledgments
Conflicts of Interest
References
- Barthel, S.; Parker, J.; Ernstson, H. Food and Green Space in Cities: A Resilience Lens on Gardens and Urban Environmental Movements. Urban Stud. 2015, 52, 1321–1338. [Google Scholar] [CrossRef]
- Corntassel, J.; Hardbarger, T. Educate to perpetuate: Land-based pedagogies and community resurgence. Int. Rev. Educ. 2019, 65, 87–116. [Google Scholar] [CrossRef]
- Pikner, T.; Willman, K.; Jokinen, A. Urban commoning as a vehicle between government institutions and informality: Collective gardening practices in Tampere and Narva. Int. J. Urban Reg. Res. 2017, 44, 711–729. [Google Scholar] [CrossRef]
- Gibas, P.; Boumova, I. The Urbanization of Nature in a (Post)Socialist Metropolis: An Urban Political Ecology of Allotment Gardening. Int. J. Urban Reg. Res. 2020, 44, 18–37. [Google Scholar] [CrossRef]
- Bellows, A.C. One hundred years of allotment gardens in Poland. Food Foodways 2004, 12, 247–276. [Google Scholar] [CrossRef]
- van der Jagt, A.P.N.; Szaraz, L.R.; Delshammar, T.; Cvejic, R.; Santos, A.; Goodness, J.; Buijs, A. Cultivating nature-based solutions: The governance of communal urban gardens in the European Union. Environ. Res. 2017, 159, 264–275. [Google Scholar] [CrossRef]
- Taylor, L.; Hochuli, D.F. Defining greenspace: Multiple uses across multiple disciplines. Landsc. Urban Plan. 2017, 158, 25–38. [Google Scholar] [CrossRef]
- Genter, C.; Roberts, A.; Richardson, J.; Sheaff, M. The contribution of allotment gardening to health and wellbeing: A systematic review of the literature. Br. J. Occup. Ther. 2015, 78, 593–605. [Google Scholar] [CrossRef]
- Skamlova, L.; Wilkaniec, A.; Szczepanska, M.; Bacik, V.; Hencelova, P. The development process and effects from the management of community gardens in two post-socialist cites: Bratislava and Poznan. Urban For. Urban Green. 2020, 48, 126572. [Google Scholar] [CrossRef]
- Kabisch, N. Ecosystem service implementation and governance challenges in urban green space planning—The case of Berlin, Germany. Land Use Pol. 2015, 42, 557–567. [Google Scholar] [CrossRef]
- Cabral, I.; Keim, J.; Engelmann, R.; Kraemer, R.; Siebert, J.; Bonn, A. Ecosystem services of allotment and community gardens: A Leipzig, Germany case study. Urban For. Urban Green. 2017, 23, 44–53. [Google Scholar] [CrossRef]
- Prové, C.; Dessein, J.; De Krom, M. Taking context into account in urban agriculture governance: Case studies of Warsaw (Poland) and Ghent (Belgium). Land Use Pol. 2016, 56, 16–26. [Google Scholar] [CrossRef]
- da Silva, I.M.; Fernandes, C.O.; Castiglione, B.; Costa, L. Characteristics and motivations of potential users of urban allotment gardens: The case of Vila Nova de Gaia municipal network of urban allotment gardens. Urban For. Urban Green. 2016, 20, 56–64. [Google Scholar] [CrossRef]
- Cepic, S.; Tomicevic-Dubljevic, J.; Zivojinovic, I. Is there a demand for collective urban gardens? Needs and motivations of potential gardeners in Belgrade. Urban For. Urban Green. 2020, 53, 126716. [Google Scholar] [CrossRef]
- Fox-Kamper, R.; Wesener, A.; Munderlein, D.; Sondermann, M.; McWilliam, W.; Kirk, N. Urban community gardens: An evaluation of governance approaches and related enablers and barriers at different development stages. Landsc. Urban Plan. 2018, 170, 59–68. [Google Scholar] [CrossRef]
- Herrmann, M.M. The Modern Day “Victory Garden”. Procedia Eng. 2015, 118, 647–653. [Google Scholar] [CrossRef]
- Ginn, F. Dig for Victory! New histories of wartime gardening in Britain. J. Hist. Geogr. 2012, 38, 294–305. [Google Scholar] [CrossRef]
- Moskalonek, Z.; Polom, M.; Puzdrakiewicz, K. Changes in the Function of Allotment Gardens in an Attractive Location Based on the Example of Tri-City in Poland. Land 2020, 9, 464. [Google Scholar] [CrossRef]
- Spilková, J.; Vágner, J. The loss of land devoted to allotment gardening: The context of the contrasting pressures of urban planning, public and private interests in Prague, Czechia. Land Use Pol. 2016, 52, 232–239. [Google Scholar] [CrossRef]
- Young, C.; Hofmann, M.; Frey, D.; Moretti, M.; Bauer, N. Psychological restoration in urban gardens related to garden type, biodiversity and garden-related stress. Landsc. Urban Plan. 2020, 198, 1037. [Google Scholar] [CrossRef]
- Speak, A.; Mizgajski, A.; Borysiak, J. Allotment gardens and parks: Provision of ecosystem services with an emphasis on biodiversity. Urban For. Urban Green. 2015, 14, 772–781. [Google Scholar] [CrossRef]
- Wood, C.J.; Pretty, J.; Griffin, M. A case-control study of the health and well-being benefits of allotment gardening. J. Public Health 2016, 38, e336–e344. [Google Scholar] [CrossRef] [PubMed]
- Veen, E.J.; Bock, B.B.; Van den Berg, W.A.; Visser, J.; Wiskerke, J.S. Community gardening and social cohesion: Different designs, different motivations. Local Environ. 2016, 21, 1271–1287. [Google Scholar] [CrossRef]
- Jensen, J.L.; Sørensen, E.B. Recreation, cultivation and environmental concerns: Exploring the materiality and leisure experience of contemporary allotment gardening. Leis. Stud. 2020, 39, 322–340. [Google Scholar] [CrossRef]
- Sowińska-Świerkosz, B.; Michalik-Śnieżek, M.; Bieske-Matejak, A. Can Allotment Gardens (AGs) Be Considered an Example of Nature-Based Solutions (NBS) Based on the Use of Historical Green Infrastructure? Sustainability 2021, 13, 835. [Google Scholar] [CrossRef]
- Breuste, J.H. Allotment gardens as part of urban green infrastructure: Actual trends and perspectives in Central Europe. In Urban Biodiversity and Design; Kelcey, J.G., Norbert, M., Werner, P., Eds.; Wiley: Weinheim, Germany, 2010; Volume 5, pp. 463–475. [Google Scholar] [CrossRef]
- Borysiak, J.; Mizgajski, A.; Speak, A. Floral biodiversity of allotment gardens and its contribution to urban green infrastructure. Urban Ecosyst. 2017, 20, 323–335. [Google Scholar] [CrossRef]
- Poniży, L.; Stachura, K. Future of Allotment Gardens in the context of city spatial policy–a case study of Poznań. Quaest. Geogr. 2017, 36, 121–127. Available online: http://hdl.handle.net/10593/17741 (accessed on 12 March 2021). [CrossRef]
- Russo, A.; Cirella, G.T. Edible Green Infrastructure for Urban Regeneration and Food Security: Case Studies from the Campania Region. Agriculture 2020, 10, 358. [Google Scholar] [CrossRef]
- Venter, Z.S.; Shackleton, C.M.; Van Staden, F.; Selomane, O.; Masterson, V.A. Green Apartheid: Urban green infrastructure remains unequally distributed across income and race geographies in South Africa. Landsc. Urban Plan. 2020, 203, 103889. [Google Scholar] [CrossRef]
- Kabisch, N.; Haase, D. Green justice or just green? Provision of urban green spaces in Berlin, Germany. Landsc. Urban Plan. 2014, 122, 129–139. [Google Scholar] [CrossRef]
- McClintock, N.; Mahmoudi, D.; Simpson, M.; Santos, J.P. Socio-spatial differentiation in the Sustainable City: A mixed-methods assessment of residential gardens in metropolitan Portland, Oregon, USA. Landsc. Urban Plan. 2016, 148, 1–16. [Google Scholar] [CrossRef]
- Su, S.; Li, Z.; Xu, M.; Cai, Z.; Weng, M. A geo-big data approach to intra-urban food deserts: Transit-varying accessibility, social inequalities, and implications for urban planning. Habitat Int. 2017, 64, 22–40. [Google Scholar] [CrossRef]
- Azunre, G.A.; Amponsah, O.; Peprah, C.; Takyi, S.A.; Braimah, I. A review of the role of urban agriculture in the sustainable city discourse. Cities 2019, 93, 104–119. [Google Scholar] [CrossRef]
- Lewis, O.; Home, R.; Kizos, T. Digging for the roots of urban gardening behaviours. Urban For. Urban Green. 2018, 34, 105–113. [Google Scholar] [CrossRef]
- Wu, L.; Kim, S.K. Exploring the equality of accessing urban green spaces: A comparative study of 341 Chinese cities. Ecol. Indic. 2021, 121, 107080. [Google Scholar] [CrossRef]
- Egerer, M.; Fairbairn, M. Gated gardens: Effects of urbanization on community formation and commons management in community gardens. Geoforum 2018, 96, 61–69. [Google Scholar] [CrossRef]
- Church, A.; Mitchell, R.; Ravenscroft, N.; Stapleton, L. ‘Growing your own’: A multi-level modelling approach to understanding personal food growing trends and motivations in Europe. Ecol. Econ. 2015, 110, 71–80. [Google Scholar] [CrossRef]
- Exner, A.; Schutzenberger, I. Creative Natures. Community gardening, social class and city development in Vienna. Geoforum 2018, 92, 181–195. [Google Scholar] [CrossRef]
- Milligan, C.; Gatrell, A.; Bingley, A. ‘Cultivating health’: Therapeutic landscapes and older people in northern England. Soc. Sci. Med. 2004, 58, 1781–1793. [Google Scholar] [CrossRef]
- Enssle, F.; Kabisch, N. Urban green spaces for the social interaction, health and well-being of older people—An integrated view of urban ecosystem services and socio-environmental justice. Environ. Sci. Policy 2020, 109, 36–44. [Google Scholar] [CrossRef]
- Ye, M. Demand and Spatial Planning of Allotment Gardens in Metropolitan Areas of China. Ph.D. Thesis, Ritsumeikan University, Kyoto, Japan, 10 September 2019. [Google Scholar] [CrossRef]
- Albaladejo-García, J.A.; Francisco, A.; Martínez-Paz, J.M. Economic valuation of allotment gardens in peri-urban degraded agroecosystems: The role of citizens’ preferences in spatial planning. Sustain. Cities Soc. 2021, 68, 102771. [Google Scholar] [CrossRef]
- Scott, A.; Dean, A.; Barry, V.; Kotter, R. Places of urban disorder? Exposing the hidden nature and values of an English private urban allotment landscape. Landsc. Urban Plan. 2018, 169, 185–198. [Google Scholar] [CrossRef]
- Bell, S.; Fox-Kämper, R.; Keshavarz, N.; Benson, M.; Caputo, S.; Noori, S.; Voigt, A. Urban Allotment Gardens in Europe; Routledge: London, UK, 2016; pp. 35–287. [Google Scholar] [CrossRef]
- Palau-Salvador, G.; de Luis, A.; Pérez, J.J.; Sanchis-Ibor, C. Greening the post crisis. Collectivity in private and public community gardens in València (Spain). Cities 2019, 92, 292–302. [Google Scholar] [CrossRef]
- Espinosa Seguí, A.; Maćkiewicz, B.; Rosol, M. From leisure to necessity: Urban allotments in Alicante province, Spain, in times of crisis. ACME Int. J. Crit. Geogr. 2017, 16, 276–304. Available online: http://hdl.handle.net/10045/68788 (accessed on 20 March 2021).
- He, B.; Zhu, J. Constructing community gardens? Residents’ attitude and behaviour towards edible landscapes in emerging urban communities of China. Urban For. Urban Green. 2018, 34, 154–165. [Google Scholar] [CrossRef]
- Hardman, M.; Chipungu, L.; Magidimisha, H.; Larkham, P.J.; Scott, A.J.; Armitage, R.P. Guerrilla gardening and green activism: Rethinking the informal urban growing movement. Landsc. Urban Plan. 2018, 170, 6–14. [Google Scholar] [CrossRef]
- Glavan, M.; Schmutz, U.; Williams, S.; Corsi, S.; Monaco, F.; Kneafsey, M.; Rodriguez, P.A.G.; Čenič-Istenič, M.; Pintar, M. The economic performance of urban gardening in three European cities–examples from Ljubljana, Milan and London. Urban For. Urban Green. 2018, 36, 100–122. [Google Scholar] [CrossRef]
- Dymek, D.; Wilkaniec, A.; Bednorz, L.; Szczepańska, M. Significance of Allotment Gardens in Urban Green Space Systems and Their Classification for Spatial Planning Purposes: A Case Study of Poznań, Poland. Sustainability 2021, 13, 11044. [Google Scholar] [CrossRef]
- Fletcher, E.I.; Collins, C.M. Urban agriculture: Declining opportunity and increasing demand—How observations from London, UK, can inform effective response, strategy and policy on a wide scale. Urban For. Urban Green. 2020, 55, 126823. [Google Scholar] [CrossRef]
- Oba, R.; Obase, R.A. Study on the Allotment Gardens in Tokyo Area and the Financial Situation of Landowners. J. City Plan. Inst. Jpn. 2001, 36, 283–288. [Google Scholar] [CrossRef]
- Shimpo, N.; Amemiya, M.; Yokohari, M. The Organic Waste Recycling System Based on Agro-Activities of Urban Residents –A Case Study of a Community Garden in Hino City, Tokyo. J. City Plan. Inst. Jpn. 2014, 49, 219–224. [Google Scholar] [CrossRef]
- Mitarai, Y.; Matsushima, K. Classification of Allotment Gardeners in Urban Area: Case Study of Atsugi City. Papers on Environmental Information Science. Cent. Environ. Inf. Sci. Tokyo 2017, 31, 237–240. [Google Scholar] [CrossRef]
- Miyake, Y.; Matsumoto, Y. Locational Character of Allotment Gardens and Landowners’ Attitudes. J. Rural. Plan. 1997, 16, 49–57. [Google Scholar] [CrossRef]
- Yagi, H. Site Location and Demand for the Farm Experience Business in Urban Areas: An Empirical Analysis in Tokyo Metropolis Prefecture. J. Rural. Plan. 2013, 32, 323–328. [Google Scholar] [CrossRef][Green Version]
- Makiyama, M.; Hosoya, N.; Inoue, M. Regional Distribution of Stay-type Allotment Gardens and their Stay Facilities –Especially, from the standpoints of current state of vacant facilities and planning for further construction. J. Rural. Plan. 2013, 32, 329–334. [Google Scholar] [CrossRef][Green Version]
- Kawakami, J.; Terada, T. A discussion on the spatial features and management systems in allotment gardens in urban park. LRJ 2019, 82, 543–546. [Google Scholar] [CrossRef][Green Version]
- Jones, M.; Stokes, T. A comparison of the provision of green spaces between urbanized areas in two European localities, and the effects of Local Agenda 21 on their respective planning strategies. Manag. Leis. 1998, 3, 71–84. [Google Scholar] [CrossRef]
- Howard, E. Garden Cities of Tomorrow, Faber London. 1946. Available online: http://urbanplanning.library.cornell.edu/DOCS/howard.htm (accessed on 15 April 2021).
- Hashizume, S. Planning of “Kaen Toshi” by Reijo Ohya. J. City Plan. Inst. Jpn. 1988, 23, 493–498. [Google Scholar] [CrossRef]
- Wiltshire, R.; Azuma, R. Rewriting the plot: Sustaining allotments in the UK and Japan. Local Environ. 2000, 5, 139–151. [Google Scholar] [CrossRef]
- Shimpo, N.; Saito, K. A study on the change of ‘urban gardening’ for planners and users. LRJ 2015, 78, 629–634. [Google Scholar] [CrossRef]
- Matsumiya, A.; Nakamura, M.; Ugai, Y. Usage patterns and ideological constructions of allotment gardeners—A survey of allotment gardeners from Nagoya-. Soc. Welf. Stud. 2015, 17, 19–36. [Google Scholar] [CrossRef]
- Kudo, Y. Historical Change of the Japanese Community Garden and Its Publicness. J. Archit. Plann. AIJ 2009, 74, 2043–2047. [Google Scholar] [CrossRef]
- Ministry of Agriculture, Forestry and Fisheries. Method of Opening an Allotment Garden. Available online: https://www.maff.go.jp/j/nousin/kouryu/tosi_nougyo/s_kaisetsu.html (accessed on 18 July 2021).
- Takano, K.; Akita, N. Land Use Management of the Urbanization Control Area by the Community-Based Allotment Gardens. LRJ 2016, 79, 631–634. [Google Scholar] [CrossRef]
- World Health Organization. Urban Planning, Environment and Health: From Evidence to Policy Action. 2010. Available online: https://www.euro.who.int/__data/assets/pdf_file/0004/114448/E93987.pdf (accessed on 12 February 2021).
- Badiu, D.L.; Iojă, C.I.; Pătroescu, M.; Breuste, J.; Artmann, M.; Niță, M.R.; Grădinaru, S.R.; Hossu, C.A.; and Onose, D.A. Is urban green space per capita a valuable target to achieve cities’ sustainability goals? Romania as a case study. Ecol. Indic. 2016, 70, 53–66. [Google Scholar] [CrossRef]
- Soga, M.; Cox, D.T.C.; Yamaura, Y.; Gaston, K.J.; Kurisu, K.; Hanaki, K. Health Benefits of Urban Allotment Gardening: Improved Physical and Psychological Well-Being and Social Integration. Int. J. Environ. Res. Public Health 2017, 14, 71. [Google Scholar] [CrossRef]
- Van Leeuwen, E.; Nijkamp, P.; De Noronha Vaz, T. The multifunctional use of urban greenspace. Int. J. Agric. Sustain. 2010, 8, 20–25. [Google Scholar] [CrossRef]
- Soga, M.; Gaston, K.J.; Koyanagi, T.F.; Kurisu, K.; Hanaki, K. Urban residents’ perceptions of neighbourhood nature: Does the extinction of experience matter? Biol. Conserv. 2016, 203, 143–150. [Google Scholar] [CrossRef]
- Tomonaga, S.; Ota, J.; Sekimoto, K.; Udagawa, T. Agriculture Promotion of Tokyo and Situation of Agricultural Infrastructure Improvement. Water Land Environ. Eng. 2013, 81, 445–448. [Google Scholar] [CrossRef]
- Moriya, O.; Funakubo, S. A Study on Policies for Conservation and Utilization of Agricultural Land in Green Master Plans. LRJ 2020, 83, 655–660. [Google Scholar] [CrossRef]
- Terada, T. Urban sprawl or co-existence with nature: Lessons from Japanese urban-rural mixture. In Proceedings of the IFLA Aisa Pacific Regional Congress, Thai Association of Landscape Architects, Bangkok, Thailand, 2–5 November 2017; pp. 41–49. Available online: https://www.researchgate.net/publication/322759762_Urban_sprawl_or_co-existence_with_nature_Lessons_from_Japanese_urban-rural_mixture (accessed on 20 November 2020).
- Tokyo Statistical Yearbook. Available online: https://www.toukei.metro.tokyo.lg.jp/tnenkan/tn-index.htm (accessed on 20 November 2020).
- Lee, J.; Wong, D.W. Statistical Analysis with ArcView GIS; John Wiley and Sons Inc.: New York, NY, USA, 2001; p. 192. [Google Scholar]
- Ayhan, I.; Cubukcu, K.M. Explaining historical urban development using the locations of mosques: A GIS/spatial statistics-based approach. Appl. Geogr. 2010, 30, 229–238. [Google Scholar] [CrossRef]
- Satoh, H.; Shimizu, C. A study on the Residential Relocation within the Tokyo Metropolitan area. J. City Plan. Inst. Jpn. 2011, 46, 559–564. [Google Scholar] [CrossRef]
- Sengoku, H.; Akiyama, Y.; Shibasaki, R. Determining Spatial Extent of Shopping Areas using Store Density –An Approach with Kernel Density Estimation. J. City Plan. Inst. Jpn. 2011, 46, 409–414. [Google Scholar] [CrossRef]
- Hong, D.; Sakai, T.; Divigalpitiya, D. The Characteristics of the Multiple Dwelling for the Single Person Household around the University Campus in SEOUL. J. Archit. Plan. (Trans. AIJ) 2018, 83, 1939–1947. [Google Scholar] [CrossRef][Green Version]
- Zhang, A.; Yang, Y.; Chen, T.; Liu, J.; Hu, Y. Exploration of spatial differentiation patterns and related influencing factors for National Key Villages for rural tourism in China in the context of a rural revitalization strategy, using GIS-based overlay analysis. Arab. J. Geosci. 2021, 14, 83. [Google Scholar] [CrossRef]
- Borruso, G. Network Density Estimation: A GIS Approach for Analysing Point Patterns in a Network Space. Trans. GIS 2008, 12, 377–402. [Google Scholar] [CrossRef]
- Basnou, C.; Baró, F.; Langemeyer, J.; Castell, C.; Dalmases, C.; Pino, J. Advancing the green infrastructure approach in the Province of Barcelona: Integrating biodiversity, ecosystem functions and services into landscape planning. Urban For. Urban Green. 2020, 55, 126797. [Google Scholar] [CrossRef]
- Van den Berg, A.E.; van Winsum-Westra, M.; De Vries, S.; Van Dillen, S.M. Allotment gardening and health: A comparative survey among allotment gardeners and their neighbors without an allotment. Environ. Health 2010, 9, 74. Available online: http://www.ehjournal.net/content/9/1/74 (accessed on 15 April 2021). [CrossRef] [PubMed]
- Shingo, Y.; Hironori, Y.; Akira, K. Decision Making for Long-Term Land Use by Urban Farmers: Case Study of Net Present Return of Land Use in Nerima Ward Tokyo. Stud. Reg. Sci. 2015, 45, 305–316. [Google Scholar] [CrossRef]
- M’Ikiugu, M.M.; Wang, Q.; Kinoshita, I. Green Infrastructure Gauge: A tool for evaluating green infrastructure inclusion in existing and future urban areas. Procedia-Soc. Behav. Sci. 2012, 68, 815–825. [Google Scholar] [CrossRef][Green Version]
- Sakai, T.; Kawamura, K.; Hyodo, T. Locational dynamics of logistics facilities: Evidence from Tokyo. J. Transp. Geogr. 2015, 46, 10–19. [Google Scholar] [CrossRef]
- Takeuchi, T. The Position of Farmland in Tokyo’s City Planning. Urban Hous. Sci. 2013, 82, 12–15. [Google Scholar] [CrossRef]
- Yoshida, S. Effects of Urbanization on Farmland Size and Diversified Farm Activities in Japan: An Analysis Based on the Land Parcel Database. Land 2020, 9, 315. [Google Scholar] [CrossRef]
- Rafiee, R.; Mahiny, A.S.; Khorasani, N. Assessment of changes in urban green spaces of Mashad city using satellite data. Int. J. Appl. Earth Obs. Geoinf. 2009, 11, 431–438. [Google Scholar] [CrossRef]
- Byomkesh, T.; Nakagoshi, N.; Dewan, A.M. Urbanization and green space dynamics in Greater Dhaka, Bangladesh. Landsc. Ecol. Eng. 2012, 8, 45–58. [Google Scholar] [CrossRef]
- Haaland, C.; van Den Bosch, C.K. Challenges and strategies for urban green-space planning in cities undergoing densification: A review. Urban For. Urban Green. 2015, 14, 760–771. [Google Scholar] [CrossRef]
- Pristeri, G.; Peroni, F.; Pappalardo, S.E.; Codato, D.; Masi, A.; De Marchi, M. Whose Urban Green? Mapping and Classifying Public and Private Green Spaces in Padua for Spatial Planning Policies. ISPRS Int. J. Geo-Inf. 2021, 10, 538. [Google Scholar] [CrossRef]
- DeSilvey, C. Cultivated histories in a Scottish allotment garden. Cult. Geogr. 2003, 10, 442–468. [Google Scholar] [CrossRef]
- Domene, E.; Saurí, D. Urbanization and class-produced natures: Vegetable gardens in the Barcelona Metropolitan Region. Geoforum 2007, 38, 287–298. [Google Scholar] [CrossRef]
- Langemeyer, J.; Madrid-Lopez, C.A.; Beltran, M.; Mendez, G.V. Urban agriculture—A necessary pathway towards urban resilience and global sustainability? Landsc. Urban Plan. 2021, 210, 104055. [Google Scholar] [CrossRef]
- Tappert, S.; Kloti, T.; Drilling, M. Contested urban green spaces in the compact city: The (re-)negotiation of urban gardening in Swiss cities. Landsc. Urban Plan. 2018, 170, 69–78. [Google Scholar] [CrossRef]
- Mackiewicz, B.; Asuero, R.P. Public versus private: Juxtaposing urban allotment gardens as multifunctional Nature-based Solutions. Insights from Seville. Urban For. Urban Green. 2021, 65, 127309. [Google Scholar] [CrossRef]
- Langemeyer, J.; Camps-Calvet, M.; Calvet-Mir, L.; Barthel, S.; Gómez-Baggethun, E. Stewardship of urban ecosystem services: Understanding the value(s) of urban gardens in Barcelona. Landsc. Urban Plan. 2018, 170, 79–89. [Google Scholar] [CrossRef]
- Rost, A.T.; Liste, V.; Seidel, C.; Matscheroth, L.; Otto, M.; Meier, F.; Fenner, D. How cool are allotment gardens? A case study of nocturnal air temperature differences in Berlin, Germany. Atmosphere 2020, 11, 500. [Google Scholar] [CrossRef]
- Edmondson, J.L.; Childs, D.Z.; Dobson, M.C.; Gaston, K.J.; Warren, P.H.; Leake, J.R. Feeding a city–Leicester as a case study of the importance of allotments for horticultural production in the UK. Sci. Total Environ. 2020, 705, 135930. [Google Scholar] [CrossRef] [PubMed]
- Camps-Calvet, M.; Langemeyer, J.; Calvet-Mir, L.; Gómez-Baggethun, E. Ecosystem services provided by urban gardens in Barcelona, Spain: Insights for policy and planning. Environ. Sci. Policy 2016, 62, 14–23. [Google Scholar] [CrossRef]
- Martínez-Paz, J.M.; Banos-González, I.; Martínez-Fernández, J.; Esteve-Selma, M.Á. Assessment of management measures for the conservation of traditional irrigated lands: The case of the Huerta of Murcia (Spain). Land Use Pol. 2019, 81, 382–391. [Google Scholar] [CrossRef]
- White, J.T.; Bunn, C. Growing in Glasgow: Innovative practices and emerging policy pathways for urban agriculture. Land Use Pol. 2017, 68, 334–344. [Google Scholar] [CrossRef]
- Schwab, E.; Caputo, S.; Hernández-García, J. Urban agriculture: Models-in-circulation from a critical transnational perspective. Landsc. Urban Plan. 2018, 170, 15–23. [Google Scholar] [CrossRef]
- Ferretti, V.; Grosso, R. Designing successful urban regeneration strategies through a behavioral decision aiding approach. Cities 2019, 95, 102386. [Google Scholar] [CrossRef]
- Anthopoulou, T.; Nikolaidou, S.; Partalidou, M.; Petrou, M. The emergence of municipal allotment gardens in Greece in Times of Crisis. Governance challenges for new urban gardening practices. In Toward Sustainable Relations between Agriculture and the City; Springer: Berlin/Heidelberg, Germany, 2017; pp. 181–199. [Google Scholar] [CrossRef]
- Drake, L.; Lawson, L.J. Validating verdancy or vacancy? The relationship of community gardens and vacant lands in the US. Cities 2014, 40, 133–142. [Google Scholar] [CrossRef]
- Schilling, J.; Logan, J. Greening the rust belt: A green infrastructure model for right sizing America’s shrinking cities. J. Am. Plan. Assoc. 2008, 74, 451–466. [Google Scholar] [CrossRef]
- Beniston, J.W.; Lal, R.; Mercer, K.L. Assessing and managing soil quality for urban agriculture in a degraded vacant lot soil. Land Degrad. Dev. 2016, 27, 996–1006. [Google Scholar] [CrossRef]
- Jim, C.Y. Sustainable urban greening strategies for compact cities in developing and developed economies. Urban Ecosyst. 2013, 16, 741–761. [Google Scholar] [CrossRef]
- Lin, B.B.; Philpott, S.M.; Jha, S. The future of urban agriculture and biodiversity-ecosystem services: Challenges and next steps. Basic Appl. Ecol. 2015, 16, 189–201. [Google Scholar] [CrossRef]
- Kirwan, J.; Ilbery, B.; Maye, D.; Carey, J. Grassroots social innovations and food localisation: An investigation of the Local Food programme in England. Glob. Environ. Change 2013, 23, 830–837. [Google Scholar] [CrossRef]
- Langemeyer, J.; Wedgwood, D.; McPhearson, T.; Baró, F.; Madsen, A.L.; Barton, D.N. Creating urban green infrastructure where it is needed–A spatial ecosystem service-based decision analysis of green roofs in Barcelona. Sci. Total Environ. 2020, 707, 135487. [Google Scholar] [CrossRef]
- Edmondson, J.L.; Davies, Z.G.; Gaston, K.J.; Leake, J.R. Urban cultivation in allotments maintains soil qualities adversely affected by conventional agriculture. J. Appl. Ecol. 2014, 51, 880–889. [Google Scholar] [CrossRef]
- Shinagawa City. Available online: https://www.city.shinagawa.tokyo.jp/PC/shinagawaphotonews/shinagawaphotonews-2017/hpg000032515.html (accessed on 2 November 2021).
- Kono, M.; Fujita, N. Characteristics and user demands of urban farms: A case study on the “Machinaka Saien” in-town farm. LRJ 2014, 77, 433–436. [Google Scholar] [CrossRef]
- White, R.; Stirling, A. Sustaining trajectories towards Sustainability: Dynamics and diversity in UK communal growing activities. Glob. Environ. Change 2013, 23, 838–846. [Google Scholar] [CrossRef]
- Torres, A.C.; Prevot, A.C.; Nadot, S. Small but powerful: The importance of French community gardens for residents. Landsc. Urban Plan. 2018, 180, 5–14. [Google Scholar] [CrossRef]


| Year | Relevant Legislation | Content |
|---|---|---|
| 1975 | Recreational Agricultural Land Notice |
|
| 1989 | Agricultural Land Rental Law |
|
| 1990 | Allotments Promotion Law |
|
| 2005 | Amendment to Agricultural Land Rental Law |
|
| Amendment to Allotments Promotion Law |
| |
| 2018 | Facilitation of loan for Agricultural Land |
|
| Sources | Items | Number of AGs | Periods |
|---|---|---|---|
| Homepage of Ministry of Agriculture, Forestry and Fisheries (MAFF) 1 |
| AGs: 320 | April 2020~December 2020 |
| |||
| Homepage of Tokyo Metropolitan Government 2 |
| CAGs: 434 | September 2020~December 2020 |
| GAGs: 111 | ||
| Homepage of the 53 municipalities in study area |
| CAGs: 286 | April 2020~December 2020 |
| GAGs: 51 | ||
| |||
| |||
| |||
| |||
| Homepage of National Association of Farming Experience Farms |
| GAGs: 87 | September 2020~December 2020 |
|
| Attribute | Mean | Median | Std. | Min. | Max. |
|---|---|---|---|---|---|
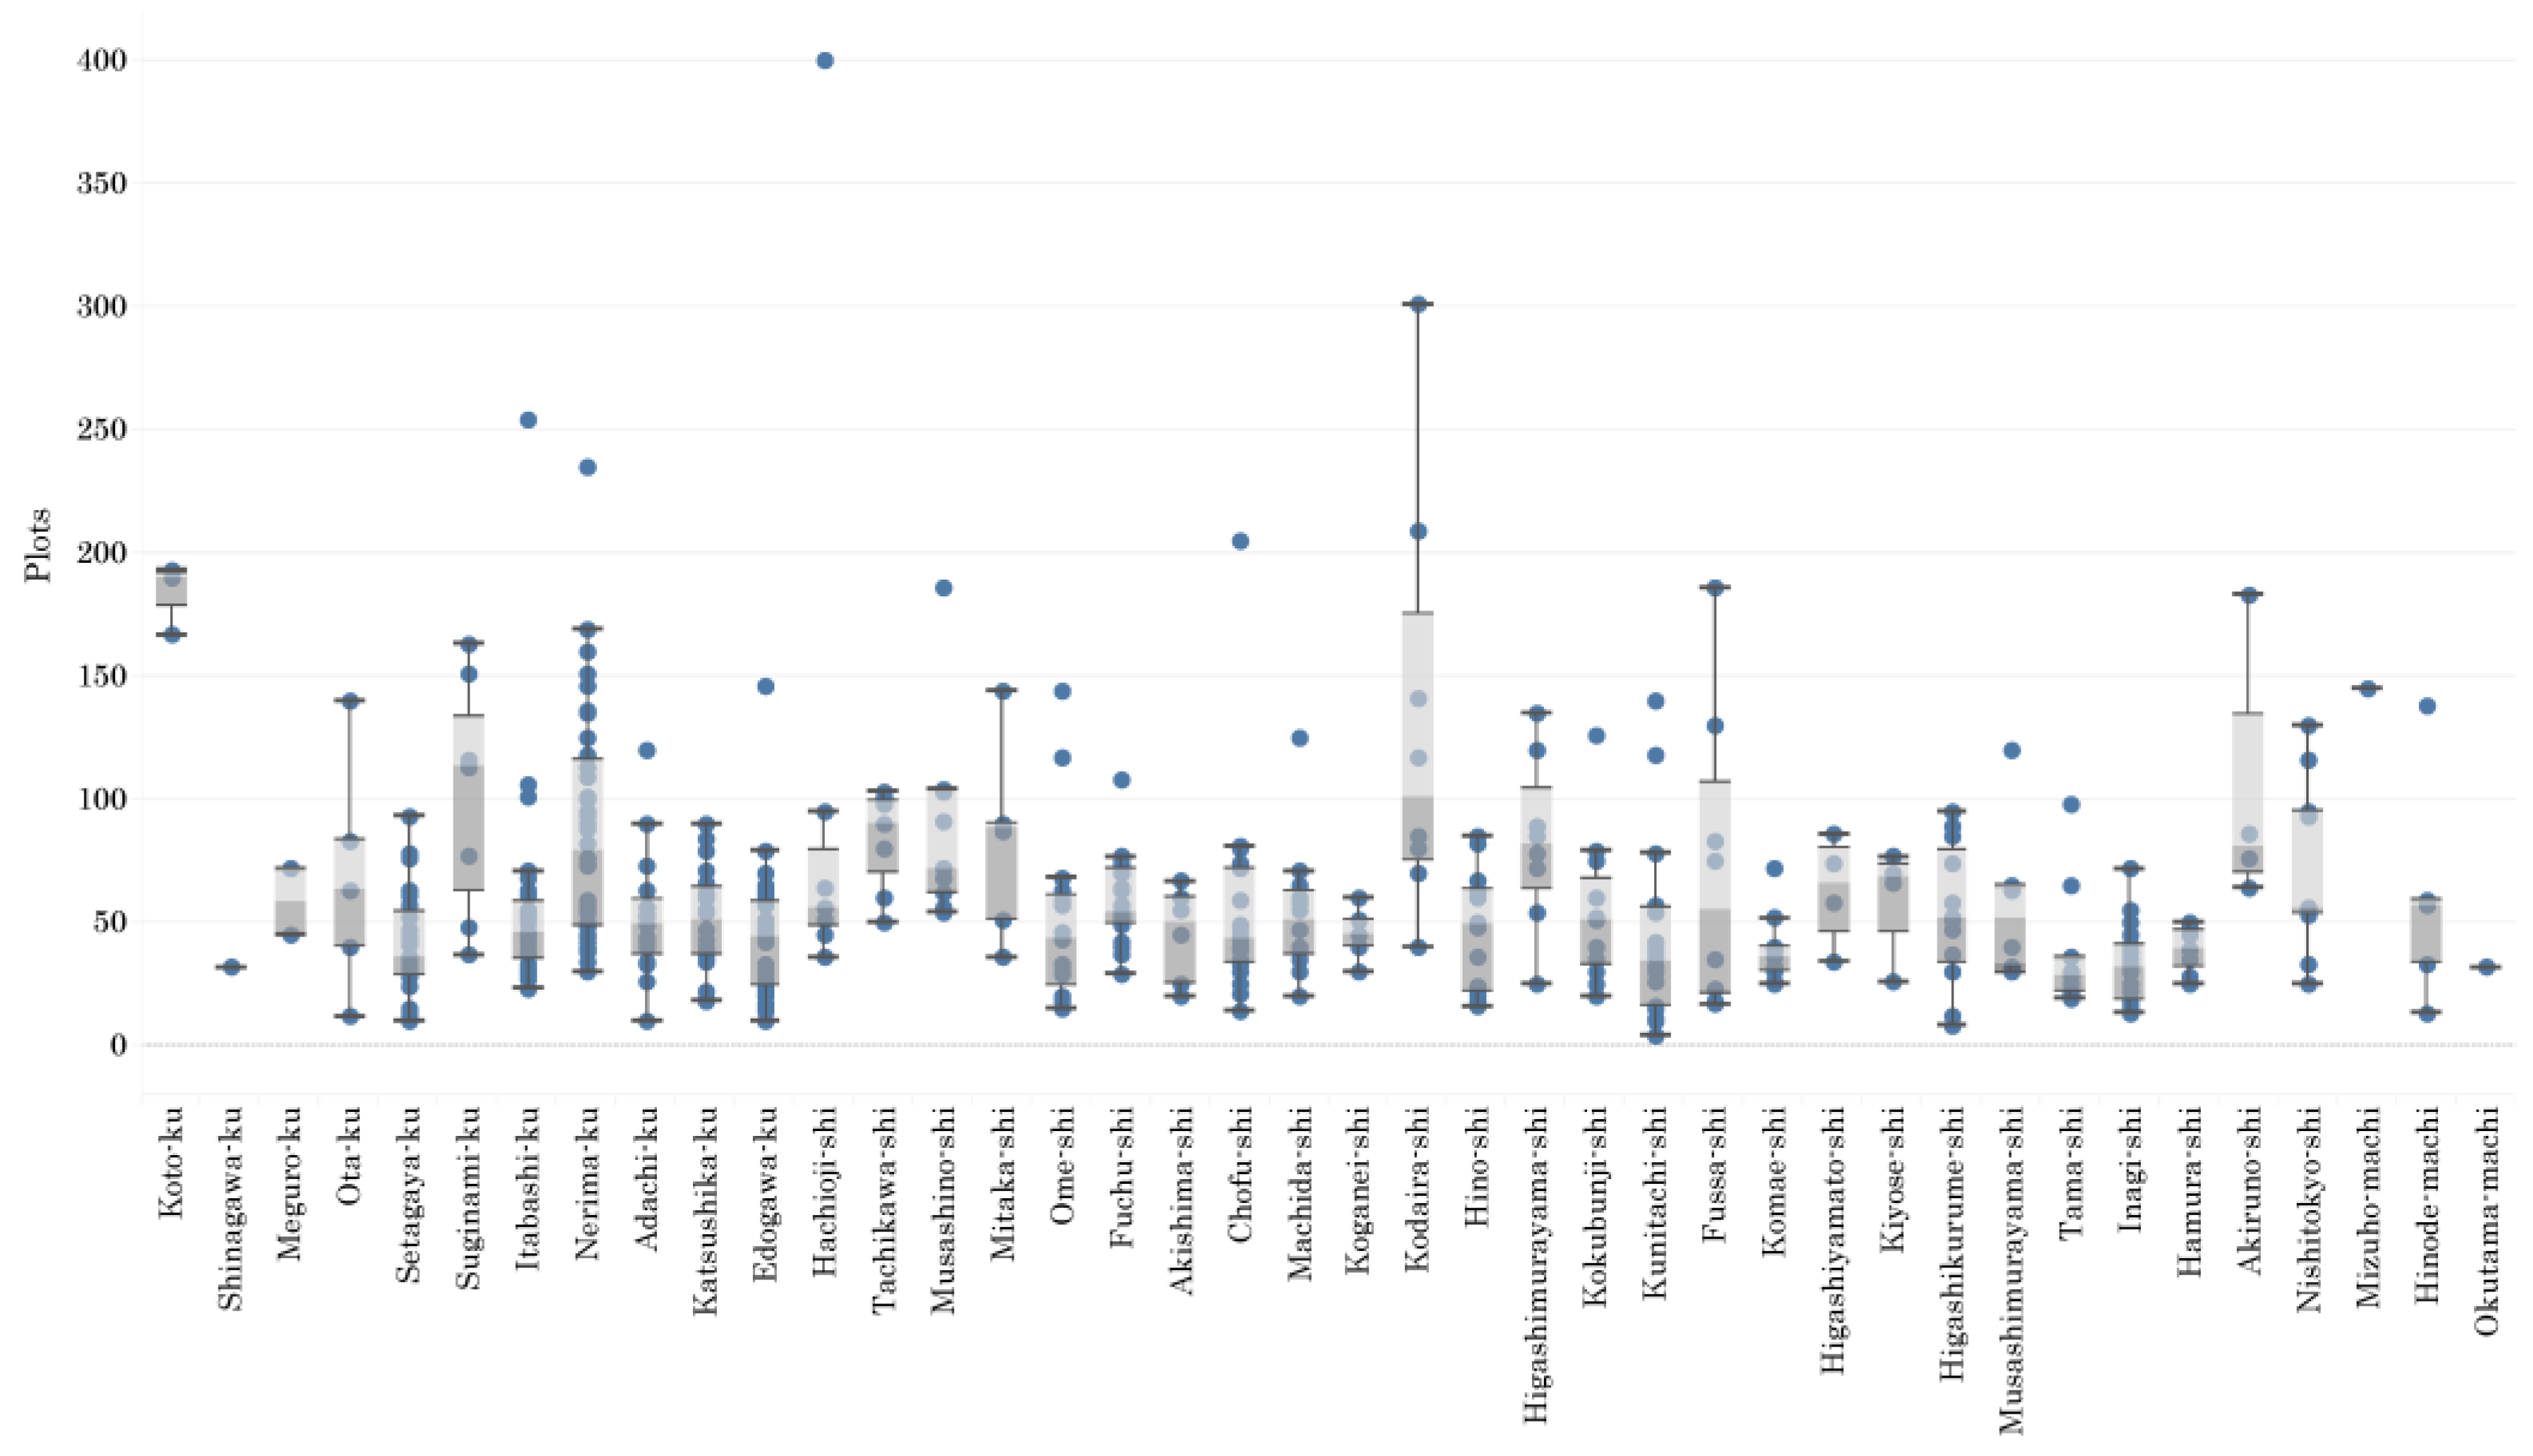
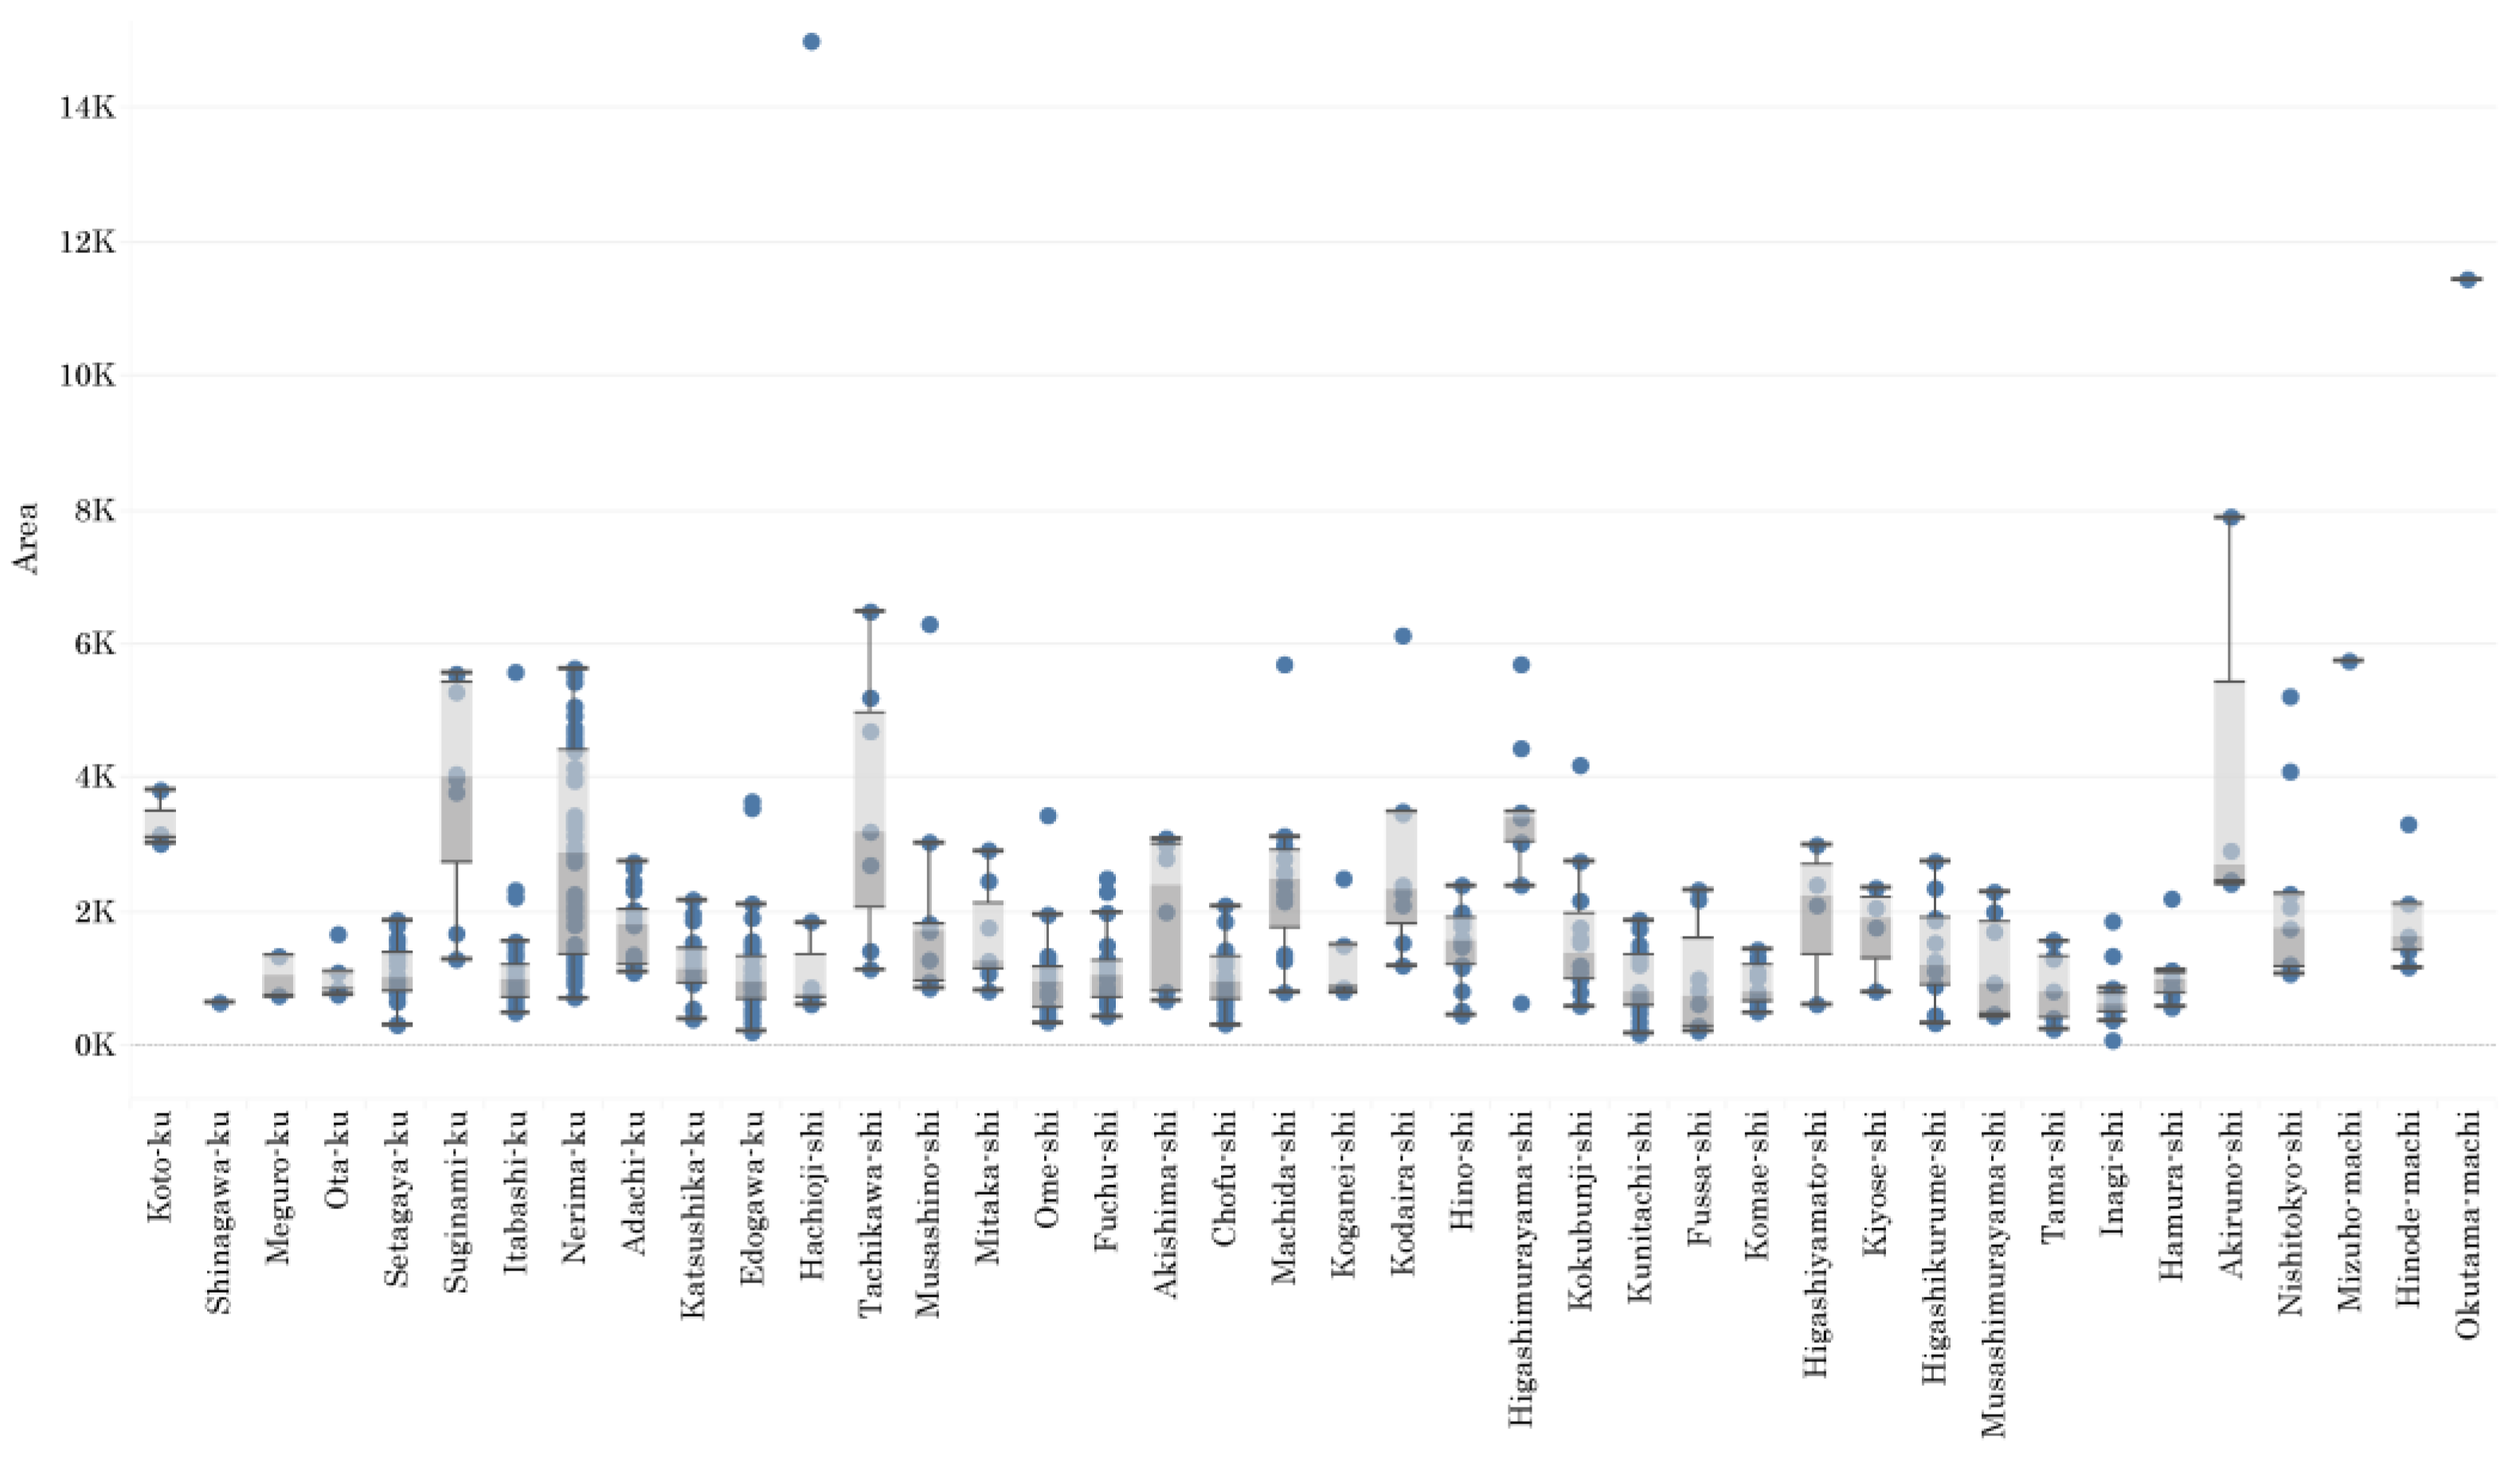
| Number of Plots | 59.97 | 50 | 42.37 | 4 | 400 |
| Area (m2) | 1513.46 | 1094 | 1413.73 | 48 | 15,000 |
| Variables | Definition | Mean | Median | Std. | Min. | Max. | |
|---|---|---|---|---|---|---|---|
| Dependent Variables | PPH | Number of plots per 1000 households | 5.8094 | 4.7900 | 5.41795 | 0 | 20.7 |
| APH | Area per 1000 households | 73.9933 | 61.3600 | 65.22197 | 0 | 241.42 | |
| Independent Variables | POPD | Population density (1000 persons per km2) | 11.7986 | 11.9900 | 5.57808 | 1.1 | 22.25 |
| RLP | Average posted land prices (residential land, JPY 10,000) | 48.412 | 33.100 | 47. 3553 | 9.5 | 268.9 | |
| PGLR | The ratio of the area of productive green land to the total area in the municipality (%) | 3.0898 | 1.2900 | 3.81194 | 0 | 17.03 |
| Model_1 | Model_2 | |
|---|---|---|
| Variables | PPH | APH |
| POPD | −0.426 ** (−0.439) | −4.888 ** (−0.418) |
| RLP | −0.034 * (−0.298) | −0.423 ** (−0.307) |
| PGLR | 0.331 * (0.233) | 5.125 ** (0.300) |
| Constant | 11.465 ** | 136.326 ** |
| Observations | 49 | 49 |
| R-squared | 0.555 | 0.614 |
Publisher’s Note: MDPI stays neutral with regard to jurisdictional claims in published maps and institutional affiliations. |
© 2022 by the authors. Licensee MDPI, Basel, Switzerland. This article is an open access article distributed under the terms and conditions of the Creative Commons Attribution (CC BY) license (https://creativecommons.org/licenses/by/4.0/).
Share and Cite
Zheng, H.; Akita, N.; Araki, S.; Fukuda, M. Provision of Allotment Gardens and Its Influencing Factors: A Case Study of Tokyo, Japan. Land 2022, 11, 333. https://doi.org/10.3390/land11030333
Zheng H, Akita N, Araki S, Fukuda M. Provision of Allotment Gardens and Its Influencing Factors: A Case Study of Tokyo, Japan. Land. 2022; 11(3):333. https://doi.org/10.3390/land11030333
Chicago/Turabian StyleZheng, Hua, Noriko Akita, Shoko Araki, and Masayo Fukuda. 2022. "Provision of Allotment Gardens and Its Influencing Factors: A Case Study of Tokyo, Japan" Land 11, no. 3: 333. https://doi.org/10.3390/land11030333
APA StyleZheng, H., Akita, N., Araki, S., & Fukuda, M. (2022). Provision of Allotment Gardens and Its Influencing Factors: A Case Study of Tokyo, Japan. Land, 11(3), 333. https://doi.org/10.3390/land11030333