
Patterns of Urban Green Space Use Applying Social Media Data: A Systematic Literature Review


Abstract
:1. Introduction
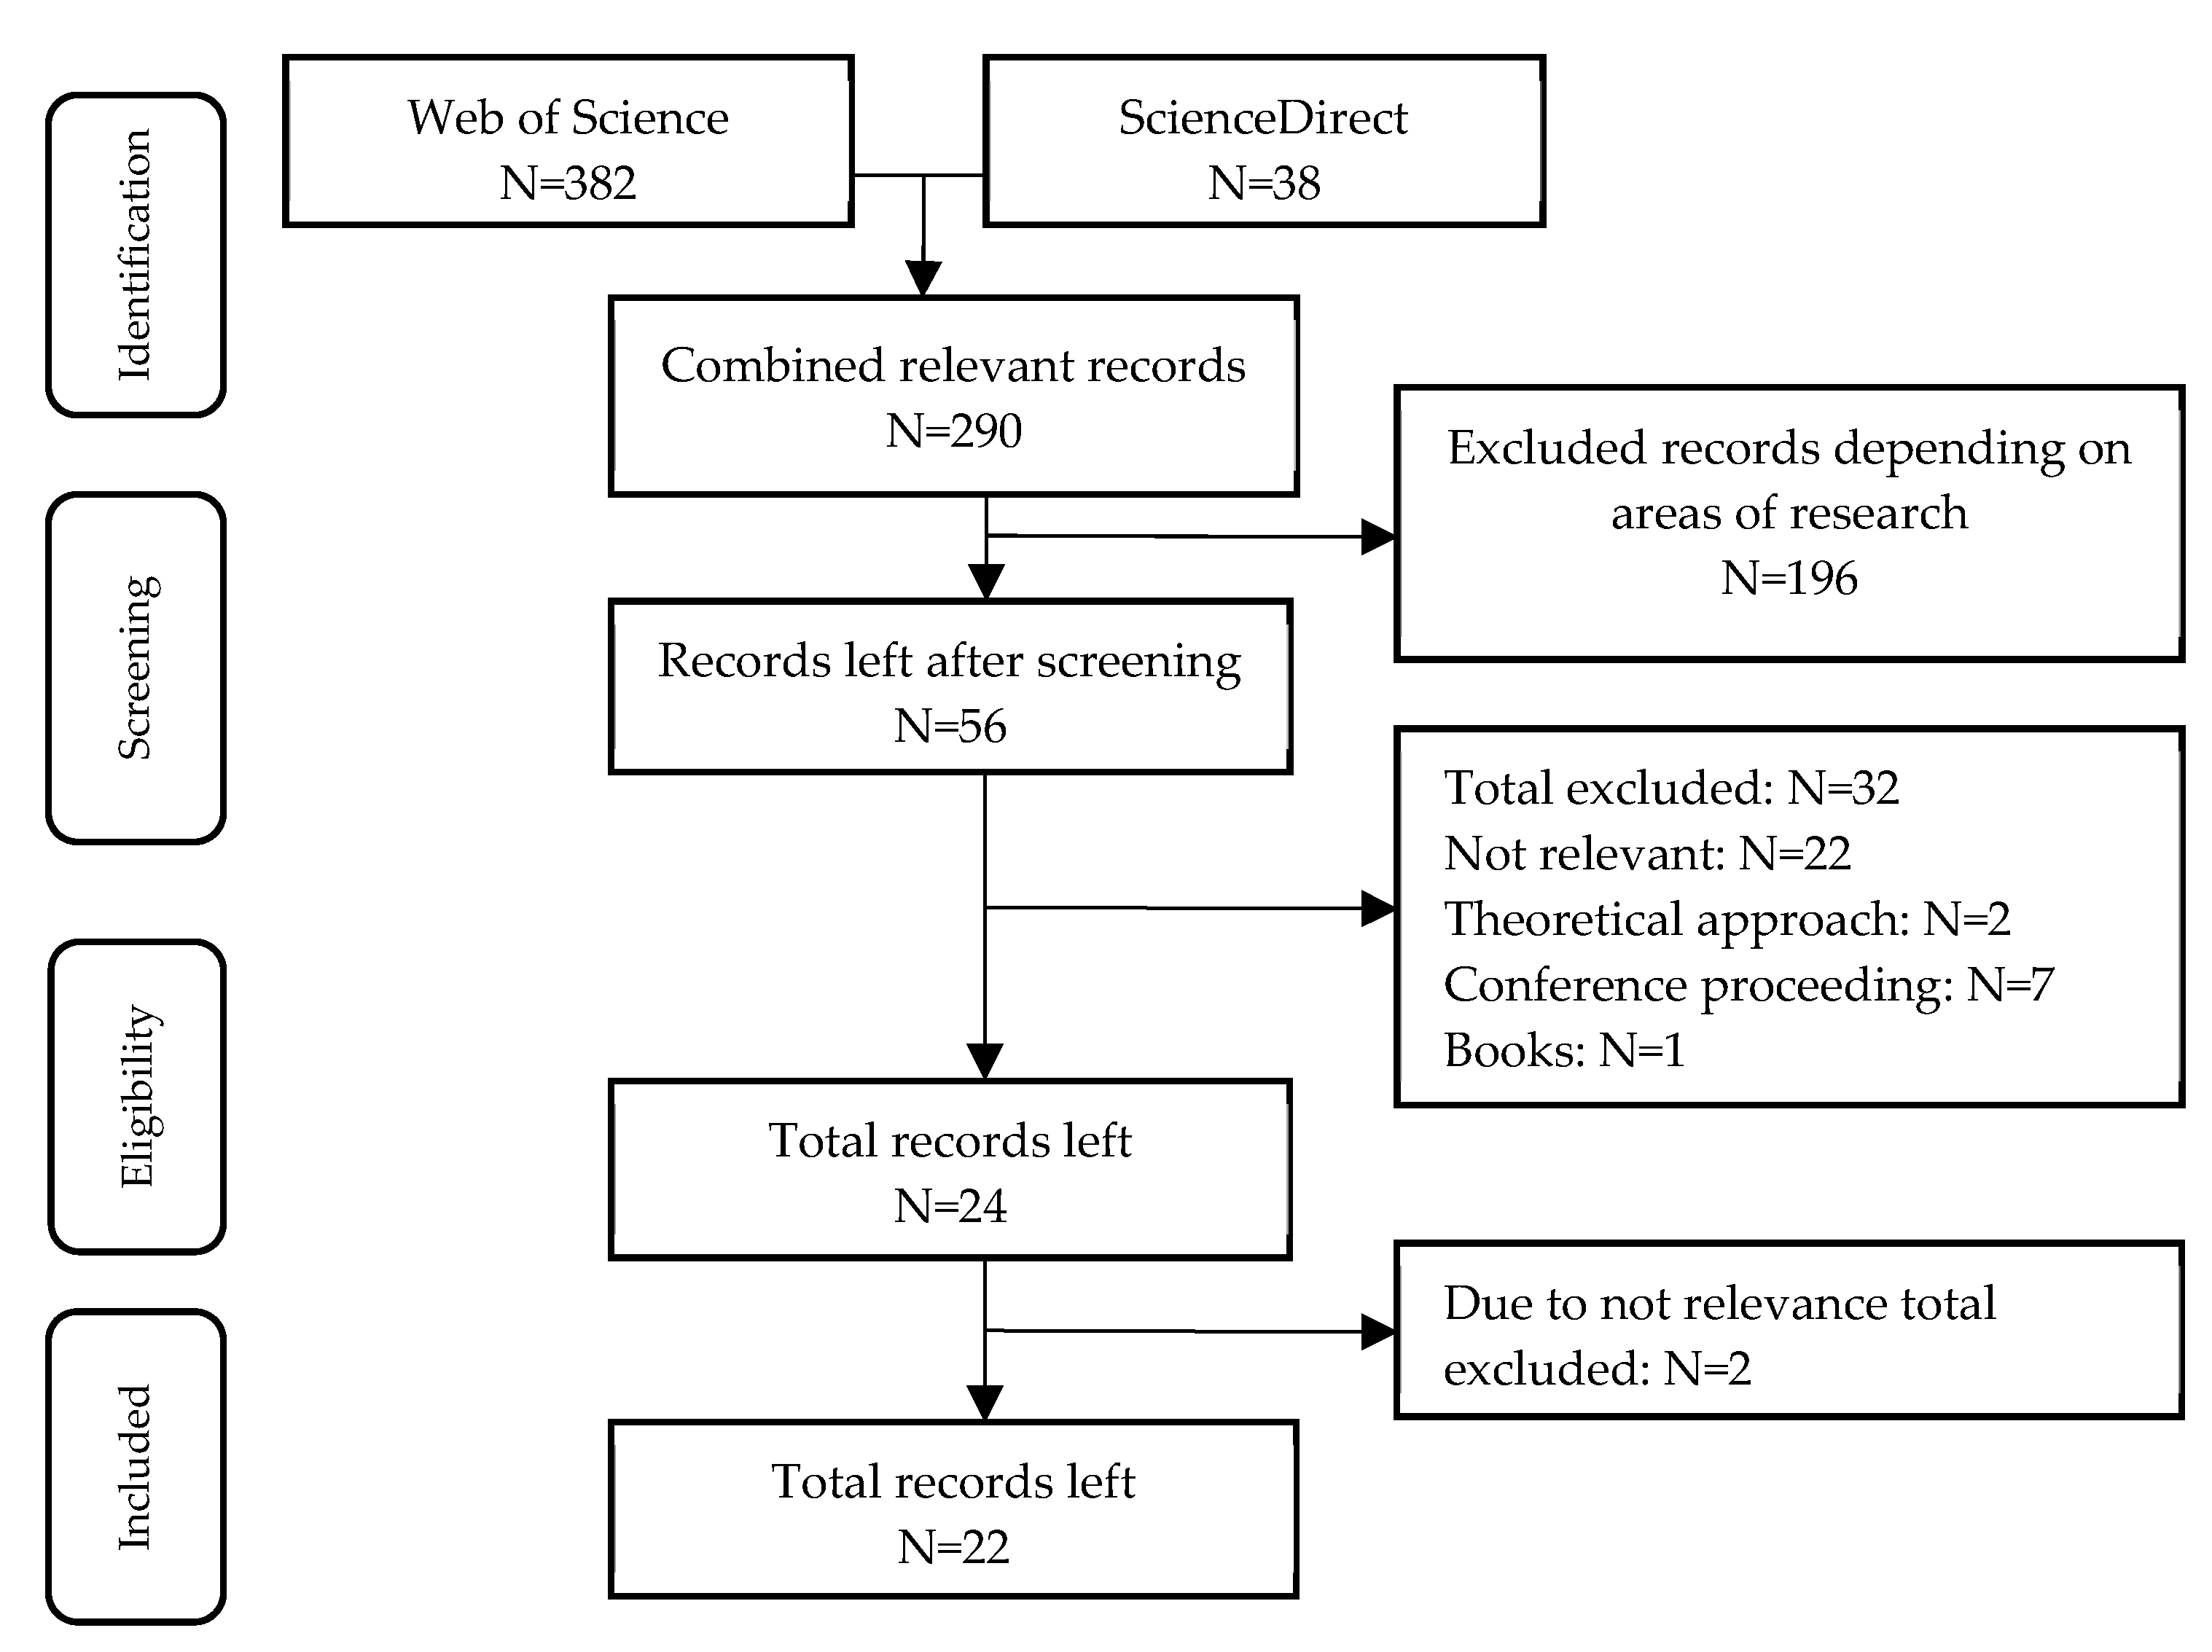
2. Materials and Methods
3. Results
3.1. Main Aims and Findings of Studies Using Social Media Data to Assess Urban Green Space Use
- (I)
- Activities of urban green space visitors.
- (II)
- Park attributes
- (III)
- Spatial and socio-cultural aspects influencing urban green space visitation
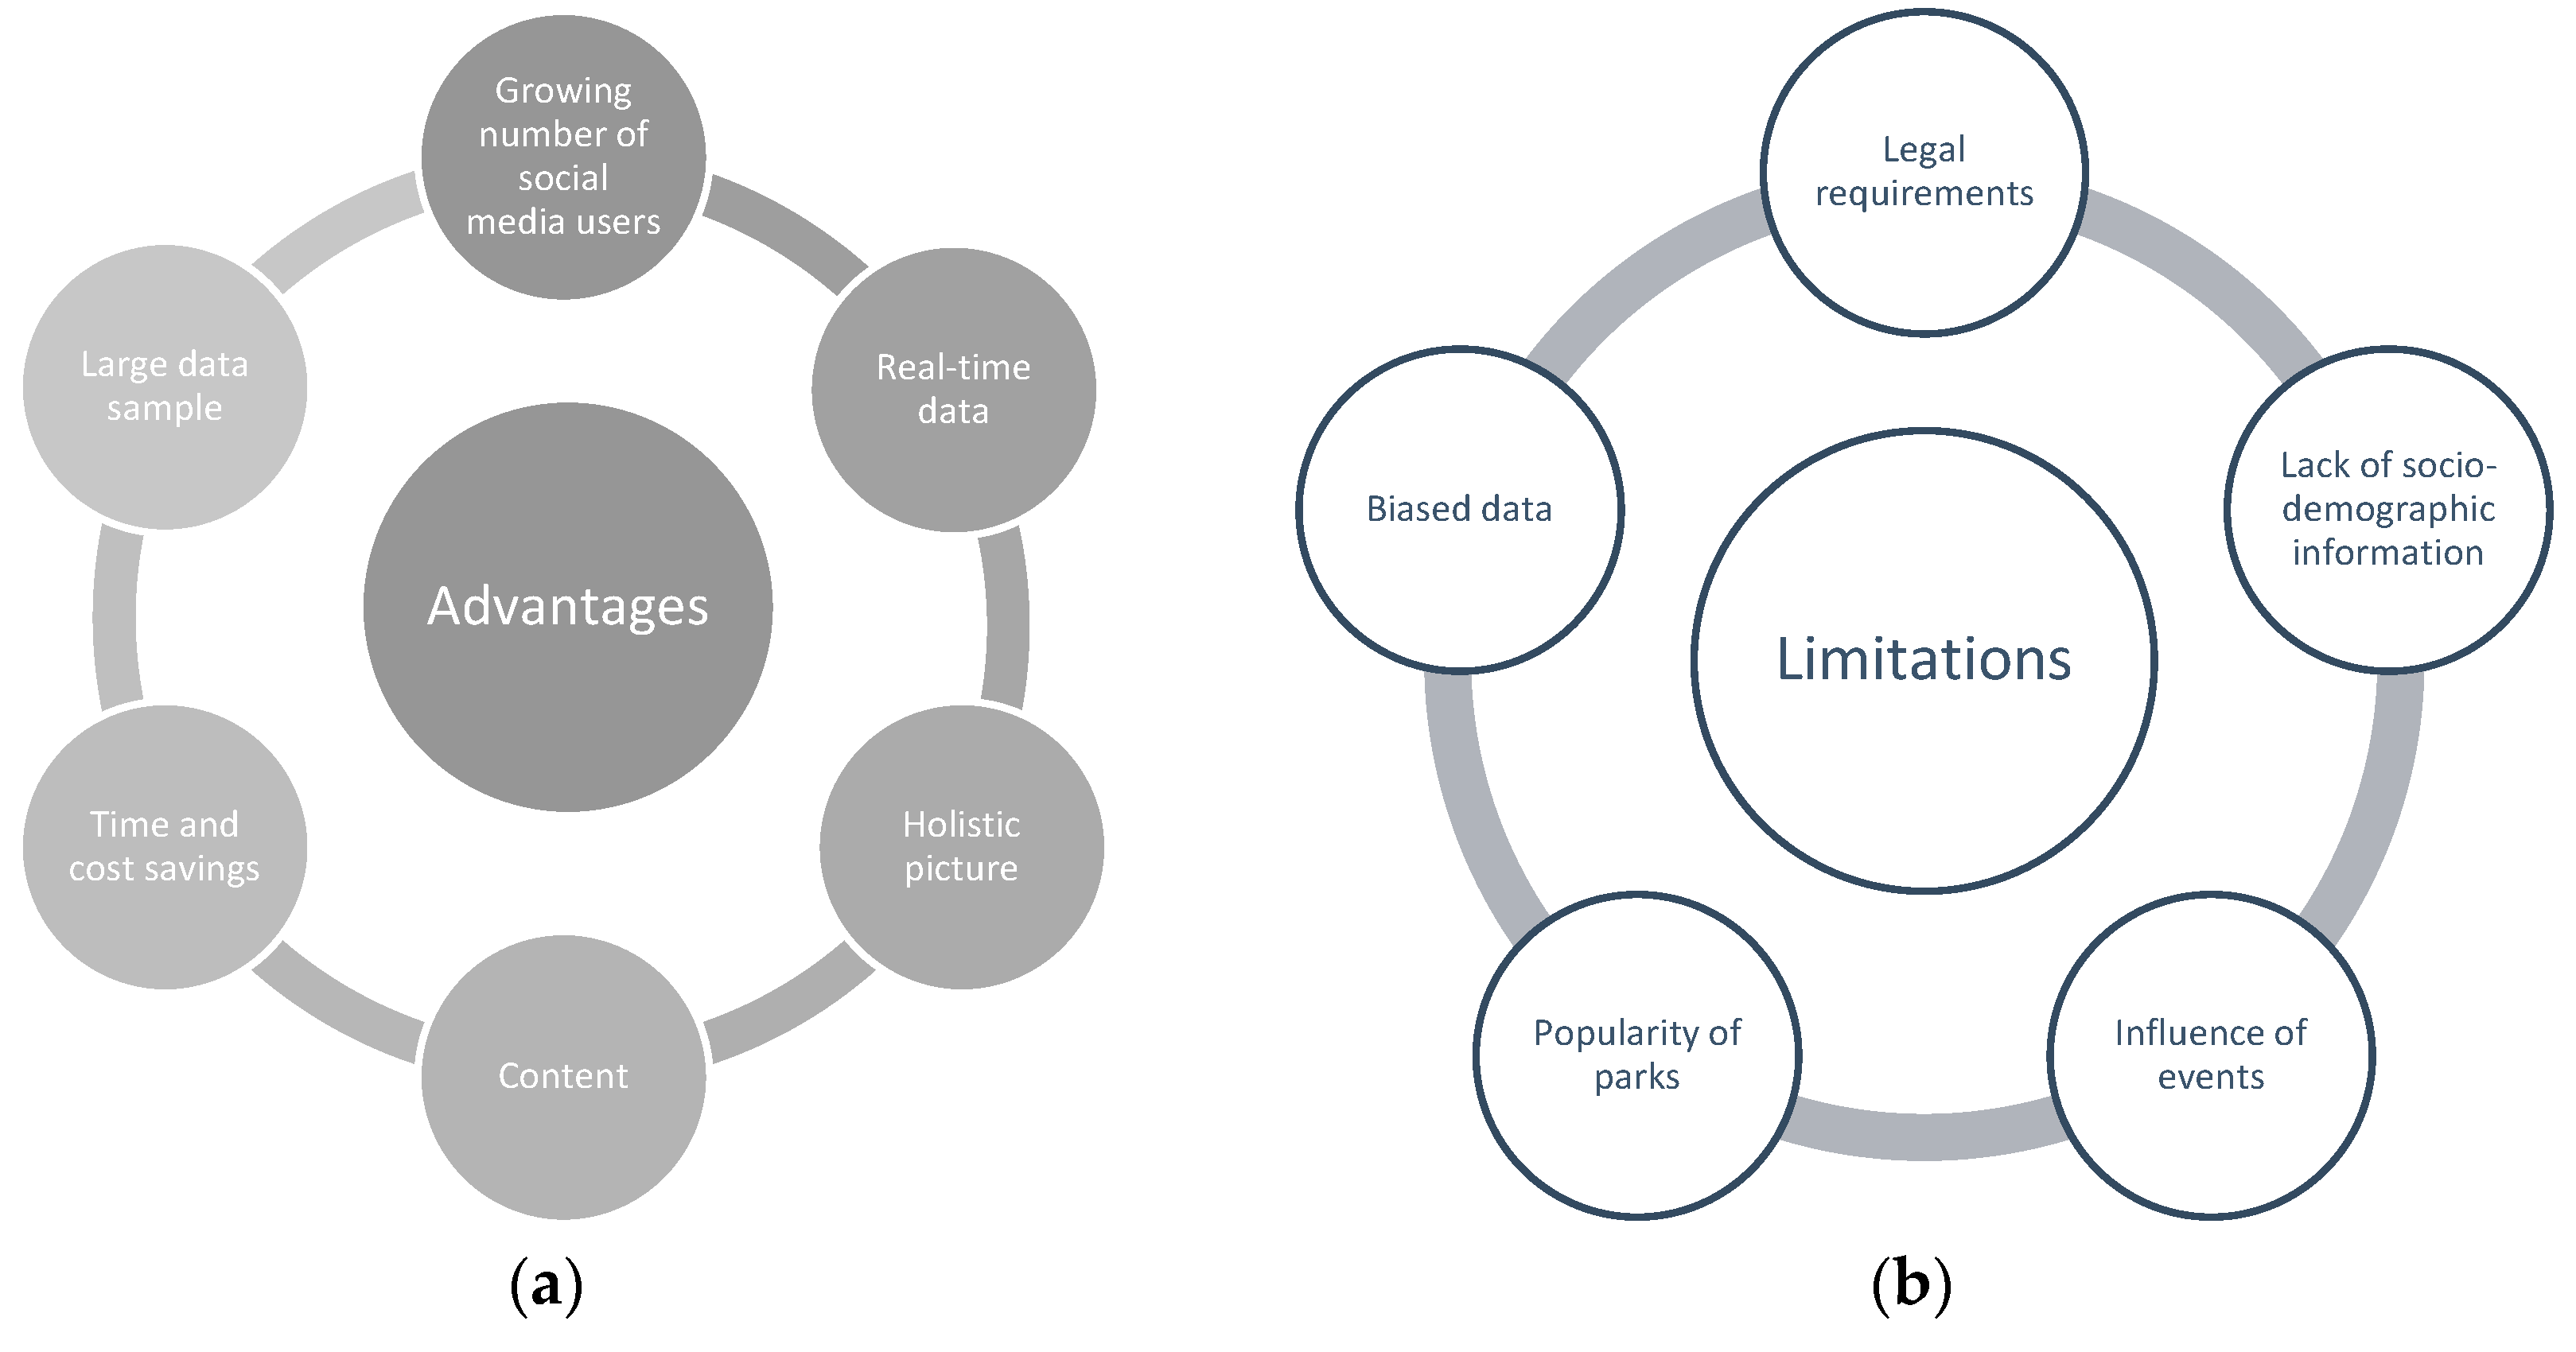
3.2. Advantages and Limitations of Using Social Media Data for Urban Park Studies
4. Discussion
4.1. Social Media Data Constitute Biased Information for Understanding Urban Park Use
4.2. Using Social Media Data for Urban Green Space Planning
4.3. Limitations of the Systematic Review
5. Conclusions
Author Contributions
Funding
Data Availability Statement
Acknowledgments
Conflicts of Interest
References
- Haahtela, T.; Von Hertzen, L.; Anto, J.M.; Bai, C.; Baigenzhin, A.; Bateman, E.D.; Behera, D.; Bennoor, K.; Camargos, P.; Chavannes, N.; et al. Helsinki by nature: The Nature Step to Respiratory Health. Clin. Transl. Allergy 2019, 9, 57. [Google Scholar] [CrossRef]
- Sturm, R.; Cohen, D. Proximity to Urban Parks and Mental Health. J. Ment. Health Policy Econ. 2014, 17, 19–24. [Google Scholar]
- Tempesta, T. Benefits and costs of urban parks: A review. Aestimum 2015, 127–143. [Google Scholar] [CrossRef]
- Kabisch, N.; Qureshi, S.; Haase, D. Human—Environment interactions in urban green spaces—A systematic review of contemporary issues and prospects for future research. Environ. Impact Assess. Rev. 2015, 50, 25–34. [Google Scholar] [CrossRef]
- Kabisch, N.; Kraemer, R.; Masztalerz, O.; Hemmerling, J.; Püffel, C.; Haase, D. Urban Forestry & Urban Greening Impact of summer heat on urban park visitation, perceived health and ecosystem service appreciation. Urban For. Urban Green. 2021, 60, 127058. [Google Scholar] [CrossRef]
- Matos, P.; Vieira, J.; Rocha, B.; Branquinho, C.; Pinho, P. Science of the Total Environment Modeling the provision of air-quality regulation ecosystem service provided by urban green spaces using lichens as ecological indicators. Sci. Total Environ. 2019, 665, 521–530. [Google Scholar] [CrossRef]
- Bai, T.; Mayer, A.L.; Shuster, W.D. The Hydrologic Role of Urban Green Space in Mitigating Flooding (Luohe, China). Sustainability 2018, 10, 3584. [Google Scholar] [CrossRef] [Green Version]
- Reynolds, H.L.; Brandt, L.; Fischer, B.C.; Hardiman, B.S.; Moxley, D.J.; Sandweiss, E.; Speer, J.H.; Fei, S. Implications of climate change for managing urban green infrastructure: An Indiana, US case study. Clim. Change 2020, 163, 1967–1984. [Google Scholar] [CrossRef]
- Alexandru, A.; Mihai, R.; Andreea, D. Methodological framework for urban sprawl control through sustainable planning of urban green infrastructure Methodological framework for urban sprawl control through sustainable planning of urban green infrastructure. Ecol. Indic. 2017, 96, 67–78. [Google Scholar] [CrossRef]
- Ghermandi, A. Analysis of intensity and spatial patterns of public use in natural treatment systems using geotagged photos from social media. Water Res. 2016, 105, 297–304. [Google Scholar] [CrossRef]
- Bedimo-Rung, A.L.; Mowen, A.J.; Cohen, D.A. The significance of parks to physical activity and public health—A conceptual model. Am. J. Prev. Med. 2005, 28, 159–168. [Google Scholar] [CrossRef] [PubMed]
- Bjerke, T.; Østdahl, T.; Thrane, C.; Strumse, E. Vegetation density of urban parks and perceived appropriateness for recreation. Urban For. Urban Green. 2006, 5, 35–44. [Google Scholar] [CrossRef]
- Clark, H.; Coll-Seck, A.M.; Banerjee, A.; Peterson, S.; Dalglish, S.L.; Ameratunga, S.; Balabanova, D.; Bhan, M.K.; Bhutta, Z.A.; Borrazzo, J.; et al. A future for the world’s children? A WHO—UNICEF—Lancet Commission. Lancet 2020, 395, 605–658. [Google Scholar] [CrossRef] [Green Version]
- Peters, K. Being Together in Urban Parks: Connecting Public Space, Leisure, and Diversity. Leis. Sci. 2010, 32, 418–433. [Google Scholar] [CrossRef]
- Song, X.P.; Richards, D.R.; Tan, P.Y. Using social media user attributes to understand human—Environment interactions at urban parks. Sci. Rep. 2020, 10, 1–11. [Google Scholar] [CrossRef] [PubMed] [Green Version]
- Peschardt, K.K.; Schipperijn, J.; Stigsdotter, U.K. Use of Small Public Urban Green Spaces (SPUGS). Urban For. Urban Green. 2012, 11, 235–244. [Google Scholar] [CrossRef]
- Reyes-Riveros, R.; Altamirano, A.; de la Barrera, F.; Rozas-Vásquez, D.; Vieli, L.; Meli, P. Linking public urban green spaces and human well-being: A systematic review. Urban For. Urban Green. 2021, 61, 127105. [Google Scholar] [CrossRef]
- Heikinheimo, V.; Tenkanen, H.; Bergroth, C.; Järv, O.; Hiippala, T.; Toivonen, T. Understanding the use of urban green spaces from user-generated geographic information. Landsc. Urban Plan. 2020, 201, 103845. [Google Scholar] [CrossRef]
- Sreetheran, M. Exploring the urban park use, preference and behaviours among the residents of Kuala Lumpur, Malaysia. Urban For. Urban Green. 2017, 25, 85–93. [Google Scholar] [CrossRef]
- Zhang, J.; Tan, P.Y. Demand for parks and perceived accessibility as key determinants of urban park use behavior. Urban For. Urban Green. 2019, 44, 126420. [Google Scholar] [CrossRef]
- Palliwoda, J.; Priess, J.A. What do people value in urban green? Linking characteristics of urban green spaces to users’ perceptions of nature benefits, disturbances, and disservices. Ecol. Soc. 2021, 26, 28. [Google Scholar] [CrossRef]
- Priess, J.; Pinto, L.V.; Misiune, I.; Palliwoda, J. Ecosystem Service Use and the Motivations for Use in Central Parks in Three European Cities. Land 2021, 10, 154. [Google Scholar] [CrossRef]
- Li, F.; Li, F.; Li, S.; Long, Y. Science of the Total Environment Deciphering the recreational use of urban parks: Experiments using multi-source big data for all Chinese cities. Sci. Total Environ. 2020, 701, 134896. [Google Scholar] [CrossRef] [PubMed]
- Matovic, D.; Forgas, J.P. The Answer Is in the Question? Mood Effects on Processing Verbal Information and Impression Formation. J. Lang. Soc. Psychol. 2018, 37, 578–590. [Google Scholar] [CrossRef]
- Sim, J.; Miller, P.; Swarup, S. Tweeting the High Line Life: A Social Media Lens on Urban Green Spaces. Sustainability 2020, 12, 8895. [Google Scholar] [CrossRef]
- Evenson, K.R.; Wen, F.; Hillier, A.; Cohen, D.A. Assessing the contribution of parks to physical activity using global positioning system and accelerometry. Med. Sci. Sports Exerc. 2013, 45, 1981–1987. [Google Scholar] [CrossRef] [Green Version]
- Heikinheimo, V.; di Minin, E.; Tenkanen, H.; Hausmann, A. User-Generated Geographic Information for Visitor Monitoring in a National Park: A Comparison of Social Media Data and Visitor Survey. ISPRS Int. J. Geo-Inf. 2017, 6, 85. [Google Scholar] [CrossRef] [Green Version]
- Martí, P.; Serrano-Estrada, L.; Nolasco-Cirugeda, A. Social Media data: Challenges, opportunities and limitations in urban studies. Comput. Environ. Urban Syst. 2019, 74, 161–174. [Google Scholar] [CrossRef]
- Arribas-Bel, D.; Kourtit, K.; Nijkamp, P.; Steenbruggen, J. Cyber Cities: Social Media as a Tool for Understanding Cities. Appl. Spat. Anal. Policy 2015, 8, 231–247. [Google Scholar] [CrossRef]
- Chen, Y.; Liu, X.; Gao, W.; Wang, R.Y.; Li, Y.; Tu, W. Emerging social media data on measuring urban park use. Urban For. Urban Green. 2018, 31, 130–141. [Google Scholar] [CrossRef]
- Zhang, S.; Zhou, W. Recreational visits to urban parks and factors affecting park visits: Evidence from geotagged social media data Landscape and Urban Planning. Landsc. Urban Plan. 2018, 180, 27–35. [Google Scholar] [CrossRef]
- Dai, P.; Zhang, S.; Chen, Z.; Gong, Y.; Hou, H. Perceptions of Cultural Ecosystem Services in Urban Parks Based on Social Network Data. Sustainability 2019, 11, 5386. [Google Scholar] [CrossRef] [Green Version]
- Sim, J.; Miller, P. Understanding an Urban Park through Big Data. Int. J. Environ. Res. Public Health 2019, 16, 3816. [Google Scholar] [CrossRef] [PubMed] [Green Version]
- Cui, N.; Malleson, N.; Houlden, V.; Comber, A. Using VGI and Social Media Data to Understand Urban Green Space: A Narrative Literature Review. ISPRS Int. J. Geo-Inf. 2021, 10, 425. [Google Scholar] [CrossRef]
- Statista. Available online: https://www.statista.com/statistics/303681/twitter-users-worldwide/ (accessed on 12 November 2021).
- Statista. Available online: https://www.statista.com/statistics/195140/new-user-generated-content-uploaded-by-users-per-minute/ (accessed on 12 November 2021).
- Roberts, H.V. Using Twitter data in urban green space research: A case study and critical evaluation. Appl. Geogr. 2017, 81, 13–20. [Google Scholar] [CrossRef]
- Statista. Instagram. 2021. Available online: https://www.statista.com/statistics/421169/most-followers-instagram/ (accessed on 12 November 2021).
- Statista. Weibo. 2021. Available online: https://www.statista.com/statistics/795303/china-mau-of-sina-weibo/ (accessed on 12 November 2021).
- Liu, Q.; Ullah, H.; Wan, W.; Peng, Z.; Hou, L.; Rizvi, S.S.; Haidery, S.A.; Qu, T.; Muzahid, A.A.M. Categorization of Green Spaces for a Sustainable Environment and Smart City Architecture by Utilizing Big Data. Electronics 2020, 9, 1028. [Google Scholar] [CrossRef]
- Kapoor, K.K.; Tamilmani, K.; Rana, N.P.; Patil, P.; Dwivedi, Y.K.; Nerur, S. Advances in Social Media Research: Past, Present and Future. Inf. Syst. Front. 2018, 20, 531–558. [Google Scholar] [CrossRef] [Green Version]
- Hamstead, Z.A.; Fisher, D.; Ilieva, R.T.; Wood, S.A.; Mcphearson, T.; Kremer, P. Geolocated social media as a rapid indicator of park visitation and equitable park access. Comput. Environ. Urban Syst. 2018, 72, 38–50. [Google Scholar] [CrossRef]
- Kovacs-Gyoeri, A.; Ristea, A.; Kolcsar, R.; Resch, B.; Crivellari, A.; Blaschke, T. Beyond spatial proximity—Classifying parks and their visitors in London based on spatiotemporal and sentiment analysis of Twitter data. ISPRS Int. J. Geo-Inf. 2018, 7, 378. [Google Scholar] [CrossRef] [Green Version]
- Page, M.J.; McKenzie, J.E.; Bossuyt, P.M.; Boutron, I.; Hoffmann, T.C.; Mulrow, C.D.; Shamseer, L.; Tetzlaff, J.M.; Akl, E.A.; Brennan, S.E.; et al. The PRISMA 2020 statement: An updated guideline for reporting systematic reviews Systematic reviews and Meta-Analyses. BMJ 2021, 372. [Google Scholar] [CrossRef]
- Ilieva, R.T.; McPhearson, T. Social-media data for urban sustainability. Nat. Sustain. 2018, 1, 553–565. [Google Scholar] [CrossRef]
- Wu, W.; Clark, M.; Kang, B.; Fine, M. The Use of Sina Weibo and Twitter by International Luxury Hotels. Tour. Cult. Commun. 2017, 16, 137–145. [Google Scholar] [CrossRef]
- Roberts, H.; Sadler, J.; Chapman, L. Using Twitter to investigate seasonal variation in physical activity in urban green space. Geo Geogr. Environ. 2017, 4, e00041. [Google Scholar] [CrossRef]
- Donahue, M.L.; Keeler, B.L.; Wood, S.A.; Fisher, D.M.; Hamstead, Z.A.; McPhearson, T. Using social media to understand drivers of urban park visitation in the Twin Cities, MN. Landsc. Urban Plan. 2018, 175, 1–10. [Google Scholar] [CrossRef]
- Lyu, F.; Zhang, L. Using multi-source big data to understand the factors affecting urban park use in Wuhan. Urban For. Urban Green. 2019, 43, 126367. [Google Scholar] [CrossRef]
- Ullah, H.; Wan, W.; Haidery, S.A.; Khan, N.U.; Ebrahimpour, Z.; Luo, T. Analyzing the spatiotemporal patterns in green spaces for urban studies using location-based social media data. ISPRS Int. J. Geo-Inf. 2019, 8, 506. [Google Scholar] [CrossRef] [Green Version]
- Song, X.P.; Richards, D.R.; He, P.; Tan, P.Y. Does geo-located social media reflect the visit frequency of urban parks? A city-wide analysis using the count and content of photographs. Landsc. Urban Plan. 2020, 203, 103908. [Google Scholar] [CrossRef]
- Song, Y.; Fernandez, J.; Wang, T. Understanding Perceived Site Qualities and Experiences of Urban Public Spaces: A Case Study of Social Media Reviews in Bryant Park, New York City. Sustainability 2020, 12, 8036. [Google Scholar] [CrossRef]
- Ullah, H.; Wan, W.; Haidery, S.A.; Khan, N.U.; Ebrahimpour, Z.; Muzahid, A.A.M. Spatiotemporal Patterns of Visitors in Urban Green Parks by Mining Social Media Big Data Based upon WHO Reports. IEEE Access 2020, 8, 39197–39211. [Google Scholar] [CrossRef]
- Lu, Y.; Zhao, J.; Wu, X.; Lo, S.M. Escaping to nature during a pandemic: A natural experiment in Asian cities during the COVID-19 pandemic with big social media data. Sci. Total Environ. 2021, 777, 146092. [Google Scholar] [CrossRef]
- Liu, R.; Xiao, J. Factors Affecting Users’ Satisfaction with Urban Parks through Online Comments Data: Evidence from Shenzhen, China. Int. J. Environ. Res. Public Health 2021, 18, 253. [Google Scholar] [CrossRef]
- Guan, C.; Song, J.; Keith, M.; Zhang, B.; Akiyama, Y.; Da, L.; Shibasaki, R.; Sato, T. Seasonal variations of park visitor volume and park service area in Tokyo: A mixed-method approach combining big data and field observations. Urban For. Urban Green. 2021, 58, 126973. [Google Scholar] [CrossRef]
- Herman, K.; Drozda, Ł. Green Infrastructure in the Time of Social Distancing: Urban Policy and the Tactical Pandemic Urbanism. Sustainability 2021, 13, 1632. [Google Scholar] [CrossRef]
- Liang, H.; Zhang, Q. Temporal and spatial assessment of urban park visits from multiple social media data sets: A case study of Shanghai, China. J. Clean. Prod. 2021, 297, 126682. [Google Scholar] [CrossRef]
- Sikorska, D.; Łaszkiewicz, E.; Krauze, K.; Sikorski, P. The role of informal green spaces in reducing inequalities in urban green space availability to children and seniors. Environ. Sci. Policy 2020, 108, 144–154. [Google Scholar] [CrossRef]
- Akpinar, A. Urban green spaces for children: A cross-sectional study of associations with distance, physical activity, screen time, general health, and overweight. Urban For. Urban Green. 2017, 25, 66–73. [Google Scholar] [CrossRef]
- Enssle, F.; Kabisch, N. Urban green spaces for the social interaction, health and well-being of older people—An integrated view of urban ecosystem services and socio-environmental justice. Environ. Sci. Policy 2020, 109, 36–44. [Google Scholar] [CrossRef]
- Statista. Available online: https://www.statista.com/statistics/376128/facebook-global-user-age-distribution/ (accessed on 12 November 2021).
- Statista. Available online: https://www.statista.com/statistics/320940/china-sina-weibo-user-breakdown-by-age-group/ (accessed on 2 December 2021).
- Statista. Available online: https://www.statista.com/statistics/325587/instagram-global-age-group/ (accessed on 2 December 2021).
- Statista. Available online: https://www.statista.com/statistics/283119/age-distribution-of-global-twitter-users/ (accessed on 12 November 2021).
- Ranchordás, S. The Digitalization of Government and Digital Exclusion: Setting the Scene. 2020. Available online: https://ssrn.com/abstract=3663051 (accessed on 12 November 2021).
- Stojanovska-Stefanova, A.; Aleksoski, O.; Sopova, M.M. E-government and digital public services: The Macedonian case of digitalization. SocioBrains 2020, 7, 35–52. [Google Scholar]
- Sugiyanta, L. Digitalization Era: Website Based E-Government. In IOP Conference Series Earth and Environmental Science, Proceedings of the International Conference on Public Organization (ICONPO) “The Innovation of Big Data and Artificial Intelligent Technology for Public Sector: A Call for Actions,” Yogyakarta, Indonesia, 13–14 October 2020; IOP Publishing: Bristol, UK, 2021; Volume 717. [Google Scholar] [CrossRef]
- Thakuriah, P.V.; Tilahun, N.; Zellner, M. Seeing Cities through Big Data: Research, Methods and Applications in Urban Informatics; Springer International Publishing: Cham, Switzerland, 2017; pp. 209–217. ISBN 978-3-319-40902-3. [Google Scholar]
- Song, Y.; Chen, B.; Ho, H.C.; Kwan, M.; Liu, D.; Wang, F.; Wang, J.; Cai, J.; Li, X.; Xu, Y.; et al. Observed inequality in urban greenspace exposure in China. Environ. Int. 2021, 156, 106778. [Google Scholar] [CrossRef]

| Study References | Main Objective | Study Area | Sample | Main Results | Advantages | Limitations |
|---|---|---|---|---|---|---|
| Roberts, 2017 [37] | The paper focuses on the method of using social media data to investigate human interaction with urban green spaces | Birmingham, 24 urban parks | 793 tweets | The study shows social media data's potential for better understanding the importance of urban green spaces and the human population. | (1) Compared to traditional methods, tweets are often posted with visual information; (2) Identification of human activities in city parks; (3) Direct messages due to the limited number of characters; (4) Time- and cost-friendly data collection. | (1) Biased information: certain people who go to the park do not use technology; (2) Technical limitations: poor or no internet connectivity and phone coverage; (3) Limited demographic information; (4) social media user privacy settings |
| Roberts et al., 2017 [47] | The paper aims to assess the possibility of using social media data to evaluate the relationship between social and ecological interactions through people's physical activity in urban parks. | Birmingham | 2847 tweets in summer and 1920 in winter | Seasonal variation, weather conditions, and sports events influence park visitation. | (1) Information about spatial coverage; (2) cost- and time friendly data acquisition solution; (3) The information collected from Twitter data reflects the tweeting behaviour of the urban population, taking into account outdoor physical activities associated with seasonal fluctuations. | (1) Biased information: lack of sociodemographic information; (2) The paper uses a small dataset |
| Zhang and Zhou, 2018 [31] | The aim is to assess the factors influencing the intensity of visitation at different parks and to evaluate park visitation's spatial, physical, social, and economic aspects | 127 parks in Beijing | 581,354 check-ins in Weibo from 2012 to 2016 | The number of bus stops and the park's size positively correlate with visits to the park. Vegetation cover and water bodies had no significant effect. Parks that are further from the city centre and community parks have fewer visitors than other parks. | (1) Geotagged social media data improve geographic reach; (2) Social media data provide supplementary information for understanding visitor behaviour. | (1) Weibo users' socio-demographic characteristics may differ from those of the general population; (2) Cultural and large parks may be “checked in” more often than in “less popular” parks. |
| Chen et al., 2018 [30] | The main goal is to understand real-time Tencent user density (RTUD) data use and emphasize the advantage in measuring the temporal and spatial dynamics of urban park use and to identify park attributes that have an impact on park use. | 686 urban parks in Shenzhen | 3.25 million users | The number of park users depends on the development of the area, park attributes, and the surrounding area. Accessibility is not a limiting factor. To increase the number of park visitors, the paper suggests developing more playgrounds, cafés, toilets, parking lots and other facilities. The method was suitable for measuring city-level or large-scale urban green space utilization. | (1) A wide range, a high spatial and temporal resolution, and large amounts of data; (2) Large data sample with financial and time savings; (3) RTUD data cover approximately 93% of the city's total population at hourly intervals with 25 m spatial resolution. | (1) Only available in China; (2) Park users' activities and sociodemographic information are lacking; (3) Because of the 25 m resolution, some green spaces are excluded; (4) Biased information since Tencent app is not suitable for children. |
| Kovacs- Gyoeri et al., 2018 [43] | The study aims to show the potential of social media based on park visitor data for urban planning purposes. | 1700 parks, London, UK | 78,000 tweets | Park visitors tweets 3–4 km from their place of activity. Park users are more likely to tweet positive reviews about city parks. Researchers identified four city park clusters based on the visitor type, emotion, behaviour, and temporal patterns using Twitter data. | (1) Large data sample; (2) High-quality and detailed information throughout the city as input for in-depth and precise research. | (1) Urban people are more likely to tweet about exceptional experiences than typical experiences; (2) Limited demographic information about park visitors; (3) A negligible number of tweets per user regarding the use of park infrastructure. |
| Donahue et al., 2018 [48] | The main objective is to overcome the challenges of the field survey method by using social media data to forecast park visitation. | 1581 urban, peri-urban parks in the Twin Cities Metropolitan Area in Minnesota, USA | Survey data n = 76 Photo user days n = 753 Tweet user- days n = 1388 | Park visitors tweets 3–4 km from their place of activity. Park users are more likely to tweet positive reviews about city parks. Researchers identified four city park clusters based on the visitor type, emotion, behaviour, and temporal patterns using Twitter | (1) GSM (geotagged social media) data can provide urban planners and researchers with details and tendencies on entertainment patterns; (3) Low cost compared to field surveys. | (1) Social media data tend to be biased towards young, wealthy, tech-savvy people; (2) A potential limitation where geotagged social media data are not currently available. |
| Hamstead et al., 2018 [42] | The research aims to explore the benefits of geolocated social media data over field surveys for identifying indicators of park visitation. | New York City | 2143—yearly mean of Flicker user days; 2133—yearly mean of Twitter user days | The results of the paper show that water bodies, sport facilities, the distance to bike paths and public transport positively affect urban park visitation. The presence of Wi-Fi might have an influence on a higher number of posts on social media. Crime has no impact on park visitation. | Additional data or alternative options for regularly measuring parks' visits | (1) Gender and age imbalances of USA social media users; (2) The limited understanding of city parks can be incorporated into daily life; (3) Restricted internet connectivity may affect the use of social media. |
| Sim and Miller, 2019 [33] | This paper studies urban park planning and design by using big data to understand user activities and satisfaction with those activities in parks. | The Gyeongui Line Forest Park (Seoul) | 177 responses from the onsite survey 3703 tweets | Survey and social media data show that parks primarily improve positive experiences and user satisfaction with activities (emotions), and parks improve social interactions within the park. Both datasets represent different | (1) Can complement the design and planning process; (2) Social media and big data can help to identify new types of activity in a park. | (1) Tweets are more frequent when park users are with friends; (2) Biased information. |
| Lyu and Zhang, 2019 [49] | The study aims to identify the patterns of park use in the central part of the city, to compare the two datasets and to assess which is more appropriate for characterizing the parks in Wuhan, and to identify the factors that determine the use of parks in the city. | 57 urban parks in Wuhan | Weibo 101,000 user check-ins; Baidu heat map | Analysis of Weibo check-in data showed that greenness in the park positively correlates with park visitation. The Baidu heat map identified the surrounding area, population density, and the accessibility of parks as essential attributes for park visitors. | Convenient and low cost | (1) Geospatial data have limitations in measuring human activity; (2) Weibo data were inadequate to explain the use of Wuhan's common city parks. |
| Ullah et al., 2019 [50] | The paper's goal is to study how green space visits affect user check-in behaviour | 157 parks in Shanghai, China | 30,000 Weibo user check-ins | The most important result is that city parks near the city centre have many visitors, peak visits from 4 p.m. to 10 p.m., and more on weekends than on weekdays. Seasonality influences the visitors number, which rises in spring and summer. | Details of qualitative and large-scale data extraction for the entire city. | (1) The number of check-ins per user of the social media platform is small; (2) Gender-based biased information. |
| Song et al., 2020 [15] | The research aims to investigate the city's variation in recreation behaviour at public parks based on the photographs taken at these locations. | Singapore | 94,890 photographs, uploaded by 4674 Flickr users between February 2004 and March 2018 | Flickr data can help understand public behaviour in urban green spaces. The results show that locals tend to spend time in urban parks and nature. | The shared geotagged photos represent a person's experience in one place and show the use and pleasure of the park. | Sample population representativeness, data protection concerns, and data quality. |
| Heikinheimo et al., 2020 [18] | The study aims to assess what valuable information on urban green spaces from different user-generated datasets can be used for urban planning. | Green spaces in Helsinki | Flickr API: 29 287 records from 902 users Instagram: 602 466 records from 113 754 users Twitter: 31 359 records from 5386 users Helsinki 2050 survey Questionnaire: 939 records from 1385 participants Strava Sports tracking application: 161 946 records from 4044 usersv | Understanding green space usage and preferences is enhanced by using social media data that complement traditional data sources. These data indicate leisure habits and allow further content analysis. Sports tracking data provide information on the type of activity of park visitors. GSM data provide spatial information but no data on park visitor activity. The questionnaire makes it possible to directly with park visitors, enabling a deeper understanding of park attendance. | Social media complement traditional data sources and provide additional insights into park usage and more detailed information about locations and times. | (1) Biased information; (2) Data access barriers; (3) Ethical questions |
| Li et al., 2020 [23] | To identify which park attributes and how accessibility and the socioeconomic environment influence the frequency of Weibo check-ins. | 3759 parks located in all 287 cities across China | 2.77 million Weibo check-ins | The results show that similar numbers of visitors are found in similar cities. The number of bus stops, the availability of more services, and the landscape morphology impact the intensity of visits to parks. | (1) Provide cost and labour efficiency; (2) Large number of social media users. | (1) Biased information; (2) The ratio of check-in visitors to the actual number of park visitors depends on the city. |
| Sim et al., 2020 [25] | The paper examines elevated parks using social media data. | The High Line Park in New York and the 606 in Chicago | 12,952 tweets from the 606 and 165,347 tweets from the High Line | Cycling and walking were the most often mentioned activities on social media platforms. Seasonality and social activities impact the number of park visits. Parks have more positive sentiments than negative sentiments. | Provides an understanding of parks with elevated parks. | Population bias: users are more likely to be young, white, and male. |
| Song et al., 2020 [51] | This study in Singapore studies park visitation using geo-located photographs in park areas. | Singapore | 325,173 records from Instagram 94,890 records from Flickr 2000 household surveys | Social media can provide a reasonable estimate of a park's popularity, but future research is still needed. The results indicate that many photos posted on social media include pedestrian facilities, improved urban infrastructure, public transportation, land cover such as waterfronts in and around the park, and natural vegetation. Park size was not a significant attribute for a higher number of posts. | (1) Helps to understand the differences between the parks that each online user prefers; (2) Large-scale study; (3) The combination of several datasets can be a solution to overcome bias. | Instagram has access restrictions on application programming interfaces (APIs), limiting the data available for research purposes. |
| Song et al., 2020 [52] | This study focuses on the perceptions of Bryant Park in New York City using social media review data. | Bryant Park in New York City | 11,419 TripAdvisor reviews from 10,615 users | This analysis shows the potential for online reviews to comprehend and track the perceptions of park users. Weekdays are more critical than weekends for daily recreational activities in Bryant Park. The use of general park facilities is expected to increase on weekends and during the year's warmer months. | (1) Reviews provide long-term information; (2) They can provide a more complete and fairer expression of location awareness. | (1) Potential bias in demographic selection; (2) Fake accounts, missing data, misclassification; (3) Determination between tourists and locals. |
| Ullah et al., 2020 [53] | The study aims to show policymakers the benefits of urban parks for residents and their health and to provide methodological solutions to ensure accessibility to parks | 115 green parks in 10 districts of Shanghai | Approximately 250,000 check-ins on Weibo from July 2014 to June 2017 | The number of visitors is increasing year by year near the boundaries of downtown Shanghai. Check-in data can provide more information on extraordinary situations than traditional data. Visits to parks increase on weekends and during the warmer months of April, May and June. | Weibo check-in data are time efficient and provide solid spatial coverage. | The representativeness of social media and actual park visitor data may vary among different parks. |
| Lu et al., 2021 [54] | The paper aims to determine changes in park visitation and which parks were visited before and during the pandemic. | Hong Kong, Singapore, Tokyo, and Seoul | Instagram users: Tokyo (n = 38,138); Singapore (n = 21,942); Seoul (n = 20,867); Hong Kong (n =19,285) | Weekly new cases increase the chances of using green space. People prefer a large natural park near the centre and visit it frequently during the holiday week. Weather has an impact on park visitation. | Large data samples improve the trustworthiness and robustness of the study outcomes. | (1) Lack of personal demographic and socio-economic data due to data protection; (2) Differentiating a tourist from a local is complicated; (3) Social media users tend to be young. |
| Liu and Xiao, 2021 [55] | The aim is to investigate possible reasons for people's satisfaction with parks based on the Dianping dataset. | Shenzhen (79 comprehensive parks) | 11,272 comments from Dianping from June 2011 to June 2020 | Nine factors, i.e., the signage system, facility and plant maintenance, mosquitoes, the cleanliness of the environment, air quality, vegetation, park size, landscape image quality, and recreational facilities, explain park visitors' satisfaction in Shenzhen. | Financial and time savings and an unlimited number of words. | (1) Biased information; (2) The population without the internet is not included in the study |
| Guan et al., 2021 [56] | The study focuses on how monthly and seasonal changes influence visitor numbers and the spatial parameter in parks and the park service area (PSA). | 23 wards of the Tokyo metropolitan area | 1.5 million cell phone IDs 1557 reviews from the Jalan review platform | The number of visitors varied by seasonal, and the degree of variation ranged from park to park. The study identified three types of park visitors: those who live nearby, travel through the park to their destination, and visit the park for an event. The spatial characteristics of a park were closely associated with seasonal cultural events and visitor perceptions. | Jalan details park visitors' perceptions and reactions to seasonality and the relationship to the park's spatial environment. | Small sample size for determining the visitation and demographic information of park visitors. |
| Herman and Drozda, 2021 [57] | The study aims to research the impact of urban green infrastructure during the COVID-19 pandemic. | Wellington, New Zealand, and Warsaw, Poland | In-depth interviews (n = 12) Miramar: 63 posts by 50 individual users during level 3 and 4 lockdowns (23rd March to 13th May) Polińskiego Park: 81 photos posted by 63 different Instagram users from the beginning of March to the end of June 2020 | The results show that it was only after the quarantine was declared that park attendance dropped. However, with the loosened quarantine restrictions, attendance at parks increased as other attractions such as cinemas were still closed. | Conveys an understanding of user activity during the COVID-19 lockdown in city parks | Small number of pictures related to the pandemic. |
| Liang and Zhang, 2021 [58] | This study aims to assess the visitation of urban parks using multiple social media data. | 300 urban parks in Shanghai | DZDP 61,212 visit number Ctrip (with Sum(SUD) of 21,411 Weibo in (with Sum(SUD) of 33,123 | People preferred parks in the heart of space and visited parks during the spring and holidays. The layout of the parks in the city impacts the intensity of park visitation, with parks closer to the city centre receiving a higher number of visitors. However, parks further away from the city receive higher and better feedback. Park visitation activity is directly related to population density | (1) Low cost; (2) Multiple social media data sources in different regions can be used to investigate all users or parks. | (1) Overlapping users and data; (2) Data only from a one-year period. |
Publisher’s Note: MDPI stays neutral with regard to jurisdictional claims in published maps and institutional affiliations. |
© 2022 by the authors. Licensee MDPI, Basel, Switzerland. This article is an open access article distributed under the terms and conditions of the Creative Commons Attribution (CC BY) license (https://creativecommons.org/licenses/by/4.0/).
Share and Cite
Zabelskyte, G.; Kabisch, N.; Stasiskiene, Z. Patterns of Urban Green Space Use Applying Social Media Data: A Systematic Literature Review. Land 2022, 11, 238. https://doi.org/10.3390/land11020238
Zabelskyte G, Kabisch N, Stasiskiene Z. Patterns of Urban Green Space Use Applying Social Media Data: A Systematic Literature Review. Land. 2022; 11(2):238. https://doi.org/10.3390/land11020238
Chicago/Turabian StyleZabelskyte, Gabriele, Nadja Kabisch, and Zaneta Stasiskiene. 2022. "Patterns of Urban Green Space Use Applying Social Media Data: A Systematic Literature Review" Land 11, no. 2: 238. https://doi.org/10.3390/land11020238
APA StyleZabelskyte, G., Kabisch, N., & Stasiskiene, Z. (2022). Patterns of Urban Green Space Use Applying Social Media Data: A Systematic Literature Review. Land, 11(2), 238. https://doi.org/10.3390/land11020238