Article

Did Polycentric and Compact Structure Reduce Carbon Emissions? A Spatial Panel Data Analysis of 286 Chinese Cities from 2002 to 2019

1
School of Architecture, Southeast University, Nanjing 210096, China
2
School of Design and Architecture, Zhejiang University of Technology, Hangzhou 310023, China
*
Author to whom correspondence should be addressed.
Land 2022, 11(2), 185; https://doi.org/10.3390/land11020185
Submission received: 9 January 2022 / Revised: 22 January 2022 / Accepted: 23 January 2022 / Published: 24 January 2022
(This article belongs to the Special Issue The Eco-Environmental Effects of Urban Land Use)

Abstract

:
Curbing carbon emissions by restricting economic growth could decrease human well-being across the world and especially in developing countries, suggesting that we need to find alternative approaches to reducing carbon emissions. Against this background, this paper investigates the relationship between urban spatial structure and carbon emissions in the Chinese context from 2002 to 2019. Specifically, urban spatial structure of 286 Chinese cities, represented by the two dimensions of polycentricity and compactness, are calculated based on the gridded (1 km × 1 km) LandScan dataset on population, while carbon emissions of these cities are aggregated from the gridded (1 km × 1 km) Open-source Data Inventory for Anthropogenic CO2 (ODIAC) dataset on carbon emissions. The empirical results based on different regression models find that overall (1) more dispersed and less monocentric (i.e., less compact and more polycentric) cities are often associated with lower levels of carbon emissions, ceteris paribus; (2) the impact of polycentricity on carbon emissions could be moderated by the economic development levels of Chinese cities. For cities with gross domestic product of more than 173 billion yuan, a more polycentric spatial structure is usually associated with a higher level of carbon emissions; (3) a city’s urban spatial structure could have positive spatial spillovers on carbon emissions of its neighboring cities.

1. Introduction

Carbon emissions caused by various human activities are highly correlated with economic development which has been widely recognized as a main approach to improving human well-being [1]. However, as countries need to rely on economic growth to improve human well-being, it can be expected that carbon emissions across the world would continue to increase in the near future, although many countries have taken measures to curb carbon emissions. This suggests that we should pay more attention to alternative approaches to reducing carbon emissions without influencing economic development and decreasing human well-being.
In fact, recent years have seen a growing number of studies that have investigated the factors influencing carbon emissions. These factors include but are not limited to economic growth [2,3,4], energy intensity [5], urbanization rate [6,7,8], technological progress [9,10], industrial structure [4,9,10,11], etc. For instance, some studies have found that urbanization has an inverse U-shaped curve relationship with carbon emissions [6,7], while others have observed a direct and positive relationship between urbanization rate and carbon emissions [8]. In terms of industrial structure, a recent study has found that carbon emissions are negatively related with the outputs of agriculture, manufacturing, and transportation industries, and positively related with those of construction, retail, and accommodation industries [11]. However, another study has observed that the share of the tertiary industry contributes significantly to reducing carbon emissions [10]. Overall, although the impacts of some factors on carbon emissions are inconsistent in the literature, it has been evident that carbon emissions are highly related with socioeconomic factors.
In addition to the above-mentioned socioeconomic factors, recent studies have argued that urban forms and urban spatial structure are related with carbon emissions, and they should be considered when we discuss strategies to curb carbon emissions [3,12,13,14,15,16]. According to the International Energy Agency, urban areas account for ~67% of worldwide energy consumption and 71% of global carbon emissions [17]. Therefore, how cities are organized and laid out plays a critical role in reducing carbon emissions. In fact, urban forms and urban spatial structure could influence carbon emissions through many indirect mechanisms such as transportation and traveling [18], the urban heat island effect [19], household-level carbon emissions [12,20], etc.
Within the literature, indicators that are often used to represent urban forms and urban spatial structure include population density, urban size, urban compactness, and urban polycentricity. In terms of population density, one study focusing on 125 largest urbanized areas in the U.S. has found that a higher population density contributes to reduced residential energy consumption and thus the associated carbon emissions from household travel [12]. A recent study on carbon emissions of Chinese provinces has further observed heterogenous impacts of population density on per capita carbon emissions, with the elasticity of population density being positive in economically less-developed provinces and negative in developed provinces [21]. The influence of urban size (usually represented by population size) on carbon emissions has been found to be consistent in the literature. Many studies have observed a proportional scaling relationship between carbon emissions and urban population size [15,22,23]. More recently, a growing number of studies have paid attention to investigating how other dimensions of urban spatial structure (i.e., urban compactness and polycentricity) could influence carbon emissions. In contrast to dispersed cities, compact cities usually have relatively higher levels of densities and mixed land use, which could help protect urban green spaces and mitigate urban heat island effects [24]. However, while some empirical studies have shown that more compact cities are usually associated with lower carbon emissions [25,26], others have found that the impact of urban compactness on carbon emissions is relatively modest [27,28]. Similarly, the relationship between urban polycentricity and carbon emissions is also inconclusive. On the one hand, some studies have argued that polycentric urban development could help reduce vehicle miles traveled, public transit use, and urban heat island effects, thus reducing energy consumption and carbon emissions [18,19]. For instance, a recent study based on 232 Chinese cities has shown a positive impact of urban polycentricity on improving carbon emission efficiency [29]. On the other hand, some studies have found that polycentric urban development does not necessarily reduce carbon emissions because the impact of urban polycentricity on commuting and household-level energy consumption remains unclear [20]. In fact, some studies have only observed a marginally significant or even insignificant impact of polycentric urban development on carbon emissions [15,23].
It is obvious to see that empirical findings on how carbon emissions could be influenced by different dimensions of urban spatial structure and by urban compactness and polycentricity in particular are still inconsistent. Despite these inconclusive findings, we argue that the existing literature on the relationship between carbon emissions and urban spatial structure could be further enriched by considering the following two aspects. First, given that cities are usually at different development stages, it could be of great significance to investigate whether the impact of urban spatial structure on carbon emissions is heterogenous across cities. In fact, it has been observed in the Chinese context that the impact of polycentricity on traffic congestion is negative in smaller cities but positive in larger cities [30]. Other studies have shown that the influence of polycentricity on economic productivity [31] and air pollution [32] is also heterogeneous across Chinese cities. Second, as carbon emissions are often spatially correlated, it is therefore necessary to investigate whether the impact of urban spatial structure on carbon emissions has spatial spillovers. Obviously, understanding such spatial spillovers would help make differentiated and targeted mitigation policies especially for China where cities differ a lot in terms of urban spatial structure and development stages. In fact, some studies investigating the impact of socioeconomic factors on carbon emissions have already considered spatial dependence and heterogeneity [10,33,34].
To bridge the above-mentioned research gaps, this paper mainly adopts a spatial econometric approach to investigating the impact of urban spatial structure, represented by urban compactness and polycentricity, on carbon emissions of 286 Chinese cities from 2002 to 2019 which include all Chinese cities at the prefecture level and above. The empirical findings of this paper imply that carbon emissions at the city level could be reduced by optimizing urban spatial structure. Such an approach might have relatively little impact on human well-being, compared with the way to curbing carbon emissions by restricting economic growth.

2. Materials and Methods

2.1. Estimating Carbon Emissions of Chinese Cities

Statistics on carbon emissions at the city level are publicly unavailable in China, which has to some extent hindered scholars in investigating the driving factors of carbon emissions of Chinese cities. To overcome such data deficiencies, some studies have developed various approaches to estimate carbon emissions at the city level, such as the DMSP/OLS (Defense Meteorological Satellite Program—Operational Linescan System) nighttime light imagery approach [29,33,35] and the aggregation approach based on the Fossil Fuel Data Assimilation System [23].
Following the approaches of previous studies, this paper aggregates carbon emissions of 286 Chinese cities from the Open-source Data Inventory for Anthropogenic CO2 (ODIAC) dataset, which is a global high-resolution emission data product for fossil fuel carbon dioxide emissions [36,37]. The ODIAC dataset was originally developed under the Greenhouse gas Observing SATellite (GOSAT) project at the National Institute for Environmental Studies (NIES), Japan. It estimates the global spatial extent of fossil fuel carbon dioxide emissions at the 1 km × 1 km level by combining the use of space-based nighttime light data and individual power plant emission/location profiles and through an innovative emission modeling approach. Due to its detailed and gridded estimation of carbon dioxide emissions, recent years have seen a growing number of studies that have used the ODIAC dataset for a variety of research applications [36,38]. The details of the ODIAC emission model/data product are described elsewhere [37,39].
As the ODIAC dataset reports carbon dioxide emissions at the 1 km × 1 km level, we aggregate the values of each grid to the city level by using the administrative boundary of each Chinese city. Thus, we can obtain detailed values of carbon emissions for each Chinese city. To validate these estimated values of carbon emissions, we selected some sample cities with statistical data on carbon emissions. A comparison between the estimated values with the statistical values of these cities reveals a correlation coefficient of 87.2%, indicating that the approach adopted in this paper is feasible and reliable.

2.2. Measuring Urban Polycentricity and Compactness

In this study, we measure urban polycentricity and compactness from the perspective of population distribution and based on the LandScanTM High-Resolution Global Population Dataset. The LandScan dataset, which contains detailed gridded population data at approximately 1 km × 1 km level, has been widely used in recent studies on measuring urban spatial structure [30,31,32,40]. However, we also acknowledge the shortcomings of the use of the LandScan dataset. For instance, it can only reflect the spatial distribution of population centers rather than employment centers. Due to space constraints, we must limit our discussion of such shortcomings in this paper; however, a detailed discussion can be found in [30,31].
To measure urban polycentricity and compactness, we need to identify population centers (if any) of each city first. Here, we follow the existing literature and adopt the exploratory spatial data analysis (ESDA) approach to identifying each city’s population center(s) [30,31]. The ESDA approach can reveal the distribution characteristics of spatial data, such as global spatial autocorrelation and local spatial autocorrelation [41]. In this paper, the LandScan population grids of each city are classified into four types based on the local Moran’s I index (LISA) results which are generated by the ESDA approach. The four types of grids include (1) the LL-type grids which are low population density grids surrounded by low population density grids; (2) the LH-type grids which are low population density grids surrounded by high population density grids; (3) the HH-type grids which are high population density grids surrounded by high population density grids; and (4) the HL-type grids which are high population density grids surrounded by low-population density grids. Among the four types of grids, only the HH-type grids are selected as component parts of potential population centers. Furthermore, we combine the HH-type grids into continuous areas based on the criterion of rook continuity. As a population center should be of certain size, we follow previous studies to filter out areas with relatively smaller size (<2 km2) and lower population (<50,000 inhabitants) [30]. For each city, the most populous area is regarded as the main center while other areas are sub-centers.
There are many approaches to measuring urban polycentricity and compactness based on the identification of population center(s), which have been discussed in the reference [30,31]. In this paper, we follow the approach adopted in [31]. A city is regarded as more polycentric when its population subcenters are relatively more important. Similarly, a city is considered more compact when the share of population living in its subcenters to its total population is relatively higher. Therefore, the respective measurement of polycentricity and compactness is defined as follows:
P o l y = 1 σ o b s σ m a x = 1 i = 1 n p i d i p i d i ¯ 2 n p m a x d m a x / 2
C o m p = 1 p c e n t e r p t o t a l
where P o l y and C o m p represent the degree of urban polycentricity and compactness respectively; p i and d i denote the population size of center i and its straight distance to the main center respectively; p m a x and d m a x represent the population size of the main center and the largest distance from a subcenter to the main center. The product of p i and d i represents the “importance” of population center i, while p i d i ¯ is the average “importance” of a city’s all population centers; σ o b s is the standard deviation of “importance” of a city’s all population centers; σ m a x is the standard deviation of “importance” in a hypothetical city which only has one center with the maximum observed “importance”; p c e n t e r and p t o t a l denote the population living in a city’s all population centers and the city’s total population, respectively. By definition, the values of Poly and Comp range from 0 to 1. The higher the values of Poly and Comp, the more polycentric and compact a city’s spatial structure. Accordingly, we can also measure the degree of monocentricity and dispersion for each city as follows:
M o n o = 1 P o l y
D i s p = 1 C o m p
where M o n o and D i s p represent the degree of monocentricity and dispersion, respectively. By definition, the values of M o n o and D i s p also range from 0 to 1. The higher the values of M o n o and D i s p , the more monocentric and dispersed a city’s spatial structure.

2.3. Regression Models

We employ a panel model specification to estimate the impact of urban spatial structure on carbon emissions of Chinese cities.
ln e m i s s i o n i t = α + X i t β + μ i + γ t + ε i t
where the dependent variable e m i s s i o n i t represents the total carbon emissions of city i in year t . The vector X i t includes two key independent variables m o n o i t and d i s p i t which reflect the degree of monocentricity and dispersion, respectively. Note that we use the degree of monocentricity and dispersion rather than the degree of polycentricity and compactness. This is because we cannot take logarithm of the values of the degree of polycentricity and compactness which contain a lot of zeros. Other independent variables are control variables referring from the existing literature. μ i and γ t represent the city fixed effect and year fixed effect, respectively. ε i t is the random error term. Additionally, the natural logarithm of all variables is taken to control for non-stationarity and heteroskedasticity issues.
Other control variables are chosen mainly from the perspective of socioeconomic factors [2,3,4]. Specifically, ln_GDP, which represents gross domestic product of a city, describes the productivity scale and level of the development and controls for the basic impact of economic development [2]. The total retail sales of consumer goods (ln_consume) is used to reflect the consume capacity of city [9,10,11]. The last two variables (ln_popu_den, ln_road_den) control for the level of social development and construction. Specifically, ln_popu_den reflects the population density of the whole city [13]. ln_road_den represents the transportation infrastructure level which is measured by the length of road per square kilometer [26].
Data on ln_GDP and ln_consume are directly derived from China City Statistical Yearbooks, while ln_popu_den are collected from China Urban Construction Statistical Yearbooks. The length of road which is used to calculate ln_road_den is collected from the relevant statistical yearbooks of the Chinese cities or provinces. We constructed a balanced panel data for 286 cities at the prefecture level and above in mainland China spanning eighteen years (2002–2019). It should be noted that data of some control variables of sample city have missing values due to the adjustment of administrative division and statistical omissions. The descriptive statistics of variables are shown in Table 1.

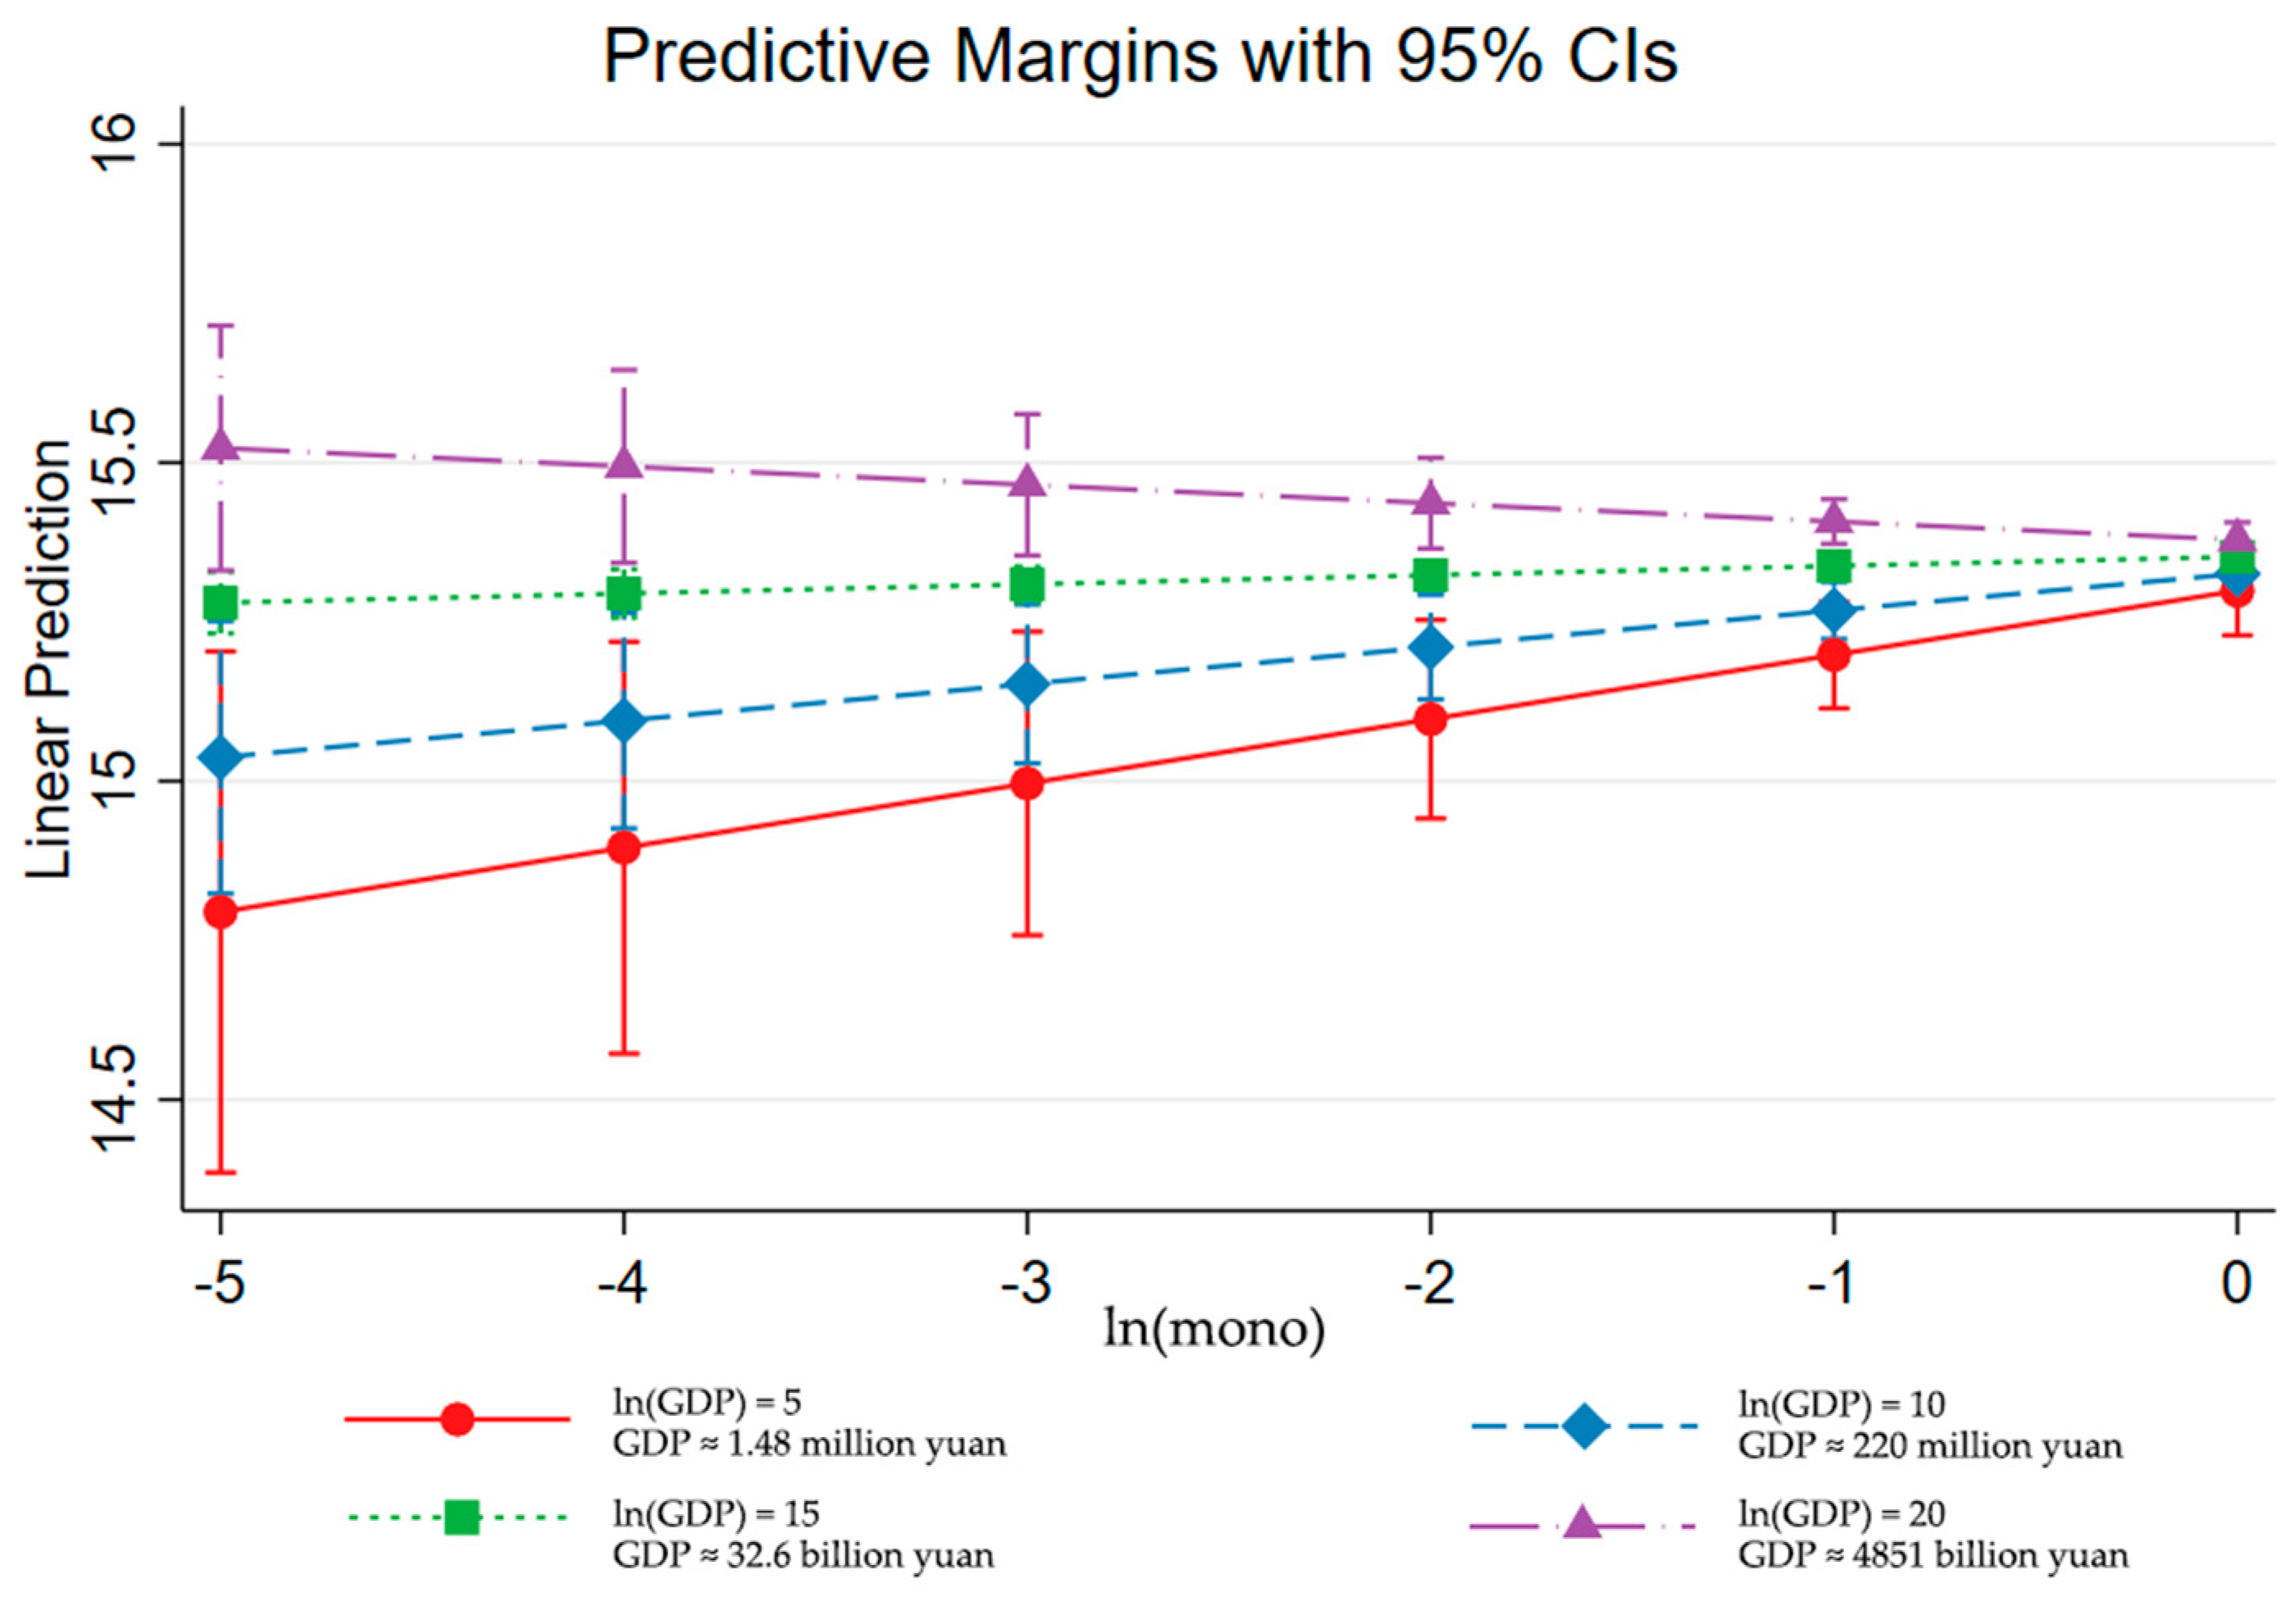
2.4. Moderating Effect and Spatial Effect

Given that the marginal effect of key independent variables in the liner regression model may be nonlinear or can be influenced by some factors, we add the interaction term (ln_GDP × ln_mono) to reflect the interaction effect or the moderating effect of the urban spatial structure on carbon emissions.
We also consider the spatial spillovers of the effects of urban spatial structure on carbon emissions by adopting the Spatial Dubin Model (SDM) which is described as follows:
ln e m i s s i o n i t = α + X i t β + W X i t δ + μ i + ε i t
where X i t is also the vector including independent variables. W X represents spatial interaction effects among explanatory variables. W is an n × n spatial weight matrix that characterizes the spatial relationship of city units of the sample. The selection of spatial weight matrix is sensitive unless model is well specified [42]. We use inverse distance spatial weight matrix reflecting the distance relationship in our basic model, which avoid information loss caused by the islanding effect of some sample cities and yields relatively stable results. μ i is used to control city fixed effect and ε i t is the random disturbance term as well.

3. The Evolution of Carbon Emissions and Urban Spatial Structure of Chinese Cities

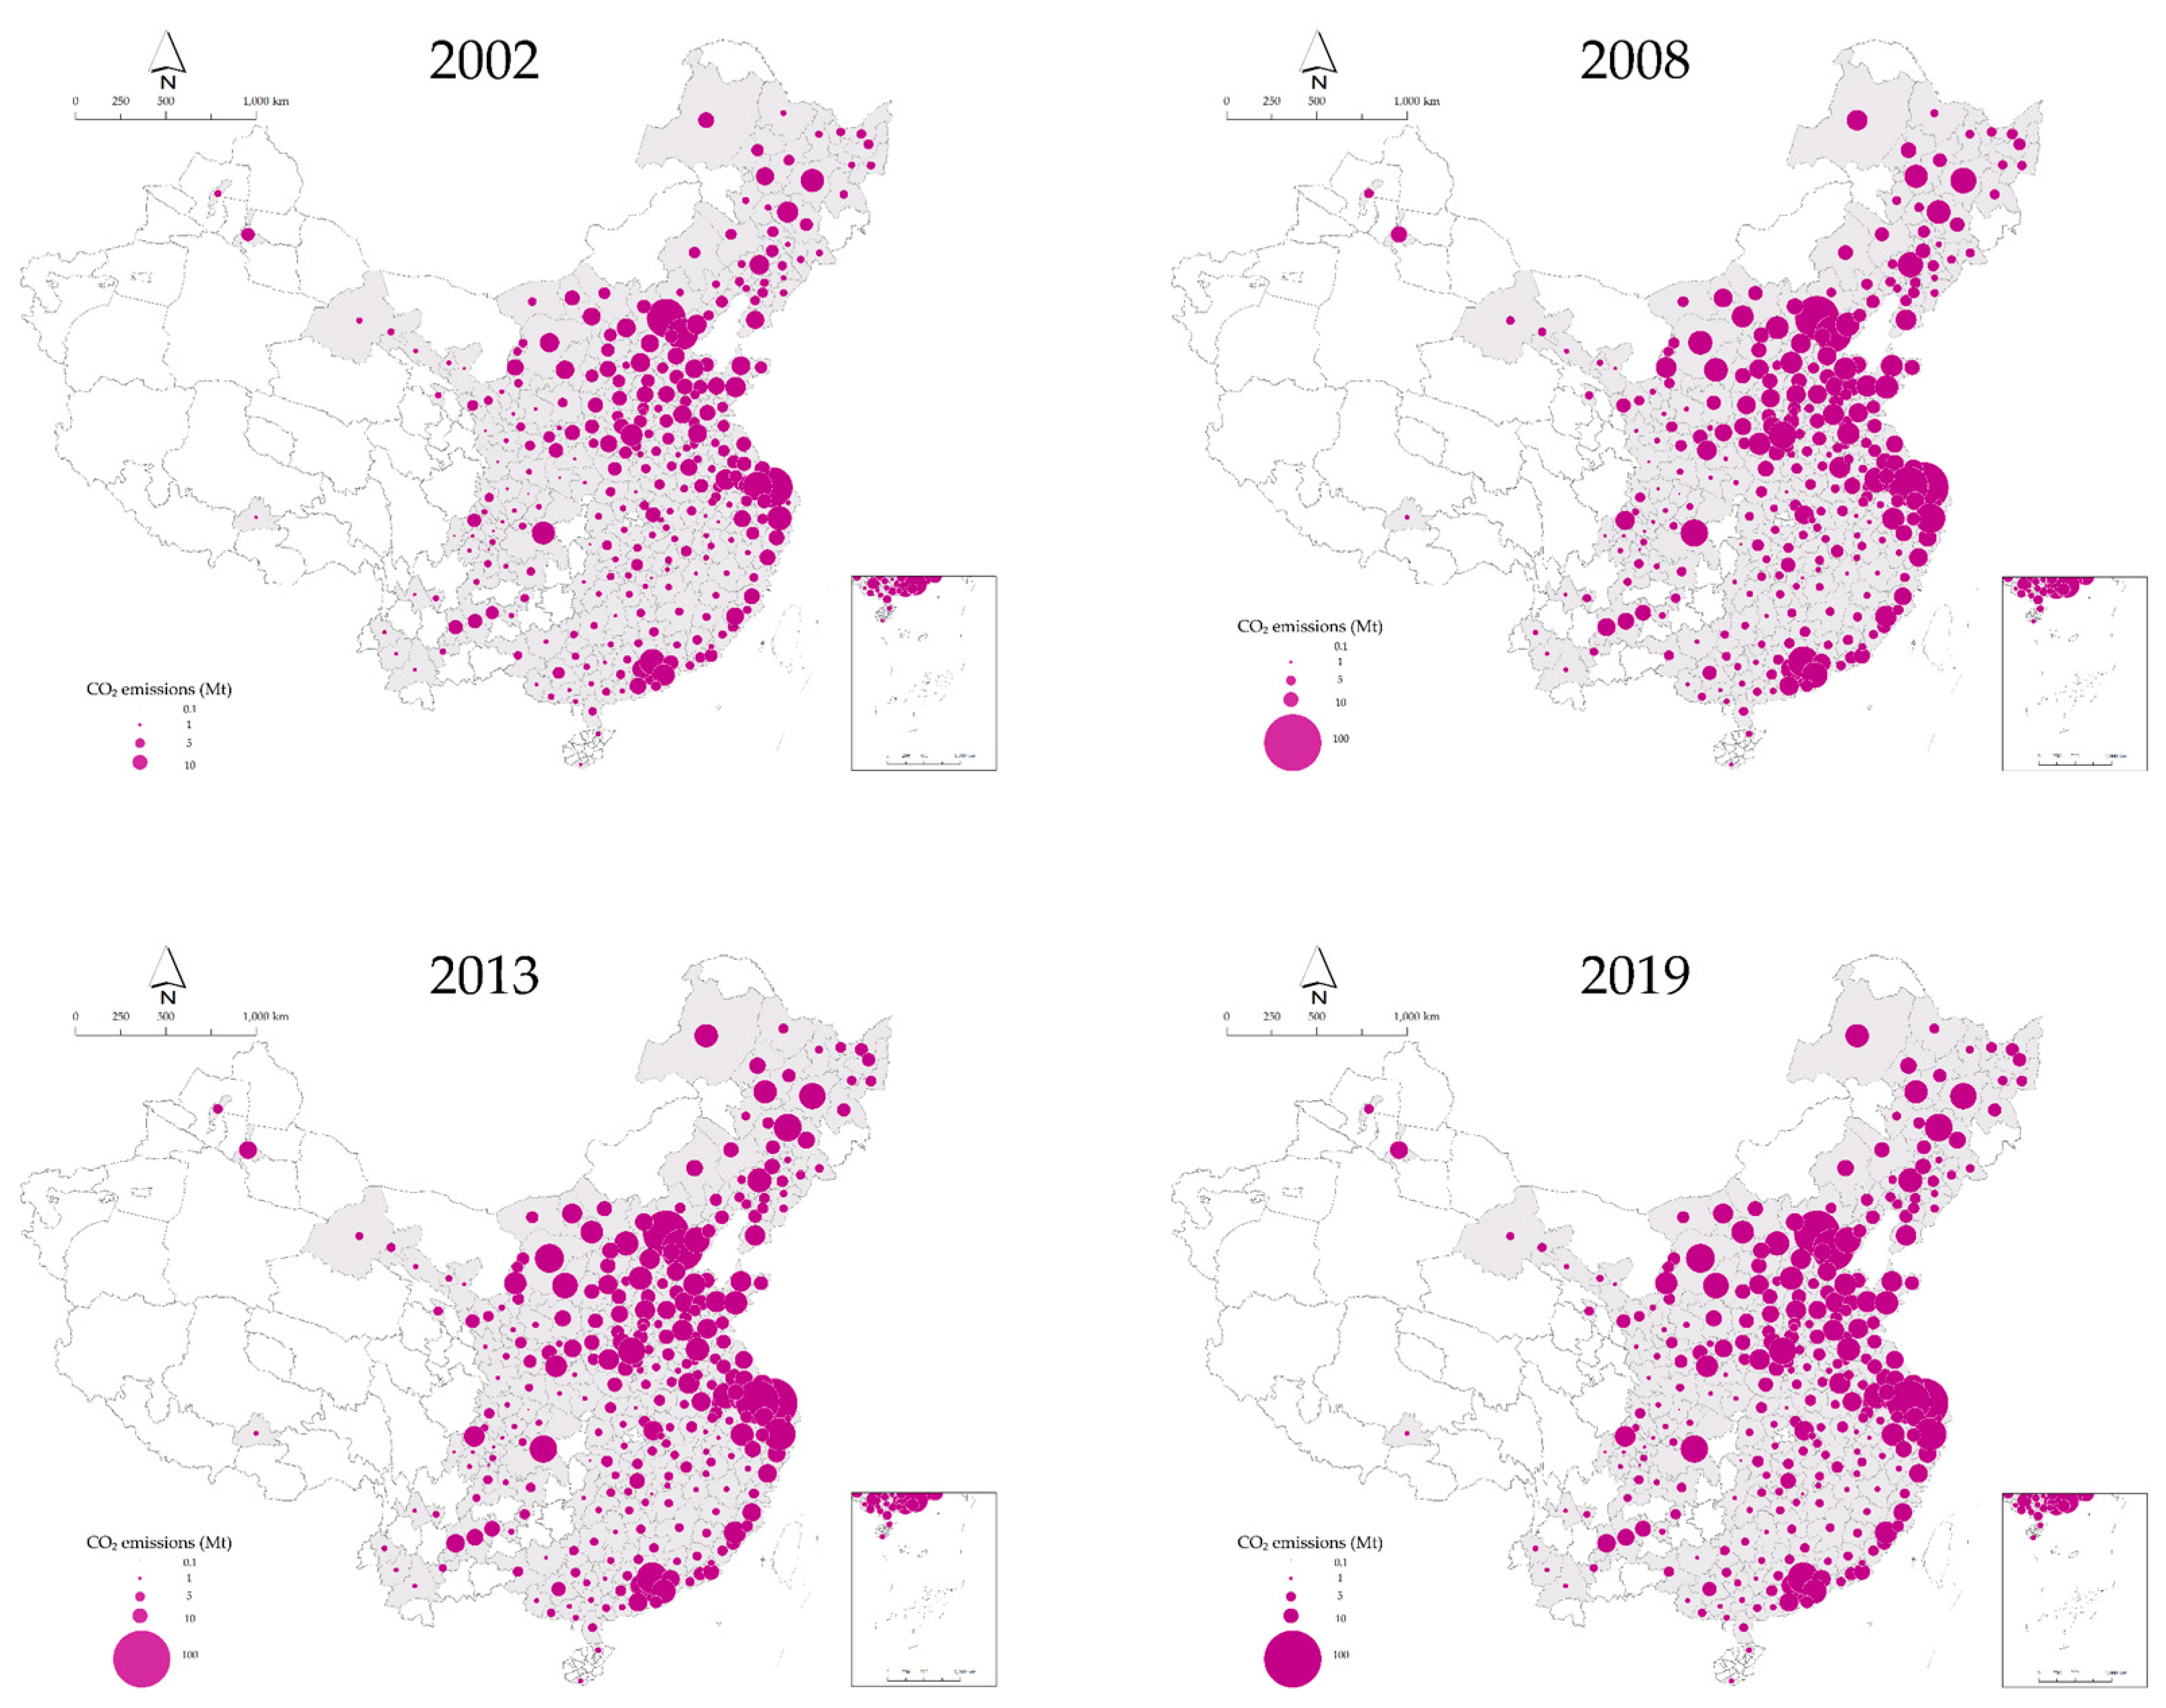
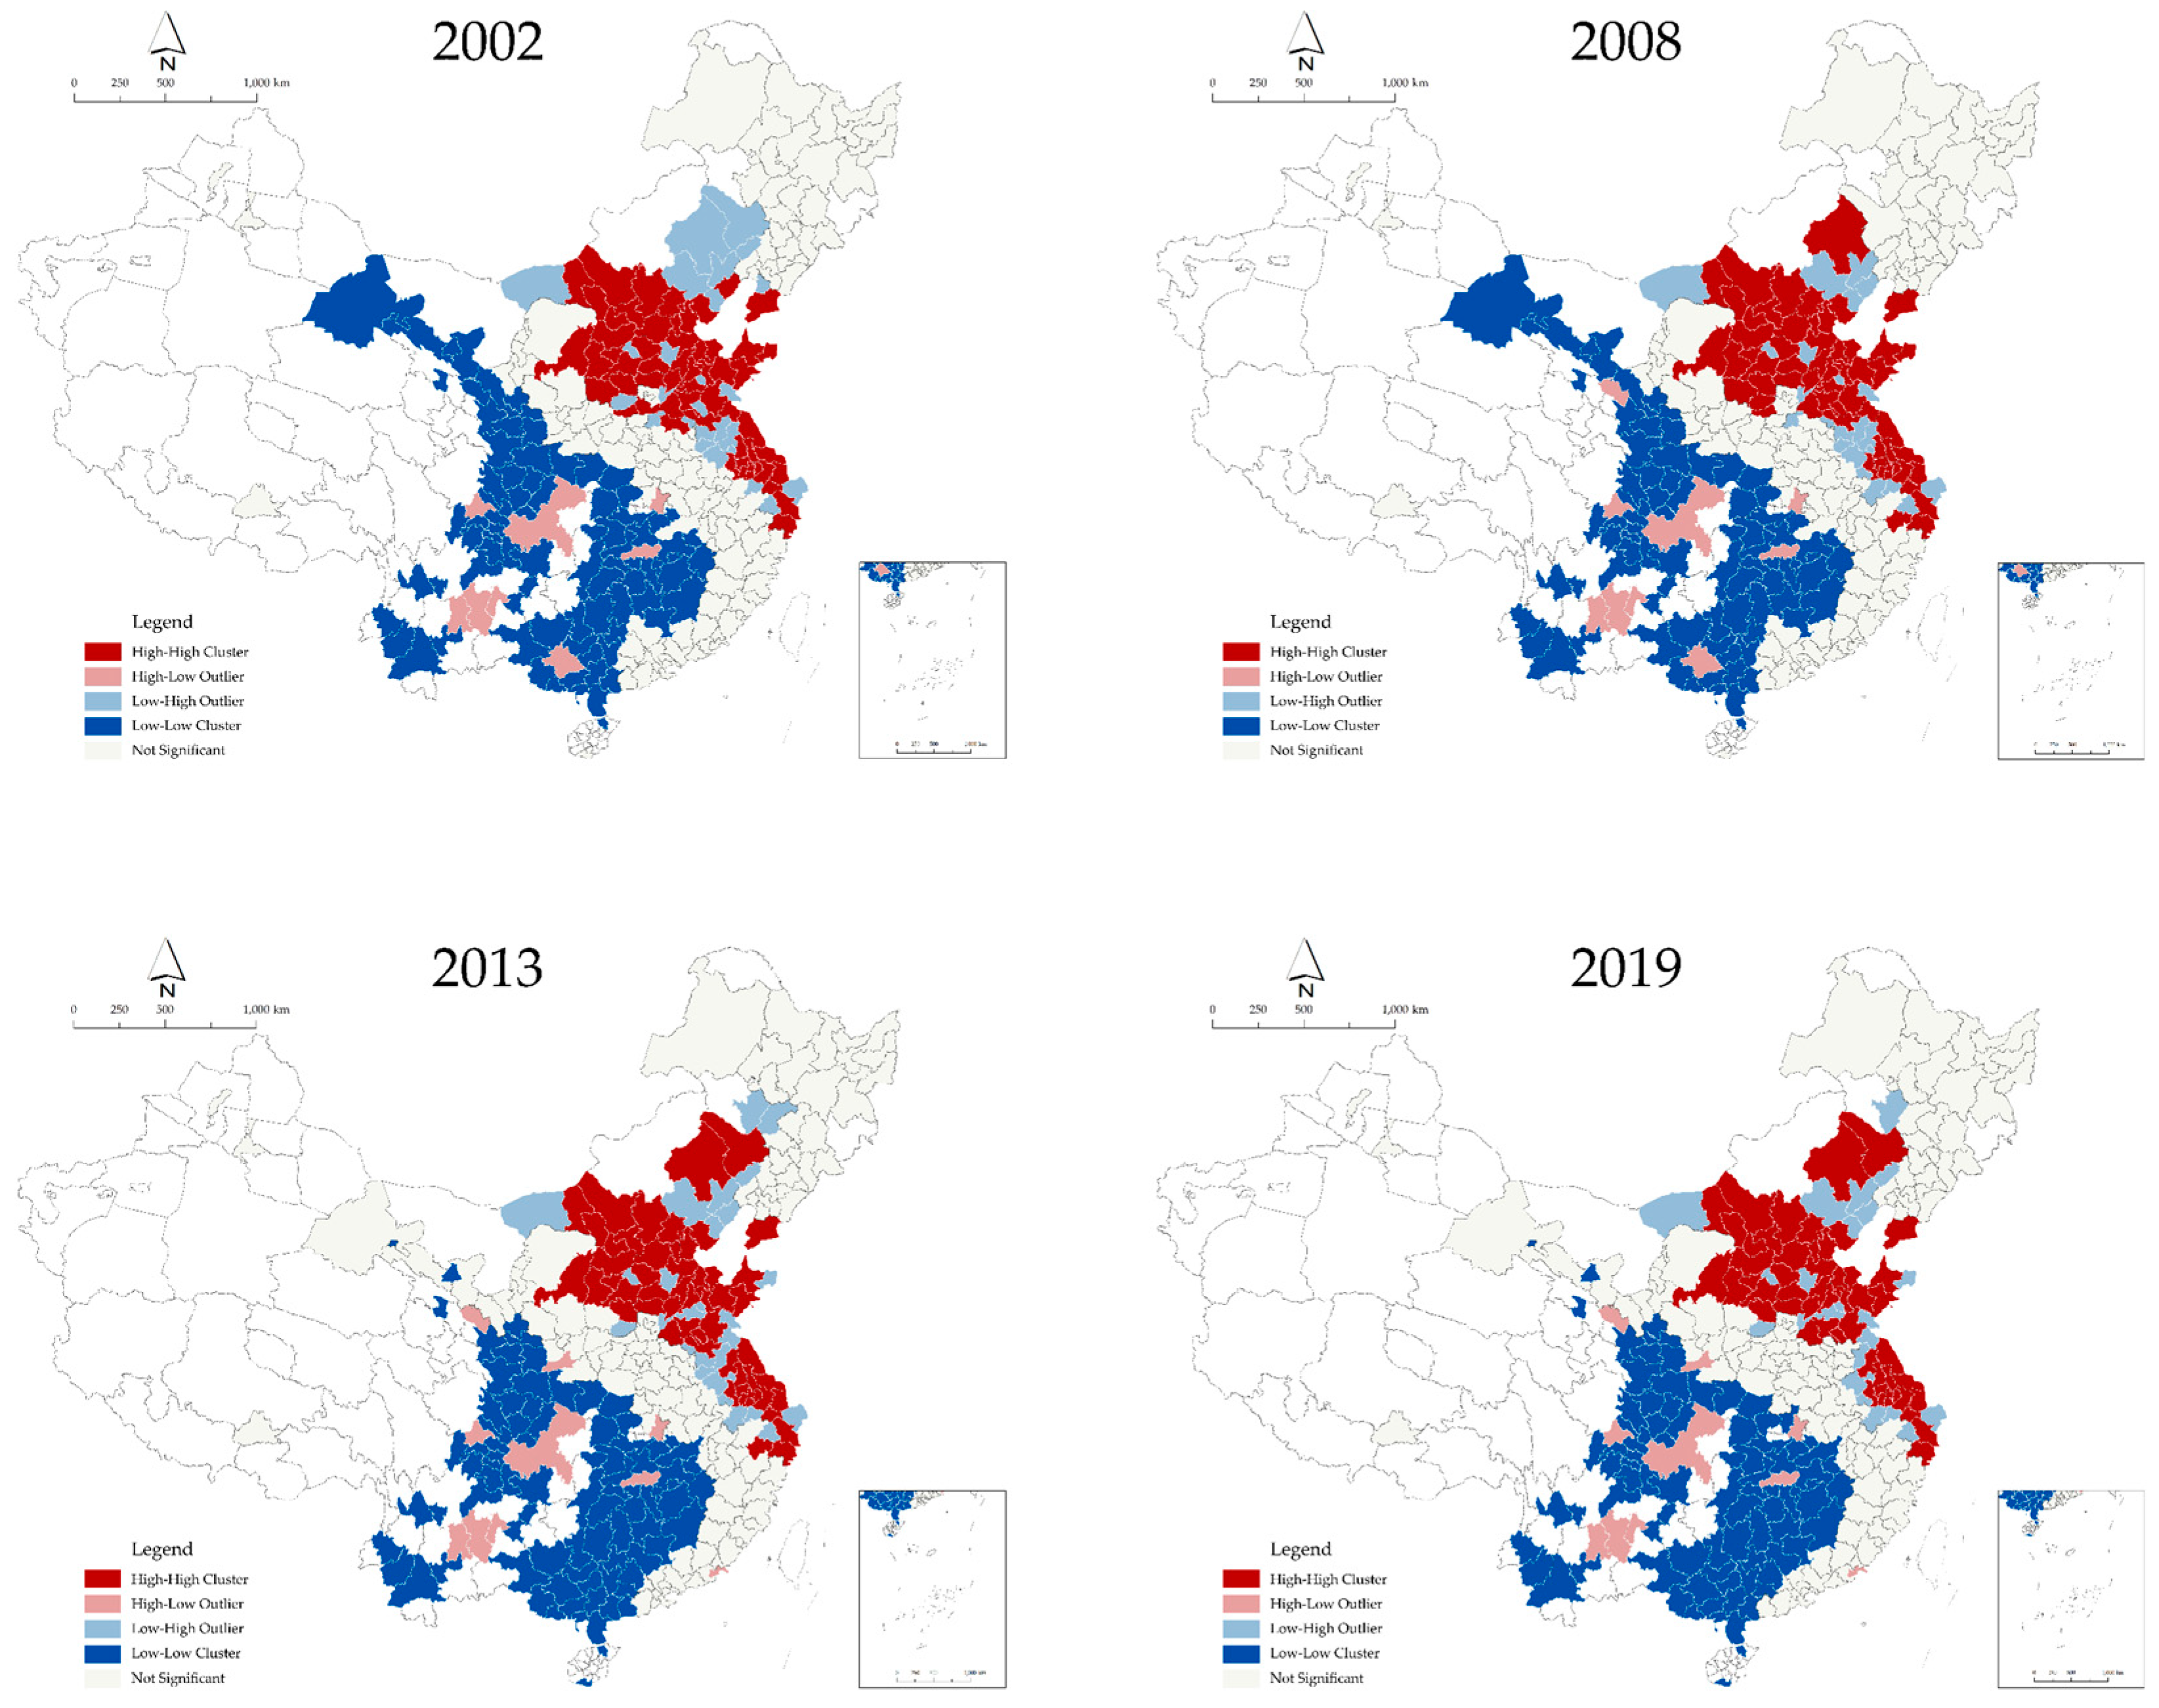
3.1. The Evolving Spatial Distribution of Carbon Emissions

The spatial distribution of carbon emissions and its evolution in mainland China is shown in Figure 1. Obviously, carbon emissions of Chinese cities have increased tremendously over the past two decades. Cities in eastern China especially those from three urban agglomerations predominate the spatial distribution pattern of carbon emissions in mainland China.
To further investigate the spatial dependence of the distribution of carbon emissions, we conduct the global and local spatial autocorrelation test of carbon emissions. In terms of the global Moran’s I test, the values of global Moran’s I based on inverse distance weight matrix are ~0.15 and are all significantly positive at the 99% confidence level from 2002 to 2019, confirming the spatial dependence of carbon emission distribution.
In terms of the local spatial autocorrelation test, Figure 2 shows the map of the LISA statistics (local indicator of spatial association) which describe the heterogeneity of aggregation characteristics of carbon emissions. Specifically, the high-high clusters are centrally distributed in the northern China while low-low clusters are usually located in central and southwestern China. Moreover, the LISA maps in different years show that the spatial dependence of carbon emission distribution has been relatively stable during the study period.

3.2. The Evolution of Urban Spatial Structure

Figure 3 shows the scatterplots of the degree of monocentricity and dispersion of 286 Chinese cities in the years 2002, 2008, 2013, 2019. Several findings can be discussed here. First, the variance of the degree of monocentricity and dispersion has decreased gradually, indicating that the difference in urban spatial structure among Chinese cities has been narrowing. Second, urban spatial structure of Chinese cities has shown an evolution trend towards polycentricity, which can be reflected by the obvious decline of the median value of the degree of monocentricity and the sharp reduction of the number of cities with only one center whose degree of monocentricity is 1. Third, urban spatial structure of most Chinese cities has remained more dispersed than compact, although the median value of the degree of dispersion has shown a slight decline. In general, urban spatial structure of Chinese cities has demonstrated a more polycentric and dispersed pattern over the past two decades.

4. The Impact of Urban Spatial Structure on Carbon Emissions of Chinese Cities

4.1. Results of Non-Spatial Models

Table 2 report the estimated results of the different sets of non-spatial regression models. All the three models have included fixed effect to control for the unrecognized individual differences and unobserved time dynamic features. In general, the high levels of R-squared values demonstrate satisfactory reliability of goodness of fit of all models.
Specifically, model (1) investigates the impact of socio-economic control variables on carbon emissions. The impact of ln_GDP on carbon emissions is significantly positive at the 99% confidence level, which is consistent with the empirical findings of previous studies [2,3,4]. Within the literature, most studies have found a strong and significant positive relationship between economic development and carbon emissions. This can be expected as economic development would consume more energies, thus increasing carbon emissions. Similarly, the coefficient of the variable ln_consume is also significantly positive, indicating that a higher level of total retail sales of consumer goods would be associated with more carbon emissions. This is also in line with another study [11] which finds that carbon emissions are positively related with the output of retailing. In terms of the effect of population density, previous studies have shown different evidence [12,21]. In this paper, we find that population density is positively related with carbon emissions, which can be reflected by the positive coefficient of ln_pop_den. These different empirical results might be because population density is measured at different spatial scales in different studies. For instance, some studies have measured population density at the provincial level [21], which other studies, including this paper, have measured population density at the city level [12]. The impact of road density (ln_road_den) on carbon emissions is significantly positive, which is to some extent different from the findings of other studies [3,26]. Although a higher level of road density could increase the efficiency of urban transportation and thus reducing carbon emissions, it may not be the case if the newly constructed transportation infrastructure is not close to the agglomeration of economic activities. In fact, a higher level of road density could also increase travel frequency and the vehicle miles travelled, thus increasing carbon emissions.
Two key independent variables reflecting the degree of monocentricity (ln_mono) and the degree of dispersion (ln_disp) respectively were added to model (2), to investigate the impact of urban spatial structure on carbon emissions. While some studies have argued that a compact pattern of urban land use can help reduce carbon emissions [24,25,26], our empirical results have suggested a significantly positive impact of urban dispersion on reducing carbon emissions in the Chinese context. In fact, our empirical results about dispersed urban form maintain the consistency with the impact of population density on carbon emissions. It means that increased population density brought by concentrated distribution of population would increase carbon emissions. Although some studies have found that the impact of compactness on carbon emissions is relatively modest [27,28], it has been argued that a compact urban development pattern could help reduce carbon emissions by delivering easier access to public transport and higher proximity to travel destinations. However, as land use pattern of most Chinese cities at the prefecture level and above has been expansionary over the past decades and compactness could affect the carbon emission in two opposite ways, the mechanisms behind the impact need to be explored in the future. In terms of the effect of polycentricity on carbon emissions, the positive signs of ln_mono suggest that an increase in the degree of polycentricity (i.e., a decrease in the degree of monocentricity) could help reduce carbon emissions of Chinese cities. This is in line with the findings of some previous studies [18,19,29], but is different from those of other studies [15,23]. Although the transportation cost deriving from the spatial extension of urban area is one of the main sources of carbon emissions, a polycentric urban form would reduce carbon emissions by optimizing land use pattern and shortening commuting distance. Specifically, our estimated results show that a 1% increase of the degree of monocentricity in a city would cause a 0.01% growth of carbon emissions. Therefore, polycentric urban form might be a reasonable solution to energy conservation or carbon mitigation.
In the model (3), we further add the interaction term (ln_mono_ln_GDP) to estimate the moderating effect of development level on the impact of monocentricity on carbon emissions. The coefficient of ln_mono remains significantly positive, while the coefficient of the interaction term is significantly negative. This suggests that a city’s development level could weaken the positive impact of monocentricity on carbon emissions. Noting that the estimate coefficient of ln_mono in model (3) is now associated with the value of ln_GDP, we can thus further calculate a threshold value of gross domestic product (GDP) beyond which the effect of monocentricity would turn negative. Simply let the estimate coefficient of ln_mono (i.e., 0.144–0.009 × ln_GDP) equal zero, it can be argued that a city with gross domestic product of more than 173 billion yuan ( e 0.144 / 0.009 = e 16 ) is more likely to have lower levels of carbon emissions when it is more monocentric (or less polycentric).
The moderating effect of economic development level on the impact of monocentricity on carbon emissions can be further described graphically in Figure 4 which shows the effects of different levels of GDP (ln_GDP) on the impact of monocentricity (ln_mono) on carbon emissions. Specifically, when the value of ln_GDP is smaller than 16 (0.144/0.009), we can observe that carbon emissions are positively associated with the degree of monocentricity. However, when the value of ln_GDP is higher than 16, we can see that carbon emissions are negatively associated with the degree of monocentricity. The reasons are explored as follows. For cities with larger economic size such as Beijing, Shanghai, and Shenzhen, polycentric development could increase commuting distance and vehicle miles traveled, thus increasing carbon emissions. In fact, many Chines cities with polycentric spatial structure are faced with issues of long commuting distance and heavy traffic congestion. This is because people must commute between the main center and subcenters as their subcenters cannot provide enough working opportunities.

4.2. Results of Spatial Durbin Models

The last model of Table 2 presents the estimated results of spatial Durbin model (SDM) as described in Equation (6). The regression of this model is based on inverse distance spatial weight matrix. Considering the stable spatial distribution pattern of carbon emissions and the noncontinuity of some independent variables in some sample cities due to adjustment of administrative divisions, we only control for the city fixed effect in the regression model. In addition, 1144 observations are excluded due to missing values when running the SDM. The LR tests and Wald tests are performed to examine whether the SDM could be reducible to either the SEM or SAR [42]. Even the LR test point out the possibility that SAR does not nested in the SDM, the high significance of Wald test in the SDM indicates SDM has better interpretation ability than other regression forms. As a result, our following interpretations are based on the SDM.
We add spatial lags of all independent variables in the model (4) of Table 2. Specifically, control variables including ln_GDP, ln_pop_den, and ln_road_den show robust positive impacts on carbon emissions at the 1% significance level, which are in line with previous results. In terms of the impact of dispersion, the negative effect of dispersion is consistent with the results of models without considering the spatial effect. Moreover, we can see that the spatial lag of dispersion (Wln_disp) is significantly positive, suggesting that a city could have a higher level of carbon emissions if it is surrounded by cities with more dispersed spatial structure. In terms of the impact of monocentricity, while the coefficient of ln_mono loses its significance, the coefficient of its spatial lag variable (Wln_mono) is significantly positive at the 1% significance level, suggesting that a city could have a higher level of carbon emissions if it is surrounded by cities with more monocentric spatial structure. Taken together, the significant estimates of the spatial lag factors in SDM confirms the existence of spatial dependence in the impact of these factors on carbon emissions. In terms of urban spatial structure, we argue that carbon emissions of one city could be affected by the spatial structure of its neighboring cities.
According to LeSage and Pace [42], the interactive feedback effect of spatial spillovers could bring disturbance of estimation system, so the coefficients of SDM may not present the real impact of independent factors. Marginal effect of SDM has been performed (Table 3) and correct interpretation about the impact of monocentric and dispersed urban form on carbon emissions can be established from the perspective of direct and indirect effect. First, the direct effect of monocentricity on carbon emissions is insignificant, which is consistent with the estimate results of spatial models. Meanwhile, the large positive indirect effect predominates the significant impact of monocentric urban structure on carbon emissions. If a city is surrounded by cities with more polycentric spatial structure, it may have lower carbon emissions. Then, the negative direct effect and positive indirect effect of dispersion suggests dynamic balanced urban form at the city level. Again, a dispersed urban form generally exerts a positive impact on carbon emissions, thus supporting the development and planning of compact cities to reduce carbon emissions. Another interesting finding is that the impact of urban spatial structure of a city’s neighboring cities on carbon emission is higher than that of the city itself (i.e., the indirect effect of urban spatial structure is larger than its direct effect). It may be related to the recent rapid development of urban agglomerations and megalopolises in China, which highlights the role of neighboring cities in a city’s development. Unlike the results of non-spatial models, ln_GDP and ln_consume present a negative effect in general (the majority of the results are derived from indirect effect). That implies the increased economy and consumption scale of cities can decrease the carbon emissions of its surrounding cities relatively.

5. Discussion

Carbon emissions and human well-being are highly correlated, and countries are usually confronted with a dilemma of improving human well-being and reducing carbon emissions. In fact, it has been argued that the carbon intensity of human well-being, measured by the level of anthropogenic carbon emissions per unit of human well-being, has been generally increasing over the last four decades [1]. This is mainly because human well-being has been mainly driven by economic growth which, however, would consume more energy and generate more carbon emissions [2,3,4]. Therefore, finding alternative approaches to reducing carbon emissions without decreasing human well-being has become increasingly important for scholars and policymakers across the world.
The policy implications of our empirical results are straightforward. First, a sustainable urban spatial structure could be an alternative approach to reducing carbon emissions, implying that it is possible to reduce carbon emissions while maintaining human well-being. Therefore, policymakers could pay more attention to optimize urban spatial structure rather than merely focusing on restricting economic growth to reduce carbon emissions. Second, although carbon emissions are positively associated with urban spatial structure, policymakers need to be cautious about the heterogeneity in the impact of urban spatial structure and polycentricity, in particular on carbon emissions. Specifically, a polycentric spatial structure does not necessarily help reduce carbon emissions, it might even increase carbon emissions for cities with higher levels of economic size. However, most Chinese cities have pursued “polycentricism” in their urban planning and relevant policies as if polycentricity could solve all the problems caused by urban development. In line with other studies [30,31,32], this study highlights again that policies aiming to pursue polycentric spatial structure should be cautiously implemented. Third, policymakers should also consider the spatial spillovers of the effects of their carbon emission mitigation policies on their neighboring cities. It is important for local officials to realize that their cities are not alone but closely related with other neighboring cities. The evaluation of policies should consider their impacts on neighboring cities. Perhaps, how to reduce carbon emissions at the metropolitan or megalopolitan levels might be on the agenda for policymakers to consider.

6. Conclusions

Within the literature, many studies have started to investigate the relationship between carbon emissions and urban spatial structure, arguing that a sustainable urban spatial structure, in addition to socioeconomic factors, could be an alternative approach to reducing carbon emissions [15,16,17,18,19]. While empirical evidence on the impact of urban spatial structure on carbon emissions has been mainly drawn from experiences in North American and European cities, recent years have seen an increasing number of studies conducted in the Chinese context. Nonetheless, studies focusing on Chinese cities have been usually restricted to a handful of cities due to unavailability of data on carbon emissions [3,15,17]. Moreover, existing studies have often neglected the spatial heterogeneity and dependence in the impact of urban spatial structure on carbon emissions across Chinese cities.
Aiming to contribute to the above-mentioned research gaps within this line of literature, this paper investigates the relationship between urban spatial structure and carbon emissions in 286 Chinese cities at the prefecture level and above. Specifically, this paper draws upon two unique datasets to estimate carbon emissions of Chinese cities and to calculate the degree of polycentricity and compactness of Chinese cities, respectively. The regression results based on non-spatial models reveal significant relationship between carbon emissions and urban spatial structure. Overall, more dispersed and less monocentric (i.e., less compact and more polycentric) cities are often associated with lower levels of carbon emissions, ceteris paribus. Moreover, the impact of polycentricity on carbon emissions could be moderated by the economic development levels of Chinese cities. For cities with gross domestic product being more than 173 billion yuan, a more polycentric spatial structure is usually associated with a higher level of carbon emissions. The regression results based on spatial Durbin model further reveal positive spatial spillovers of the impact of a city’s urban spatial structure on carbon emissions of its neighboring cities.
The current study has some limitations which could serve as starting points for future research. First, this paper measures urban spatial structure from the perspective of population distribution and at the city regional level, and future studies could draw upon more diversified datasets (e.g., employment and businesses) to measure urban spatial structure from different perspectives and at different geographical scales. Second, the relationship between carbon emissions and urban spatial structure could be endogenous, therefore empirical findings shown in this paper cannot reflect the causal relationship between urban spatial structure and carbon emissions. Future studies could pay more attention to address the potential endogeneity issue by adopting instrumental approaches. Third, the relationship between urban spatial structure and human well-being is to some extent indirect, future studies could investigate the impact of urban spatial structure on human well-being in a more direct way.

Author Contributions

Conceptualization, K.Z. and Y.L.; Data curation, M.T.; Formal analysis, K.Z.; Funding acquisition, K.Z.; Methodology, Y.L.; Visualization, M.T.; Writing—original draft, K.Z.; Writing—review and editing, K.Z. and Y.L. All authors have read and agreed to the published version of the manuscript.

Funding

This research was funded by Zhejiang Provincial Philosophy and Social Science Planning Project, grant number 22NDQN208YB; Zhejiang Provincial Natural Science Foundation of China, grant number LQ19E080017.

Institutional Review Board Statement

Not applicable.

Informed Consent Statement

Not applicable.

Data Availability Statement

Data used in this study are available upon request.

Conflicts of Interest

The authors declare no conflict of interest.

References

  1. Jorgenson, A.K. Economic Development and the Carbon Intensity of Human Well-Being. Nat. Clim. Change 2014, 4, 186–189. [Google Scholar] [CrossRef]
  2. Soytas, U.; Sari, R. Energy Consumption, Economic Growth, and Carbon Emissions: Challenges Faced by an EU Candidate Member. Ecol. Econ. 2009, 68, 1667–1675. [Google Scholar] [CrossRef]
  3. Wang, S.J.; Liu, X.P.; Zhou, C.S.; Hu, J.C.; Ou, J.P. Examining the Impacts of Socioeconomic Factors, Urban Form, and Transportation Networks on CO2 Emissions in China’s Megacities. Appl. Energy 2017, 185, 189–200. [Google Scholar] [CrossRef]
  4. Zhang, Y.J.; Liu, Z.; Zhang, H.; Tan, T.D. The Impact of Economic Growth, Industrial Structure and Urbanization on Carbon Emission Intensity in China. Nat. Hazards 2014, 73, 579–595. [Google Scholar] [CrossRef]
  5. Shahbaz, M.; Solarin, S.A.; Sbia, R.; Bibi, S. Does Energy Intensity Contribute to CO2 Emissions? A Trivariate Analysis in Selected African Countries. Ecol. Indic. 2015, 50, 215–224. [Google Scholar] [CrossRef] [Green Version]
  6. Wang, Y.; Zhang, X.; Kubota, J.; Zhu, X.; Lu, G. A Semi-Parametric Panel Data Analysis on the Urbanization-Carbon Emissions Nexus for OECD Countries. Renew. Sustain. Energy Rev. 2015, 48, 704–709. [Google Scholar] [CrossRef]
  7. Zhang, N.; Yu, K.; Chen, Z. How Does Urbanization Affect Carbon Dioxide Emissions? A Cross-Country Panel Data Analysis. Energy Policy 2017, 107, 678–687. [Google Scholar] [CrossRef]
  8. Wu, Y.; Shen, J.; Zhang, X.; Skitmore, M.; Lu, W. The Impact of Urbanization on Carbon Emissions in Developing Countries: A Chinese Study Based on the U-Kaya Method. J. Clean. Prod. 2016, 135, 589–603. [Google Scholar] [CrossRef] [Green Version]
  9. Zhang, F.; Deng, X.Z.; Phillips, F.; Fang, C.L.; Wang, C. Impacts of Industrial Structure and Technical Progress on Carbon Emission Intensity: Evidence from 281 Cities in China. Technol. Forecast. Soc. Change 2020, 154, 119949. [Google Scholar] [CrossRef]
  10. Li, L.; Hong, X.; Peng, K. A Spatial Panel Analysis of Carbon Emissions, Economic Growth and High-Technology Industry in China. Struct. Change Econ. Dyn. 2019, 49, 83–92. [Google Scholar] [CrossRef]
  11. Dong, B.; Ma, X.; Zhang, Z.; Zhang, H.; Chen, R.; Song, Y.; Shen, M.; Xiang, R. Carbon Emissions, the Industrial Structure and Economic Growth: Evidence from Heterogeneous Industries in China. Environ. Pollut. 2020, 262, 114322. [Google Scholar] [CrossRef]
  12. Lee, S.; Lee, B. The Influence of Urban Form on GHG Emissions in the US Household Sector. Energy Policy 2014, 68, 534–549. [Google Scholar] [CrossRef]
  13. Xu, C.; Haase, D.; Su, M.; Yang, Z. The Impact of Urban Compactness on Energy-Related Greenhouse Gas Emissions across EU Member States: Population Density vs Physical Compactness. Appl. Energy 2019, 254, 113671. [Google Scholar] [CrossRef]
  14. Fragkias, M.; Lobo, J.; Strumsky, D.; Seto, K.C. Does Size Matter? Scaling of CO2 Emissions and US Urban Areas. PLoS ONE 2013, 8, e64727. [Google Scholar] [CrossRef]
  15. Liu, X.; Wang, M.; Qiang, W.; Wu, K.; Wang, X. Urban Form, Shrinking Cities, and Residential Carbon Emissions: Evidence from Chinese City-Regions. Appl. Energy 2020, 261, 114409. [Google Scholar] [CrossRef]
  16. Muniz, I.; Dominguez, A. The Impact of Urban Form and Spatial Structure on per Capita Carbon Footprint in US Larger Metropolitan Areas. Sustainability 2020, 12, 389. [Google Scholar] [CrossRef] [Green Version]
  17. Wang, S.; Wang, J.; Fang, C.; Li, S. Estimating the Impacts of Urban Form on CO2 Emission Efficiency in the Pearl River Delta, China. Cities 2019, 85, 117–129. [Google Scholar] [CrossRef]
  18. Veneri, P. Urban Polycentricity and the Costs of Commuting: Evidence from Italian Metropolitan Areas. Growth Chang. 2010, 41, 403–429. [Google Scholar] [CrossRef]
  19. Ewing, R.; Rong, F. The Impact of Urban Form on US Residential Energy Use. Hous. Policy Debate 2008, 19, 1–30. [Google Scholar] [CrossRef]
  20. Zheng, S.; Wang, R.; Glaeser, E.L.; Kahn, M.E. The Greenness of China: Household Carbon Dioxide Emissions and Urban Development. J. Econ. Geogr. 2011, 11, 761–792. [Google Scholar] [CrossRef] [Green Version]
  21. Liu, Y.; Gao, C.; Lu, Y. The Impact of Urbanization on GHG Emissions in China: The Role of Population Density. J. Clean. Prod. 2017, 157, 299–309. [Google Scholar] [CrossRef]
  22. Mohajeri, N.; Gudmundsson, A.; French, J.R. CO2 Emissions in Relation to Street-Network Configuration and City Size. Transp. Res. Part D Transp. Environ. 2015, 35, 116–129. [Google Scholar] [CrossRef]
  23. Wang, M.; Madden, M.; Liu, X. Exploring the Relationship between Urban Forms and CO2 Emissions in 104 Chinese Cities. J. Urban Plan. Dev. 2017, 143, 04017014. [Google Scholar] [CrossRef]
  24. Debbage, N.; Shepherd, J.M. The Urban Heat Island Effect and City Contiguity. Comput. Environ. Urban Syst. 2015, 54, 181–194. [Google Scholar] [CrossRef]
  25. Fang, C.; Wang, S.; Li, G. Changing Urban Forms and Carbon Dioxide Emissions in China: A Case Study of 30 Provincial Capital Cities. Appl. Energy 2015, 158, 519–531. [Google Scholar] [CrossRef]
  26. Ou, J.; Liu, X.; Li, X.; Chen, Y. Quantifying the Relationship between Urban Forms and Carbon Emissions Using Panel Data Analysis. Landsc. Ecol. 2013, 28, 1889–1907. [Google Scholar] [CrossRef]
  27. Echenique, M.H.; Hargreaves, A.J.; Mitchell, G.; Namdeo, A. Growing Cities Sustainably: Does Urban Form Really Matter? J. Am. Plan. Assoc. 2012, 78, 121–137. [Google Scholar] [CrossRef]
  28. Gaigné, C.; Riou, S.; Thisse, J.-F. Are Compact Cities Environmentally Friendly? J. Urban Econ. 2012, 72, 123–136. [Google Scholar] [CrossRef]
  29. Sha, W.; Chen, Y.; Wu, J.; Wang, Z. Will Polycentric Cities Cause More CO2 Emissions? A Case Study of 232 Chinese Cities. J. Environ. Sci. 2020, 96, 33–43. [Google Scholar] [CrossRef]
  30. Li, Y.; Xiong, W.; Wang, X. Does Polycentric and Compact Development Alleviate Urban Traffic Congestion? A Case Study of 98 Chinese Cities. Cities 2019, 88, 100–111. [Google Scholar] [CrossRef]
  31. Li, Y.; Liu, X. How Did Urban Polycentricity and Dispersion Affect Economic Productivity? A Case Study of 306 Chinese Cities. Landsc. Urban Plan. 2018, 173, 51–59. [Google Scholar] [CrossRef]
  32. Li, Y.; Zhu, K.; Wang, S. Polycentric and Dispersed Population Distribution Increases PM2.5 Concentrations: Evidence from 286 Chinese Cities, 2001–2016. J. Clean. Prod. 2020, 248, 119202. [Google Scholar] [CrossRef]
  33. Wang, S.; Shi, C.; Fang, C.; Feng, K. Examining the Spatial Variations of Determinants of Energy-Related CO2 Emissions in China at the City Level Using Geographically Weighted Regression Model. Appl. Energy 2019, 235, 95–105. [Google Scholar] [CrossRef]
  34. Li, J.; Li, S. Energy Investment, Economic Growth and Carbon Emissions in China—Empirical Analysis Based on Spatial Durbin Model. Energy Policy 2020, 140, 111425. [Google Scholar] [CrossRef]
  35. Lv, Q.; Liu, H.; Wang, J.; Liu, H.; Shang, Y. Multiscale Analysis on Spatiotemporal Dynamics of Energy Consumption CO2 Emissions in China: Utilizing the Integrated of DMSP-OLS and NPP-VIIRS Nighttime Light Datasets. Sci. Total Environ. 2020, 703, 134394. [Google Scholar] [CrossRef]
  36. Hwang, Y.; Schlüter, S.; Choudhury, T.; Um, J.-S. Comparative Evaluation of Top-Down GOSAT XCO2 vs. Bottom-Up National Reports in the European Countries. Sustainability 2021, 13, 6700. [Google Scholar] [CrossRef]
  37. Oda, T.; Maksyutov, S. A Very High-Resolution (1 Km × 1 Km) Global Fossil Fuel CO2 Emission Inventory Derived Using a Point Source Database and Satellite Observations of Nighttime Lights. Atmos. Chem. Phys. 2011, 11, 543–556. [Google Scholar] [CrossRef] [Green Version]
  38. Hwang, Y.; Um, J.-S.; Schlüter, S. Evaluating the Mutual Relationship between IPAT/Kaya Identity Index and ODIAC-Based GOSAT Fossil-Fuel CO2 Flux: Potential and Constraints in Utilizing Decomposed Variables. Int. J. Environ. Res. Public Health 2020, 17, 5976. [Google Scholar] [CrossRef]
  39. Oda, T.; Maksyutov, S.; Andres, R.J. The Open-Source Data Inventory for Anthropogenic CO2, Version 2016 (ODIAC2016): A Global Monthly Fossil Fuel CO2 Gridded Emissions Data Product for Tracer Transport Simulations and Surface Flux Inversions. Earth Syst. Sci. Data 2018, 10, 87–107. [Google Scholar] [CrossRef] [Green Version]
  40. Li, Y.; Derudder, B. Dynamics in the Polycentric Development of Chinese Cities, 2001–2016. Urban Geogr. 2020, 1–21. [Google Scholar] [CrossRef]
  41. Li, C.; Wu, K.; Gao, X. Manufacturing industry agglomeration and spatial clustering: Evidence from Hebei Province, China. Environ. Dev. Sustain. 2020, 22, 2941–2965. [Google Scholar] [CrossRef]
  42. LeSage, J.P.; Pace, R.K. The Biggest Myth in Spatial Econometrics. Econometrics 2014, 2, 217–249. [Google Scholar] [CrossRef] [Green Version]
Figure 1. The spatial distribution of carbon emissions of Chinese cities, 2002–2019.
Land 11 00185 g001
Figure 2. LISA maps of carbon emission distribution, 2002–2019.
Land 11 00185 g002
Figure 3. Scatterplots of the degree of monocentricity and dispersion in 2002, 2008, 2013, and 2019. Note: The red dash lines are the median values of the degree of monocentricity and dispersion respectively. The four quadrants divided by the cross red lines represent four typical types of urban spatial structure: polycentric and dispersed structure (the upper left quadrant), monocentric and dispersed structure (the upper right quadrant), polycentric and compact structure (the lower left quadrant) and monocentric and compact structure (the lower right quadrant).
Land 11 00185 g003
Figure 4. The moderating effect of economic development level (GDP) on the impact of monocentricity on carbon emissions.
Land 11 00185 g004
Table 1. The descriptive statistics of variables.
VariablesObs.MeanStd. DevMinMax
ln_emissions514815.340.94412.1618.19
ln_mono5148−0.3610.346−4.3710
ln_disp5148−0.3320.260−2.1730
ln_consume509914.931.2475.47218.88
ln_GDP512815.981.1826.01619.76
ln_road_den5148−0.3880.716−4.0551.444
ln_popu_den51167.8090.8983.2969.908
Table 2. Empirical results of panel data regression models.
DV: ln E m i s s i o n s Non-Spatial ModelSpatial Durbin Model
Model with Fixed EffectModel with Moderating EffectModel with Spatial Lag
(1)(2)(3)(4)
ln_mono 0.012 **0.144 **−0.006
(0.005)(0.066)(0.005)
ln_disp −0.127 ***−0.128 ***−0.086 ***
(0.022)(0.022)(0.016)
ln_GDP0.009 ***0.008 ***0.0050.003 **
(0.003)(0.003)(0.003)(0.001)
ln_consume0.013 **0.013 **0.013 **−0.002
(0.006)(0.006)(0.006)(0.004)
ln_pop_den0.012 ***0.012 ***0.012 ***0.013 ***
(0.002)(0.002)(0.002)(0.003)
ln_road_den0.024 ***0.027 ***0.028 ***0.071 ***
(0.007)(0.007)(0.007)(0.010)
ln_mono_ln_GDP −0.009 **
(0.004)
Wln_mono 0.701 ***
(0.093)
Wln_disp 0.462 ***
(0.123)
Wln_GDP −0.024 *
(0.013)
Wln_consume −0.131 ***
(0.011)
Wln_pop_den 0.589 ***
(0.064)
Wln_road_den 1.501 ***
(0.081)
Constant14.934 ***14.911 ***14.953 ***0.035 ***
(0.097)(0.097)(0.099)(0.000)
SAR(H0) vs. SDM LR spatial lag 5855.63 ***
SEM(H0) vs. SDM LR spatial error −1269.23
Observations5075507550754004
R-squared0.9920.9920.992
Year FEYESYESYESNO
City FEYESYESYESYES
Note: Standard errors in parentheses, *** p < 0.01, ** p < 0.05, * p < 0.1.
Table 3. Estimates of the direct, indirect, and total effects based on spatial Durbin panel data model.
VariableDirect EffectIndirect EffectTotal Effect
ln_mono−0.0060.648 ***0.642 ***
ln_disp−0.087 ***0.427 ***0.341 ***
ln_GDP0.003 **−0.022 *−0.019 *
ln_consume−0.002−0.121 ***−0.123 ***
ln_pop_den0.013 ***0.545 ***0.558 ***
ln_road_den0.071 ***1.388 ***1.459 ***
Note: *** p < 0.01, ** p < 0.05, * p < 0.1.
Publisher’s Note: MDPI stays neutral with regard to jurisdictional claims in published maps and institutional affiliations.

