Article

Will Good Service Quality Promote Real Estate Value? Evidence from Beijing, China

1
School of Economics and Management, Beijing Forestry University, Beijing 100083, China
2
National Academy of Economics and Trade for Forestry and Grassland, Beijing Forestry University, Beijing 100083, China
3
The Department of City and Regional Planning, University of North Carolina, Chapel Hill, NC 27599, USA
*
Author to whom correspondence should be addressed.
Land 2022, 11(2), 166; https://doi.org/10.3390/land11020166
Submission received: 7 December 2021 / Revised: 17 January 2022 / Accepted: 18 January 2022 / Published: 20 January 2022
(This article belongs to the Special Issue Urban Land Development in the Process of Urbanization)

Abstract

:
In the field of land use and urban management, real estate value-added issues have attracted much attention. Previous studies mainly focused on the premium of basic public services (such as infrastructure) in real estate value. As an important part of urban management, the contribution of property service is often underestimated. Few empirical studies mentioned the potential contribution of property service quality. Based on this, this paper aims to confirm and quantitatively evaluate the premium of good service quality in real estate value utilizing 155,845 samples of housing resale transactions in Beijing from 2012 to 2019. Furthermore, we also explore the dynamics and heterogeneity of the above premium. Our results show the following: Firstly, good service quality does show premium in real estate value, and the higher the service quality, the greater the premium in housing price. Secondly, this premium keeps increasing during our study period. With urbanization and rising incomes of residents, property service is increasingly important. Thirdly, the contribution of service quality to real estate value is greater when serviced houses have a higher price or larger area, are relatively newer, or further away from the city center. The findings of this current research not only deepen our understanding of service quality’s premium in real estate value, but also provide implications for urban management.

1. Introduction

With urban development and the improvement of residents’ living quality, urban management becomes increasingly important. Urban management is a rich connotation of the concept, including basic public services, public safety management, land-use management, property services and so on. Good urban management can increase real estate value. Many scholars have found that basic public services (such as transportation, parks, etc.) have a premium in real estate value. Du et al. [1] used statistical methods to analyze the price of houses near a subway station in Sunderland, England, and argued that the rail transit system has an impact on the value of land in the short term. Cervero et al. [2] pointed out that the rapid transit system (BRT) affects land use and land value, which increases the price of land. Kong et al. [3] found that neighboring parks will make the land price premium.
In addition to basic public services, good public safety management also has a premium in property or land value [4]. George et al. [5] pointed out that violent crimes will be capitalized into the local housing market, and the average impact of crime rate on housing prices is misleading. Besides, land-use management in urban management can also promote real estate value. DiPasquale [6] established three spatial models of the land value of huge cities in Asia, and concluded that the spatial type of land value and the characteristics of the land market can affect the value of urban land, which are important reference factors in urban planning. Yang et al. [7] explored the impact of mixed land use of land parcels and living circle scales on housing prices.
However, as an important part of urban management [8], few scholars pay attention to the premium of property service in real estate value. Based on this, this paper aims to confirm and quantitatively examine the premium of service quality. We use housing prices to measure real estate value, and use two indicators to measure service quality respectively, which are the property management fee [9] and whether the service is provided by top-tier companies [10]. The hedonic price model is used to analyze nearly 160 thousand pieces of housing resale transaction data in Beijing from 2012 to 2019. As there are many options for resale houses, and residents are more cautious when buying resale houses, they have a full understanding of all aspects of housing characteristics, including the service quality in the community. Furthermore, we then explore the changes in the above premium over time, and its heterogeneity from the perspectives of housing prices, housing area, housing age, and whether in the city or suburbs.
Therefore, this paper makes an original contribution to the existing literature by deepening our understanding of service quality’s premium in real estate value, and to the best of our knowledge, this is the first study to explore the dynamic changes and heterogeneity of the above premium. The rest of this paper is organized as follows: the second part is a literature review; the third part includes the conceptual framework, hypotheses, and data; the fourth part presents the empirical results; followed by a discussion and conclusion.

2. Literature Review

Real estate value-added mainly includes land value-added and real estate value-added. With the progress of urbanization and the limited land resources [11], the issue of land value-added has attracted much attention [12,13]. Using information from the real estate market to study land value-added has always been a main method, because there is a relationship between housing prices and land value-added [14,15,16,17]. Muth et al. [14] and Manning [15] created the derivative demand theoretical model of the land market, proposing that land is a derivative demand of housing service, and the price of land is determined by housing prices. Liu et al. [17] also hold this view. When housing demand exceeds the supply market, it will lead to rising housing prices, which in turn drives up land prices. Housing prices are in a dominant position as a whole, and their impact on land prices is greater than that of land prices on housing prices. The direction of interaction is positive, which means that rising housing prices lead to land value-added [16]. Whether in classic research or current research, scholars recognize the relationship between housing prices and land value-added.
On the issue of real estate value-added, focusing on the housing market, the hedonic price model is widely used to quantify the premium in housing price. Characteristics affecting real estate value mainly include basic public services (such as infrastructure, etc.), public safety management, land-use management, and property service.
To be specific, basic public services have a premium in real estate value. First, good educational resources can affect real estate value [18]. Wang et al. [19] found that human capital measured by average years of education has a significant positive effect on housing prices. Clapp et al. [20] reported that the test scores of students in the community have become more and more important reference factors for choosing real estate in Connecticut, USA, while the demographic composition of the community has become less important. Every increase in the quality of primary school education will increase housing prices by 5.8 percent in Hangzhou, China [21]. Gibbons [22] pointed out that for every 1 percent increase in the proportion of residents with higher education in a community, the average housing price will increase by 0.24 percent. Second, convenient transportation can affect real estate value. Zhang et al. [23] reported that subway stations have a significant impact on the increase in rental prices in the suburbs. For every additional kilometer from the subway and bus station, housing prices fall by 15.02 percent and 5.1 percent, respectively [24]. Dai et al. found that the transfer station and non-transfer station of Beijing Rail Transit have a value-added effect on the price of surrounding houses [25]. Third, parks near the communities can affect real estate value [26]. Compared with new apartments built before 1989, the impact of parks and forests on housing prices is more significant. For every kilometer from the community center to the nearest park, housing prices in Hangzhou increase by 2.9 percent [21], and housing prices in Shenzhen increase by 1.7 percent [27]. Theme parks can bring a 3.7% premium in housing price [28]. For every 1 percent increase in the area of nearby parks, housing prices will increase by 0.013 percent [29]. In addition, for every kilometer increase in the distance from the community to the nearest city park, housing prices increase by 3.1 percent [30], based on Beijing housing data in 2019 and 2012–2019, respectively.
In addition to basic public services, good community safety management also has a premium in property or land value. The premium of community safety is mainly reflected in areas with high crime rate [31], and the average appraisal of housing price in unsafe areas is 1.27% lower [32]. Lynch and Rasmussen [31] used the sales data of more than 2800 houses in Jacksonville, Florida to estimate the impact of crime on housing prices, and they pointed out that high crime rate will seriously reduce housing prices. Besides, land-use management of urban management can also promote property or land value. DiPasquale [6] established three spatial models of the land value of huge cities in Asia and concluded that the spatial type of land value and the characteristics of the land market can affect the value of urban land, which are important reference factors in urban planning. Foster et al. [33] discussed that the annual real estate value rate is related to the characteristics of specific locations, and there are significant geographic differences. Yang et al. [27] explored the impact of mixed land use of land parcels and living circle scales on housing prices. Ge et al. [34] revealed that urban land use efficiency high-value areas have a larger market scale than the low-value areas. As an important part of urban management, property service has also attracted much attention [35], which not only can maintain the cleanliness and comfort level of the living environment of the community [36], but also improves the residents’ quality of life [4] and promotes urban development. However, few studies mention the role of property service [9,10,37]. To the best of our knowledge, none of the studies explore the changes over time and its heterogeneity.
Based on the existing research, we aim to confirm and quantitatively evaluate the premium of service quality in real estate value. On the one hand, this paper will contribute to deepening the understanding of service quality’s premium in real estate value. On the other hand, this paper will provide implications for making an effective use of property service to promote urban management.

3. Conceptual Framework, Hypotheses and Data

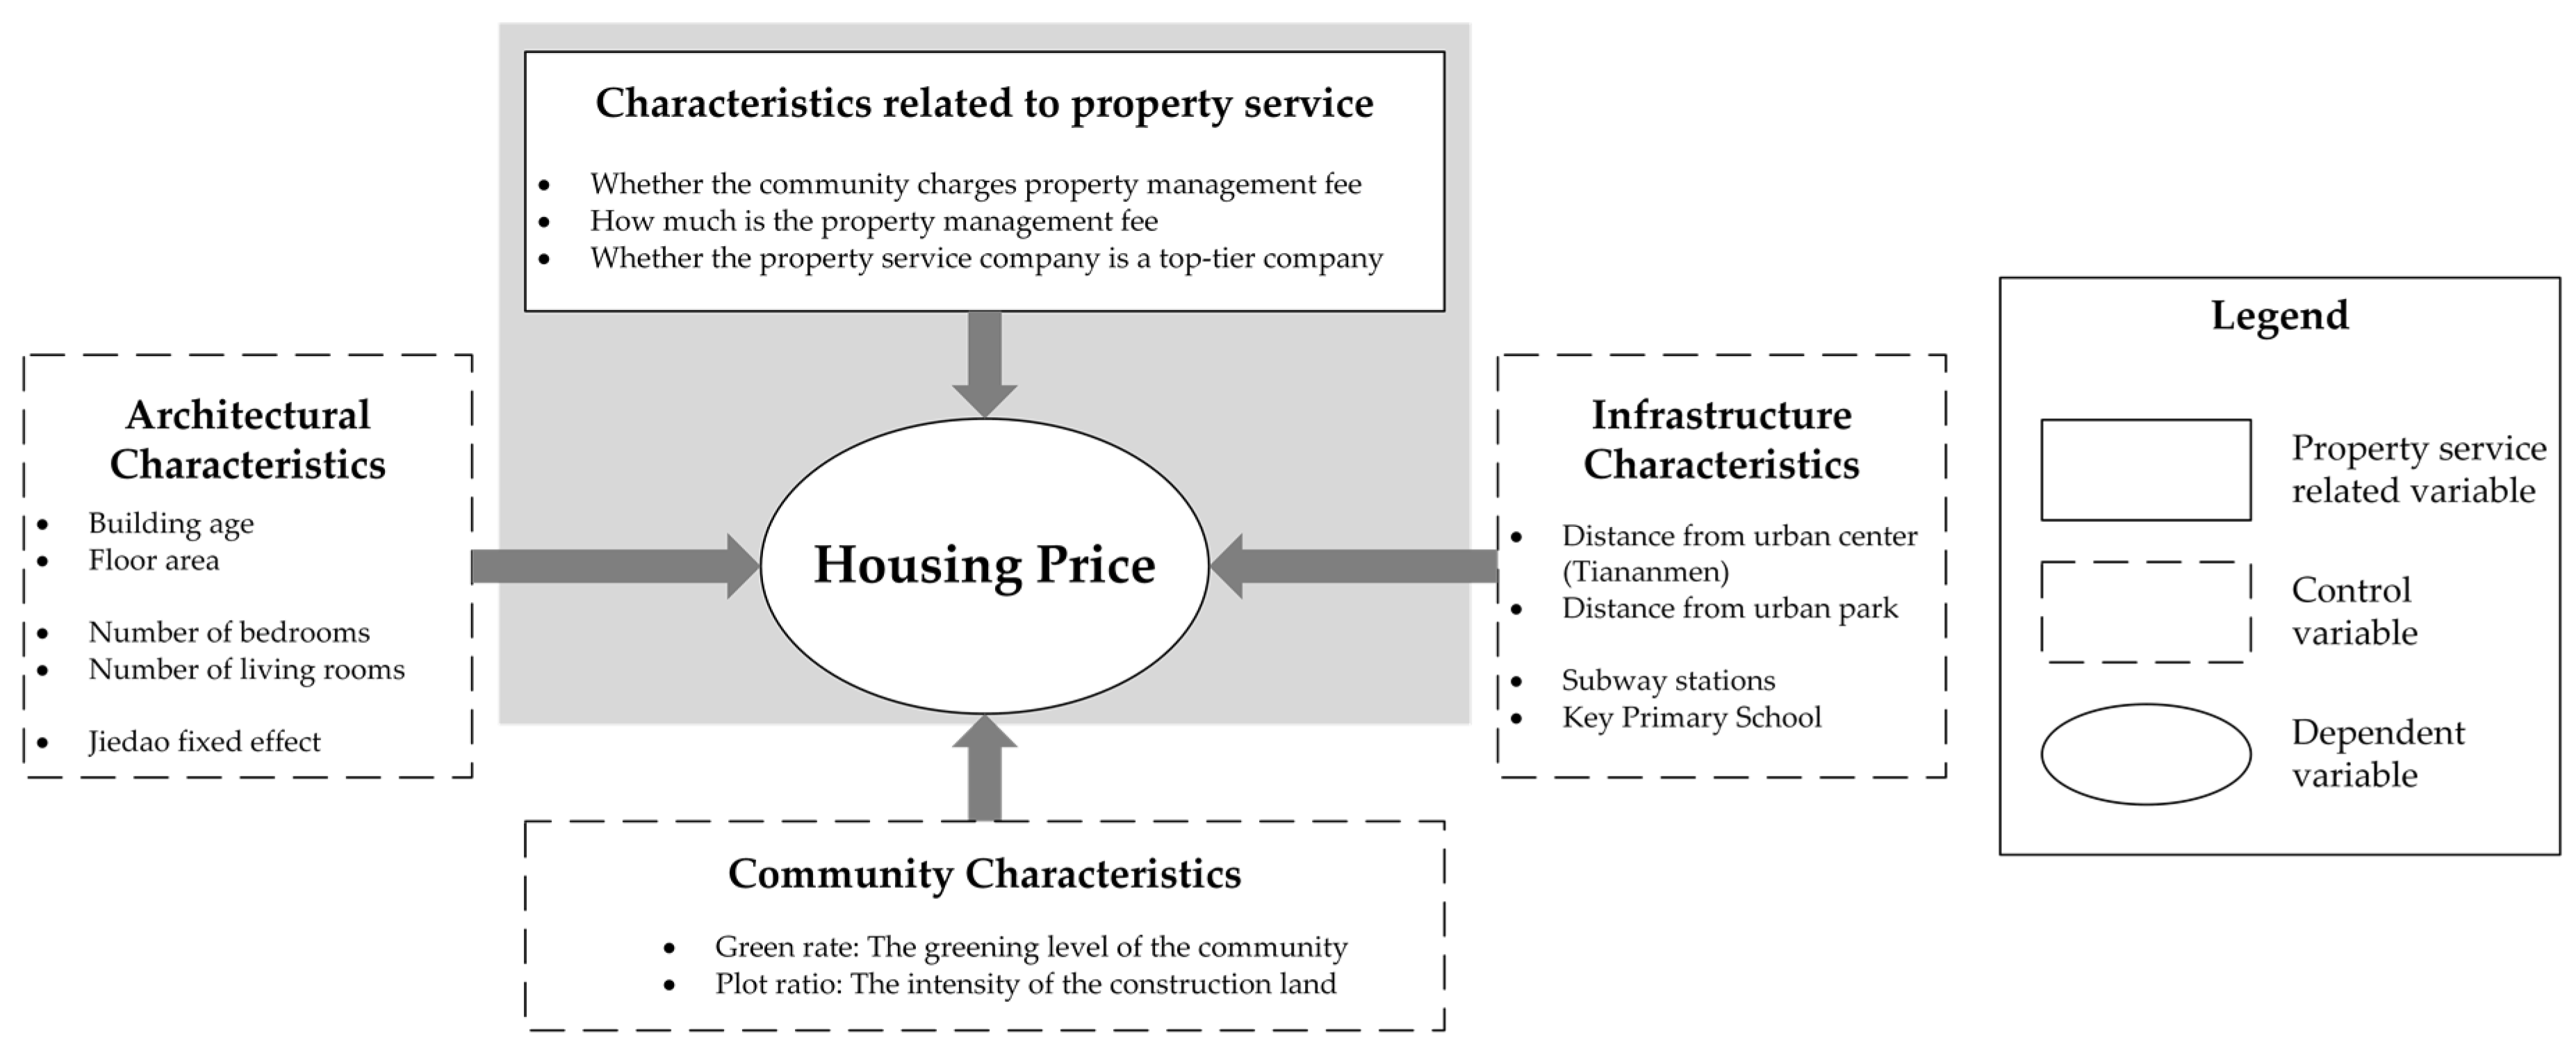
3.1. Conceptual Framework

Since the hedonic price model is based on actual behaviors rather than expected behavior [38], it is usually called the “revealed preference method” to distinguish it from the method of stating preference as the contingent valuation method [39]. As a kind of heterogeneous commodity, the house itself is composed of a series of internal characteristics, which will produce different effects due to the number of characteristics and the different combination methods. The relationship between service quality and housing price, which is the focus of this paper, is shown in Figure 1. When residents buy goods, they are aiming for the combination of characteristics that can bring them the greatest total utility, and these combinations of housing characteristics represent the value of real estate. The key point of such residential location choice behavior mechanism is that characteristics of houses will bring effect to residents, but they do not have a market price. Therefore, they will not appear explicitly in the cost paid by households, but will be implicitly included in the cost of houses. Because of this, it is possible to identify the preference households’ intensity or willingness to pay for various characteristics by observing their actual location choice behaviors, or by observing the spatial differences and changes of housing prices or rents.
According to previous studies, the semilogarithmic form of the hedonic price model performs better in improving the estimation accuracy and allowing variable heteroscedasticity [30]. We adopt this form of the hedonic price model, which is shown in Equation (1).
l n P = α 0 + α i X i + φ t + φ s + ε
Among them, l n P is the natural logarithm of the housing price P ; α 0 is the sum of other constants that affect housing prices; X i is the feature vector, usually including three aspects: architectural characteristics, infrastructure characteristics, and community characteristics; α i is the semi elasticity coefficient of the characteristic vector, which means the percentage of change in housing price P when X i changes by one unit amount; φ t is the year-fixed effect; and φ s is the Jiedao-fixed effect. Jiedao is the sub-district and basic administrative management unit of China. The administrative system in Beijing has three levels: municipality, district, and street office (Jiedao). Jiedao is the lowest administrative level. Within the BMA, there are 123 Jiedaos with an average size of about 10 km2 each. Unlike the United States, which has a highly decentralized public goods provision system, the Beijing Municipal Government provides most of the public infrastructure and services, such as transportation, education, and health care. The Jiedao is only responsible for administering basic services such as garbage collection [40]. The results after excluding the influencing factors of time and spatial changes are relatively more credible; ε is the error term.

3.2. Hypotheses and Empirical Models
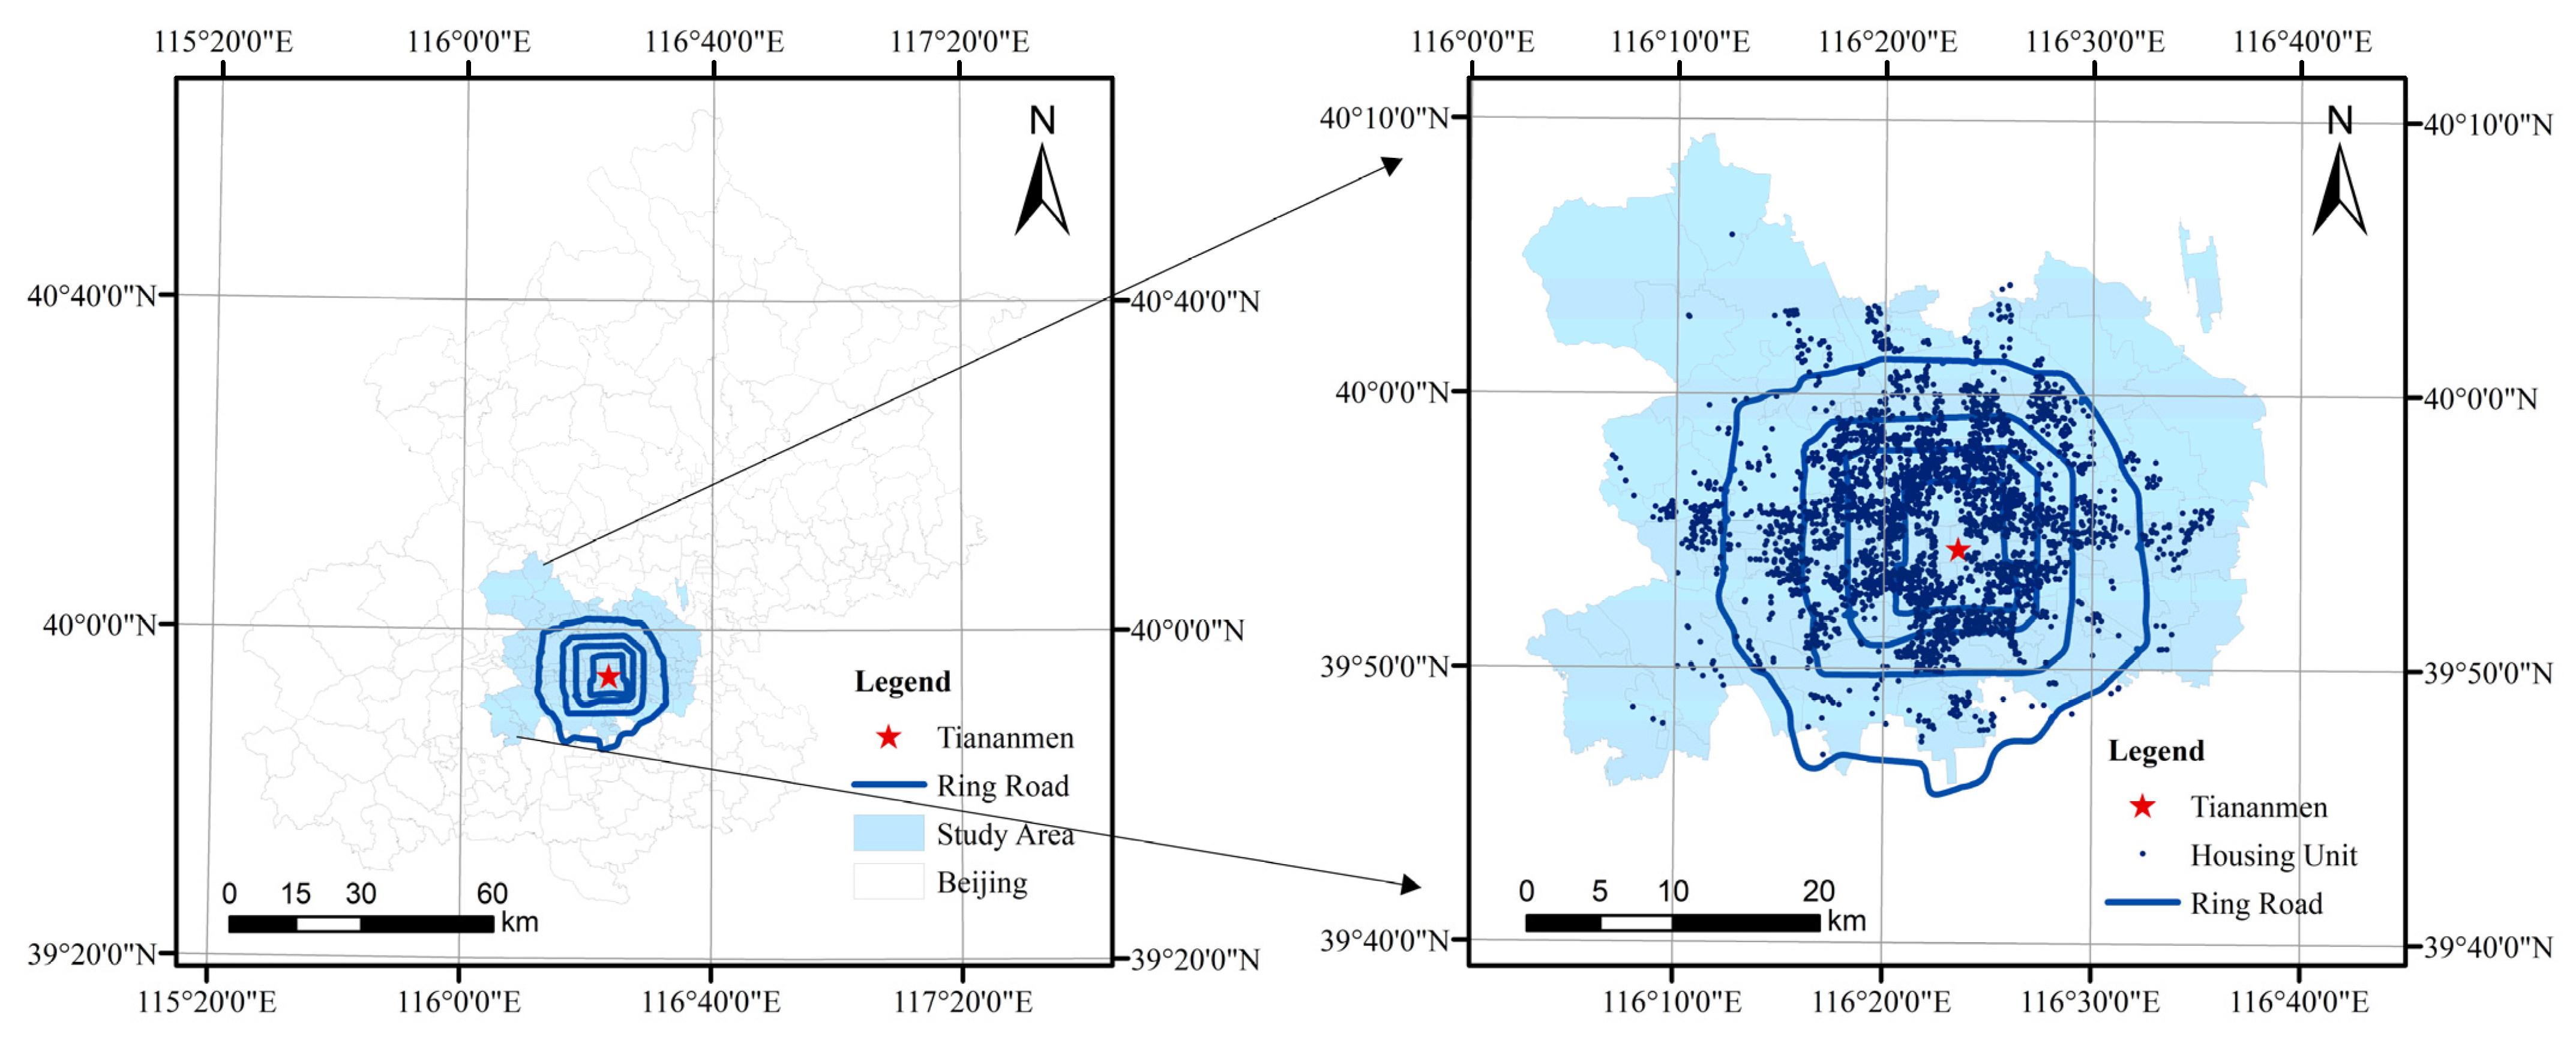
Based on the conceptual framework, we use housing prices to measure real estate value, and use two indicators to measure service quality respectively, which are the property management fee [9], and whether the service is provided by top-tier companies [10]. Property service refers to the activities provided by property service companies to maintain and manage houses, facilities, and sites, and keep environmental sanitation and order. It is worth mentioning that the service is only provided by one property service company. Property management fee is paid by the owners for the services provided by the property service company. In the new home market, first-time buyers buy from developers. The property management fee is exogenous, which is determined by the property service company, and remains consistent throughout the ownership period. It is very difficult to adjust the fee or change the property service company after determined [41,42,43,44], due to the difficulty of negotiating with owners. For example, as shown in Table A1, property management fee is fixed, and housing price is variable. Therefore, other things being equal, we estimate the residents’ willingness to pay for property service quality which measured by property management fee.
We propose three hypotheses. Firstly, good service quality has a premium in real estate value. Specifically, compared with no service, property with service has value added; the better the service quality, the higher the real estate value-added; top-tier service quality have more premium in real estate value. Our research hypotheses have the following factual background: First, property service is provided by one property service company for each community. Therefore, when a community does not charge the property management fee, we assume that the community does not enjoy any property services; second, among communities where property management fees are charged, the higher the property management fees means that property service is more comprehensive and caring. The property service provided by a top-tier company means that community can enjoy the highest quality of service. Therefore, we assume that the service quality is better when the property fee is high or the service is provided by a top-tier company. Third, the property service company in the community rarely replaced for a long time and the property management fee is also stable due to the difficulty of negotiating with homeowners. Thus, the service quality is almost unchanged during the whole ownership period. We will not consider the potential change of service quality in this current research.
Secondly, the premium of good service quality in real estate value becomes stronger in 2012–2019. With the development of economy and growth of both income and wealth, residents’ demand for a better life or better quality of life is keeping growing. As residential experience is an important part of residents’ life, residents’ demand and willingness to pay for high quality of property service will be stronger, which will bring more premium in housing prices. Thus, we assume the demand becomes stronger.
Lastly, the premium of good service quality in real estate value is heterogeneous, in terms of housing price, housing area, housing age, or whether the house is in the suburbs. Residents living in higher prices houses, larger houses and newer houses have relatively higher income or wealth level, and have stronger willingness to pay or demand for quality services. The public service resources in the suburbs are relatively poor, thus residents would have higher willingness to pay for the service quality in the community. Therefore, we assume that there is heterogeneity in the premium.
According to the first hypothesis, the equation of the hedonic price model after introducing the variable D_PS is shown in Equation (2). Among these, β 1 is the coefficient of D_PS. D_PS indicates whether communities charge a property management fee; if a property management fee is charged, the value of this variable is 1; otherwise, it is 0. Property management fees are the cost that residents have to pay for enjoying property services. The expected sign is a positive number, indicating that the existence of property management fee will lead to a premium in housing prices.
l n P = α 0 + β 1 × D _ P S + α i X i + φ t + φ s + ε
The variables PS and PS2 are introduced, and the models are Equations (3) and (4). Among these, β 2 , β 3 , and β 4 are the coefficients. PS represents the specific amount of the property management fee, and the expected sign of this variable is positive; PS2 represents the quadratic term of PS, and the expected sign is negative. This is because the premium of property management fee in housing prices is extremely high; that is, the premium of property management fee in housing prices is not unlimited.
l n P = α 0 + β 2 × P S + α i X i + φ t + φ s + ε
l n P = α 0 + β 3 × P S + β 4 × P S 2 + α i X i + φ t + φ s + ε
The variable D_top100 is introduced, and the specific hedonic price model is shown in Equation (5). Among these, β 5   is the coefficient of D_top100. D_top100 is a dummy variable indicating whether the property service company is a brand company. The expected sign of this variable is positive, which means that the property service company has a premium when it is a brand company.
l n P = α 0 + β 5 × D _ t o p 100 + α i X i + φ t + φ s + ε
According to the second hypothesis, we introduce the variable Year and two interaction-terms, which are D_PS × Year and PS × Year on the basis of Equations (2) and (3). Among these, Year is a continuous variable to represent the time of transaction, and assigned a value of 1–8 for the year of 2012–2019. D_PS × Year is the interaction-term of the variables for whether the community is charged a property management fee and the year variable. PS × Year is the interaction-term of the variables of property management fee and the year variable. The expected signs are all positive numbers, indicating that the variables D_PS and PS have a higher premium over time. β 6 β 11 are the coefficients of the corresponding variables.
l n P = α 0 + β 6 × D _ P S + β 7 × D _ P S × Y e a r + β 8 × Y e a r + α i X i + φ t + φ s + ε
l n P = α 0 + β 9 × P S + β 10 × P S × Y e a r + β 11 × Y e a r + α i X i + φ t + φ s + ε
According to the third hypothesis, in order to identify the heterogeneous effects of service quality on real estate value, we divided the types of housing by housing prices (D_highprice, differentiated by sample housing price median, high housing price = 1, low housing price = 0), housing area (D_large, differentiated by sample housing area median, big house = 1, small house = 0), housing age (D_old, differentiated by sample housing age median, old house = 1, new house = 0), and whether the house is in the suburbs (D_suburbs, differentiated by the median of the ring of the road, housing outside the Fourth Ring Road = 1, housing inside the Fourth Ring Road = 0). (The ring roads are the names of ring-shaped highways surrounding Beijing, and the number of rings from the inside to the outside is increasing. Thus, the Fourth Ring Road refers to the fourth ring highway from the inside to the outside in Beijing). We regard houses outside the Fourth Ring Road as further away from the city center, while inside the Fourth Ring Road as in the city center. Then, we introduce the cross-term D_highprice × PS, D_large × PS, D_old × PS and D_suburbs × PS. The coefficient of the cross term represents the impact gap between two different types of housing. For example, the coefficient of D_highprice × PS represents the impact gap between high housing prices and low housing prices on the premium of good service quality in real estate value.
l n P = α 0 + β 12 × D _ h i g h p r i c e × P S + β 13 × D _ h i g h p r i c e + β 14 × P S + α i X i + φ t + φ s + ε
l n P = α 0 + β 15 × D _ l a r g e × P S + β 16 × D _ l a r g e + β 17 × P S + α i X i + φ t + φ s + ε
l n P = α 0 + β 18 × D _ o l d × P S + β 19 × D _ o l d + β 20 × P S + α i X i + φ t + φ s + ε
l n P = α 0 + β 21 × D _ s u b u r b s × P S + β 22 × D _ s u b u r b s + β 23 × P S + α i X i + φ t + φ s + ε
This paper will take the various factors that affect housing prices as independent variables and pay particular attention to the premium of property service-related variables in housing prices. Through the hedonic price model, the dependent variables and service quality will be linked.

3.3. Data

Beijing has determined the list of prohibited industries in accordance with three types of functional areas: six urban districts, new urban development areas, and ecological conservation development areas. The distribution of communities in the study area is shown in Figure 2. Most communities are located within the Fifth Ring Road in Beijing. The distribution of communities presents the coexistence of agglomeration and dispersion, among which there is obvious agglomeration in the central city. This paper selected six urbanized districts as the study area, which are Dongcheng District, Xicheng District, Chaoyang District, Haidian District, Fengtai District, and Shijingshan District. From the perspective of the distribution of communities, Chaoyang District, Haidian District, and Fengtai District occupy most of the communities in the city, and the communities in Dongcheng District and Xicheng District have a much higher density than other areas. This spatial area is the most concentrated urbanized area in Beijing’s built-up area, which has been widely recognized and used many times by the local statistics and research institutions [30]. In the 2015 edition of the new industrial restriction catalogue released by Beijing, the sixth district is considered as a whole, which is a combination of the capital functional core district and the urban functional expansion district. The six districts of Beijing include the capital functional core area (Dongcheng, Xicheng) and the urban functional expansion area (Chaoyang, Haidian, Fengtai, Shijingshan). The total permanent resident population of the central six districts was 12.8 million in 2014, accounting for 59.3% of the total permanent resident population in Beijing and contributing to 69.9% of the total GDP in Beijing [45].
We collected 155,845 housing resale transaction data from 2012 to 2019 through Lianjia, the real estate brokerage agency with the largest market share of housing resale transactions in Beijing (https://sn.lianjia.com/about/aboutlianjia/ accessed on 9 January 2022). It is worth mentioning that this paper used information from the housing resale transaction market to avoid the endogenous problem of developers simultaneously determining housing prices and property management fee in the new housing market. At the same time, when purchasing resale houses, residents usually visit the house many times through professional real estate brokers, and make decisions very carefully. Therefore, they have a full understanding of the housing characteristics (such as location, and architecture characteristics, etc.). Because of too much missing data for old houses, we chose the average house age (21 years) as the screening criterion, and used data on housing transactions with ages of 21 or less. In the end, this paper selected 155,845 housing resale transaction data with a house age of 21, and these transaction houses were distributed in 3330 communities.

3.4. Definition of Variables and Basic Descriptive Statistics

In terms of variables, the dependent variable is Ln_price, which is quantified with the natural logarithm of the unit housing price. We summarize independent variables related to property service characteristics, architectural characteristics, infrastructure characteristics, and community characteristics.
Specifically, the first type of characteristics as related to property service: D_PS, a dummy variable, is used to measure whether a property management fee is charged. It is assigned a value of 1 if property management fee is collected, otherwise it is assigned a value of 0; PS is used to measure the amount of specific property management fee; D_top100 is also a dummy variable, judging whether the property service is provided by a top-tier property service company, and the variable is assigned a value of 1 if yes; otherwise, it is assigned a value of 0. The source of this index is the “2020 China Property Service TOP 100 Companies List” (The original source of the list is https://fdc.fang.com/report/13124.html accessed on 9 January 2022) released by the China Index Academy (China Index Holdings Limited, NASDAQ: CIH, https://www.nasdaq.com/market-activity/stocks/cih accessed on 17 January 2022). This evaluation index system has been widely recognized by the industry and has the greatest influence and credibility. The original source of the list is “https://fdc.fang.com/report/13124.html accessed on 17 January 2022”. The evaluation index system uses a total of five aspects of 20 indicators to rank property service companies, which are the management scale, business performance, service quality, development potential, social responsibility. According to the ranking of the index system, the “2020 China Property Service TOP 100 Companies List” was obtained. There are 244 property service companies on the list, accounting for 12.4 percent of the total number of companies in the industry. Specific to this study, there are 18,518 resale transactions provided by the top-tier companies, accounting for only 6% of the total sample. Therefore, if the company is on this list, we define it as a top-tier company.
Secondly, architectural characteristics include Age (housing age), Area (the total area of the house), Bedroom (number of bedrooms in the house) and Living_room (number of living rooms in the house).
Thirdly, infrastructure characteristics include four variables, which are Dis_tam, Dispark, Subway and Education. Dis_tam measures the distance from the community to Tiananmen Square; Dispark means the distance from the community to the nearest park; Subway represents the number of subway stations within 1 km of the neighborhood; and Education is used to quantify whether the housing was located within the school district of a key primary school [30,46,47], the definition of key primary schools is referred to [47] and the information is included in POI data) which is important for families with children in primary schools, according to the admission requirements in Beijing. The last type of characteristics is related to neighborhood. Greenrate is measured as the ratio between green space and total land area of the complex [48,49]. Plotratio represents the intensity of the construction land used in the community.
The specific variable settings and their descriptive statistics are shown in Table 1.

4. Empirical Results

This section will introduce the main empirical results from the following three aspects. First of all, we confirm that good service does show a premium in real estate value. In addition, when the service quality is higher or provided by top-tier companies, the premium is greater. Second, the premium of good service quality in real estate value keeps increasing from 2012 to 2019, which is confirmed by the estimated coefficients of the interaction terms (D_PS × Year and PS × Year) between the time variable and the property service variables. The last part is that good service quality show more premium, when the serviced houses have a higher price, larger area, younger age, or are further away from the city center.

4.1. Good Service Quality Does Show Premium in Real Estate Value

Since there are no unified regulations on collecting property management fees in the communities in Beijing, we first confirm whether service quality show more premium in real estate value, by comparing the difference price premium of whether or not to charge a property management fee (D_PS). Then, for the sample of communities that charges a property management fee (D_PS = 1), we study how the amount of the property management fee show premium in housing prices; that is, whether the premium in housing prices is greater when the quality of property service is better. At the end of the empirical part 4.1, we focus on the sample of communities that charge a property management fee (D_PS = 1) again to study whether top-tier service quality have more premium in real estate value.
The regression results of the hedonic price model based on time and Jiedao-fixed effects are shown in Table 2, with robust t-statistics in parentheses. The dependent variable in Columns (1)–(4) is housing prices, which measure real estate value. In the hedonic price model, housing prices are controlled by variables related to property service characteristics, architectural characteristics, infrastructure characteristics, and community characteristics. Judging from the coefficient of determination R2, the basic model can explain more than 77 percent of the difference in dependent variables, indicating that the model is well-fitted and has a certain explanatory power. In general, the empirical results of the main control variables are consistent with expectations.

4.1.1. Compared with No Property Service, Houses with Service Do Have Higher Value

According to the regression result shown in Column (1) of Table 2, the coefficient of D_PS is 0.042, which means the following: controlling for other characteristics, the housing prices of the communities that charge a property management fee is on average 4.2 percent higher than those of the communities that do not charge a property management fee. Compared with no service, houses with service do have higher value. This may be because the communities where a property management fee is charged are cleaner and safer, hence, residents are willing to pay more for it.
In addition, among the architectural characteristics, housing age (Age), housing area (Area), number of bedrooms (Bedroom), and number of living rooms (Living_room) have a significant premium in housing prices. Among these, the estimated coefficients of the age of the house (Age) and the area of the house (Area) are negative, and the estimated coefficients of the number of bedrooms (Bedroom) and the number of living rooms (Living_room) are positive. Specifically, for each year a house is older, its unit price decreases by 2 percent; for every 1 m2 of increase in the housing area, the unit housing price will reduce by 0.2 percent; when the bedroom number increases by one, the housing price increases by 4.1 percent; when the living room number increases by one, the housing price increases by 5.4 percent. This shows that newer houses or houses with a smaller area, more bedrooms, or more living rooms, all have greater premium in housing price. Perhaps due to the high housing prices in Beijing and the limited income of residents, residents prefer houses with a smaller housing area. In addition, new houses with more bedrooms and living rooms have a premium in housing prices due to the convenience and comfort of living.
For infrastructure characteristics, the estimated coefficients of the distance to Tiananmen Square (Dis_tam) and the distance to the nearest park (Dispark) are −0.041 and −0.036, respectively. This shows that when the distance to Tiananmen Square and the distance to a park are increased by 1 km respectively, housing prices fall by 4.1 percent and 3.6 percent. This shows that the closer the housing is to Tiananmen Square or parks, the greater the premium in housing prices. The coefficients of the number of subway stations (Subway) and education facilities (Education) are positive, indicating that the number of subway stations and the key elementary schools around the community have a premium in housing price. Within 1 km of the community, for every additional subway station, housing prices will rise 4.7 percent; for each key primary school around the community, the housing price increases by 5.1 percent. This may be because residents pay more attention to transportation and education resources when choosing housing.
For community characteristics, the coefficient of the green rate (Greenrate) is positive, and the estimated coefficient of the plot ratio (Plotratio) is negative. This shows that the higher the greening rate of the community, the higher the housing price. By analyzing the coefficient of the plot ratio variable (Plotratio), it can be seen that relatively uncrowded houses have higher prices. Generally speaking, a greener and less crowded community has more premium in real estate value.

4.1.2. The Better the Service Quality, the Higher the Real Estate Value-Added

According to the regression results in Column (2), we see the following: the coefficient of the property management fee (PS) is 0.036, which means that when other variables are controlled, with an increase of 1 in the property management fee, housing prices will rise by 3.6 percent. In other words, the higher the quality of property service, the higher the real estate value-added. This may be because the higher the quality of property service, the residents obtain a better housing experience and are willing to pay more for this. The regression result in Column (3) shows that at the 1% significance level, the coefficient of the property management fee (PS) is 0.074, and the coefficient of the quadratic term of property management fee (PS2) is −0.006. This shows that the relationship between property service and housing prices is nonlinear. That is, we confirmed that the better the service quality, the higher the real estate value-added.

4.1.3. Top-Tier Service Quality Shows More Premium in Real Estate Value

After regression analysis in Column (4), it can be found that the coefficient of the variable (D_top100) is 0.03 at 1% significance level, indicating that the top-tier property service can bring a 3 percent premium in housing price. That is, top-tier service quality shows more premium in real estate value. This is mainly due to the fact that top-tier companies’ property service is more scientific, meticulous, and professional, making it easier to meet residents’ needs.

4.2. The Premium of Good Service Quality in Real Estate Value Keeps Increasing over Time

According to Equations (8) and (9), this paper obtains changes of good service quality’s premium in real estate value over time (Table 3). Robust t-statistics are in parentheses. The R2 values of the two models in Table 3 are both greater than 0.77, indicating that the model fits well and has a high degree of interpretability. The estimated coefficient of the interaction-terms (D_PS × Year and PS × Year) reflect changes in the premium of service quality in housing prices over time.
Through regression analysis in Column (1) of Table 3, it can be found that the coefficient of whether a property management fee is charged (D_PS) and the coefficients of the time-related variables DPS × Year and Year are all positive at the 1% significance level, at 0.028 and 0.003 respectively. These positive coefficients show that compared with no property service, houses with service quality have a price premium increased by 0.3 percent year by year from 2012 to 2019. Similarly, in the regression results of Column (2), the coefficients of property management fee (PS) and time-related variables (PS × Year and Year) are also positive at the 1% significance level. What interests us most is the interaction-term (Year), and its coefficient of 0.003. This shows that compared with housing transactions in 2012, houses in 2019 have an extra 2.1 percent premium, due to the increasing premium over time. In other words, good service not only shows premium in real estate value, but can also have an increasing premium over time. The reason may be that the income level and quality of life of residents have improved in recent years, causing residents to want a better life and pay more attention to the quality of property service.

4.3. The Premium of Good Service Quality in Real Estate Value Is Heterogeneous

We will identify the heterogeneity of service quality’s premium in real estate value in this section, from the perspective of housing price, housing area, housing age, and whether the house is further away from the city center. According to Equations (10) and (11), the results of heterogeneity analysis are shown in Table 4, with robust t-statistics in parentheses. From the perspective of R2, the model has great interpretation capabilities.
According to the results in Column (1) of Table 4, we see that the premium of service quality in real estate value was different between high housing prices and low housing prices. Specifically, property service with high housing price has an extra 2.7 percent premium. The empirical results show that good service quality shows a higher premium with higher housing prices.
In addition, there is a similar conclusion about housing area: the result in Column (2) shows that the premium in housing price is 1.2 percent when serviced houses have smaller area, and the premium is 4.9 percent when serviced houses have larger area. This means good service quality shows more premium, when houses have a larger area.
Column (3) of Table 4 reports the heterogeneous effects between new and old houses, including all control variables, the R2 explained 78.2 percent of the variation in housing prices. The coefficient of the cross-item D_old × PS in Column (3) was −0.022. The empirical results show that newer houses have an extra 2.2 percent premium in housing price. That is, the contribution of service quality to real estate value is greater when serviced houses are relatively newer.
In addition to the above grouping by housing price, housing area, housing age, another dimension is based on whether the house is further away from the city center. We use the dummy variable D_suburbs to indicate it. The coefficient of the cross-item D_suburbs * PS, as shown in Column (4), is 0.027 and statistically significant at the 1% level. This means that good service quality shows more premium, when the house is further away from the city center.

5. Discussion

Similar to previous studies by scholars, in general, this current study confirms that service quality has a premium in real estate value [9,10,37]. According to their research, service quality increases housing prices by 2.9 percent [21] to 11 percent [9]. Specifically, Dai et al. [9] found that for every 1 yuan/m2/month increase in property management fee, Nanjing’s housing prices rise by 11 percent, estimated by a semilogarithmic hedonic price model. Li et al. [10] collected data on 12,137 housing transactions in 3186 closed commercial communities, analyzed them through a semilogarithmic feature price model, and found that an increase of 1 yuan/m2/month in property management fee can bring a 6.8 percent increase in the housing price. Wen et al. [21] divided the community property service quality into five grades through questionnaires: quite good, good, fair, poor, and quite poor, to obtain residents’ satisfaction with the service quality, and indicated that improving the property service quality will bring about a 2.9 percent increase in housing prices. Xiao et al. [29] used 18,551 transaction data from 660 communities and analyzed them with a semilogarithmic hedonic price model; every increase in the level of property service causes the housing price to rise 4.2 percent. Liu et al. [37] proposed that the housing prices of the top ten property companies are 9.57 percent higher than those of ordinary property companies. In this paper, we used 155,845 Beijing housing transaction data from 2012 to 2019, and obtained the following through a semilogarithmic hedonic price model: service quality measured by a property management fee and top-tier property service can bring a 3.6 and 3 percent premium to the housing price, respectively.
Different from previous research, we first confirm that compared with no service, houses with service do have higher value, which is ignored by most research. Then, distinguished from one indicator to measure service quality in previous studies, we use two indicators to make the result more complete. The two indicators are property management fee and whether service is provided by top-tier companies. We find that the better the service quality or the service provided by top-tier companies, the higher the real estate value-added. In addition, we consider the changes in premium of good service quality in real estate value over time and the heterogeneity, which are not taken into account by previous research. Our study shows that the premium of good service quality in real estate value keeps increasing from 2012 to 2019. By the end of 2019, China had 848.43 million permanent urban residents, and the urbanization rate had exceeded 60 percent. According to the National Bureau of Statistics, the per capita disposable income of Urban residents in China was 24,565 yuan in 2012 and 42,359 yuan in 2019, a total increase of 72.45 percent in the eight years. With the progress of urbanization, residents have an increasing demand for high-quality property service and urban management in recent years and they are yearning for a higher quality of life. Besides, we find that good service quality shows more premium, when the house has a higher price, larger area, younger age, or is further away from the city center. A possible reason is that more basic public services (such as infrastructure) are placed in the city center than in other areas. Therefore, to make up for the lack of public services, residents far from the city center pay more attention to the property service quality. In other words, public service and property service in the community are linked, and complementary in the field of urban management.
However, this paper has certain limitations, and we will improve theses in the next research. Specifically include the following four aspects: (1) First, some characteristics are difficult to quantify effectively at this stage (such as residents’ subjective feelings of provided service, the demographic composition of the community, community safety, etc.), which are not included in the current empirical model. Thus, our follow-up research will combine subjective surveys to analyze the willingness to pay and heterogeneous demands of residents of different ages or income levels. (2) Second, we will introduce case studies to analyze the relationship between good service and real estate value. (3) Third, we will also establish more indicators to measure the service quality, not just use property management fee. We will establish evaluation indicators for the cleanliness, neighborhood atmosphere, professional quality of property service personnel in the community and so on. (4) In fact, property service companies are generally not replaced all year round. However, we can still find a few special cases that the company is changed. As our current sample is not enough, we are we are researching and collecting more cases. We will use DID model to quantify the change of housing price before and after switching property service company, so as to confirm the causal relationship between service and housing price, which is not included in the current empirical study due to the lack of enough cases and data.

6. Conclusions

In order to explore the premium of property service quality in real estate value, this paper selected 155,845 housing resale transaction samples in Beijing’s urban six districts from 2012 to 2019 and used a semilogarithmic hedonic price model to conduct empirical analysis. The following are the main conclusions.
In the first part, we confirm that good service quality does show premium in real estate value, using two indicators respectively: property management fee [9] and whether the service is provided by top-tier companies [10]. Specifically, compared with no service, houses with service do have higher value. Secondly, the better the service quality, the higher the real estate value-added. Thirdly, top-tier service quality shows more premium in real estate value. Through the empirical research in this paper, we have found that when the property service quality is measured by property management fee, the premium is 3.6 percent; we used the variation about whether the property service company is top-tier (D_top100) to distinguish the qualification of the company, and the premium is 3 percent. In the second part, we have found the premium of good service quality in real estate value keeps increasing from 2012 to 2019. In the third part, we have found that the premium of good service quality in real estate value is heterogeneous. When houses are with a higher price, larger area, younger age, or further away from the city center, good service quality has more premium in real estate value.
These empirical results are of broad policy relevance in the field of land use and urban management. The essence of premium in real estate value is residents’ willingness to pay [50], reflecting their real demand for higher quality of service. On the one hand, policymakers should increase the investment in property service in the fiscal expenditures of urban management. Property service is one of the most basic in urban management and the closest to residents, and will play an increasingly important role in urban management. On the other hand, policymakers should integrate basic public services (e.g., infrastructure) with community management, which are complementary to each other. Specifically, the city center is equipped with relatively richer infrastructure and public service resources, so residents in the city center may not have high requirements for high-quality service in the community. However, the public service resources in the suburbs are relatively poor, and residents have higher willingness to pay for the service quality in the community. Our empirical results have proved this, which is that service quality has more premium, when the house is further away from the city center. Furthermore, on the basis of limited land resources [11,51], spatial planning according to residents’ demand for property services can promote the city’s development [52]. Therefore, basic urban public services (such as infrastructure) and property services in communities should be considered comprehensively and arranged in an overall way, so as to formulate more demand-oriented and targeted urban management and planning policies.

Author Contributions

Conceptualization, F.L. and Y.Z.; data curation, F.L. and K.C.; formal analysis, F.L. and K.C.; funding acquisition, Y.Z.; investigation, T.Z.; methodology, F.L., K.C. and Y.Z.; project administration, Y.Z. and Y.S.; resources, Y.Z. and Y.S.; software, F.L.; supervision, K.C. and Y.Z.; validation, T.Z.; visualization, F.L.; writing—original draft, F.L.; writing—review and editing, F.L., K.C., T.Z., Y.Z. and Y.S. All authors have read and agreed to the published version of the manuscript.

Funding

This research was supported by the National Office for Philosophy and Social Sciences (No. 20CGL064), the National Natural Science Foundation of China (No. 71603024), and the Fundamental Research Funds for the Central Universities (No. 2021SRY19).

Data Availability Statement

The housing resale transaction data is from Lianjia, the real estate brokerage agency with the largest market share of housing resale transactions in Beijing (https://sn.lianjia.com/about/aboutlianjia/ accessed on 9 January 2022).

Acknowledgments

The authors are indebted to the anonymous reviewers and editors. The authors thank Boyao Song, Rui Zhang, Anqi Liao, Xin Yang, and Yixu Wang from School of Economics and Management, Beijing Forestry University for their encouragement and help.

Conflicts of Interest

The authors declare no conflict of interest.

Appendix A

We divided the sample into 2 km × 2 km grids to control the grid-fixed effect. Compared with the Jiedao-fixed effect in manuscript, the grid-fixed effect makes the scope of comparison smaller and more effective. It is worth mentioning that both Jiedaos and grids are spatial partitions, and grids are smaller in scope. As can be seen from the regression results in Table A1 of the appendix, compared with the results in Table 2, the coefficient is slightly different, but it does not affect the main conclusion.
Table A1. Empirical results of the premium of good service quality in real estate value after control the grid-fixed effect.
(1)(2)(3)(4)
Ln_priceLn_priceLn_priceLn_price
D_PS0.050 ***
(18.465)
PS 0.031 ***0.087 ***
(49.292)(45.637)
PS2 −0.009 ***
(−29.156)
D_top100 0.033 ***
(14.242)
Age−0.019 ***−0.015 ***−0.014 ***−0.019 ***
(−114.817)(−83.437)(−78.349)(−113.426)
Area−0.002 ***−0.002 ***−0.002 ***−0.002 ***
(−54.172)(−60.959)(−62.600)(−52.478)
Bedroom0.043 ***0.049 ***0.051 ***0.042 ***
(36.356)(40.402)(42.395)(34.783)
Living_room0.055 ***0.057 ***0.056 ***0.055 ***
(52.450)(53.518)(53.184)(51.640)
Dis_tam−0.035 ***−0.030 ***−0.035 ***−0.035 ***
(−31.422)(−26.307)(−30.704)(−31.017)
Dispark−0.032 ***−0.028 ***−0.033 ***−0.032 ***
(−21.551)(−18.800)(−21.972)(−21.086)
Subway0.066 ***0.063 ***0.058 ***0.067 ***
(42.010)(39.879)(36.838)(42.162)
Education0.078 ***0.079 ***0.083 ***0.071 ***
(34.299)(32.088)(33.773)(28.797)
Greenrate0.443 ***0.385 ***0.365 ***0.467 ***
(52.802)(43.093)(40.945)(53.005)
Plotratio−0.024 ***−0.024 ***−0.025 ***−0.024 ***
(−47.557)(−46.030)(−47.563)(−45.047)
Constant10.770 ***10.644 ***10.710 ***10.831 ***
(474.056)(457.541)(460.721)(464.930)
Year-fixed effectYesYesYesYes
Grid-fixed effectYesYesYesYes
Observations155,845150,400150,400150,400
R20.7780.7830.7850.778
Note: (1) *** Indicates significance at 1% level.

References

  1. Du, H.; Mulley, C. The short-term land value impacts of urban rail transit: Quantitative evidence from Sunderland, UK. Land Use Policy 2007, 24, 223–233. [Google Scholar] [CrossRef]
  2. Cervero, R.; Kang, C.D. Bus rapid transit impacts on land uses and land values in Seoul, Korea. Transp. Policy 2011, 18, 102–116. [Google Scholar] [CrossRef] [Green Version]
  3. Kong, F.; Yin, H.; Nakagoshi, N. Using GIS and landscape metrics in the hedonic price modeling of the amenity value of urban green space: A case study in Jinan City, China. Landsc. Urban Plan. 2007, 79, 240–252. [Google Scholar] [CrossRef]
  4. Teck-Hong, T. Neighborhood preferences of house buyers: The case of Klang Valley, Malaysia. Int. J. Hous. Mark. Anal. 2011, 4, 58–69. [Google Scholar] [CrossRef] [Green Version]
  5. Tita, G.E.; Petras, T.L.; Greenbaum, R.T. Crime and Residential Choice: A Neighborhood Level Analysis of the Impact of Crime on Housing Prices. J. Quant. Criminol. 2006, 22, 299–317. [Google Scholar] [CrossRef]
  6. DiPasquale, D.; Wheaton, W.C. Urban Economics and Real Estate Market; Prentice Hall: Englewood Cliffs, NJ, USA, 1996. [Google Scholar]
  7. Yang, H.; Fu, M.; Wang, L.; Tang, F. Mixed Land Use Evaluation and Its Impact on Housing Prices in Beijing Based on Multi-Source Big Data. Land 2021, 10, 1103. [Google Scholar] [CrossRef]
  8. Zuo, W.; Zhang, X.; Zeng, S.; Liu, L. A LINMAP Method Based on the Bounded Rationality of Evaluators for Property Service Quality Evaluation. IEEE Access 2021, 9, 122668–122684. [Google Scholar] [CrossRef]
  9. Dai, J.; Lv, P.; Ma, Z.; Bi, J.; Wen, T. Environmental risk and housing price: An empirical study of Nanjing, China. J. Clean. Prod. 2020, 252, 119828. [Google Scholar] [CrossRef]
  10. Li, S.; Jiang, Y.; Ke, S.; Nie, K.; Wu, C. Understanding the Effects of Influential Factors on Housing Prices by Combining Extreme Gradient Boosting and a Hedonic Price Model (XGBoost-HPM). Land 2021, 10, 533. [Google Scholar] [CrossRef]
  11. Luo, J.; Zhang, X.; Wu, Y.; Shen, J.; Shen, L.; Xing, X. Urban land expansion and the floating population in China: For production or for living? Cities 2018, 74, 219–228. [Google Scholar] [CrossRef]
  12. Wang, P.; Zeng, C.; Song, Y.; Guo, L.; Liu, W.; Zhang, W. The Spatial Effect of Administrative Division on Land-Use Intensity. Land 2021, 10, 543. [Google Scholar] [CrossRef]
  13. Gao, Y.; Li, H.; Song, Y. Interaction Relationship between Urbanization and Land Use Multifunctionality: Evidence from Han River Basin, China. Land 2021, 10, 938. [Google Scholar] [CrossRef]
  14. Muth, R. The Derived Demand for Urban Residential Land. Urban Stud. 1971, 8, 243–254. [Google Scholar] [CrossRef]
  15. Manning, C.A. The Determinants of Intercity Home Building Site Price Differences. Land Econ. 1988, 64, 1–14. [Google Scholar] [CrossRef]
  16. Wen, H.; Goodman, A.C. Relationship between urban land price and housing price: Evidence from 21 provincial capitals in China. Habitat Int. 2013, 40, 9–17. [Google Scholar] [CrossRef]
  17. Liu, R.Q.; Jiang, Y.M. Study on housing price determining land price and passingly discuss current macro policy on real estate industry. Soc. Sci. Res. 2005, 6, 44–48. [Google Scholar]
  18. Bishop, K.C.; Murphy, A.D. Estimating the Willingness to Pay to Avoid Violent Crime: A Dynamic Approach. Am. Econ. Rev. 2011, 101, 625–629. [Google Scholar] [CrossRef]
  19. Wang, Y.; Ran, R.; Deng, G. Neighborhood Quality and Housing Value: Evidence from Urban Micro Data. J. Manag. Sustain. 2012, 2, 128. [Google Scholar] [CrossRef]
  20. Clapp, J.M.; Nanda, A.; Ross, S.L. Which school attributes matter? The influence of school district performance and demographic composition on property values. J. Urban Econ. 2008, 63, 451–466. [Google Scholar] [CrossRef] [Green Version]
  21. Wen, H.; Xiao, Y.; Hui, E.C.M.; Zhang, L. Education quality, accessibility, and housing price: Does spatial heterogeneity exist in education capitalization? Habitat Int. 2018, 78, 68–82. [Google Scholar] [CrossRef]
  22. Gibbons, S. Paying for Good Neighbours: Estimating the Value of an Implied Educated Community. Urban Stud. 2003, 40, 809–833. [Google Scholar] [CrossRef]
  23. Zhang, S.; Wang, L.; Lu, F. Exploring Housing Rent by Mixed Geographically Weighted Regression: A Case Study in Nanjing. ISPRS Int. J. Geo-Inf. 2019, 8, 431. [Google Scholar] [CrossRef] [Green Version]
  24. Wu, C.; Ye, X.; Du, Q.; Luo, P. Spatial effects of accessibility to parks on housing prices in Shenzhen, China. Habitat Int. 2017, 63, 45–54. [Google Scholar] [CrossRef]
  25. Dai, X.; Bai, X.; Xu, M. The influence of Beijing rail transfer stations on surrounding housing prices. Habitat Int. 2016, 55, 79–88. [Google Scholar] [CrossRef]
  26. Schwarz, N.; Haase, A.; Haase, D.; Kabisch, N.; Kabisch, S.; Liebelt, V.; Rink, D.; Strohbach, M.W.; Welz, J.; Wolff, M. How Are Urban Green Spaces and Residential Development Related? A Synopsis of Multi-Perspective Analyses for Leipzig, Germany. Land 2021, 10, 630. [Google Scholar] [CrossRef]
  27. Chen, W.Y.; Jim, C.Y. Amenities and disamenities: A hedonic analysis of the heterogeneous urban landscape in Shenzhen (China). Geogr. J. 2010, 176, 227–240. [Google Scholar] [CrossRef]
  28. Kim, H.-S.; Lee, G.-E.; Lee, J.-S.; Choi, Y. Understanding the local impact of urban park plans and park typology on housing price: A case study of the Busan metropolitan region, Korea. Landsc. Urban Plan. 2019, 184, 1–11. [Google Scholar] [CrossRef]
  29. Xiao, Y.; Hui, E.C.M.; Wen, H. Effects of floor level and landscape proximity on housing price: A hedonic analysis in Hangzhou, China. Habitat Int. 2019, 87, 11–26. [Google Scholar] [CrossRef]
  30. Zhang, Y.; Zhang, T.; Zeng, Y.; Yu, C.; Zheng, S. The rising and heterogeneous demand for urban green space by Chinese urban residents: Evidence from Beijing. J. Clean. Prod. 2021, 313, 127781. [Google Scholar] [CrossRef]
  31. Lynch, A.K.; Rasmussen, D.W. Measuring the impact of crime on house prices. Appl. Econ. 2010, 33, 1981–1989. [Google Scholar] [CrossRef]
  32. Buonanno, P.; Montolio, D.; Raya-Vílchez, J.M. Housing prices and crime perception. Empir. Econ. 2012, 45, 305–321. [Google Scholar] [CrossRef]
  33. Foster, W.; Anríquez, G.; Melo, O.; Yupanqui, D.; Ortega, J. Geographic disparities in rural land appreciation in a transforming economy: Chile, 1980 to 2007. Land Use Policy 2016, 57, 655–668. [Google Scholar] [CrossRef]
  34. Ge, K.; Zou, S.; Chen, D.; Lu, X.; Ke, S. Research on the Spatial Differences and Convergence Mechanism of Urban Land Use Efficiency under the Background of Regional Integration: A Case Study of the Yangtze River Economic Zone, China. Land 2021, 10, 1100. [Google Scholar] [CrossRef]
  35. Read, D.C.; Carswell, A. Is property management viewed as a value-added service? Prop. Manag. 2019, 37, 262–274. [Google Scholar] [CrossRef]
  36. Huang, Y.-H.; Lee, P.-C. Role of Property Management in Service Demands of Elderly Residents of Apartment Complexes. Int. J. Strateg. Prop. Manag. 2019, 24, 24–37. [Google Scholar] [CrossRef]
  37. Liu, G.; Wang, X.; Gu, J.; Liu, Y.; Zhou, T. Temporal and spatial effects of a ‘Shan Shui’ landscape on housing price: A case study of Chongqing, China. Habitat Int. 2019, 94, 102068. [Google Scholar] [CrossRef]
  38. Tyrväinen, L.; Miettinen, A. Property Prices and Urban Forest Amenities. J. Environ. Econ. Manag. 2000, 39, 205–223. [Google Scholar] [CrossRef] [Green Version]
  39. Price, C. Valuation of unpriced products: Contingent valuation, cost–benefit analysis and participatory democracy. Land Use Policy 2000, 17, 187–196. [Google Scholar] [CrossRef]
  40. Zheng, S.; Sun, W.; Wang, R. Land Supply and Capitalization of Public Goods in Housing Prices: Evidence from Beijing. J. Reg. Sci. 2014, 54, 550–568. [Google Scholar] [CrossRef]
  41. Chen, P. Conservative Governance of urban grassroots community: A case study of the property fee adjustment process in B City in May. Qiusuo 2018, 11, 107–117. [Google Scholar] [CrossRef]
  42. Chen, P. Urban community property cost dilemma and its countermeasures. Soc. Gov. 2018, 6, 48–53. [Google Scholar] [CrossRef]
  43. Chen, Q.; Tang, J. Research on Pricing Actualization Mechanism of Residential Property Management Fee Based on Recessive Monopolization. Int. Conf. Appl. Soc. Sci. Res. 2013, 8, 83–86. [Google Scholar] [CrossRef] [Green Version]
  44. Yin, M. Property management in Community governance: The impact of service quality on residents’ sense of belonging. Southeast Acad. 2020, 10, 162–171. [Google Scholar] [CrossRef]
  45. Zhang, Y.; Li, X.; Nie, T.; Qi, J.; Chen, J.; Wu, Q. Source apportionment of PM2.5 pollution in the central six districts of Beijing, China. J. Clean. Prod. 2018, 174, 661–669. [Google Scholar] [CrossRef]
  46. Zheng, S.; Hu, W.; Wang, R. How Much Is a Good School Worth in Beijing? Identifying Price Premium with Paired Resale and Rental Data. J. Real Estate Financ. Econ. 2015, 53, 184–199. [Google Scholar] [CrossRef]
  47. Zhang, T.; Zeng, Y.; Zhang, Y.; Song, Y.; Li, H. The Heterogenous Demand for Urban Parks between Home Buyers and Renters: Evidence from Beijing. Sustainability 2020, 12, 9058. [Google Scholar] [CrossRef]
  48. Chen, W.Y. Environmental externalities of urban river pollution and restoration: A hedonic analysis in Guangzhou (China). Landsc. Urban Plan. 2017, 157, 170–179. [Google Scholar] [CrossRef]
  49. Zheng, S.; Wu, J.; Kahn, M.E.; Deng, Y. The nascent market for “green” real estate in Beijing. Eur. Econ. Rev. 2012, 56, 974–984. [Google Scholar] [CrossRef]
  50. Brookshire, D.S.; Thayer, M.A.; Schulze, W.D.; d’Arge, R.C. Valuing Public Goods: A Comparison of Survey and Hedonic Approaches. Am. Econ. Rev. 1982, 72, 165–177. [Google Scholar]
  51. Wu, Y.; Chen, Y.; Deng, X.; Hui, E.C.M. Development of characteristic towns in China. Habitat Int. 2018, 77, 21–31. [Google Scholar] [CrossRef]
  52. Wu, Y.; Shan, L.; Zheng, S.; Lai, S.-K.; Xia, B. Regional Planning Reconfiguration in China Based on Inclusiveness: Examining Development and Control Orientation. J. Urban Plan. Dev. 2020, 146, 05020012. [Google Scholar] [CrossRef]
Figure 1. The relationship of property service and housing price.
Land 11 00166 g001
Figure 2. The spatial distribution of communities in the six districts of Beijing from 2012 to 2019. Note: the ring roads are the names of ring-shaped highways surrounding Beijing, and the number of rings from the inside to the outside is increasing. For example, the Fourth Ring Road refers to the fourth ring highway from the inside to the outside in Beijing.
Land 11 00166 g002
Table 1. Variable settings and descriptive statistics.
Variable TypeVariable NameVariable MeaningDescriptive Statistics
MeanStandard Deviation
Dependent variableLn_priceThe natural logarithm of the housing price per square meter10.880.37
Characteristics related to property serviceD_PSWhether the community charges property management fee: yes = 1; otherwise = 00.910.29
PSProperty management fee of the community (yuan/m2/month)1.961.15
D_top100Whether the property service company is a top-tier company: yes = 1; otherwise = 00.060.24
Architectural characteristicsAgeHousing age (years)21.479.06
AreaThe total area of the house (square meters)80.7537.34
BedroomNumber of bedrooms in the house2.000.77
Living_roomNumber of living rooms in the house1.130.48
Infrastructure characteristicsDis_tamThe distance from the community to Tiananmen Square (km)9.053.78
DisparkThe distance from the community to the nearest park (km)1.230.63
SubwayThe number of subway stations within 1 km of the neighborhood0.760.43
EducationWhether there are key primary schools around the neighborhood: yes = 1; otherwise = 00.100.30
Community characteristicsGreenrateThe greening level of the community (percent)0.320.07
PlotratioThe intensity of the construction land used in the community (percent)2.641.23
Note: (1) The variable price with “Ln_” was logarithmically transformed. (2) The samples contained 155,845 observations in 3330 communities during 2012–2019.
Table 2. Empirical results of good service quality showing premium in real estate value.
(1)(2)(3)(4)
Ln_priceLn_priceLn_priceLn_price
D_PS0.042 ***
(15.793)
PS 0.036 ***0.074 ***
(60.114)(42.459)
PS2 −0.006 ***
(−21.840)
D_top100 0.030 ***
(13.765)
Age−0.020 ***−0.014 ***−0.014 ***−0.020 ***
(−129.630)(−84.919)(−80.392)(−127.286)
Area−0.002 ***−0.002 ***−0.002 ***−0.002 ***
(−54.378)(−62.767)(−63.198)(−52.741)
Bedroom0.041 ***0.047 ***0.048 ***0.040 ***
(35.216)(39.526)(40.341)(33.308)
Living_room0.054 ***0.055 ***0.055 ***0.055 ***
(50.998)(51.533)(51.439)(50.630)
Dis_tam−0.041 ***−0.036 ***−0.036 ***−0.042 ***
(−82.299)(−72.313)(−72.514)(−82.297)
Dispark−0.036 ***−0.035 ***−0.038 ***−0.036 ***
(−30.028)(−28.772)(−30.728)(−28.951)
Subway0.047 ***0.039 ***0.038 ***0.048 ***
(35.622)(29.201)(28.847)(35.941)
Education0.051 ***0.052 ***0.056 ***0.042 ***
(26.015)(25.644)(27.981)(20.400)
Greenrate0.416 ***0.377 ***0.363 ***0.447 ***
(50.079)(43.421)(42.033)(51.679)
Plotratio−0.019 ***−0.019 ***−0.020 ***−0.020 ***
(−38.062)(−36.642)(−38.145)(−37.923)
Constant10.699 ***10.553 ***10.503 ***10.736 ***
(991.495)(1025.196)(1000.539)(1012.185)
Year-fixed effectYesYesYesYes
Jiedao-fixed effectYesYesYesYes
Observations155,845150,400150,400150,400
R20.7730.7810.7820.774
Note: (1) *** Indicates significance at 1% level. (2) The numbers in parentheses indicate robust t-statistics. (3) We narrow the fixed effect of space from Jiedao to a 2 km × 2 km grid and find that it does not affect the main conclusions of the paper. The empirical results of the grid-fixed effect are shown in Table A1 in Appendix A.
Table 3. Empirical results of the premium of good service quality in real estate value keeps increasing over time.
(1)(2)
Ln_priceLn_price
D_PS0.028 ***
(4.965)
D_PS × Year0.003 ***
(2.803)
PS 0.023 ***
(18.130)
PS × Year 0.003 ***
(11.204)
Year0.112 ***0.109 ***
(99.908)(166.274)
Constant10.598 ***10.468 ***
(898.055)(989.059)
Control other variablesYesYes
Year-fixed effectYesYes
Jiedao-fixed effectYesYes
Observations155,845150,400
R20.7730.781
Note: (1) *** Indicates significance at 1% level. (2) The numbers in parentheses indicate robust t-statistics. (3) Only the main control variables discussed in this paper are shown.
Table 4. Results of the heterogeneity of good service quality’s premium in real estate value.
(1)(2)(3)(4)(5)
Ln_priceLn_priceLn_priceLn_priceLn_price
D_highprice × PS0.027 *** 0.017 ***
(31.271) (17.021)
D_highprice0.094 *** 0.145 ***
(39.242) (54.744)
D_large × PS 0.030 *** 0.006 ***
(30.743) (5.915)
D_large −0.097 *** −0.096 ***
(−43.546) (−39.806)
D_old × PS −0.021 *** −0.016 ***
(−20.245) (−16.062)
D_old −0.046 *** −0.006 **
(−18.837) (−2.489)
D_suburbs × PS 0.027 ***0.024 ***
(27.008)(26.132)
D_suburbs −0.151 ***−0.135 ***
(−44.393)(−43.561)
PS0.022 ***0.012 ***0.042 ***0.024 ***0.014 ***
(33.002)(14.299)(62.964)(29.194)(14.042)
Constant10.615 ***10.618 ***10.458 ***10.537 ***10.514 ***
(1117.656)(1032.164)(984.890)(1018.480)(1079.082)
Control other variablesYesYesYesYesYes
Year-fixed effectYesYesYesYesYes
Jiedao-fixed effectYesYesYesYesYes
Observations150,400150,400150,400150,400150,400
R20.8060.7750.7800.7840.815
Note: (1) *** indicates significance at 1% level; ** indicates significance at 5% level. (2) The numbers in parentheses indicate robust t-statistics. (3) Only the main control variables detailed in this paper are shown.
Publisher’s Note: MDPI stays neutral with regard to jurisdictional claims in published maps and institutional affiliations.

