Article

Function Replacement Decision-Making for Parking Space Renewal Based on Association Rules Mining

1
College of Civil Engineering and Architecture, Zhejiang University, Hangzhou 310058, China
2
Center for Balance Architecture, Zhejiang University, Hangzhou 310028, China
3
School of Spatial Planning and Design, Zhejiang University City College, Hangzhou 310015, China
*
Author to whom correspondence should be addressed.
Land 2022, 11(2), 156; https://doi.org/10.3390/land11020156
Submission received: 7 December 2021 / Revised: 16 January 2022 / Accepted: 19 January 2022 / Published: 19 January 2022

Abstract

:
Parking lots are typical urban spaces with a large total area and scattered distribution. With the development of smart cars and shared driving, parking demand is likely to decline. Thus, the reuse of existing parking spaces presents important opportunities and challenges in the process of the digital transformation of future cities. One of the key issues in the sustainable renewal of parking spaces is to make scientific decisions regarding the replacement of functions. Based on relevant data from the urban area of Hangzhou, this study analyzes the spatial co-location relationships between parking spaces and other urban points of interest (POIs). By mining the function association patterns, this research aims to establish a decision-making support model for the function replacement of parking spaces. The following conclusions are drawn: (1) based on charge, size, and affiliation, parking lots can be divided into eight categories; (2) parking lots of different charges, sizes, and affiliations differ in their spatial co-location relationships with POIs; and (3) most parking lots are suitable for catering services, followed by companies and commercial residences. The innovations of this research lie in providing scientific references for the renewal of urban fragmented spaces by mining urban function association rules at the microscale.

1. Introduction

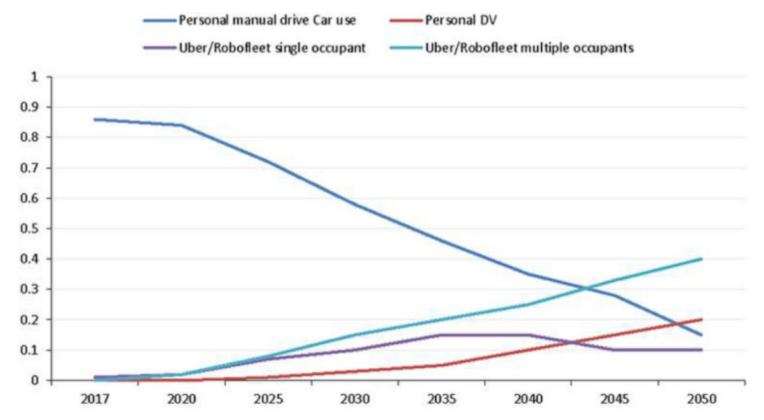
1.1. Shared Autonomous Vehicles and Parking Space Renewal

In future smart cities, intelligent transportation (such as shared unmanned driving) characterized by interconnection, sharing, and automation will improve travel efficiency while having another positive impact on urban development: a significant reduction in public parking spaces [1,2,3,4]. Carlo Ratti, director of MIT’s Senseable City Laboratory, pointed out: “Currently, American cars are parked on average about 95% of the time [2].” According to a report from the Transportation Research Institute of the University of Michigan, once driverless cars are adopted, US car ownership will drop by up to 43% in the scenario of level four self-driving (highly autonomous driving) [5]. Additionally, each driverless car can replace 10–30 operating vehicles [4]. Shared autonomous vehicles (SAVs) have a high operating rate and a large degree of sharing, which significantly reduces the amount of required parking area [6,7]. Furthermore, future parking buildings dedicated to SAVs are completely different from traditional parking lots and can save more space through management using artificial technology [8]. It is estimated that completely unmanned driving technologies can be marketed around 2025 [3]. Based on Simons’ estimation [9], personal driverless cars, along with Uber/Robofleet, will account for approximately 50% of vehicles in 2035, and possibly up to 75% of vehicles by 2050 (Figure 1). Therefore, many existing public parking spaces must be transformed and reused for other purposes in the near future.
Urban parking spaces are a huge and widely distributed type of urban stock space. According to a report by the Bank of America, 13% of the land in urban areas in the United States is used for the construction of parking lots [2]. As Shoup indicated [10], when deciding on parking lots, city planners often adopt a parking space allocation index based on the development volume of land use [11,12]. Similarly, major Asian cities have minimum accessory parking standards for construction projects, and the number of equipped parking stalls per 100 m2 floor area is 0.3 to 1.0 (Figure 2) [13]. Although this minimum allocation standard could ease parking restrictions by supplying a reasonable number of parking facilities, it still consumes considerable land resources and encourages motor vehicle travel. Hence, existing parking spaces are bound to become important challenges and opportunities for sustainable urban renewal in the future. The socio-economic significance of parking space renewal lies not only in coordinating technological innovation with the evolution of urban morphology, but also in tapping the spatial value of the built environment. At the theoretical level, it will give birth to new methods of microscale urban renewal.

1.2. Function Replacement for Parking Space Renewal

One of the key issues in the reuse of parking spaces is function positioning [7]. Although the total area of urban parking spaces is large, they have a scattered distribution and diverse forms, such as on-street parking, open-air parking, parking buildings, underground parking, and roof parking. Therefore, function replacements should consider the environmental characteristics of spaces to be renovated. Additionally, the urban organisms are a place of diversity and characterized by the compounding of various functional elements [14,15]. The organizational patterns of urban spaces and functions have their own logic, which is established in the long-term history of urban development [14]. As the basic function of modern cities, parking spaces are deeply embedded in the structure. In this sense, understanding the association rules of parking spaces and other urban functions at the microscale could offer references for their function replacements. Nevertheless, this is still a research problem that needs to be addressed, which may be very important in future urban scenarios where SAVs are adopted.

1.3. Research Purpose

This study aims to establish a function replacement decision model for the renewal of urban parking spaces. Based on a statistical analysis of the spatial relationships between parking spaces and urban POIs, this research mines the association rules of urban functions at the microscale. Taking the urban area of Hangzhou as an example, this study provides scientific references for urban renewal design strategies in the process of digital urban transformation. The contributions of this study are as follows:
(1)
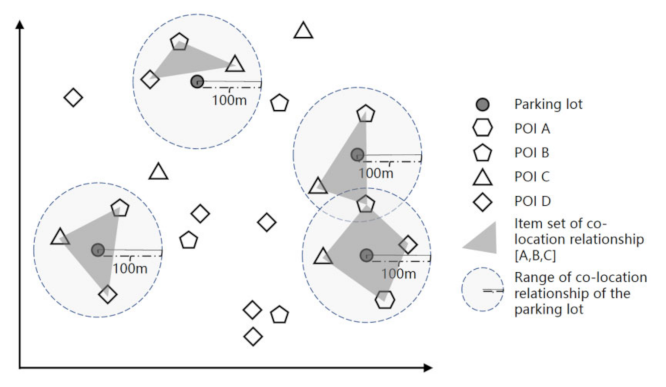
It analyzes the urban function organization pattern at the microscale level by calculating the co-locational relationships between parking spaces and other POI types;
(2)
It establishes a new function replacement decision model for the renewal of urban parking spaces, based on the association rules of existing urban functions.

2. Literature Review

2.1. Urban Function Positioning and Replacement

Urban functions are a spatial organization formed naturally, based on comparative advantages and resource endowments in the process of urban development and evolution [14]. In general, an urban function is an attribute through which a piece of land is characterized (descriptive function) or regulated (normative function). Further, it has frequently been the focus of research in many fields such as urban geography, planning, and economics [15]. Urban function is the carrier of urban development, and the improvement in urban development quality is manifested in the continuous optimization of urban functions [16]. Optimizing urban functional structures and improving urban environmental quality have become important ways to achieve high-quality urban development and resolve major social contradictions [17].
Recently, urban function renovation at the microscale level has received increasing attention [18]. For example, Sui et al. [19] pointed out that existing research lacks an objective evaluation of the succession of specific functions in the microscopic view. Schumacher illustrated the shortcomings and limitations of large-scale urban renovation models and encouraged the adoption of small-scale urban renovation models [20]. Recently, “renewal,” “urban acupuncture,” and ”small-scale progressive renewal” have been advocated worldwide, emphasizing targeted renewals on an original basis instead of massive demolition and reconstruction. Urban acupuncture [21,22] advocates the use of small-scale precision interventions to improve the overall urban environment at a diffuse and capillary level. Relevant research also discusses how to achieve overall urban function development by improving the linkage between incompatible functions at microscale without making large-scale reconstructions [23,24].

2.2. Methods for Parking Space Reuse

Regarding the renovation of parking lots, Ziegenfuss [25] established an evaluation method for function replacement. She analyzed public activities suitable for different types of ground parking lots and discussed implementation strategies for the temporary reuse of parking spaces. Simons and Kline discussed the evolving trend of parking spaces under an SAV scenario and proposed a simple method for evaluating the reuse potential of parking buildings [26]. From an economic perspective, their method can determine the appropriate replacement functions for parking buildings, including day care, recreation rooms, offices, housing, storage, data centers, stacked parking, and other ancillary spaces needed to support residential uses. Moreover, through an exploratory analysis, they identified key factors concerning suitability for reuse, such as floorplate size, ceiling height, zoning, views, and air rights. Nevertheless, the above-mentioned methods concentrated on the internal spatial attributes; they ignored the fact that parking spaces are a sub-system of urban function structures. External environmental conditions (surrounding urban spaces and functions) could also be very influential when making decisions on function replacement.

2.3. Association Rule Mining of Urban Function at the Microscale

Association rules are an important type of pattern hidden in the data [27]. Association rule mining is an important task in data mining and has been widely studied in the field of databases and data analysis [28]. In 1993, Agrawal et al. first proposed the concept of association rule mining [29]. He pointed out that the goal of association rule mining is to determine the concurrency relationships contained in data items. Subsequently, many scholars began to conduct extensive research. A series of related algorithms and applications in multiple fields have appeared, among which the Apriori algorithm is the most primitive and classic algorithm for association rule mining [27,28]. Spatial co-location pattern is a type of spatial association rule that represents the regularity of different types of geographic entities frequently appearing in clusters in adjacent areas of space [30]. It also has great application value in many fields, including ecology, public safety, environmental health, transportation, and commerce [31].
Currently, association rule mining for the co-location relationship of points of interest (POIs) is an emerging technology for microscale urban function analysis. POIs are point data that represent real geographic entities, including spatial information (e.g., latitude, longitude, and address) and attribute information (e.g., name and category). Understanding the spatial patterns of massive social and economic POI data can improve the rationality of the decision-making process of urban planning. For example, Chen established a mathematical model based on the abstract relationships between urban function nodes to solve the problem of function node prediction [32]. Yu et al. analyzed the association modes and dependence relationships of urban infrastructures by mining the co-location patterns of POIs in Shenzhen [33]. Using POIs data, Chen et al. proposed a new method for mining the co-location patterns of urban activities to identify their commonalities and uniqueness in urban functional space organization [34]. Jiang et al. conducted an identification and feature analysis of urban functional areas based on the proportions of POIs in urban space units [35].

3. Materials and Methods
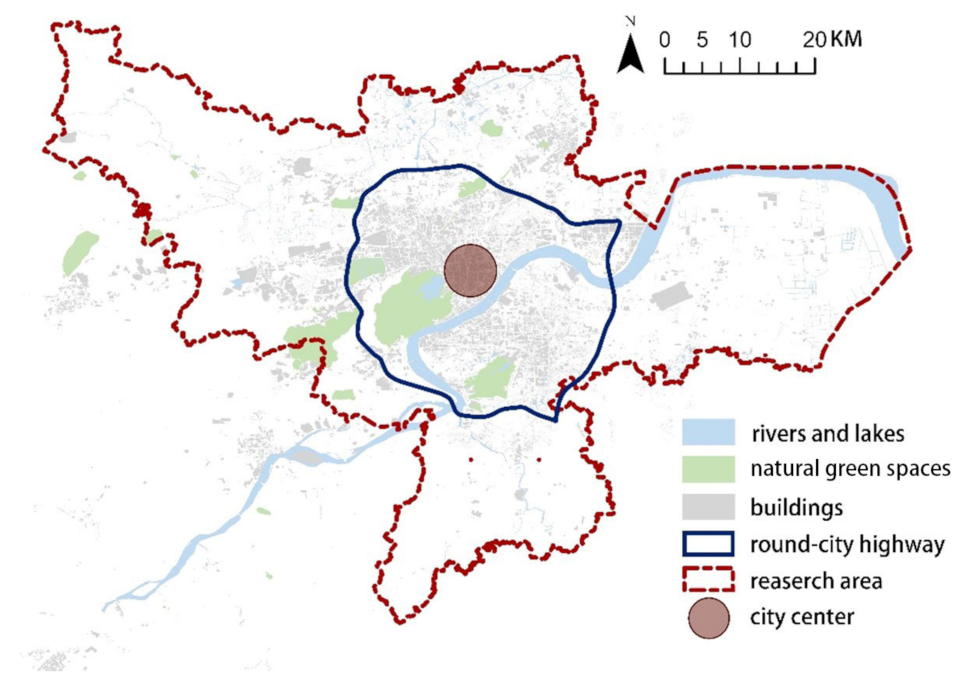
3.1. Research Area

Hangzhou is a major city in China with a large population of 10.71 million and a constructed area of 666.18 square kilometers [36] (Figure 3). It has subway routes 306.30 km in length and 1307 bus operation lines [36]. The city also has a large number of private vehicles, with a total of 2.30 million cars in urban districts [36]. Hangzhou has become a leading area in China’s innovative applications of artificial intelligence [37]. The residents of Hangzhou have a high degree of acceptance of digital technology used in urban governance and daily life, such as mobile payment, smart transportation systems, and smart logistics systems. Meanwhile, because of the high rate of car ownership (approximately 215 private vehicles per thousand people) and high level of traffic congestion (the fifth most congested city of China) [36], the city has a strong traffic demand with unmatched traffic conditions. It can be assumed that the implementation and popularity of shared driverless cars in the future will be attractive to residents [38]. Therefore, the urban area of Hangzhou was selected for the scope of this study.

3.2. Data Source

In this study, parking lots data were obtained from the application programming interface (API) of the Juhe Data Company (www.juhe.cn, accessed on 6 December 2021). Data characteristics, such as parking lot name, latitude and longitude coordinates, parking lot affiliation, parking lot size, and parking charge price, were collected as tables and posts in the digital layer in a GIS environment as a point feature class. Parking lot affiliation refers to the function of building with which a parking lot is affiliated, including commercial building, office, public institution, residence, mixture of commercial and residential buildings, mixture of commercial and office buildings, and tourist attraction. Finally, there were a total of 2320 points in the study.
The urban POIs of Hangzhou were obtained from the API interface of the AutoNavi map data (www.amap.com, accessed on 6 December 2021). There were three levels of POI classification in the AutoNavi map. The detailed classification labels were too complex to accurately interpret the spatial characteristics of the urban functions. Of the three levels of classification, the major category labels are close to China’s urban land function standards and are commonly used in urban function analyses [39,40]. Thus, the major categories of labels were selected for empirical study, and encompassed 14 categories: accommodation services; sports and leisure services; public facilities; companies and enterprises; medical care services; commercial residences; government agencies and social organizations; car services; daily life services; scientific, educational, and cultural services; shopping services; financial insurance services; scenic spots; and catering services. After cleaning, 877,720 data points were obtained.

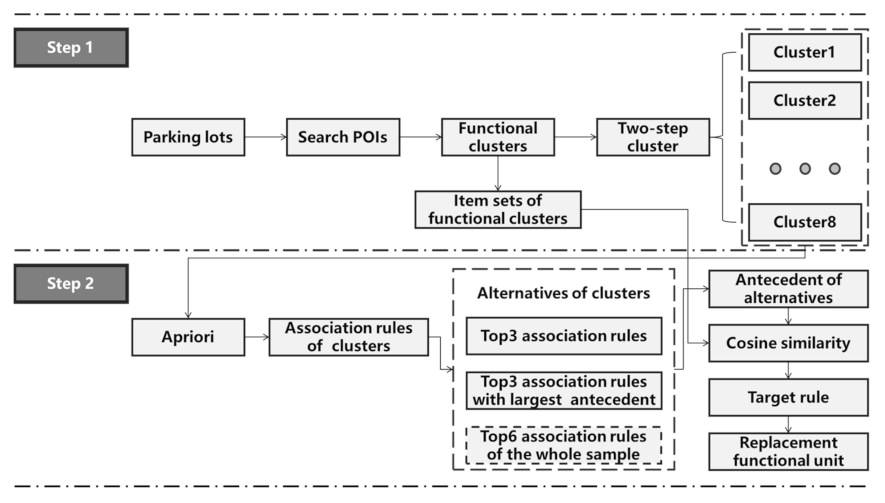
3.3. Research Process

To find the best replacement function of parking space renewal, this study first explored the spatial correlations of urban functional units around the parking spaces and then derived the best replacement functions of parking spaces through association rules. To achieve this goal, two steps were taken: a basic characteristic analysis and association rules mining (Figure 4).

3.3.1. Basic Characteristics and Spatial Statistics

First, this research clarified the spatial distribution of the parking lots. In addition to location, the three most basic inherent characteristics of the parking lot were analyzed: charge (parking charging price), size (number of parking stalls), and affiliation (the type of building to which the parking lot is attached). Then, this research explored whether the inherent characteristics of parking lots had an impact on the spatial correlation with the surrounding urban functional units. Such an analysis was based on the spatial statistics of the urban POIs around each parking lot. POIs within 100 m of the parking lot were counted and recognized as parking lot functional units (Figure 5). This functional unit, hereinafter referred to as “functional cluster,” was used as a sample of association rules mining. According to relevant research [41,42], a space within this range (100 m) is comfortable for walking and the spatial association rules within this range are relatively clear for identification, considering the density of POIs.
If the characteristics of the parking lot affect the spatial correlations between the parking lots and POIs, this indicates that many association rules might only be meaningful for some small groups of parking lots that have similar characteristics. Therefore, in addition to the association rules for the full sample, local association rule mining for a subset of full samples is required. Thus, this research adopted a two-step clustering method to group the parking lots according to their characteristics before conducting association rule mining for each group.

3.3.2. Association Mining and Function Replacement

In this study, Apriori was used to mine the association rules. The Apriori algorithm uses indicators such as support, confidence, and lift to indicate the frequency of the association rules. At the microscale, urban function clusters could be sparse [33,34], therefore reasonable threshold parameters in Apriori should be set to ensure the reliability of the association rules obtained. Referring to existing research [43,44] and considering the spatial distribution of parking lots, the association rule thresholds were set at a minimum support degree (25%) and a minimum confidence degree (90%). The lift degree of the rule should not be less than one to avoid the interference of false rules.
In the actual data set, a subset of long rules is more likely to receive higher support degree. However, rules that are too short might have weak practical significance. Therefore, in this study, association rules whose numbers of antecedents were no less than five were used to guide function replacement, and were called “rich association rules.” For each cluster, the top three association rules and the top three association rules with the largest numbers of antecedents were selected in descending order of support degree. Then, a total of six association rules were collected as alternatives for function replacement. If there were fewer than six rules, they were supplemented by the top six association rules in the full samples, which were selected according to the descending order of support degree.
In an ideal state, the target replacement function could be directed towards its target by simply looking for the rules in the set of alternative rules. These rules are considered consistent with the elements of the function cluster around the parking lot. However, because the association rules were limited by support, confidence, and lift, the association rules might be “shorter” than the item sets before filtering by the three rules. This meant that the numbers of antecedents in some alternative rules were likely to be less than the numbers of elements in functional clusters. Theoretically, an item set of more than five POIs could reach 3432 combinations, which might be much higher than the number of rules for a single cluster. Therefore, this research used “similarity” instead of consistency for selecting the target rules. Specifically, cosine similarity was used to evaluate the suitability of alternatives. Through a cosine similarity comparison, the alternative with the highest similarity was selected as the target rule and the consequence of the target rule was considered to be a replacement function. Finally, the alternative results for all parking lots were calculated and analyzed.

3.4. Method of Mining Association Rules

3.4.1. Apriori

The mining of association rules was a core part of this research. It concerned how to determine the kind of urban function unit that is the best alternative for parking lots when facing a multi-type urban function combination. Within a certain spatial range (within the range of the parking lot function cluster in this study), multiple types of urban function units might exist simultaneously. These units could have complex interrelationships. Therefore, the many-to-one instead of one-to-one spatial associations was calculated and analyzed for actual urban function replacement.
In this study, since 14 labels were used to characterize the POI data of urban function units, the number of possible combinations of these labels would be 214. Therefore, this study adopted the Apriori algorithm as the data mining method to cope with the large capacity and complexity of the data. Apriori is a classic association rules mining algorithm first proposed by Agrawal et al. in 1993 for shopping basket analysis [29]. Since then, it has been widely used in commercial consumer behavior, network security, management, and other fields [45,46,47]. In recent years, it has gradually been applied by scholars in geography and urban planning to discuss the layout of urban facilities [43].
Association rules can be expressed as the form “XY” which means that if X occurs, then Y occurs. In this association rule, X is the antecedent, which is the condition of an event and Y is the consequent, which is the result of an event. For example, in this research, there might be an association rule “shopping services→catering services”, which means that if there is a shopping service, then there may also be a catering service nearby. If the association rule “shopping services→catering services” does not exist in all cases, then a method to describe the frequency of the association rule is needed. In the Apriori algorithm, three indicators—support, confidence, and lift—are used to indicate the frequency of the association rules.
The degree of support refers to the probability of “XY” in all item sets, and the formula is as follows:
S u p p o r t X Y = P X Y = N u m b e r X Y / N u m b e r A l l s a m p l e s
where Support(XY) is the degree of support and P(XY) is the probability that both X and Y are included in the item set. Generally, a minimum threshold (minimum support) is set to remove association rules with a low probability of occurrence and to obtain an item set with a higher probability. For example, if there are 100 function clusters, among which 10 clusters have both shopping and catering services, then the support degree of “shopping services→catering services” is 10%.
The confidence degree represents the probability of item sets containing both X and Y in the item sets containing X. The formula used is as follows:
C o n f i d e n c e X Y = P Y | X = P X Y / P X
where Confidence (XY) is the degree of confidence and P(Y|X) represents the probability of Y occurring under the condition that X occurs in the association rule. Similar to the support degree, the confidence degree requires a minimum threshold to be set as a filter condition during the calculation process. In the previous case, if there are 20 clusters containing shopping services among the total of 100 function clusters, and 10 clusters have both shopping services and catering services, then the confidence degree of “shopping services→catering services” is 50%.
The degree of lift represents the ratio of the possibility of containing X and Y simultaneously as the possibility of containing Y but excluding X. The formula used is as follows:
L i f t X Y = P Y | X / P Y = C o n f i d e n c e X Y / P Y
where Lift (XY) is the lift degree, and P(Y) is the probability of Y. When the lift is 1, X and Y are independent of each other; the higher the lift, the stronger the spatial correlation is between X and Y. In the previous case, if other situations are not changed and if there are 50 clusters containing shopping services of all the function clusters, then the lift degree of “shopping services→catering services” is one.
The input data for the Apriori algorithm in this study are listed in Table 1. The input variables were virtual. Their assignment method was that, if a certain type existed in a function cluster, it was assigned a value of one; otherwise, it was assigned a value of zero.

3.4.2. Two-Step Clustering

Two-step clustering is applicable to the categorization of mixed-attribute datasets and able to automatically find the optimal number of clusters. Therefore, it is suitable for categorizing the parking lots in this research. The method is divided into two steps: the first step is to analyze the samples in the data set one by one and divide them into many small clusters; the second is to merge these small clusters by the hierarchical clustering method and find the best cluster number according to the Bayesian Information Criterion (BIC) [48]. The input variables for two-step clustering are listed in Table 2.

3.4.3. Cosine Similarity

Cosine similarity is commonly used in a similarity comparison of word vectors by measuring the cosine of the angle between two vectors. In this research, the elements in the antecedents of the association rules and those in the function clusters could be regarded as words from a dictionary with 14 words. Thus, the antecedents of the alternatives and item sets of function clusters could be regarded as word vectors. The formula for cosine similarity calculation is as follows:
s i m i l a r i t y A , B = cos θ = i = 1 n A i × B i / i = 1 n ( A i ) 2 × i = 1 n ( B i ) 2
where A i , B i are two vectors A i = [ A 1 , A 2 , , A i ] , B i = [ B 1 , B 2 , , B i ] , respectively, and represent the word vectors of the alternatives and function clusters, respectively, and the subscript i is the index of 14 POI types representing urban functions. The input data are presented in Table 3.

3.4.4. GIS and Relevant Statistical Methods for Correlation Analysis

In this study, GIS was used as the platform for data spatialization, which included the spatial layering of parking lots and POIs, observing the spatial distribution of parking lots, calculating the spatial co-location relationship between parking lots and POIs, generating functional clusters, and finally presenting the results of function replacement. The Pearson’s correlation coefficient was used to evaluate the significance of the co-location relationships. In the end of this research, a cross-analysis based on Random Forest [49] was conducted to analyze the impact of parking lot characteristics on the results of function replacement.

4. Results and Analysis

4.1. General Features of the Analysis of Parking Space

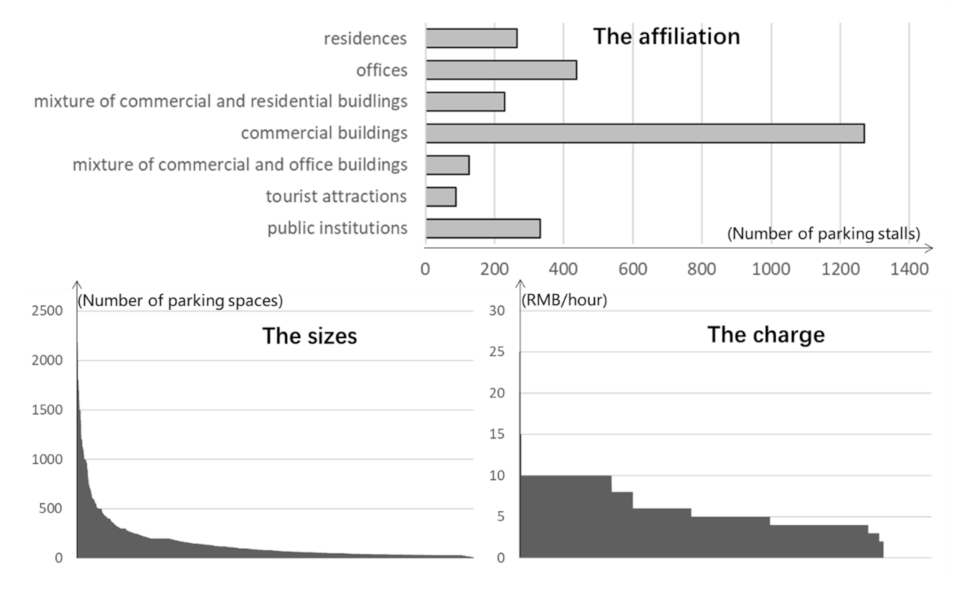
4.1.1. Description on Characteristics of Parking Spaces

As shown in Figure 6, there were seven kinds of parking lot affiliations in Hangzhou: commercial buildings, offices, public institutions, residences, mixtures of commercial and residential buildings, mixtures of commercial and office buildings, and tourist attractions. The number of parking lots for commercial buildings were the largest, with a total of 1062, accounting for 45.78%. This was followed by the number of parking lots for the office, with a total of 384 (16.55%). Parking lots affiliated with public institutions, residences, and mixtures of commercial buildings and residential buildings were relatively balanced, accounting for approximately 10% of all parking lots. The number of parking lots was the smallest for tourist attractions, with only 60, accounting for 2.59%. As shown in Figure 6, both the parking charging price and the size of the parking lots had a long-tail distribution. The average number of parking stalls was 155.47. Further, there were 41 super-large parking lots with more than 1000 stalls, accounting for 1.77% of the total. Regarding parking fees, the average price was 5.53 RMB/hour. Twenty parking lots charged more than 10 RMB/h, accounting for 0.86% of the total. In general, the changes in the sizes and charging prices of parking lots were smooth intervals.

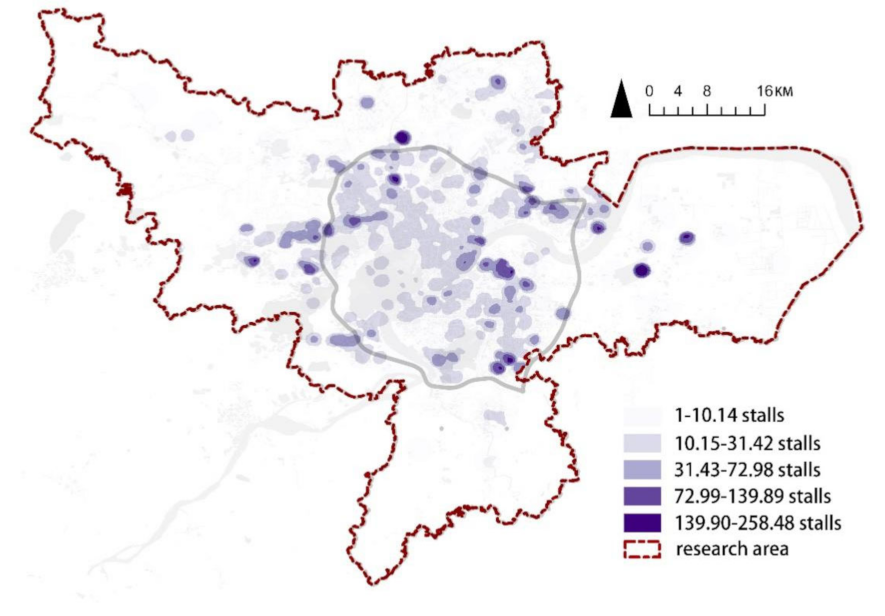
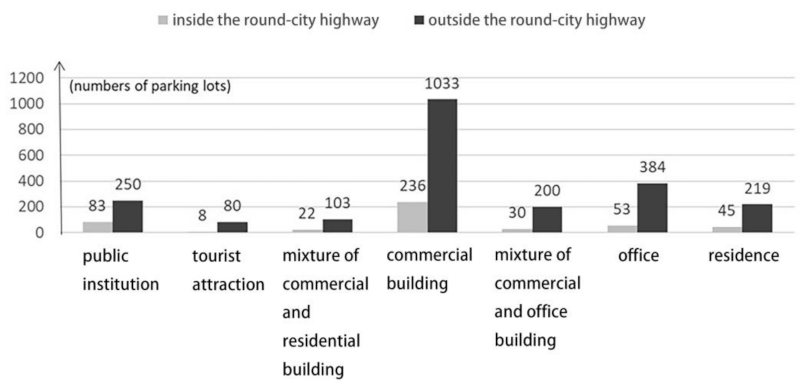
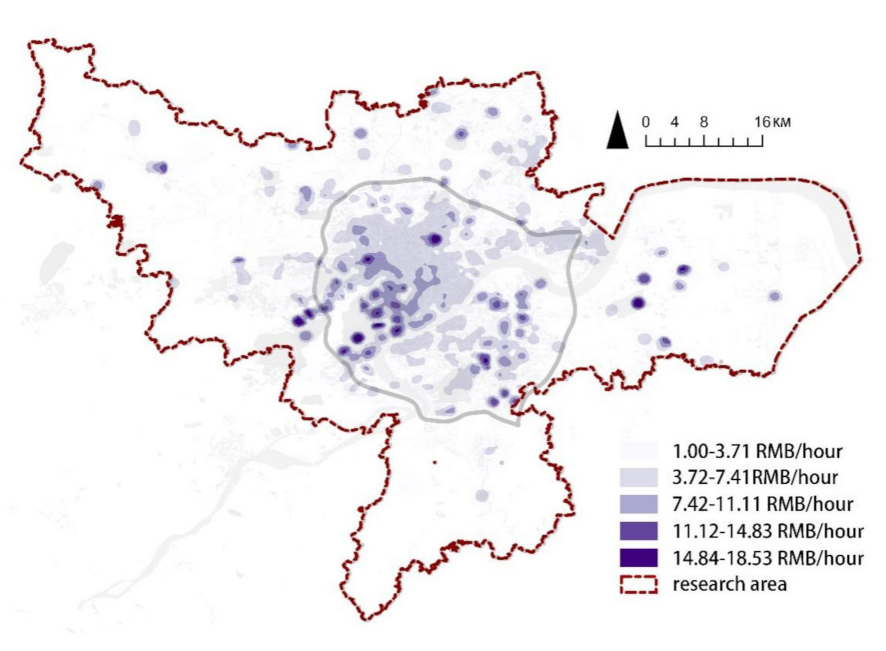
4.1.2. Spatial Distribution of Parking Spaces

The kernel density analysis in Figure 7 shows that the overall spatial distribution of charging prices of parking lots indicated a spatial “core-periphery” model, with higher density in the core area of the city and decreasing density near the suburbs. This pattern was particularly similar to the distribution of land rents. According to the Alonso model [50], land rent gradually decreases from the city center to the surrounding area. The kernel density analysis in Figure 8 shows that the spatial distribution of sizes of parking lots was opposite to that of charging prices. The average size of parking lots in the urban core area was smaller (with less stalls) than that in the suburbs. On one hand, the accessibility of a single large-scale parking lot could not be as good as several small ones. On the other hand, due to the high density and compact space of the downtown area, it was difficult to find a place to build a single large-scale parking lot. However, in terms of the spatial distribution of large parking lots whose stalls were over 140, there was a certain multi-center pattern. In addition to the city center, there were a certain number of large parking lots in the eastern, western, northern, and southern riverside regions, which were closely related to the spatial distribution of shopping malls and office buildings in downtown Hangzhou.
Regarding the distribution of parking lot affiliations, for each affiliation type, the number of parking lots located inside the round-city highway were higher than that outside (Figure 9). Meanwhile, the distribution characteristics differed among the seven affiliation types of parking lots. Those affiliated with public institutions presented an obvious single-center, multi-cluster model. For public institutions, the peak area of the parking lot layout in the city center was much denser than that of the surrounding areas. This might be due to the central layout of the administrative districts. The parking lot layouts for commercial buildings, offices, mixtures of commercial buildings and residences, and mixtures of commercial buildings and offices were relatively similar to multi-center patterns. Large-scale medium-density areas were formed in the west, riverside, and east of these affiliation types. Residential parking lots were more evenly distributed; although they also formed a multi-center pattern, and some belt-shaped areas were connected. The distribution of the above six affiliation types was generally different in shape, but a common feature was the spatial pattern of “city center-peripheral clusters.” Conversely, the type of tourist attraction was decentralized. Except for the West Lake Scenic Area close to the city center, which reflected the unique spatial form features of Hangzhou, the rest were scattered across various scenic spots.
The preliminary data analysis showed that there was strong independence among the charging price, stall number, and affiliation type of parking lots. The Pearson correlation coefficient between the charging price and stall number was extremely low (less than 0.1). Moreover, neither the charging price nor stall number could be used as a sufficient explanatory variable to explain the affiliation type of the parking lots. The distributions of the three, especially the charge, had a strong correlation with location. However, because the research scope was not an ideal surface state [50], the charge distribution was not uniform in all directions, as shown in Figure 5. Therefore, the explanatory power of the spatial location for microscale space was invalid in this research. In other words, the basic three characteristics of parking lots could not be simply represented by spatial location. These three characteristics should be considered in the spatial analysis of parking lots. On this basis, 2320 parking lot function clusters were counted as basic samples of spatial association.

4.1.3. Co-Location Relationship of Parking Space and POIs

This study explored the relationships between POIs of various types and parking lots based on the calculation of parking lot function clusters. The sample groups, divided according to the three basic characteristics of parking lots, were compared. The Pearson coefficient was used to reflect the strength of the co-location relationship. If the Pearson coefficient was 0.9 or greater, then it was considered a strong correlation. If the Pearson coefficient was between 0.6 and 0.9, it was considered a general relationship. A Pearson coefficient of less than 0.6 was considered a weak relationship.
In this study, the samples were divided into three groups according to parking charging price: low (lower than 4 RMB/hour), medium (4–6 RMB/hour), and high (greater than 6 RMB/h). As Table 4 shows, the co-location relationships differed at the three price intervals. In the low-price range, parking lots had a strong correlation with commercial residences. The POIs of science, education, and cultural services, sports and leisure services, accommodation services, and financial and insurance services were generally correlated with parking lots, whereas other POI types showed a weak correlation. In the medium-price range, the discrepancy in the correlations was significant. There were strong relationships between parking lots and POIs of scientific, educational, and cultural services, commercial residences, government agencies and social organizations, sports and leisure services, companies and enterprises, daily life services, and medical and health services. Finance and insurance, catering, accommodation, and car services were generally related to parking lots. The remaining POI types were weakly related. In the high-price interval, only general and weak correlations existed. General correlations included science, education, cultural services, and automobile services. In general, in the medium-price interval, the co-location relationships between parking lots and POIs were more obvious than in low-or high-price intervals.
According to the stall number, the parking lots were divided into three sizes: small (from 0 to 50), medium (from 51 to 150), and large (more than 150). As shown in Table 5, scenic spots, commercial residences, medical care services, and scientific, educational, and cultural services were all strongly related to small parking lots. For the same group, companies, public facilities, government agencies, social organizations, car services, catering services, and shopping services were generally related, while the rest were weakly related. For medium-sized parking lots, catering and accommodation services were strongly related, while scientific, educational, and cultural services, daily life services, scenic spots, sports and leisure services, shopping services, and car services were generally related. The remaining POI types were weakly related. For large parking lots, government agencies and social organizations and scientific, educational, and cultural services were strongly associated with parking lots, while scenic spots, medical and health services, commercial housing, companies and enterprises, public facilities, daily life services, shopping services, sports and leisure services, and financial and insurance services were closely related. The remaining types were weakly related. Compared with Table 4, the average discrepancy of correlations between different size groups was not as obvious as that between charge groups, although the change tendency of correlations between groups varied for different POIs, as shown in Table 5. Furthermore, the average value of the Pearson correlation coefficients in Table 5 was higher than that in Table 4, indicating that size (stall number) was a feature that significantly affected the status of parking spaces in the urban function structure.
As shown in Table 6, there was a large difference between affiliation groups in terms of the co-location relationship between POIs and parking spaces. For parking lots for commercial buildings, accommodation services were strongly related. Public facilities, companies and enterprises, shopping services, financial and insurance services, scientific, educational, and cultural services, automobile services, a mixture of commercial residential buildings, and life services were generally related. The remaining POI types were weakly related to parking spaces. Parking lots affiliated with office buildings were strongly related to daily life services, sports and leisure services, medical and health services, government agencies, social organizations, and accommodation services. Scenic spots, public facilities, companies and enterprises, shopping services, financial insurance services, scientific, educational, cultural services, car services, commercial residences, daily life services, sports, and leisure services were generally related. The remaining POI types were weakly related. Parking lots for public institutions were moderately connected with only two POI types: sports and leisure and accommodation services; and weakly related to all the remaining POI types. Parking lots for residential buildings were strongly associated with public facilities, companies and enterprises, scientific, educational, and cultural services, government agencies and social organizations, and accommodation services. They were generally associated with catering, shopping, financial insurance, daily life, sports and leisure, and medical care services. The remaining POI types were weakly associated. Parking spaces for a mixture of commercial and residential buildings were strongly associated with companies and enterprises, government agencies, and social organizations, and were generally related to catering services, public facilities, shopping services, daily life services, sports and leisure services, medical care services, and accommodation services. The remaining types were found to be weakly associated. Parking spaces affiliated with a mixture of commercial and office buildings were strongly related to financial insurance and car services, while being generally related to sports, leisure, and accommodation services. The remaining types were weakly related. Except for a strong correlation with scenic spots, parking lots for tourist attractions were weakly connected to all POI types.

4.2. Analysis of Function Replacement

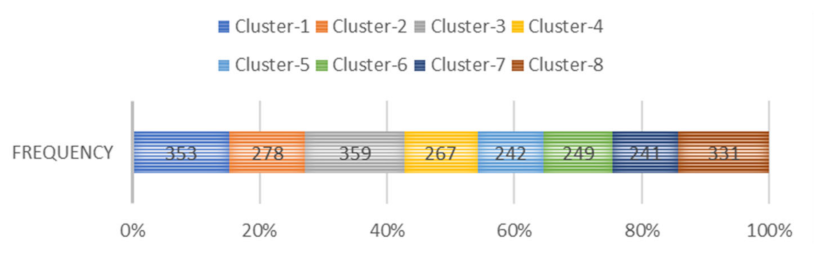
4.2.1. Two-Step Clustering Results

As explained in Section 3.3.1, it is better to divide the sample set before conducting association rule mining. Because all three characteristics (i.e., charging price, size, and affiliation type) affected the co-location relationships between parking lots and POIs, these characteristics should be considered during the grouping process. Additionally, if the sample set was directly cross-divided, the number of divided sample sets theoretically reached 63, taking the levels of these characteristics into consideration. In this research, the quantity of samples in each group would be inadequate to achieve a better generalized performance of rule mining [48]. Moreover, some groups with mixed features were more likely to be a refined classification of the sample set. Thus, the sample set was divided into eight groups by two-step clustering. Figure 10 shows that the largest cluster contains 359 samples, accounting for approximately 16% of all samples, and the smallest sample contains 241 samples, accounting for approximately 10%. Overall, the divisions were relatively balanced, and the contour coefficient was 0.82, indicating that the clustering effect was acceptable.
The parking lots in Cluster 1 were mainly for commercial use (190) or for office buildings (89), with an average charge of 5.00 RMB/hour and an average stall number of 123. Generally, Cluster 1 was comprised of medium priced, large-scale, and commercial affiliations. Cluster 2 was a parking cluster of low-cost (average 3.91 RMB/hour), larger-scale (average 419 stalls), and residential affiliation. Cluster 3 generally included high-priced, small, and commercial buildings. Cluster 4 was an office building parking lot of large-scale and medium cost. Cluster 5 mainly contained large-scale commercial parking lots with medium costs. Cluster 6 mainly contained parking lots for public institutions, which were large-scale and low cost. Cluster 7 mainly consisted of parking lots of medium-scale and high costs, and was composed mostly of a mixture of commercial and residential buildings. Cluster 8 was a cluster of parking locations for commercial buildings of small-scale and low costs.

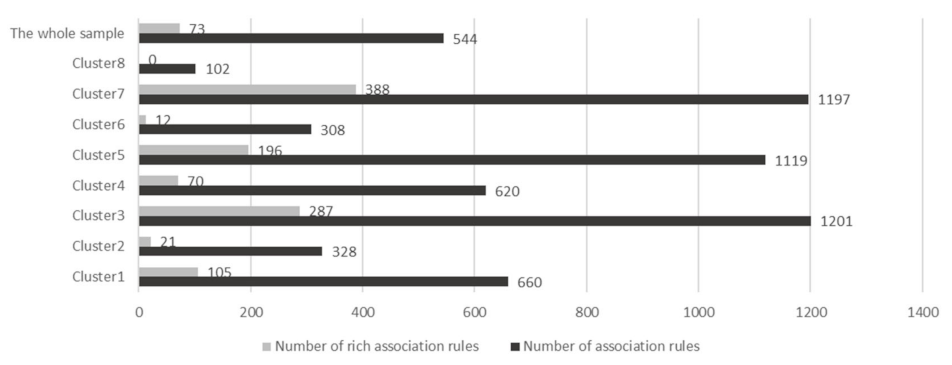
4.2.2. Function Association Rules

Based on a support degree of 25%, a confidence degree of 90%, and a lift degree of one, a rule set composed of 6079 rules was obtained for eight groups and full sample sets. The distribution of the obtained association rules is shown in Figure 11. In the composition of the overall rules, government, science and education, and medical care groups appeared more frequently in the antecedents. Many of these functional units were public institutions that relied on government investment, such as large hospitals, high schools, and public junior high schools. They played an important motivating role in spatial gatherings. In contrast, shopping, catering, and living services accounted for a relatively high proportion of the consequences. Almost all functional units were dependent on the market configuration and had strong spatial compatibility. These were choices with a better generalization performance in the process of functional replacement.
Under the limitation that the length of the antecedents of the rule was not less than five, 1151 association rules were obtained, as shown in Figure 11. There were six types of functions in the consequent, which were the target functions for replacement, as follows: company enterprises, commercial residences, daily life services, scientific, educational, and cultural services, shopping services, and catering services. Of these, the number of rules with science, education, and cultural services as consequent was relatively small, with a total of 99 rules, accounting for 8.60% of the total. This might be because a considerable number of public service functions in science, education, and culture are large-scale facilities configured by the government. Furthermore, the remaining target functions were more balanced with approximately 200 rules for each. In the actual selection process, there was no association rule with more than five elements in the antecedents in the rule set of Cluster 8 (Figure 11). Thus, we used the rule of the full sample set to supplement this. The top two candidate rules of each cluster (sorted according to the degree of support) were listed in Table 7.

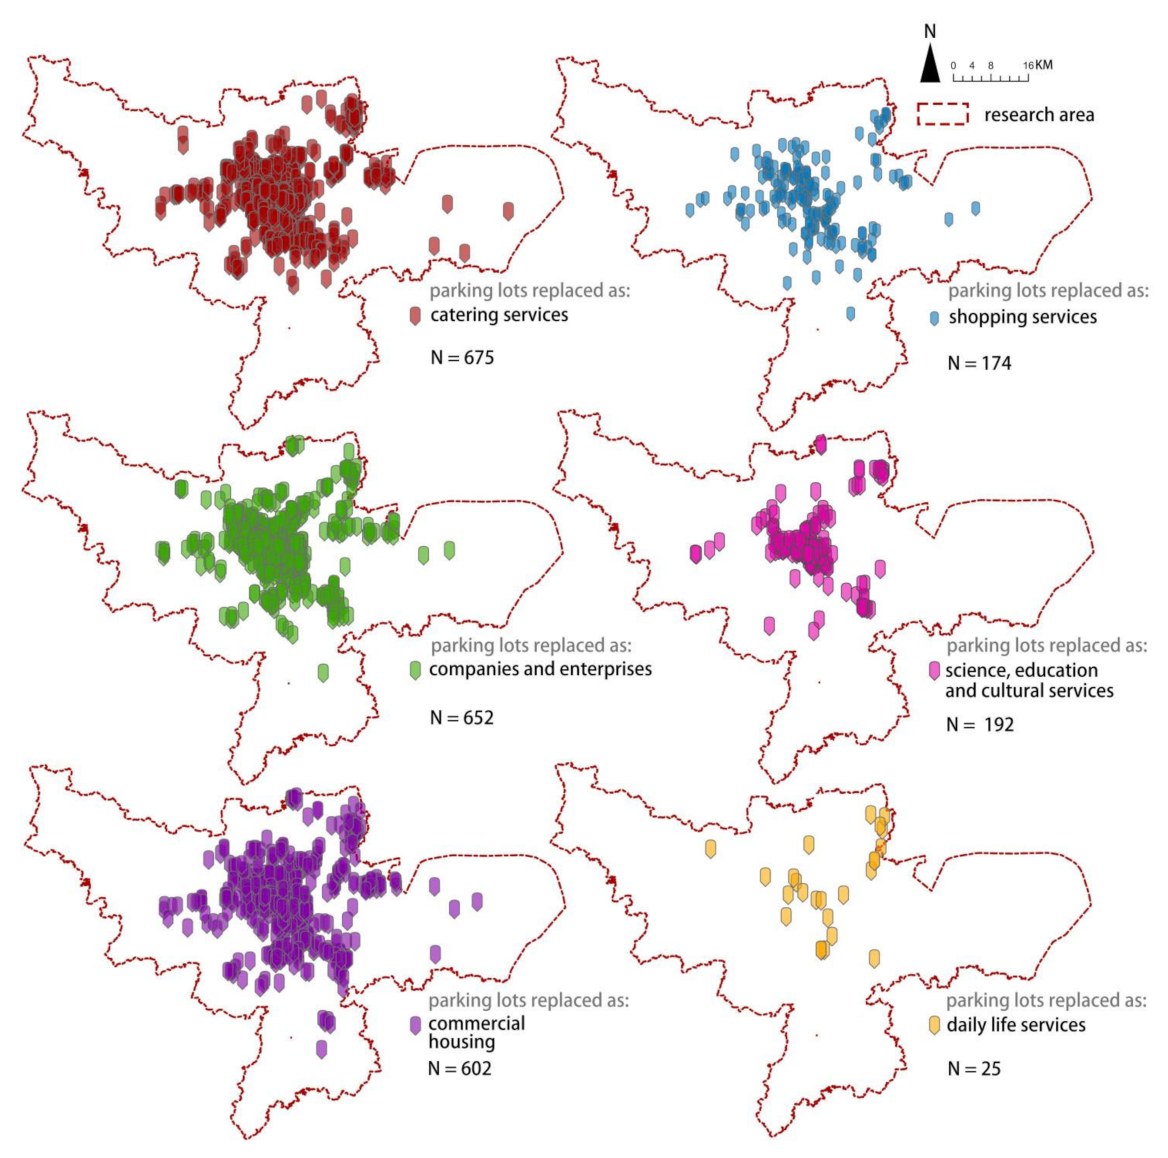
4.2.3. Replacement Results Based on the Association Rules

Figure 12 shows the function replacement results for 2320 parking lots in Hangzhou by similarity matching based on the association rules. As shown in Figure 12, 675 parking lots were expected to be replaced by catering services, accounting for the highest proportion (29.09%) of all the samples. The second alternative was companies and enterprises (28.10%), followed by commercial residential buildings (25.95%). The remaining three POI types accounted for relatively small portions, including 192 parking lots replaced by scientific, educational, and cultural services, accounting for 8.28%, and 174 parking lots replaced by shopping services, accounting for 7.50%. The number of parking lots suitable for daily life services was the lowest, at only 25, accounting for 1.08%.
A cross-analysis of the replacement results and parking lot characteristics (Table 8) showed that parking lots replaced by companies and enterprises were more likely to be larger-size, higher-charging parking lots affiliated to office buildings. The parking lots that were most likely to be replaced by commercial residences include office parking lots with super-large and low-to-medium charging prices or parking lots for mixtures of commercial and residential buildings with moderately high charging prices. This indicated that commercial residences require larger reserved spaces adjacent to offices or central areas. Another case involved parking lots affiliated with tourist attractions with lower prices, indicating that commercial residences also preferred scenic spots with a good environment. Parking lots replaced by science, education, and cultural services were more likely to be affiliated with public institutions with lower charging prices, which might result from the public welfare nature of this urban function. Others to be replaced as science, education, and cultural facilities were more likely to be transformed from parking lots for commercial buildings with higher charges. Nowadays, mass education is generally valued; therefore, market-oriented urban units of science, education, and culture services have higher rent-paying capabilities and tend to select locations with better business environments. Shopping services were highly compatible and could replace parking lots in public institutions, office buildings, and commercial buildings. Generally, the rent-paying capacity of entities for shopping services is strong, and their requirements for space size are relatively flexible. Therefore, small or large parking lots were both suitable to be replaced as shopping services. Catering services also have strong rent-paying capacity. They were more likely to replace parking lots for office buildings, which demonstrated that catering services were highly correlated with working spaces and deeply affected by the employee population. In general, daily life services should be closer to the resident population and were more likely to replace parking lots affiliated with residences. Comparatively, some daily life functions, such as laundry and electrical appliance maintenance shops, do not require large spaces and could replace medium-sized parking lots.

5. Discussion

5.1. Decision-Making of Function Replacement of Parking Space

In the scenario of SAV adoption, the renewal and reuse of urban parking spaces is an important issue faced by urban management and planning departments. Function positioning is the basis for the design and implementation of parking space renewal. Most previous studies have focused on the characteristics of architectural space and structural status in order to compare the adaptability of the functions to be replaced. Few studies have considered the functional positioning of individual cases based on the logic of urban function structure. However, an architectural design scheme is the result of the combined action of internal and external factors [51]. The renewal decision-making at the microscale should consider the environmental factors at the macroscale [19,20,21,22,23,24].
Based on the analysis in Section 4.1, this study found that the characteristic difference in parking spaces was significant, and the distributions of these characteristics were very uneven among samples. For large urban spaces, such as parking lots, it is necessary to first classify them based on their characteristics and then implement renewal strategies according to the classifications. Second, the geographical distributions of parking spaces with different characteristics have certain regularities, indicating that these characteristics reflect the external environmental conditions of parking spaces. For example, the parking charging price is related to urban land rents, and the parking size may characterize the area’s motor vehicle accessibility. The functions of the buildings to which parking spaces are attached are directly related to the urban function layout. Hence, to better understand the renewal potential of existing architectural spaces, the external environment cannot be ignored. Any architectural function should be considered based on the relationship between the building and city.
The spatial co-location relationships between parking spaces and POIs indicate that there is a logic of urban functional organization at the microscale. As discussed in Section 4.1.3, spatial relationships are influenced by the characteristics of parking lots. For example, parking lots with higher charging prices are often located in areas with higher land rent and density, where parking lots are denser (as shown in Figure 7). Therefore, the setting of parking lots in these places mainly considers the availability of space that can be used as parking instead of the accessibility of the space to other urban functions. In contrast, in urban fringe areas, parking lots and POIs are both relatively scattered, and parking lots are better located around large buildings for convenience of use. Therefore, the spatial co-location relationship is not significant. Similarly, the differences between the parking space size groups (Table 5) can be explained by the characteristics of the POIs. For example, large hotels that provide accommodation services in cities are generally fewer than small-or medium-scale hotels. For economic reasons, ordinary city hotels do not set up large parking lots. Meanwhile, a parking lot that is too small may also be inconvenient. As for the results in Table 6, they can be regarded as the relationships between urban functions, with parking lots observed as an intermediary. As shown in Table 6, the parking lots for residences have the highest correlation with POIs among all urban functions, while public institutions have the weakest correlation. This result is also reflected in the most relevant association rules in Table 7. All the most relevant rules contain commercial residences, but only one rule includes the POI type of government agency and social organization. From Table 7 and Table 8, it can be seen that association rules differ between parking lots clusters. Considering that the location of parking lots affects their characteristics to some extent, it might be said that the association rules are influenced by the urban zoning, while the urban zoning could be reflected in the changing proportions of POIs in different urban areas [35]. In this sense, parking space renewal is determined by urban function structures at both micro- and macro- scales. Hence, the decision-making of function positioning for parking space renewal is complex, and a scientific quantitative analysis of this issue is of importance.

5.2. Implications for Renewal of Urban Systematic Space

High-quality urban functional spaces provide strong support for high-quality urban development. Currently, relevant research and practice have mostly focused on the spatial structure and evolution of a single functional type, being the macroscale of cities and regions [52,53,54]. Few studies have discussed the succession of urban functions at a micro-spatial scale. However, the renewal of micro-urban functional and spatial structures directly affects residents’ quality of life [55]. In recent years, urban function renewal has placed more emphasis on improving the functional integration of micro-spaces, achieving the effect of repairing urban texture [56,57,58,59].
Parking spaces organize an urban system. The form and distribution of parking spaces make their renewal mode special. This renewal mode is based on scattered individual cases. However, they can form a network effect at the meso-regional level within a certain time and space, and ultimately play the overall role of a spatial system at the macro-city level [60]. Therefore, a diachronic dynamic process management process is required. In other words, the current process needs to integrate the macro- and micro- perspectives and coordinate the short- and long-term needs. In this sense, this study adopts big data models to establish the association pattern mining of spatial co-location relationships, providing the possibility of exploring a way to update the fragmented urban systematic spaces. The value of this research is also embodied in the coordination of the interests of all parties in sustainable renewal projects for government decision-making and design management.

5.3. Limits and Prospects

Apart from the limitations related to the research scope and data size, the following aspects still need to be addressed in future research.
First, urban functions are diverse and continue to change. In particular, the functional subdivisions of micro-urban space are more complicated [15,19]. The results of this study and the decision-making model are based on an analysis of the existing elements of the urban functional structure. However, in future urban renewal, various new functions will appear that need to be incorporated into the existing urban functional structure. Therefore, future research needs forecasting methods that can integrate new urban microscale functions. These methods may be based on expert opinions and an exhaustive method to mine association patterns.
It is also worth noting that sustainability issues in digital transformation lie not only in the rationality of urban functional structures, but also in the matching of function and form. For example, the renewal of underground parking spaces is subject to the original form, so a better combination of function and space can result in better performance, for example, of energy efficiency and carbon emission [61,62]. Therefore, the urban renewal of systematic spaces, such as parking lots, requires a unified and comprehensive consideration of multiple goals.

6. Conclusions

With the advent of shared autonomous vehicles, parking demand will be greatly reduced, and existing urban parking spaces will be reused for new functions. Based on the association rule mining of co-location relationships of parking spaces and POIs, this research establishes a decision support model for the function replacement of parking lot renewal in the process of urban transformation. In total, 2320 parking spaces and 877,720 POIs in the urban area of Hangzhou were used for this analysis. The conclusions of this study are as follows:
(1)
The overall spatial distribution of the scale and price of the parking lot presents a “core-periphery” pattern; while the general distribution pattern of parking space type is a “city center-peripheral cluster”;
(2)
For various parking prices, scales, and affiliation building types, the spatial co-location relationships between parking spaces and POIs are different, and the global correlation between parking lots and POIs is relatively weak;
(3)
In the eight grouped and full sample sets, based on a support degree of 25%, a confidence degree of 90%, and a lift degree of one, a rule set composed of 6079 rules was obtained, of which 1151 rules were with the first item of no less than five;
(4)
The majority of existing parking spaces, most of which are affiliated with office buildings, are suitable for being replaced into the function of catering services. Those for companies and commercial housing are the second and third, respectively;
(5)
The renewal process for urban parking space systems needs to integrate macro- and micro-perspectives and coordinate short- and long-term needs. The decision model based on the urban function association pattern provides a renewal method for a fragmented urban systematic space.

Author Contributions

Conceptualization, B.X. and Y.R.; methodology, B.X.; validation, B.X. and Y.R.; formal analysis, B.X. and Y.R.; investigation, B.X.; resources, B.X.; data curation, B.X.; writing—original draft preparation, B.X. and Y.R.; writing—review and editing, B.X. and Y.R..; visualization, B.X. and Y.R.; supervision, B.X.; project administration, B.X.; funding acquisition, B.X. All authors have read and agreed to the published version of the manuscript.

Funding

This research was funded by the Basic Public Welfare Research Program of Zhejiang Province (grant number: LGF21E080012), Opening Fund of State Key Laboratory of Green Building in Western China (grant number: LSKF202003), Joint Funds of Zhejiang Provincial Natural Science Foundation of China (grant number: LHZ22F040001), and National Natural Science Foundation of China (grant number: 51808486).

Acknowledgments

Special thanks to the reviewers for their remarkable comments, which greatly improved the quality of our work.

Conflicts of Interest

The authors declare no conflict of interest.

References

  1. Silva, D.; Földes, D.; Csiszár, C. Autonomous vehicle use and urban space transformation: A scenario building and analysing method. Sustainability 2021, 13, 3008. [Google Scholar] [CrossRef]
  2. Duarte, F.; Ratti, C. The impact of autonomous vehicles on cities: A review. J. Urban Technol. 2018, 25, 3–18. [Google Scholar] [CrossRef]
  3. Victoria Transportation Policy Institute. Parking Evaluation: Evaluating Parking Problems, Solutions, Costs, and Benefits; Victoria Transportation Policy Institute: Melbourne, Canada, 2011. [Google Scholar]
  4. Choi, C.Q. How Self-Driving Cars Might Transform City Parking. 2019. Available online: https://spectrum.ieee.org/autonomous-parking (accessed on 6 December 2021).
  5. Schoettle, B.; Sivak, M. Potential Impact of Self-Driving Vehicles on Household Vehicle Demand and Usage; Transportation Research Institute: Ann Arbor, MI, USA, 2015. [Google Scholar]
  6. Parkin, J.; Clark, B.; Clayton, W.; Ricci, M.; Parkhurst, G. Autonomous vehicle interactions in the urban street environment: A research agenda. Proc. Inst. Civ. Eng.-Munic. Eng. 2018, 171, 15–25. [Google Scholar] [CrossRef]
  7. Xia, B.; Wu, J.; Wang, J.; Fang, Y.; Shen, H.; Shen, J. Sustainable renewal methods of urban public parking spaces under the scenario of shared autonomous vehicles (SAV): A review and a proposal. Sustainability 2021, 13, 3629. [Google Scholar] [CrossRef]
  8. Siddique, P.J.; Gue, K.R.; Usher, J.S. Puzzle-based parking. Transp. Res. Part C-Emerg. Technol. 2021, 127, 103112. [Google Scholar] [CrossRef]
  9. Simons, R.A. When would driverless vehicles make downtown parking unsustainable, and where would the driverless car fleet rest during the day? JOSRE 2018, 10, 3–32. [Google Scholar] [CrossRef]
  10. Shoup, D.C. The High Cost of Free Parking. American Planning Association Planners Press: Chicago, IL, USA, 2005. [Google Scholar]
  11. Wang, J.; Zhang, X. A view on U.S. parking policies. Urban Transp. China 2011, 9, 53–60. [Google Scholar]
  12. ITE. Parking Generation, 4th ed.; Institute of Transportation Engineers: Washington, DC, USA, 2010. [Google Scholar]
  13. Asia Development Bank. Parking Policy in Asia Cities. 2011. Available online: https://www.adb.org/sites/default/files/publication/28935/parking-policy-asia.pdf (accessed on 6 December 2021).
  14. Mumford, L. The City in History: Its Origins, Its Transformations, and Its Prospects; Mariner Books: New York, NY, USA, 1968. [Google Scholar]
  15. Morawska, L.; Miller, W.; Riley, M.; Vardoulakis, S.; Zhu, Y.-G.; Marks, G.B.; Garnawat, P.; Kumar, P.; Thynell, M. Towards Urbanome the genome of the city to enhance the form and function of future cities. Nat. Commun. 2019, 10, 4014. [Google Scholar] [CrossRef] [PubMed]
  16. Holtslag-Broekhof, S. Urban land readjustment: Necessary for effective urban renewal? Analysing the dutch quest for new legislation. Land Use Policy 2018, 77, 821–828. [Google Scholar] [CrossRef]
  17. Mekdjian, S. Urban artivism and migrations. Disrupting spatial and political segregation of migrants in European cities. Cities 2018, 77, 39–48. [Google Scholar] [CrossRef] [Green Version]
  18. The State Council of The People’s Republic of China. Report of the Central City Work Conference; The State Council of The People’s Republic of China: Beijing, China, 2015.
  19. Sui, H.; Yang, X.; Xu, S.; Zhou, D. Progress and hot research on urban functional space renewal in the new era. Trop. Geogr. 2020, 40, 1150–1160. [Google Scholar]
  20. Schumacher, E.F. Small Is Beatiful: Economics as If People Mattered; Harper & Row: New York, NY, USA, 1973. [Google Scholar]
  21. Lerner, J. Urban Acupuncture; Island Press: New York, NY, USA, 2016. [Google Scholar]
  22. Casanova, H.; Hernandez, J. Public Space Acupuncture; Actar: New York, NY, USA, 2015. [Google Scholar]
  23. Houghton, K.; Foth, M.; Miller, E. Urban acupuncture: Hybrid social and technological practices for hyperlocal placemaking. J. Urban Technol. 2015, 22, 3–19. [Google Scholar] [CrossRef]
  24. Ryan, C. Eco-Acupuncture: Designing and facilitating pathways for urban transformation, for a resilient low-carbon future. J. Clean. Prod. 2013, 50, 189–199. [Google Scholar] [CrossRef]
  25. Ziegenfuss, K. Constructing Use in Surface Parking Lots: Strategies for Enhancing Lots as Part-Time Public Spaces. Ph.D. Thesis, Massachusetts Institute of Technology, Cambridge, MA, USA, 2009. [Google Scholar]
  26. Simons, R.A.; Kline, J. 11 urban adaptive reuse potential from the architect’s perspective. In Driverless Cars, Urban Parking and Land Use; Routledge: New York, NY, USA, 2020. [Google Scholar]
  27. Adamo, J. Data Ming for Association Rules and Sequential Patterns: Sequential and Parallel Algorithms; Springer: New York, NY, USA, 2012. [Google Scholar]
  28. Gkoulalas-Divanis, A.; Verykios, V.S. Assoication Rule Hiding for Data Ming; Springer: New York, NY, USA, 2010. [Google Scholar]
  29. Agrawal, R.; Imielinski, T.; Swami, A. Mining association rules between sets of items in large databases. In Proceedings of the 1993 ACM SIGMOD International Conference on Management of Data, Washington, DC, USA, 25–28 May 1993; pp. 207–216. [Google Scholar]
  30. Shekhar, S.; Huang, Y. Discovering spatial co-location patterns: A summary of results. In International Symposium on Spatial and Temporal Databases; Springer: Berlin/Heidelberg, Germany, 2001; pp. 236–256. [Google Scholar]
  31. Cai, J.N.; Liu, Q.L.; Deng, M.; Tang, J.B.; He, Z.J. Adaptive detection of statistically significant regional spatial co-location patterns. Comput. Environ. Urban Syst. 2018, 68, 53–63. [Google Scholar] [CrossRef]
  32. Chen, Y. Forecasting Approach for Urban Function Nodes Based on Markov Chain and Neural Network: Taking Nanjing for an Instance. Master’s Thesis, Southeast University, Nanjing, China, 2019. [Google Scholar]
  33. Yu, W.; Ai, T.; Zhou, Q. Regional co-location pattern mining and scoping from urban facility POI. Geogr. Geo-Inf. Sci. 2015, 31, 6–11. [Google Scholar]
  34. Chen, Y.; Chen, X.; Liu, Z.; Li, X. Understanding the spatial organization of urban functions based on co-location patterns mining: A comparative analysis for 25 Chinese cities. Cities 2020, 97, 102563. [Google Scholar] [CrossRef]
  35. Jiang, J.; Dai, F.; Zhang, J. Comparative study of urban functional structure based on POI data: A case study of Beijing and Shanghai. Mod. Urban Res. 2020, 7, 42–50. [Google Scholar]
  36. 2021 Hangzhou Statistical Yearbook. Available online: http://tjj.hangzhou.gov.cn/art/2021/11/15/art_1229453592_3968147.html (accessed on 6 December 2021).
  37. The State Council of The People’s Republic of China. New Generation Artificial Intelligence Development Plan; The State Council of The People’s Republic of China: Beijing, China, 2017.
  38. Ma, Z. Hangzhou at Forefront of Digital Economy. Available online: http://www.chinadaily.com.cn/a/201909/17/WS5d8075a4a310cf3e3556bed1.html (accessed on 6 December 2021).
  39. Duan, Y.; Liu, Y.; Liu, X.; Wang, H. Identification of polycentric urban structure of central Chongqing using points of interest big data. J. Nat. Resour. 2018, 33, 788–800. [Google Scholar]
  40. Xue, B.; Xiao, X.; Li, J.; Xie, X. Analysis of spatial economic structure of Northeast China cities based on points of interest big data. Sci. Geogr. Sin. 2020, 40, 691–700. [Google Scholar]
  41. Shen, Y.; Chai, Y. Daily activity space of suburban mega-community residents in Beijing based on GPS data. Acta Geogr. Sin. 2013, 68, 506–516. [Google Scholar]
  42. She, Y.; Chai, Y. Study on commuting flexibility of residents based on GPS data: A case study of suburban mega-communities in Beijing. Acta Geogr. Sin. 2012, 67, 733–744. [Google Scholar]
  43. Liao, W.; Nie, X. Spatial association analysis for urban service based on big data. Sci. Geogr. Sin. 2017, 37, 1310–1317. [Google Scholar]
  44. Shen, Q. Research on Sequence Pattern Mining and Rule Matching Prediction Based on Improved Apriori Algorithm. Master’s Thesis, Beijing University of Posts and Telecommunications, Beijing, China, 2016. [Google Scholar]
  45. Liu, P.; Li, Z.; Zhao, Y. Network fault diagnosis expert system based on extended production rules. J. Xi’an Jiaotong Univ. 2004, 38, 783–786. [Google Scholar]
  46. Liu, L.; Yu, S.; Wei, X.; Ning, Z. An improved Apriori-based algorithm for friends recommendation in microblog. Int. J. Commun. Syst. 2018, 31, e3453. [Google Scholar] [CrossRef]
  47. Park, S.H.; Synn, J.; Kwon, O.H.; Sung, Y. Apriori-based text mining method for the advancement of the transportation management plan in expressway work zones. J. Supercomput. 2017, 74, 1283–1298. [Google Scholar] [CrossRef]
  48. Gao, Y.; Gao, J.; Chen, J.; Xu, Y.; Zhao, J. Regionalizing aquatic ecosystems based on the river subbasin taxonomy concept and spatial clustering techniques. Int. J. Environ. Res. Public Health 2011, 8, 4367–4385. [Google Scholar] [CrossRef] [PubMed]
  49. Breiman, L. Random forests. Mach. Learn. 2001, 45, 5–32. [Google Scholar] [CrossRef] [Green Version]
  50. Sun, S. Modern Urban Planning Theories. China Architecture Publishing & Media Co., Ltd.: Beijing, China, 2007. [Google Scholar]
  51. Rezaei, M. Reviewing Design Process Theories: Discourses in Architecture, Urban Design and Planning Theories; Springer: New York, NY, USA, 2020. [Google Scholar]
  52. Tahvilzadeh, N.; Montin, S.; Cullberg, M. Functions of sustainability: Exploring what urban sustainability policy discourse “does” in the Gothenburg Metropolitan Area. Local Environ. 2017, 22, 66–85. [Google Scholar] [CrossRef] [Green Version]
  53. Liu, Y.; Zhu, A.; Wang, J.; Li, W.; Hu, G.; Hu, Y. Land-use decision support in brownfield redevelopment for urban renewal based on crowd sourced data and a presence-and-background learning (PBL) method. Land Use Policy 2019, 88, 104188. [Google Scholar] [CrossRef]
  54. Frantal, B.; Greer-Wootten, B.; Klusáček, P.; Krejčí, T.; Kunc, J.; Martinát, S. Exploring spatial patterns of urban brownfields regeneration: The case of Brno, Czech Republic. Cities 2015, 44, 9–18. [Google Scholar] [CrossRef]
  55. Zambon, I.; Serra, P.; Salvati, L. The (Evolving) urban footprint under sequential building cycles and changing socio-demographic contexts. Environ. Impact Assess. Rev. 2019, 75, 27–36. [Google Scholar] [CrossRef]
  56. Nesticò, A.; Sica, F. The sustainability of urban renewal projects: A model for economic multi-criteria analysis. J. Prop. Invest. Finance 2017, 35, 397–409. [Google Scholar] [CrossRef]
  57. Fistola, R.; Gargiulo, C.; Battarra, R.; La Rocca, R.A. Sustainability of urban functions: Dealing with tourism activity. Sustainability 2019, 11, 1071. [Google Scholar] [CrossRef] [Green Version]
  58. Bottero, M.; Bragaglia, F.; Caruso, N.; Datola, G.; Dell’Anna, F. Experimenting community impact evaluation (CIE) for assessing urban regeneration programmes: The case study of the area 22@ Barcelona. Cities 2020, 99, 102464. [Google Scholar] [CrossRef]
  59. Zheng, W.; Shen, G.Q.; Wang, H.; Hong, J.; Li, Z. Decision support for sustainable urban renewal: A multi-scale model. Land Use Policy 2017, 69, 361–371. [Google Scholar] [CrossRef] [Green Version]
  60. Bai, X.; Tong, M. Micro urban regeneration: From the networks to nodes and vice versa. Archit. J. 2020, 2020, 8–14. [Google Scholar]
  61. Xia, B.; Fang, Y.; Shen, H.; Shen, J.; Pan, S. Sustainable renewal of underground parking space in the scenario of shared autonomous vehicles. Buildings 2020, 12, 4. [Google Scholar] [CrossRef]
  62. Qiao, Y.-K.; Peng, F.-L.; Sabri, S.; Rajabifard, A. Low carbon effects of urban underground space. Sustain. Cities Soc. 2019, 45, 451–459. [Google Scholar] [CrossRef]
Figure 1. Forecast of smart vehicle development (adapted from [9]).
Land 11 00156 g001
Figure 2. Parking space allocation index in Asian cities (adapted from [13]).
Land 11 00156 g002
Figure 3. The research area.
Land 11 00156 g003
Figure 4. The research process.
Land 11 00156 g004
Figure 5. The co-location relationships of parking spaces and POIs.
Land 11 00156 g005
Figure 6. Characteristics of the parking lots in Hangzhou.
Land 11 00156 g006
Figure 7. The kernel density of parking lots’ charges.
Land 11 00156 g007
Figure 8. The kernel density of parking lots’ sizes.
Land 11 00156 g008
Figure 9. The affiliations of parking lots in and outside the round-city highway.
Land 11 00156 g009
Figure 10. The numbers of the clusters.
Land 11 00156 g010
Figure 11. Function associate rules of the clusters.
Land 11 00156 g011
Figure 12. The results of function replacement of parking spaces according to the associate rules.
Land 11 00156 g012
Table 1. The input variables of Apriori.
Input VariableVariable Type and AssignmentsSample SizeNumbers
accommodation servicesvirtual variable, if it exists = 1, else = 02320839
car servicesvirtual variable, if it exists = 1, else = 02320640
catering servicesvirtual variable, if it exists = 1, else = 023201499
commercial residencevirtual variable, if it exists = 1, else = 023201413
companies and enterprisesvirtual variable, if it exists = 1, else = 023201596
daily life servicesvirtual variable, if it exists = 1, else = 023201749
financial insurance servicesvirtual variable, if it exists = 1, else = 02320635
government agencies and social organizationsvirtual variable, if it exists = 1, else = 023201017
medical care servicesvirtual variable, if it exists = 1, else = 02320927
public facilitiesvirtual variable, if it exists = 1, else = 02320642
scenic spotsvirtual variable, if it exists = 1, else = 02320303
science, education and cultural servicesvirtual variable, if it exists = 1, else = 023201287
shopping servicesvirtual variable, if it exists = 1, else = 023201722
sports and leisure servicesvirtual variable, if it exists = 1, else = 02320980
Table 2. The input variables of two-step cluster.
Input VariableVariable TypeSample SizeAverageStandard Deviation
affiliationlabel2320--
sizenumerical2320155.47229.63
chargenumerical23205.624.27
Table 3. The classes and basic characters of input variables of cosine similarity.
Input VariablesVariable Types
accommodation servicesvirtual variable, if it exists = 1, else = 0
car servicesvirtual variable, if it exists = 1, else = 0
catering servicesvirtual variable, if it exists = 1, else = 0
commercial housingvirtual variable, if it exists = 1, else = 0
companies and enterprisesvirtual variable, if it exists = 1, else = 0
daily life servicesvirtual variable, if it exists = 1, else = 0
financial insurance servicesvirtual variable, if it exists = 1, else = 0
government agencies and social organizationsvirtual variable, if it exists = 1, else = 0
medical care servicesvirtual variable, if it exists = 1, else = 0
public facilitiesvirtual variable, if it exists = 1, else = 0
scenic spotsvirtual variable, if it exists = 1, else = 0
science, education and cultural servicesvirtual variable, if it exists = 1, else = 0
shopping servicesvirtual variable, if it exists = 1, else = 0
sports and leisure servicesvirtual variable, if it exists = 1, else = 0
Table 4. The correlations between POIs and parking lots in different charge groups.
POI TypesCharging Price
Low Medium High
accommodation services0.80 0.86 0.11
car services0.26 0.76 0.61
catering services0.26 0.88 0.37
commercial residence0.96 1.00 0.01
companies and enterprises0.11 0.98 0.52
daily life services0.01 0.96 0.00
financial insurance services0.66 0.89 0.20
government agencies and social organizations0.18 1.00 0.01
medical care services0.13 0.94 0.48
public facilities0.44 0.01 0.32
scenic spots0.25 0.56 0.24
science, education and cultural services0.82 1.00 0.84
shopping services0.51 0.54 0.45
sports and leisure services0.80 0.98 0.04
The data indicates the Pearson coefficient. Data in deep gray means the correlation between parking lot and POIs is strong, while data in light gray means the correlation is general, and without gray means the correlation is weak.
Table 5. The correlations between POIs and parking lots in different size groups.
POI TypesSize
Small MediumLarge
accommodation services0.21 0.92 0.49
car services0.67 0.62 0.45
catering services0.66 0.97 0.56
commercial housing0.98 0.26 0.87
companies and enterprises0.88 0.28 0.85
daily life services0.53 0.86 0.79
financial insurance services0.00 0.56 0.71
government agencies and social organizations0.75 0.17 0.98
medical care services0.96 0.14 0.88
public facilities0.81 0.51 0.82
scenic spots1.00 0.77 0.90
science, education and cultural services0.94 0.87 0.94
shopping services0.61 0.61 0.77
sports and leisure services0.35 0.71 0.75
The data indicates the Pearson coefficient. The meanings of the colors in data are the same as Table 4.
Table 6. The correlations between POIs and parking in different affiliation groups.
POI TypesAffiliation
CMOBPIRDCRCOTA
accommodation services1.00 1.00 0.77 0.98 0.82 0.70 0.20
car services0.43 0.83 0.14 0.03 0.06 0.99 0.14
catering services0.33 0.64 0.42 0.66 0.75 0.35 0.06
commercial housing0.06 0.70 0.23 0.36 0.47 0.31 0.27
companies and enterprises0.81 0.71 0.51 1.00 0.92 0.58 0.22
daily life services0.74 0.99 0.48 0.87 0.89 0.03 0.14
financial insurance services0.68 0.78 0.35 0.72 0.48 0.94 0.16
government agencies and social organizations0.17 0.92 0.04 0.99 0.98 0.32 0.25
medical care services0.24 0.04 0.51 0.84 0.77 0.45 0.03
public facilities0.65 0.60 0.43 0.99 0.79 0.49 0.15
scenic spots0.03 0.69 0.32 0.16 0.45 0.58 0.92
science, education, and cultural services0.43 0.78 0.35 0.94 0.20 0.28 0.15
shopping services0.87 0.30 0.56 0.65 0.75 0.01 0.07
sports and leisure services0.03 0.88 0.85 0.84 0.73 0.82 0.27
The data indicates the Pearson coefficient. The meanings of the colors in data are the same as Table 4. Commercial buildings = CM, office building = OB, public institution = PI, residence = RD, mixture of commercial and residential buildings = CR, mixture of commercial and office buildings = CO, tourist attractions = TA
Table 7. Most relevant associate rules for each cluster.
AntecedentsConsequentSupport(%)Confidence(%)Cluster
SEC,CE,CS,CR,SSDLS41.9199.011
SEC,CE,CS,CR,DLSSS41.49100.001
SLS,CR,CS,SS,DLSCE29.8690.362
SLS,CE,CS,SS,DLSCR29.8690.362
SEC,CR,CS,SS,DLSCE40.1190.973
SEC,CE,CS,SS,DLSCR39.2892.913
GASO,CR,CE,SS,DLSCS32.2190.704
SEC,CR,CS,SS,DLSCE31.8491.764
SEC,CS,CE,LS,SSCR39.2693.685
SEC,CR,CS,LS,SSCE38.8494.685
SEC,CS,CE,SS,DLSCR32.1390.006
SEC,CR,CS,SS,DLSCE31.7391.146
SEC,CE,CS,CR,SSDLS41.9199.017
SEC,CE,CS,CR,DLSSS41.49100.007
SEC,CR,CS,SS,DLSCE35.5691.158
SEC,CR,CE,SS,DLSCS34.3594.358
Science, education and cultural services = SEC, companies and enterprises = CE, catering services = CS, commercial residences = CR, shopping services = SS, daily life services = DLS, sports and leisure services = SLS, government agencies and social organizations = GASO.
Table 8. Most relevant rules for the replacement function.
Most Relevant RulesReplacement Function
Affiliation = office and Size = (515,712] and Charge = (5.50,25.00]CE
Affiliation = office and Size = (1100,2183] and Charge = [0.00,7.00]CR
Affiliation = mixture of commercial and residential building and Charge = [5.50,9.00]CR
Affiliation = tourist attraction and Charge = [0.00,4.50]CR
Affiliation = public institution and Charge = (1.00,2.50]SEC
Affiliation = commercial building and Size (0,485] and Charge = (8.50,25.00]SEC
Affiliation = commercial building and Price = (8.50,25.00]SEC
Affiliation = public institutions and Size = (658,2183] and Charge = (9.00,25.00]SS
Affiliation = office and Size = (242,2183] and Charge = (7.00,9.00]SS
Affiliation = commercial building and Size = (419,2183] and Charge = (7.00,8.00]SS
Affiliation = office and Charge = (9.00,25.00]CS
Affiliation = office and Size = (379,2183] and Charge = (5.500,25.00]CS
Affiliation = office and Size = (419,2183] and Charge = (9.00,25.00]CS
Affiliation = residence and Size = (93,638] and Charge = (9.00,25.00]DLS
Science, education and cultural services = SEC, companies and enterprises = CE, catering services = CS, commercial residences = CR, shopping services = SS, daily life services = DLS.
Publisher’s Note: MDPI stays neutral with regard to jurisdictional claims in published maps and institutional affiliations.

