Article

Evaluation of Public Service Facilities in 19 Large Cities in China from the Perspective of Supply and Demand

1
Department of Urban Planning, School of Urban Design, Wuhan University, Wuhan 430072, China
2
China Institute of Development Strategy and Planning, Wuhan University, Wuhan 430072, China
*
Author to whom correspondence should be addressed.
Land 2022, 11(2), 149; https://doi.org/10.3390/land11020149
Submission received: 3 December 2021 / Revised: 13 January 2022 / Accepted: 14 January 2022 / Published: 18 January 2022
(This article belongs to the Topic Architectures, Materials and Urban Design)

Abstract

:
The equalization of urban public service facilities is important to the daily lives of urban residents. Spatial quantification of the supply and demand of public service facilities can reveal relationships between supply and demand agents and provide a foundation for the planning of urban public service facilities. This study proposed a comprehensive framework to assess the current state of supply (accessibility of facilities) and demand (population carrying pressure) of various public services in cities and determine patterns between different public service facilities. This framework contains three elements: (a) multi-scale spatial quantification of the matching of supply and demand, (b) spatial matching of supply and demand, and (c) spatial clustering analysis of the supply and demand balance. This study analyzed 19 major cities in China from a supply and demand perspective and examined implications for matching the supply and demand of public service facilities. The results indicated that education service facilities had the most appropriate supply and demand relationship. Areas where public service facilities had a good matching of supply and demand demonstrated a strong pattern of clustering. There were significant differences in the level of matching of the supply and demand of public service facilities among various regions in China. The limitations of the framework and future directions are discussed.

1. Introduction

Public service facilities are resources directly or indirectly provided by the government for the public and shared by all [1], including public green space, pension, medical treatment, education facilities, etc. Such facilities are related to the shaping of the urban environment and spatial structure and the normal operations of an urban system [2]. The layout of facilities should be based on the demand of services to make equal use of public service facilities [3]. Rapid population growth resulting from urbanization has intensified the demand for public service facilities [4]. However, the construction of public service facilities in new areas often lags behind population growth, which can lead to a movement of people to areas with a higher concentration of public service facilities [5]. This may cause demand pressure to be transmitted to surrounding service areas, further leading to a widening area of supply and demand mismatch [6]. For example, poorer communities with low access to public services are concentrated in the outer suburban area [7], while high-quality public service resources are often concentrated in the urban center [8,9]. Residents living in the suburban area may flow to the city center to use these facilities. In the process of crossing the service area, the increase of travel distance may cause traffic congestion and a waste of infrastructure resources [10]. Therefore, in order to provide residents with public service facilities of a reasonable layout, and resource sharing [11,12], it is necessary to evaluate the supply-demand matching of urban public service facilities [13].
Previous studies have discussed various types of public service facilities, such as basic education facilities [14], healthcare services [15], elderly services [16], parks and urban green spaces [17], cultural and sports facilities [7], and recreational facilities [18]. Studies tend to focus on the sitting and layout optimization of public services facilities. Recently, a number of studies have explored the spatial matching between service provision and the needs of user groups in order to achieve equalization of public services [19,20]. On the one hand, many studies have discussed the spatial layout of various public service facilities by using assessment methods such as accessibility assessment [21,22], population density assessment [4], and spatio-temporal visualization analysis assessment [23]. For example, some studies have explored the spatial matching relationship between urban green spaces and the population by using coupled coordination models [24]. Some others measured the relationship between socio-spatial stratification of residential communities and the accessibility of public service facilities by using Global Moran’s I [6]. On the other hand, many studies focused on the demand preferences of different groups [25], such as children [26], women [27], and the elderly [28,29]. Demographic factors, such as socioeconomic status [30] and race [31], are also included to explore the matching of supply and demand of public service facilities. For example, some studies examined the matching of supply and demand of different types of urban parks and considered the actual travel mode of the elderly [32]. In addition, some studies also put forward the matching index of supply and demand to explore the coupling relationship between the index and urban development factors. For example, some studies use the supply and demand index of public service facilities to evaluate the spatial balance in service quality of public service facilities [33] or fit the correlation between the matching index and house price [34].
On the one hand, since it is difficult to unify the standards of comparison between different types of public service facilities, studies paying attention to the characteristics that affect the matching of the supply and demand of various types of facilities are still lacking. On the other hand, previous studies collected data relating to the demand of public service facilities by questionnaire surveys [35]. Questionnaires usually provide a detailed overview of the demand of different populations, but this method is time-consuming and laborious, and survey data lacks spatial clarity and comprehensiveness. This study uses the same spatial data to unify the evaluation criteria of various types of public service facilities, so that different types of public service facilities can be directly comparable. The demand for public service facilities is calculated using real-time population distribution data, which effectively reduces the time and labor cost (Figure 1).
This study aimed to assess and compare public service facilities in 19 major cities, including 15 sub-provincial cities and four municipalities in China, from the perspective of supply and demand. The following research questions were posed:
  • What are the differences in the matching of supply and demand and spatial patterns of various facilities?
  • What are the patterns in the matching of the supply and demand of public service facilities between cities?

2. Materials and Methods
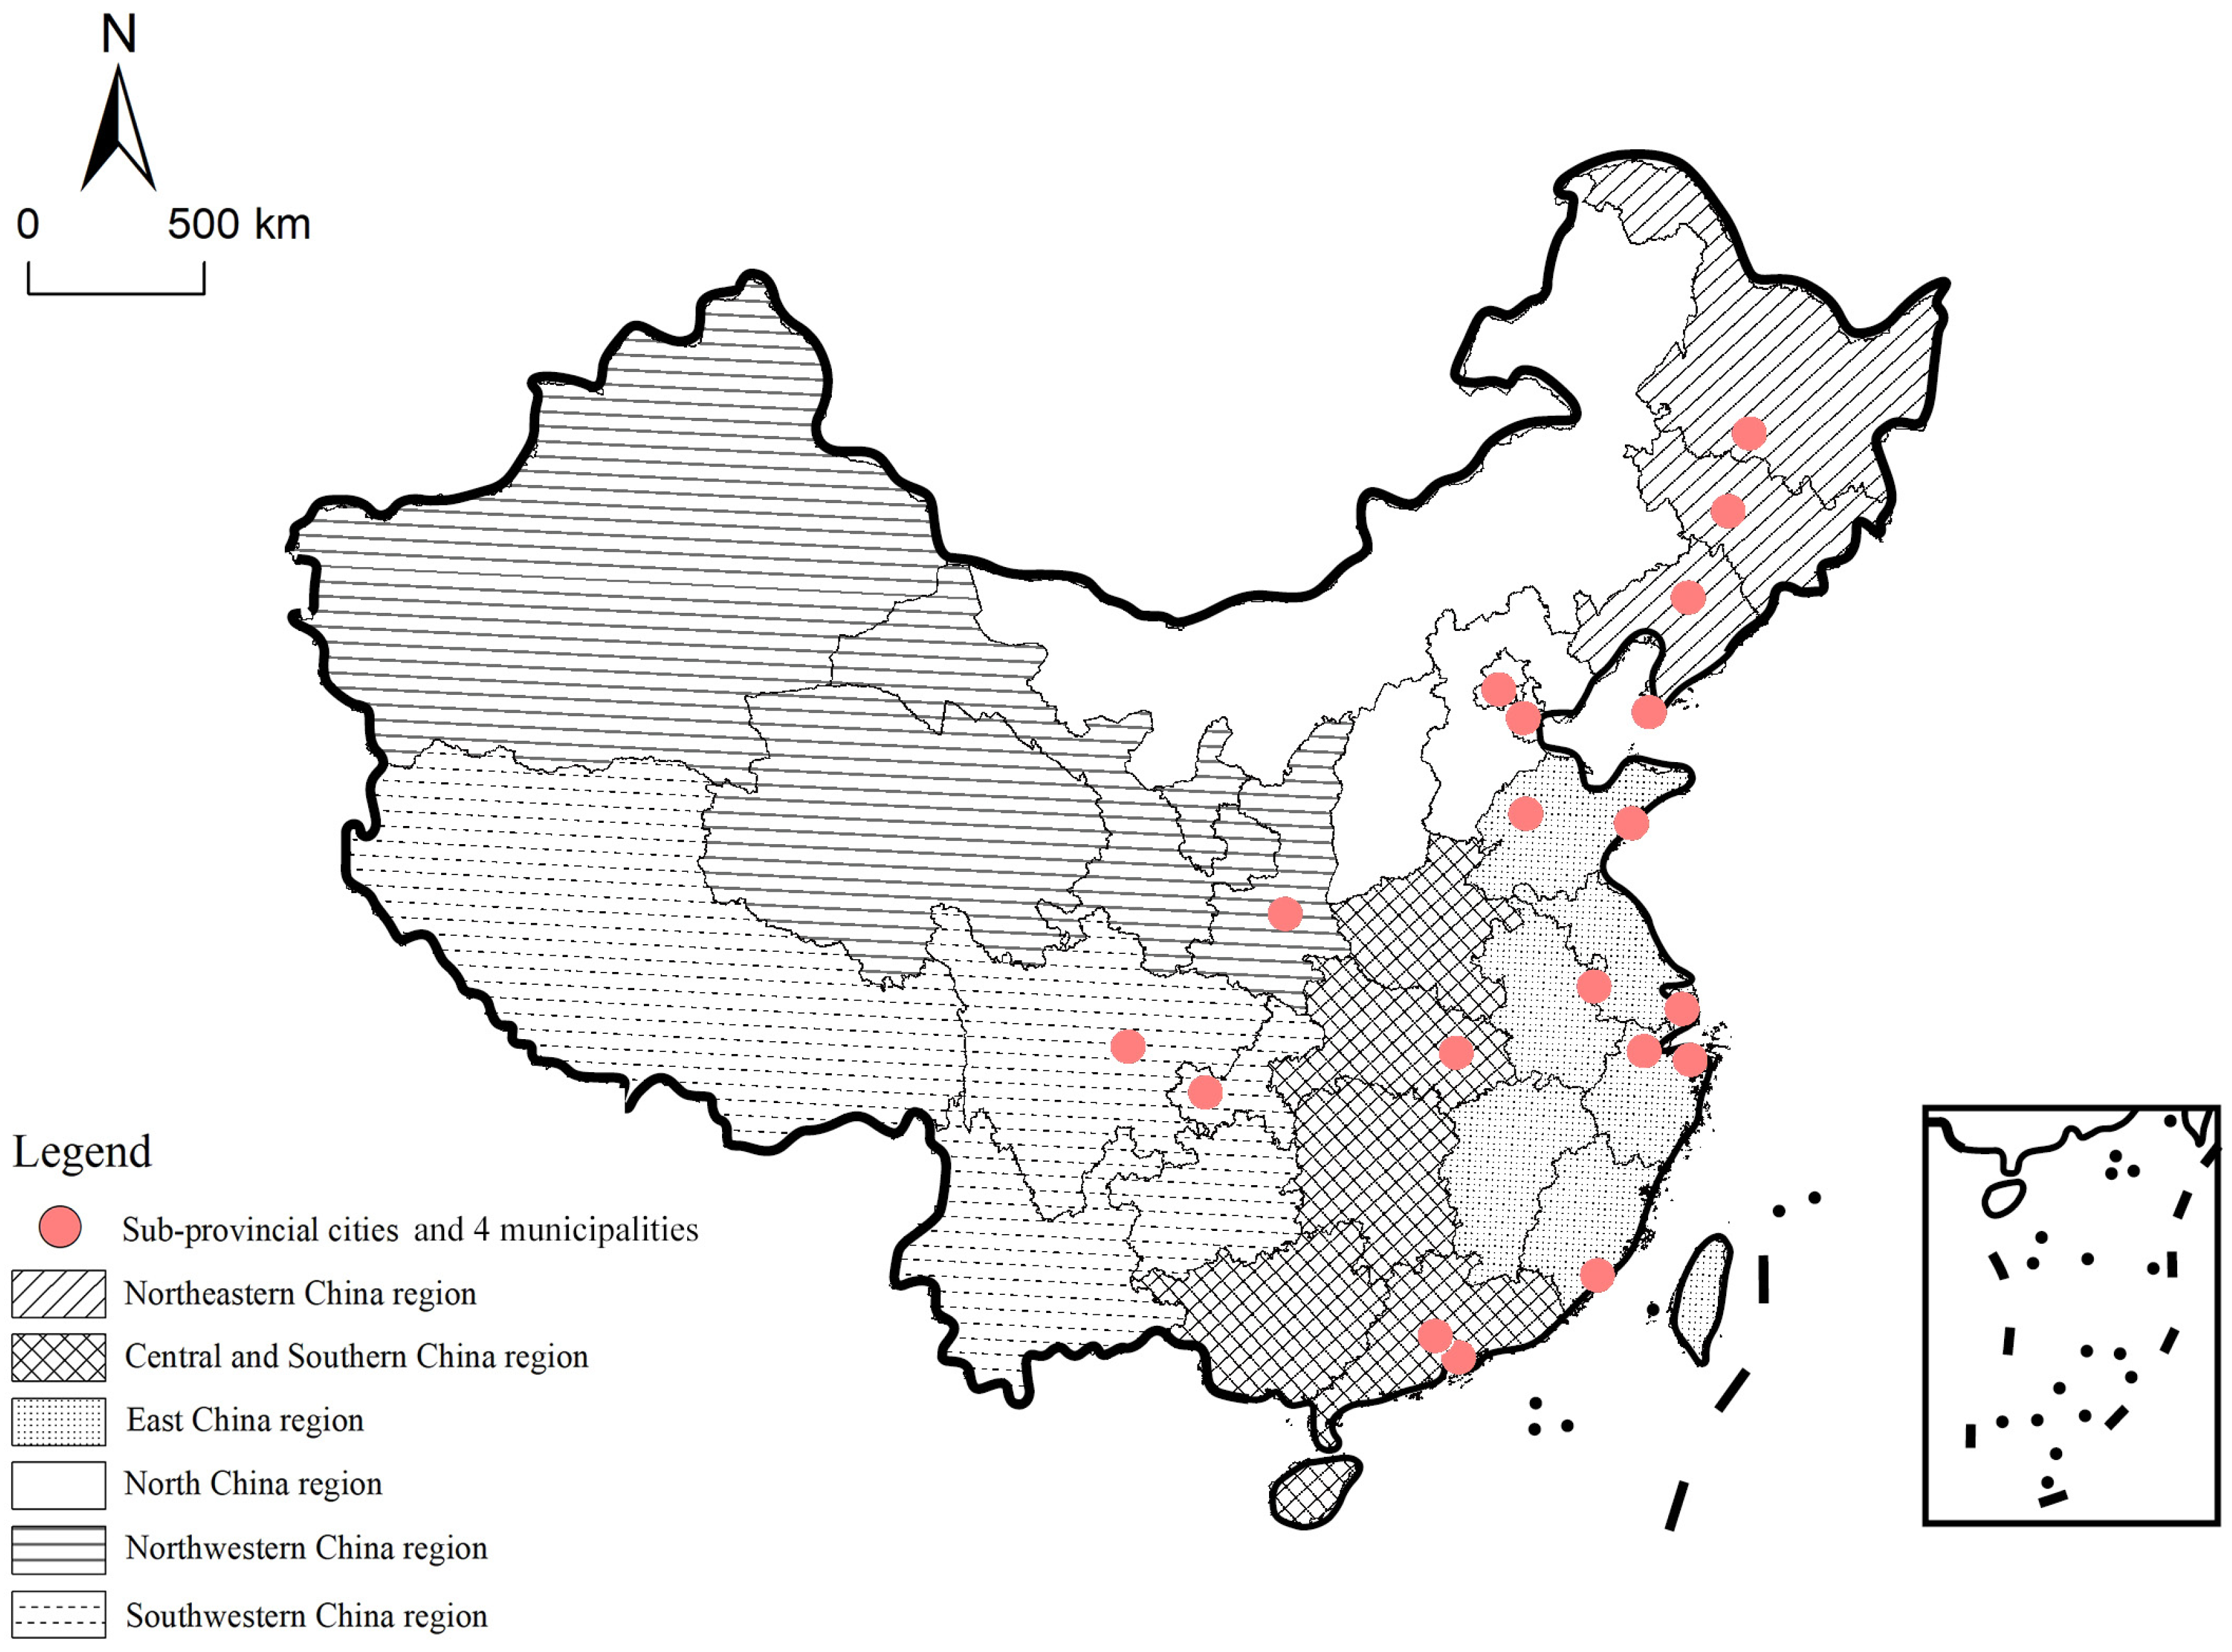
2.1. Study Areas

This study takes place in the main urban areas of 15 sub-provincial cities and 4 municipalities directly under the central government as the research object. In this paper, 19 large cities in China were selected for evaluation for two reasons: (a) as shown in Figure 2, these 19 major cities are widely distributed in six geographical regions of China, covering most parts of the country. Shenyang, Dalian, Harbin, and Changchun are located in Northeast China; Beijing and Tianjin are located in North China; Shanghai, Nanjing, Jinan, Qingdao, Hangzhou, Ningbo, and Xiamen are located in East China; Wuhan, Shenzhen, and Guangzhou are located in Central South China; Chengdu and Chongqing are located in Southwest China; and Xi’an in Northwest China. (b) Nineteen major cities play an important role in regional economics, politics, culture, and transportation. The overall level of urbanization is high [36]. They have a certain position in regional, provincial, and municipal clusters, and their comprehensive strength is in a leading position. Nineteen big cities have strong representativeness and influence. Therefore, they can provide a good reference.

2.2. Data

First, the year 2020 point of interest (POI) data of 19 cities were collected from Baidu Map Open Platform (http://lbsyun.baidu.com/index.php?title=webapi/guide/webservice-placeapi, accessed on 16 March 2021), including data on educational service facilities (primary schools and kindergartens), medical service facilities, cultural service facilities (libraries), social security facilities (elderly care facilities and service facilities for the disabled). Each POI data point contained detailed information, such as category, address, latitude, and longitude. Second, the Baidu heat map of 19 cities was obtained from the Baidu Map Open Platform. Baidu heat map can display the calorific value and generate a real-time spatial distribution map of the population [37], which is of great value for urban research [38]. Therefore, according to the law of population activity, this study selected Baidu heat maps at 10 pm on weekdays and obtained 19 Baidu heat maps. This study used ArcGIS10.5 tools to generate population distribution data of spatial units. Third, road network data of the 19 cities were collected from Open Street Map (www.openstreetmap.org, accessed on 12 February 2021) and used to calculate the accessibility of each facility. Finally, community boundary data for the 19 cities were collected from Baidu Map Open Platform. This dataset is the basic unit of living space in the city, and statistics on the supply and demand levels of facilities were based on the community.

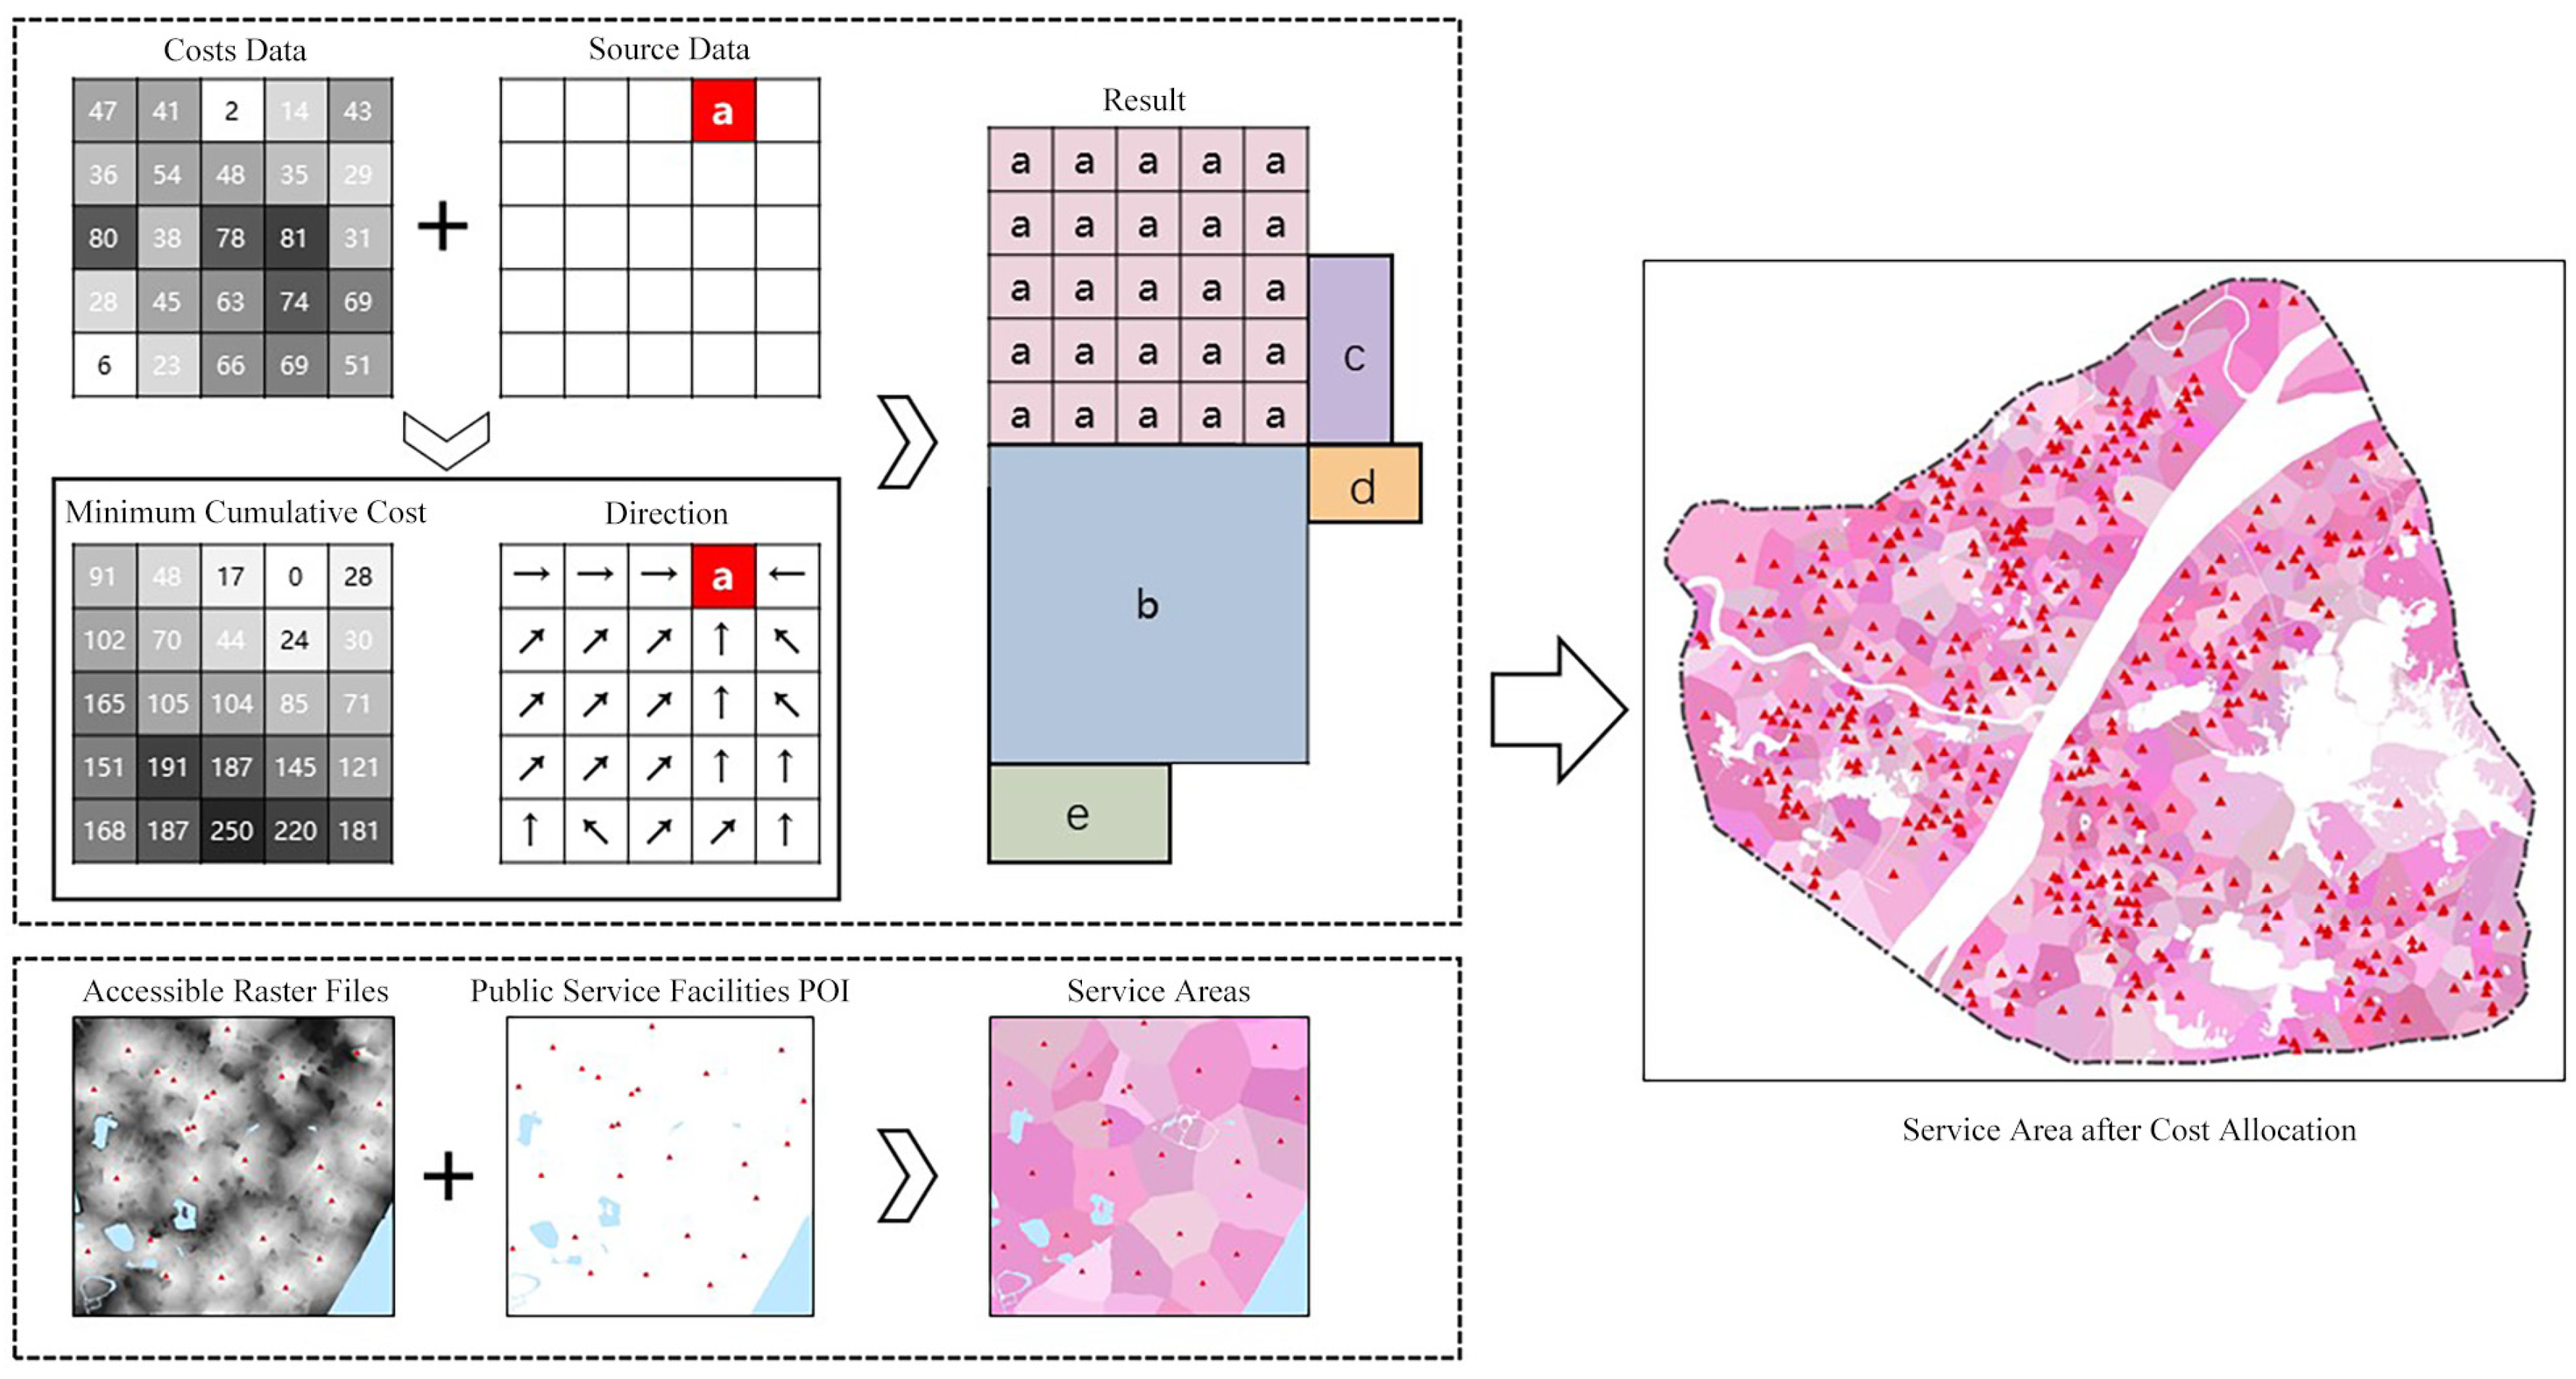
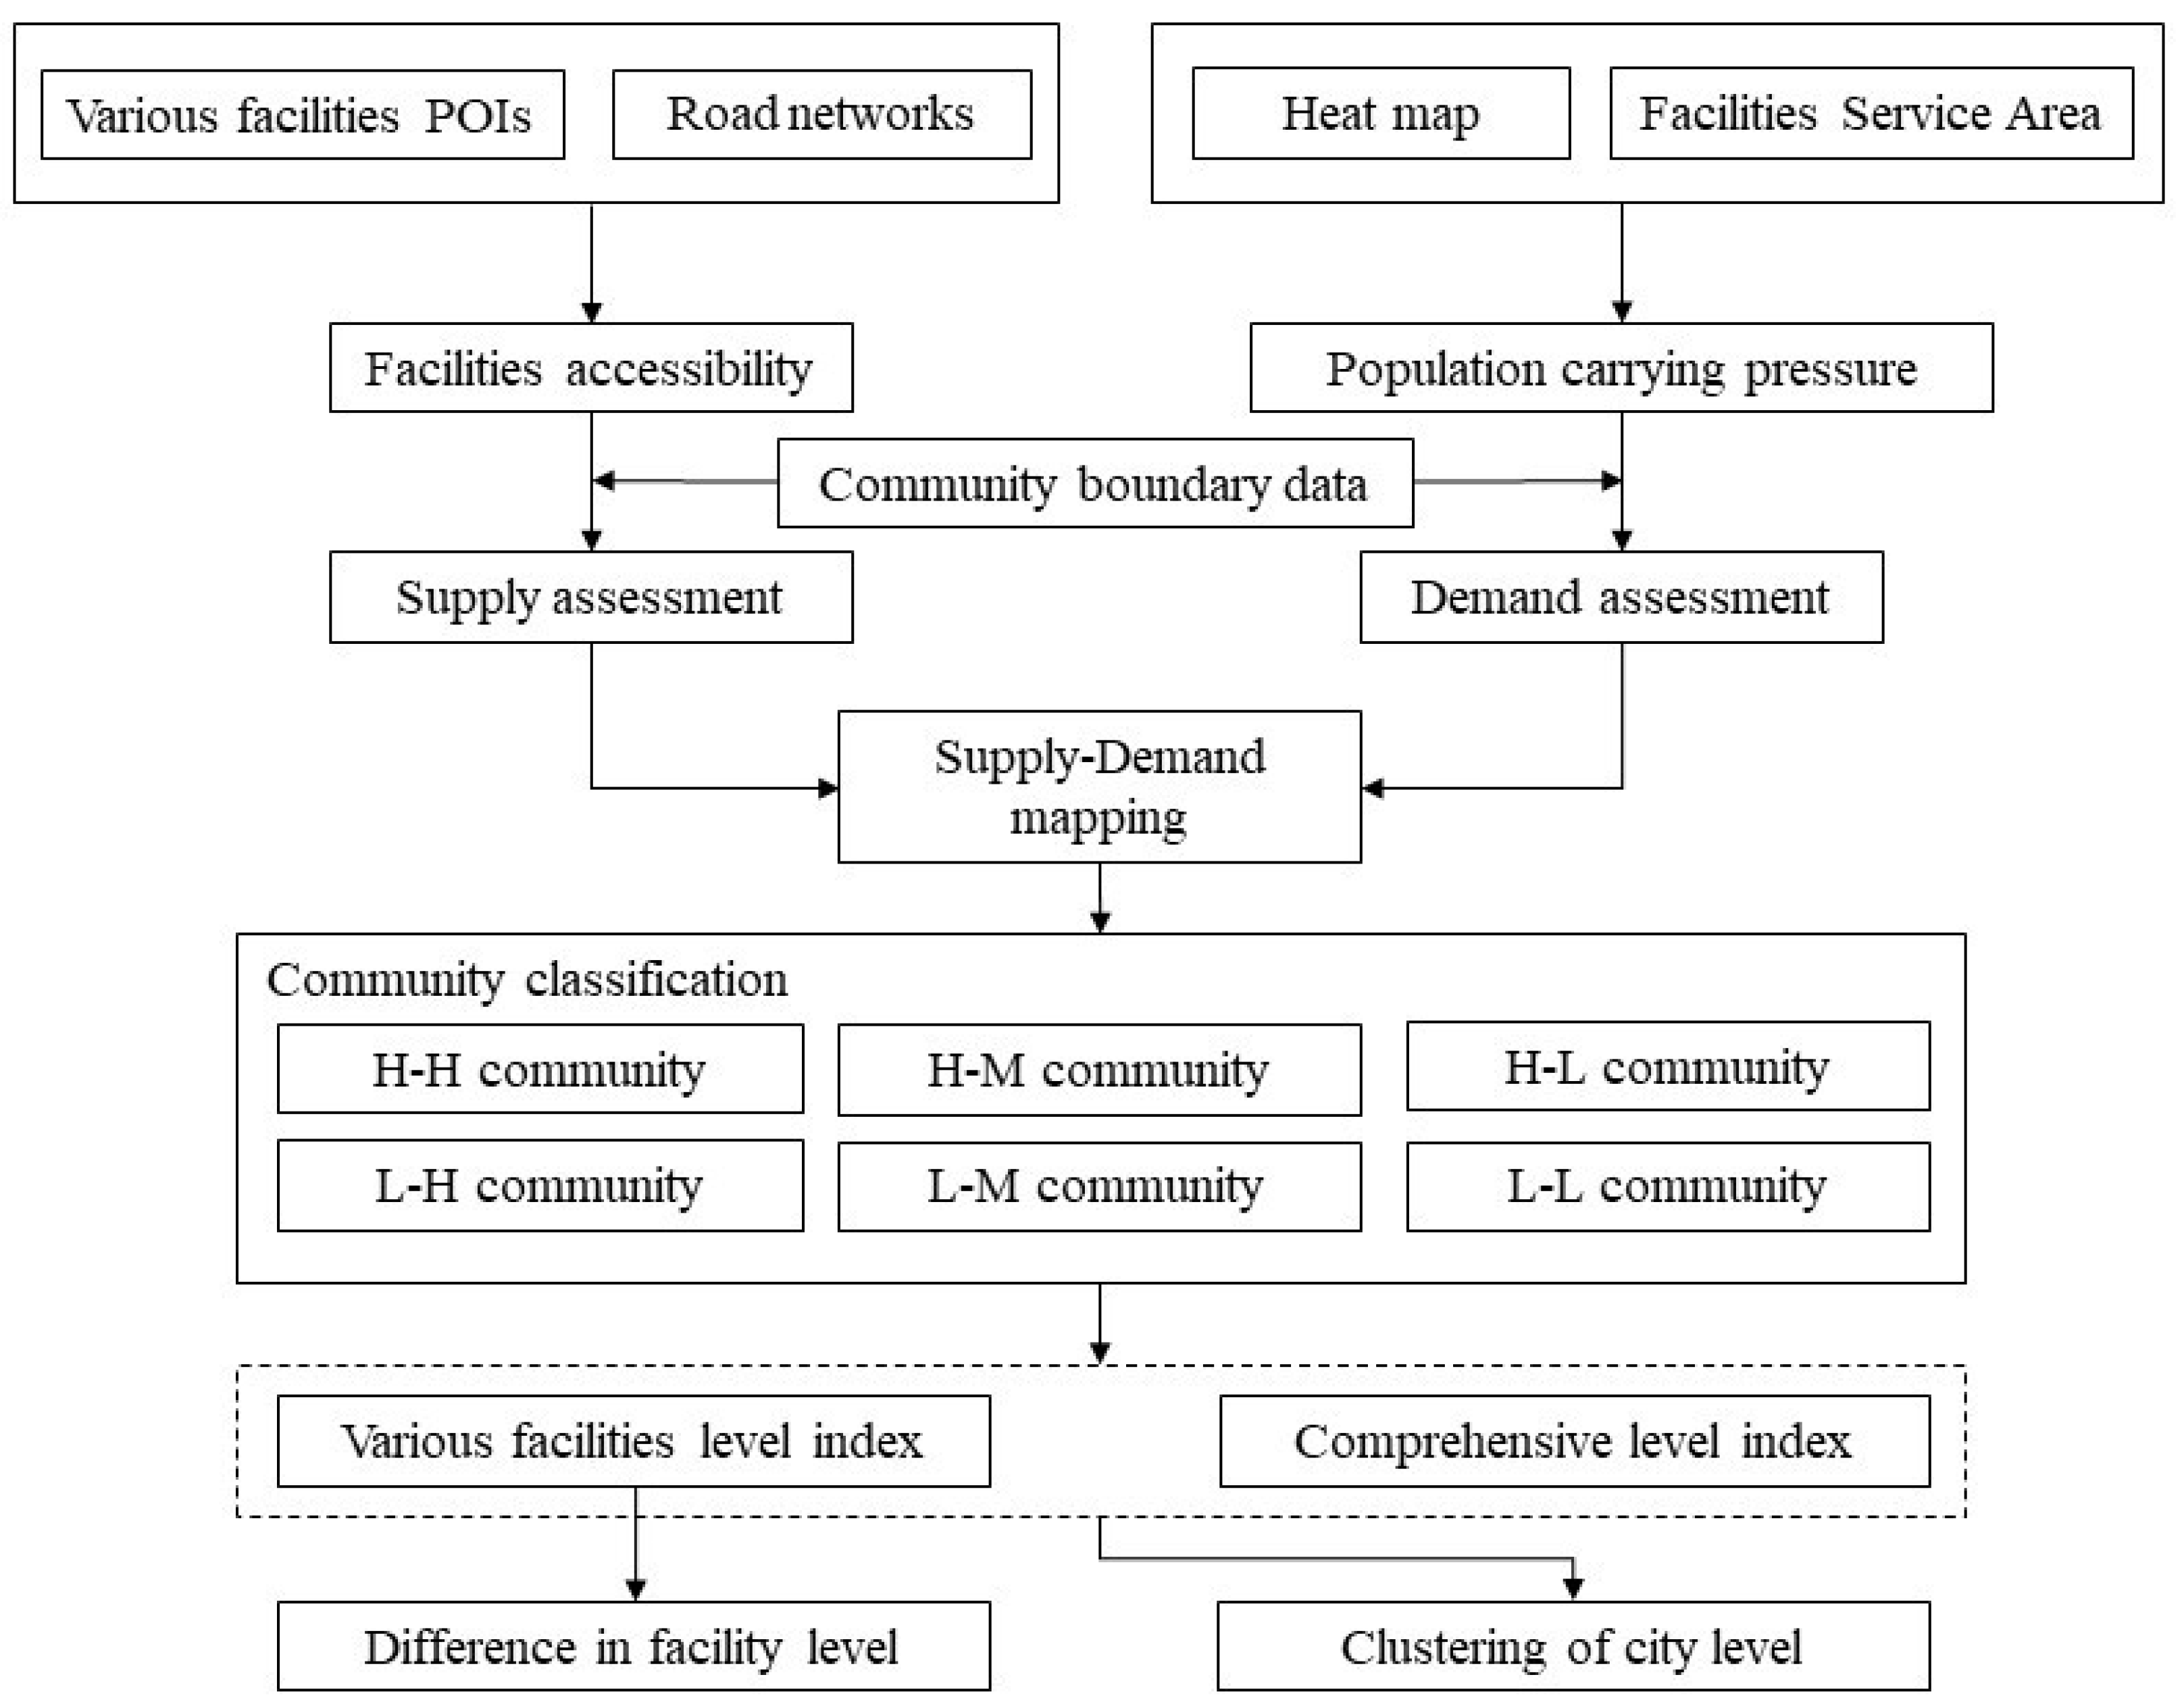
2.3. Facilities Supply Assessment

Based on the POI data of public service facilities and urban road network data, the triangulated irregular network (TIN) interpolation method was used to calculate the full-area coverage (https://qgis.org/api/classQgsTinInterpolator.html, accessed on 22 March 2021). After calculating the comprehensive and accurate spatial accessibility raster data, the original raster image values were reclassified according to the 15-min living area planning criteria to obtain a new set of values and output. The facility configuration standards used 5 min, 10 min, 15 min, and more than 15 min as the accessibility statistics standard (the corresponding walking distance was 350 m, 700 m, 1000 m, and more than 1000 m, respectively) and calculated the average reachability of the community. Finally, facility supply levels were obtained.

2.4. Facilities Demand Estimation

The mobility of the population and the individual needs of people can complicate ‘accurate’ assessments based on characteristic variables such as age, gender, or occupation. A ‘rough’ assessment approach, based on the rigid needs of the people, will standardize the assessment criteria and make the results more stable. Therefore, this study used the population carrying pressure as the basis for the assessment of facility needs. First, this study constructed cost service areas, where “cost” refers to a single or comprehensive variable that changes in the entire research area in geographic space, as shown in Figure 3. The cost of each grid unit is different. When dividing the space between multiple feature sources, each grid unit is allocated to the feature source that can be reached at the lowest cost, forming the lowest cost consumption space. In this assessment, basic public service facilities were used as element sources, and the service area of each facility was constructed based on the accessibility grid. This method essentially constructs a “Tyson Polygon” in the “non-homogeneous” real accessibility space and forms a full-area coverage, non-overlapping, and realistic facility service range. Second, this study assessed the population-carrying pressures. (a) The distribution of the urban population was inverted based on Baidu’s heat map, and the total population in the service areas of each facility was counted, which was considered as demand for the “objective capacity” of basic public service facilities. (b) The population scale of the 19 cities was unified based on facility classification, and the self-breaking point classification method was used to divide the population scale of various facilities into low, average, and high population carrying pressure. (c) The interval value of the service area was passed to the community boundary, the area proportions of various communities were counted, and the population carrying pressure of the facility service area was analyzed based on the community.

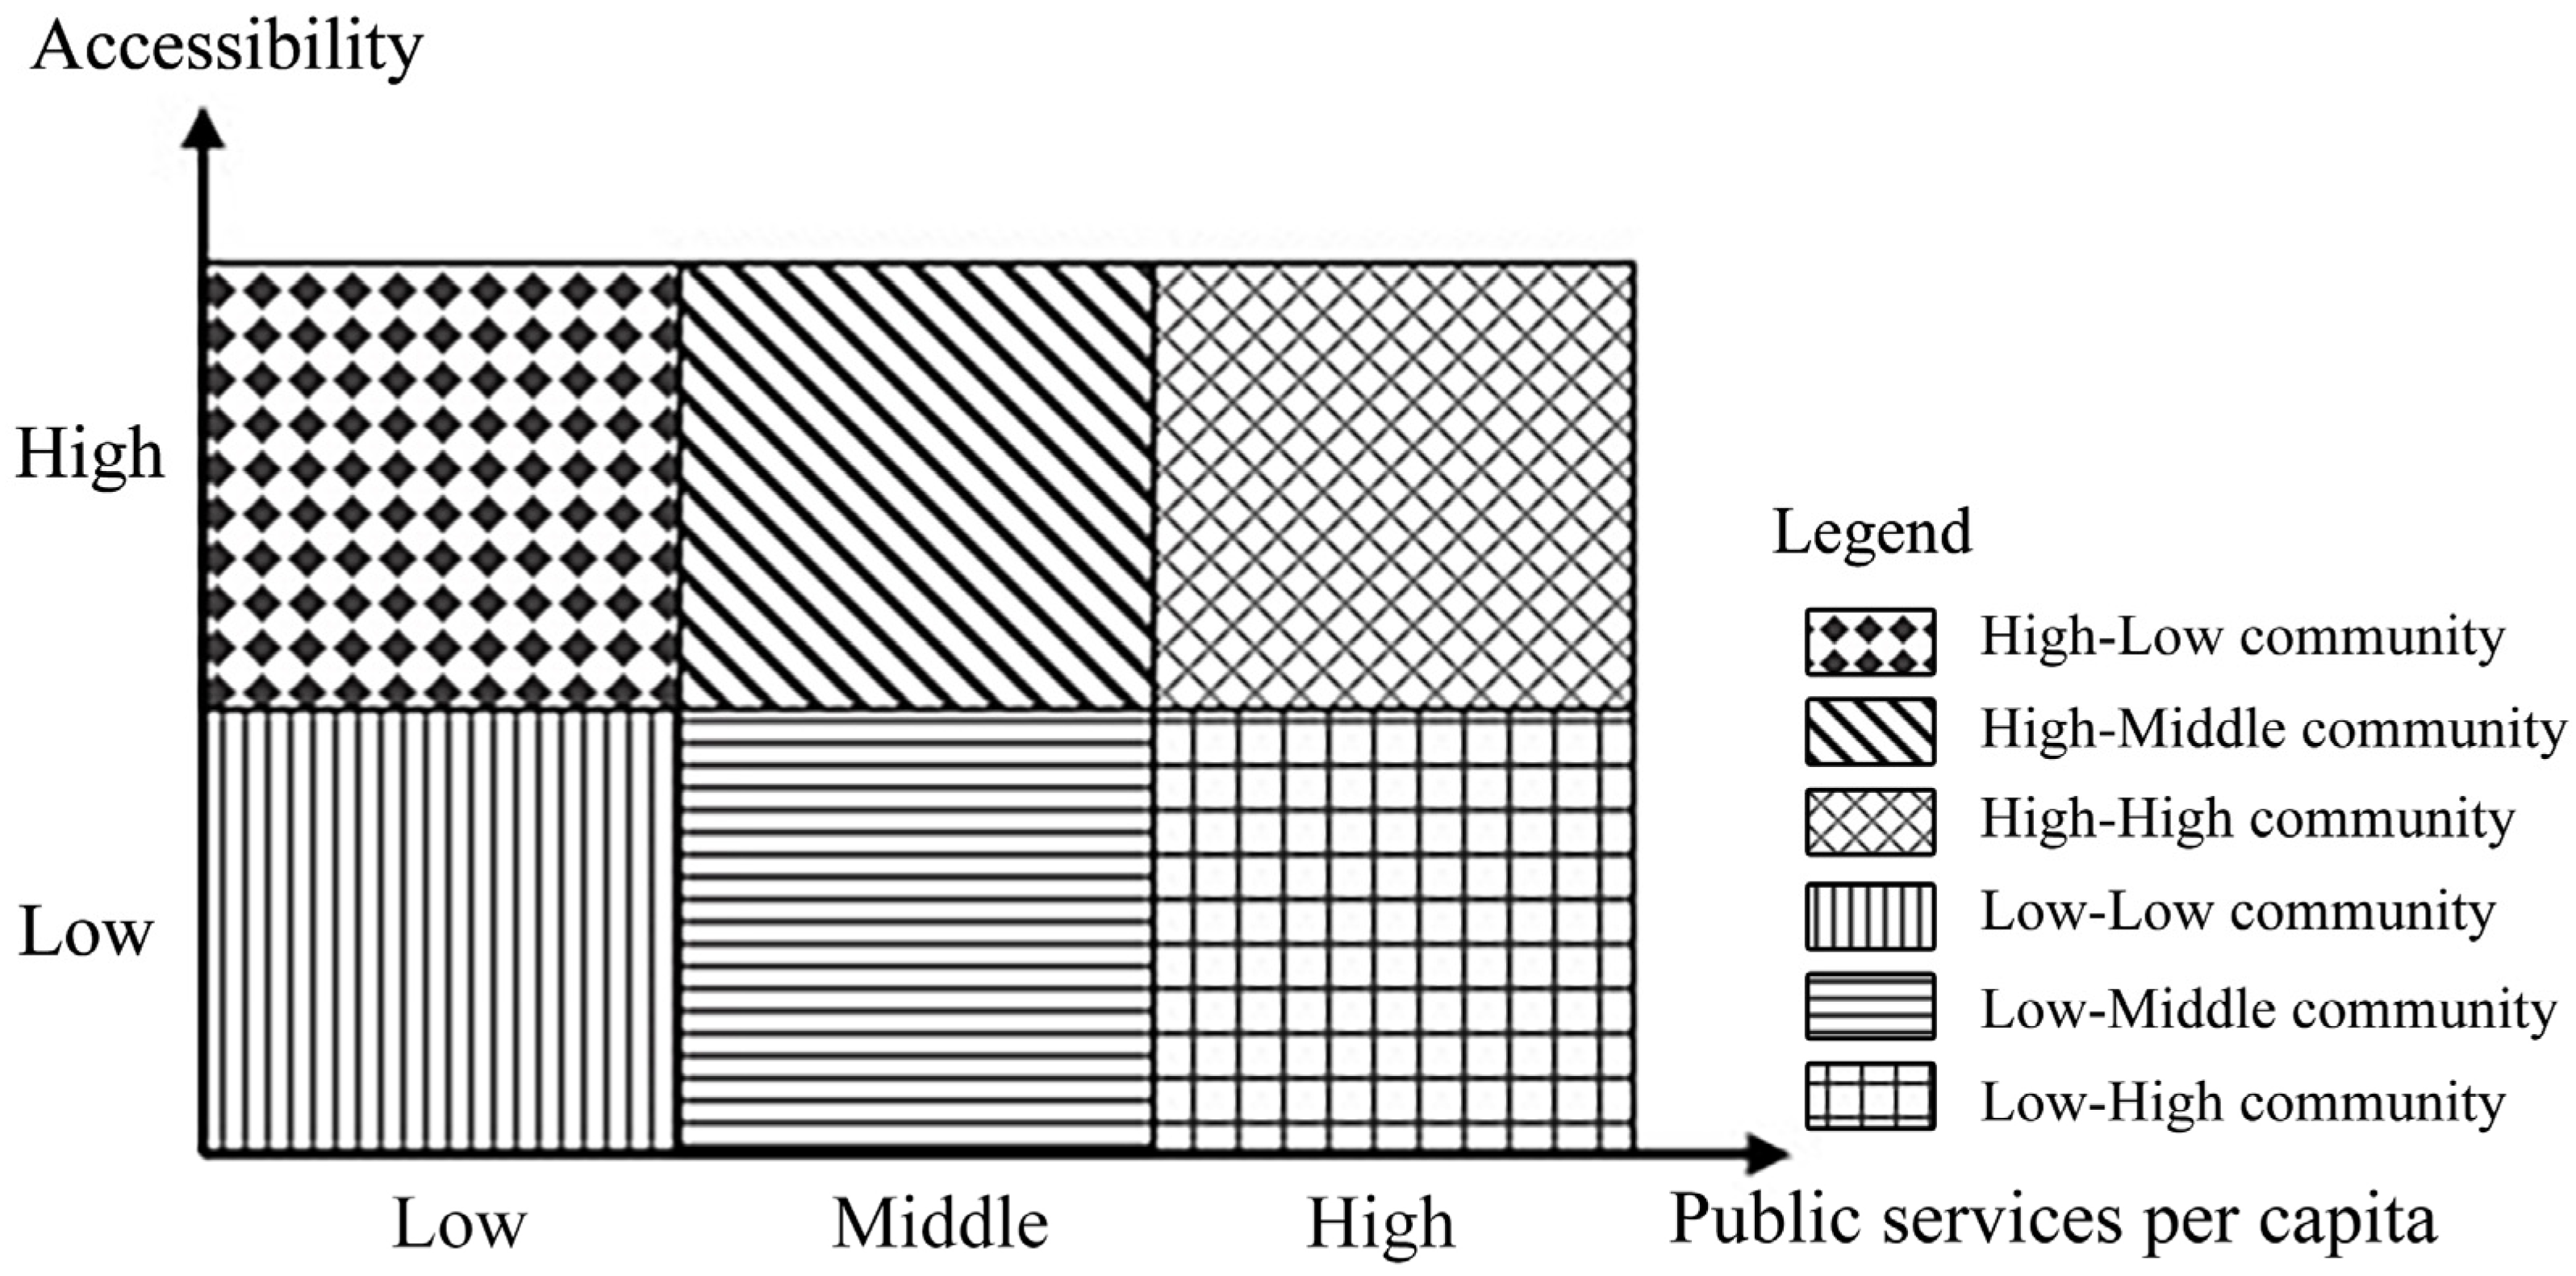
2.5. Analysis of the Supply and Demand Match

As shown in Figure 4, using the classification values of facility accessibility and population carrying pressure, six types of typical human settlements with significant heterogeneity were classified by cross-stacking. To simplify the conclusion, the 5 min, 10 min, and 15 min walking coverage areas were classified as one type. The high-high community had a high level of accessibility, low population carrying pressure, and high degree of overall supply and demand match. The high-middle community had better facility accessibility, population carrying pressure was relatively controllable, and the supply and demand match was relatively high. The high-low and low-high communities faced the problems of short supply and unbalanced layout, respectively, and the matching of supply and demand was average. The accessibility of the low-middle community was poor, the population carrying pressure was average, and the matching of supply and demand was low. The low-low community was poor, the demand of the population was large, and the overall supply and demand match was low.
Based on the matching degree of supply and demand of the six types of typical human settlements (Figure 4), the analytic hierarchy process (AHP) method was used to determine the index weight of each type of human settlement. First, a judgment matrix was constructed using the scale method of one to nine to divide the two factors. The relative importance was transformed into a magnitude, and the relative degrees of the pros and cons of various types of typical human settlements were obtained. Second, the eigenvector of the maximum eigenvalue of the judgment matrix was calculated, and the index weight of each type of human settlement was obtained based on the eigenvector method. Finally, the consistency of the judgment matrix was verified, the largest characteristic root in the judgment matrix was calculated to obtain the consistency index (CI), and the relative CI (CR) was determined. The result demonstrated that CR was <1%, indicating that the matrix had good consistency (Table 1).
The proportion of typical residential space of each type of facility was calculated. The product of the proportion of various types of residential space of the facility and the index weight were summed to obtain the supply and demand match of the facility and the comprehensive supply and demand match of the city’s basic public service facilities. The calculation formula was:
K m , j = i = 1 n W i × S i , m S j ,
K j = m = 1 o K m , j     ,
where K m , j (Equation (1)) is the supply and demand matching level of the m (Equation (1)) type of basic public service facilities in city j (Equation (1)), n (Equation (1)) is the number of typical types of human settlements, Wi (Equation (1)) is the index weight of the i (Equation (1)) type of typical human settlements, S i , m (Equation (1)) is the i (Equation (1)) type of typical human settlement area of the m (Equation (1)) type of facilities, Sj (Equation (1)) is the total area of the community in city j (Equation (1)), Kj (Equation (2)) is the comprehensive matching level of basic public service facilities in city j (Equation (2)), and o (Equation (2)) is the number of basic public service facilities [8].
Using the K-means clustering algorithm, clustering features were identified based on the supply and demand match of various basic public service facilities and the comprehensive supply and demand match of the city, forming a city classification system to match the supply and demand of basic public service facilities with different levels and features. A horizontal comparison of the comprehensive match between cities and a vertical comparison of the match of various facilities were conducted. Based on the results, the K-means clustering algorithm was used to gradually increase the K value from 2 to √N for the clustering calculation [39] (N is the total number of data points). After weighing the calculation and the classification effects, the final result was an optimal value of 4, and the matching of supply and demand of various facilities in the city was divided into four gradients.

3. Results

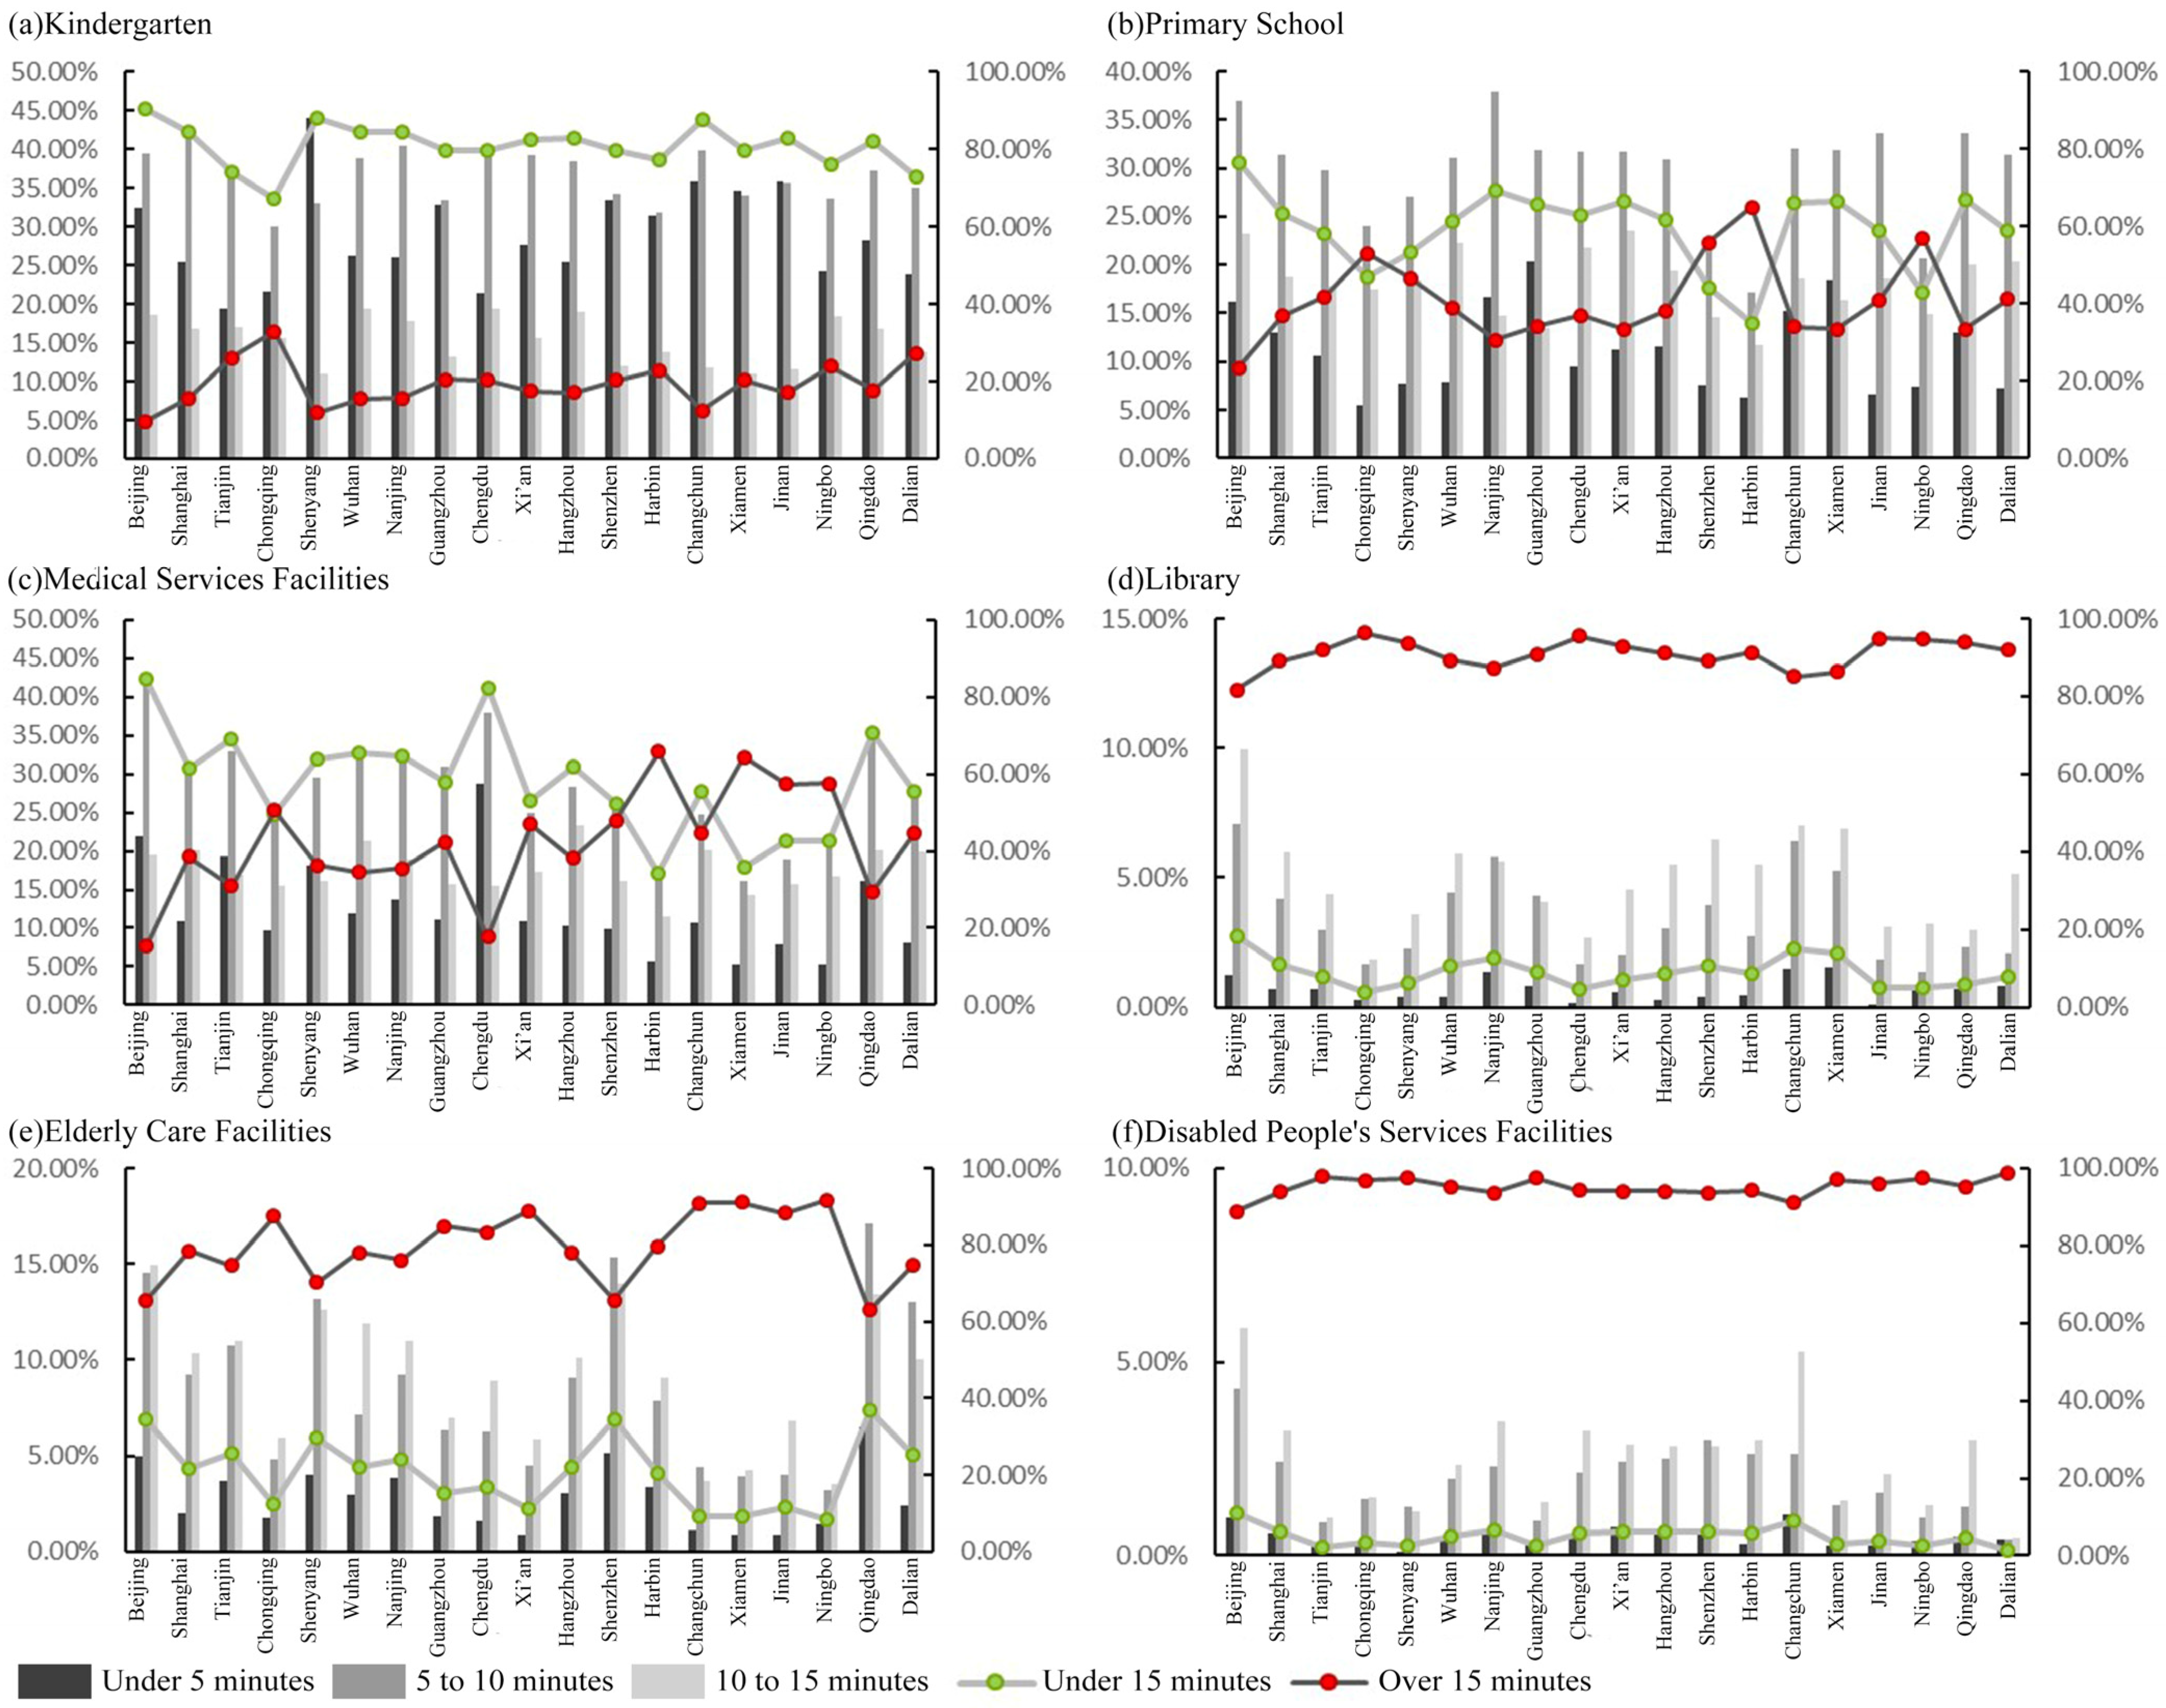
3.1. The Characteristics of the Facility Accessibility

Figure 5 shows the results of the spatial accessibility ratio analysis for the six types of facilities in 19 large cities. Education service facilities had a high proportion of intervals within 15 min, and the overall accessibility of facilities was good. The accessibility level of medical services was generally high, with an adequate and balanced distribution of resources, where only a few cities, such as Changchun, had relatively low accessibility ratios within 15 min. Accessibility ratios for libraries and social security facilities were polarized, with ratios within 15 min being much lower than those above 15 min. The spatial balance of facilities and services was unsatisfactory, accessibility was relatively poor, and equity of access to services for urban residents was low.

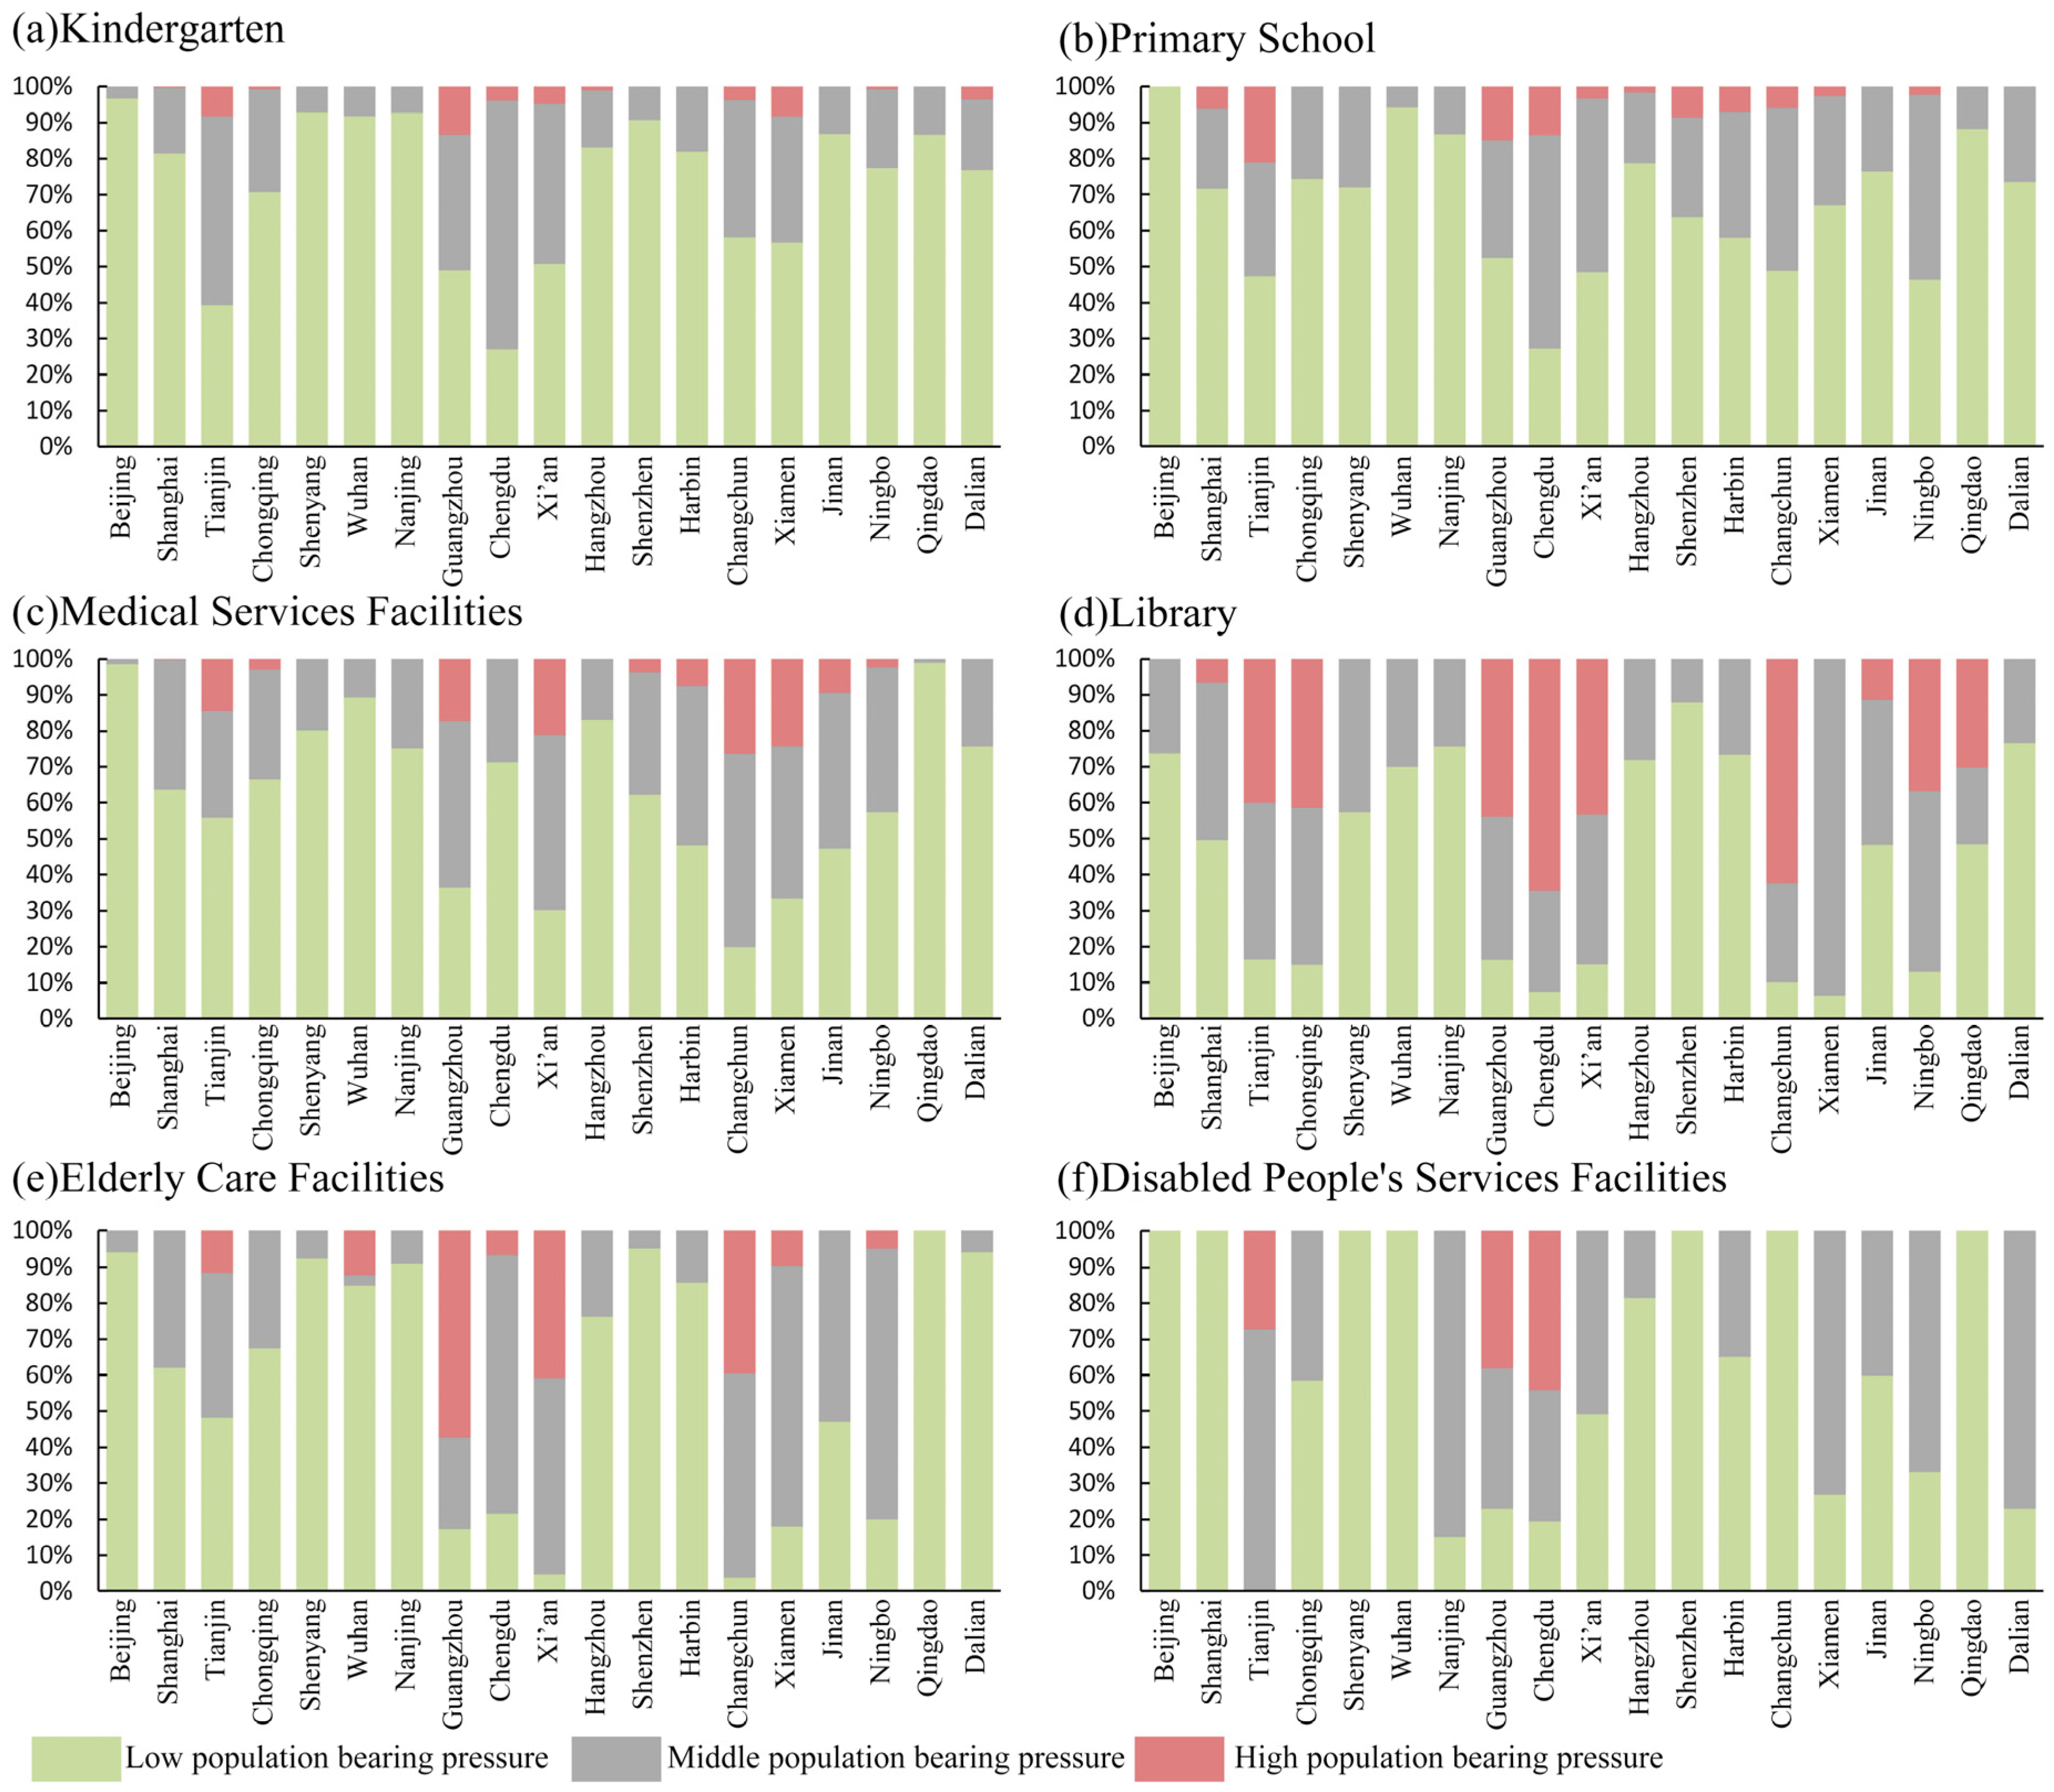
3.2. The Characteristics of the Population Carrying Pressure on Facilities

Figure 6 shows the results of the analysis of the spatial proportion of population carrying pressure for six types of facilities in the 19 large cities. There was low population carrying pressure on elementary schools and kindergartens, and overall pressure was low. Medical service facilities demonstrated variable results. The low-pressure areas in Beijing and Qingdao covered almost all areas; however, most cities had low pressure and normal pressure areas. Libraries had low and normal population carrying pressure areas. Only a few cities, such as Chengdu and Xiamen, had a large proportion of high-pressure areas, requiring the balance of the distribution of facilities and services to be improved. The population carrying situation of elderly service facilities and service facilities for the disabled was relatively good. Although there were some cities, such as Guangzhou, where the population size of the service area was over-pressured, the low-pressure area covered a large number of cities.

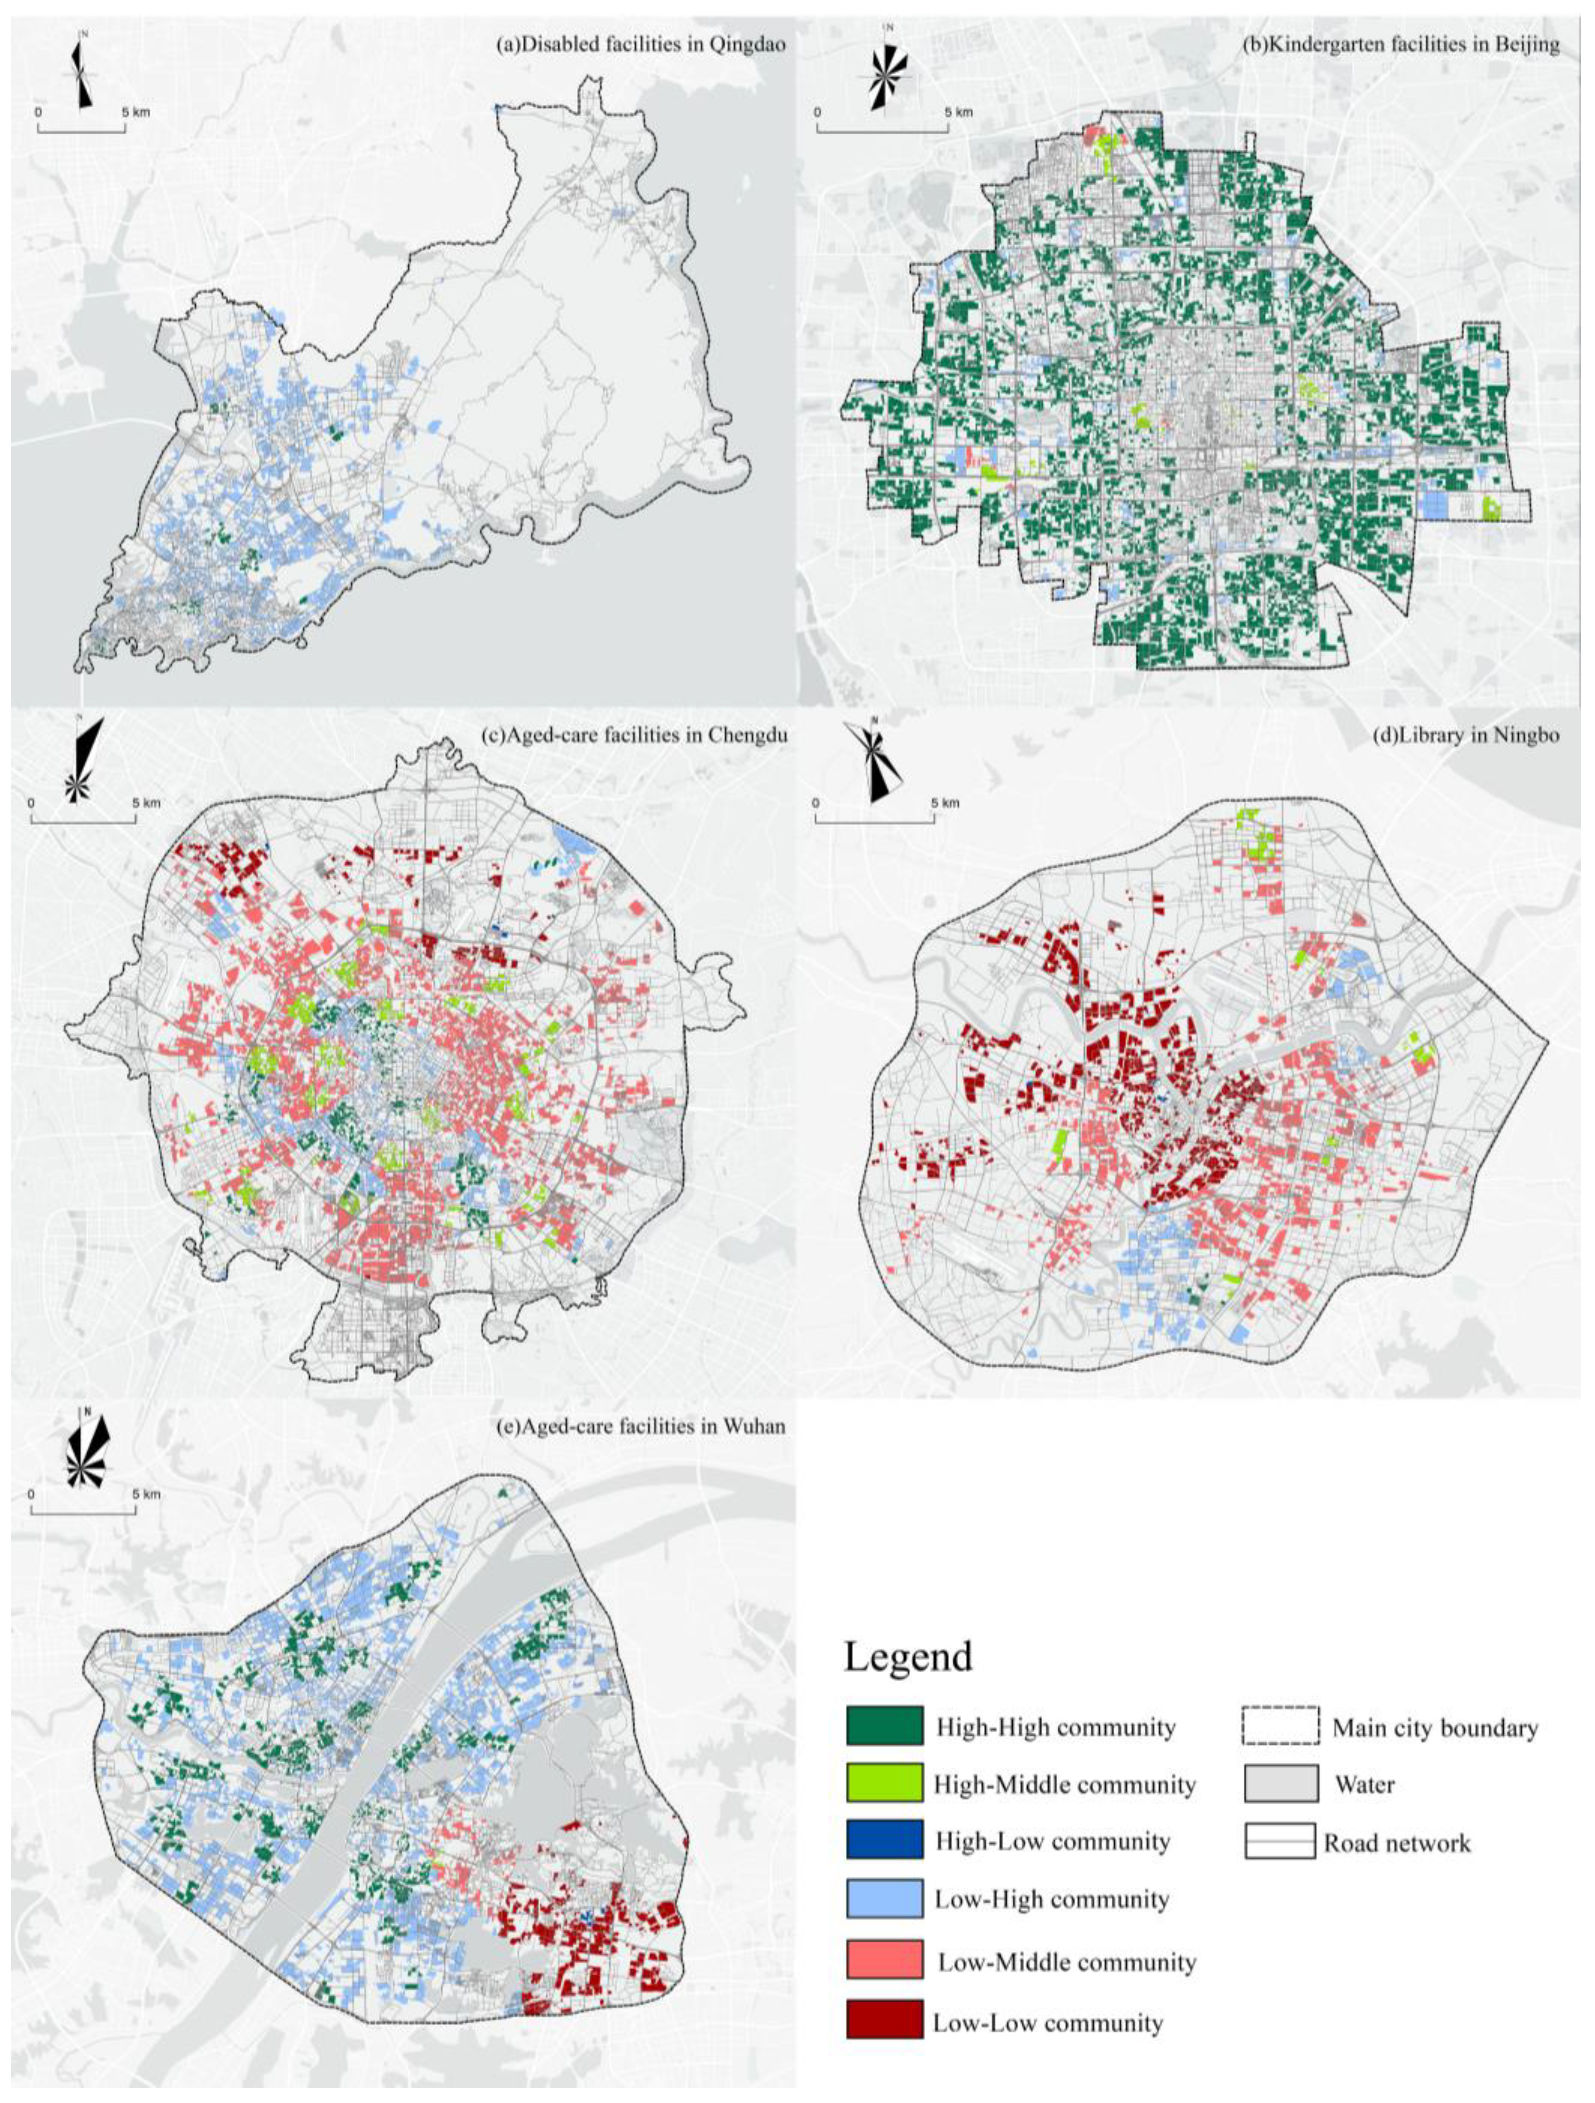
3.3. Spatial Distribution Characteristics of Typical Residential and Facilities Level

3.3.1. Analysis of the Match between Facility Supply and Demand

As shown in Table 2, there were significant gaps in the level of supply and demand match for facilities in the 19 cities. There were relatively few cities with balanced development. Most cities suffered from a shortage of facilities. Among them, the supply and demand match of kindergarten and medical services facilities was high, while that of libraries and disabled service facilities was low.

3.3.2. Analysis of Characteristics of Typical Human Settlement Space

In space, there are obvious differences in the distribution of typical human settlements, which can be summarized as five modes, as shown in Figure 7. The stable tiling mode had typical human settlements of the same type as the main space occupancy, which were tiled from the center of the city to the periphery of the city. Other typical human settlements were distributed in clusters, and the overall supply and demand match was relatively stable. The gentle decline mode included typical human settlements with good matches between supply and demand, which were concentrated in the city center, represented a large proportion, and had balanced space coverage. From the center to the periphery of the city, the overall matching of supply and demand demonstrated a relatively gentle downward trend. The undulating decline mode contained urban centers concentrated in construction model areas, with many types of typical human settlements interspersed around the center. The match between the supply and demand of the facilities changed in an undulating pattern, but the overall trend was declining. The central collapse mode included urban centers mainly composed of low-level typical human settlements. There were many types of typical human settlements from the city center to the periphery of the city. The matching of supply and demand was increasing, with a decrease after reaching the peak. The single-arm collapse mode had city centers concentrated in high-level construction model areas. From the center to the outside, the matching of supply and demand declined in an undulating pattern, and there was a cliff-like decline in the periphery of the city, with a large area of low matching levels of supply and demand.
By analyzing the spatial distribution characteristics of typical human settlements of various facilities, the spatial patterns of the match between facility supply and demand were summarized, and the classification results are shown in Table 3. Kindergartens, representing educational service facilities, mainly demonstrated a gentle decline pattern, primary schools largely had an undulating decline mode, the overall supply and demand match of the facilities was high, and the trend of change was relatively stable. From the center to the periphery of the city, the starting level of medical service facilities was high, and the spatial distribution was dominated by an undulating decline mode. The overall supply and demand match of cultural service facilities represented by libraries was relatively low. The construction model areas in most cities did not form a certain spatial scale and were mainly in an undulating decline mode. The spatial distribution of elderly care facilities, representing social security facilities, was mainly in an undulating decline mode. Some cities had limited space for facilities, and the spatial distribution was in a single-arm collapse pattern. The service facilities for the handicapped emerged in a stable and flat pattern, from the city center to the city periphery, with non-high-quality typical human settlements as the main body, and the overall matching of supply and demand was low.

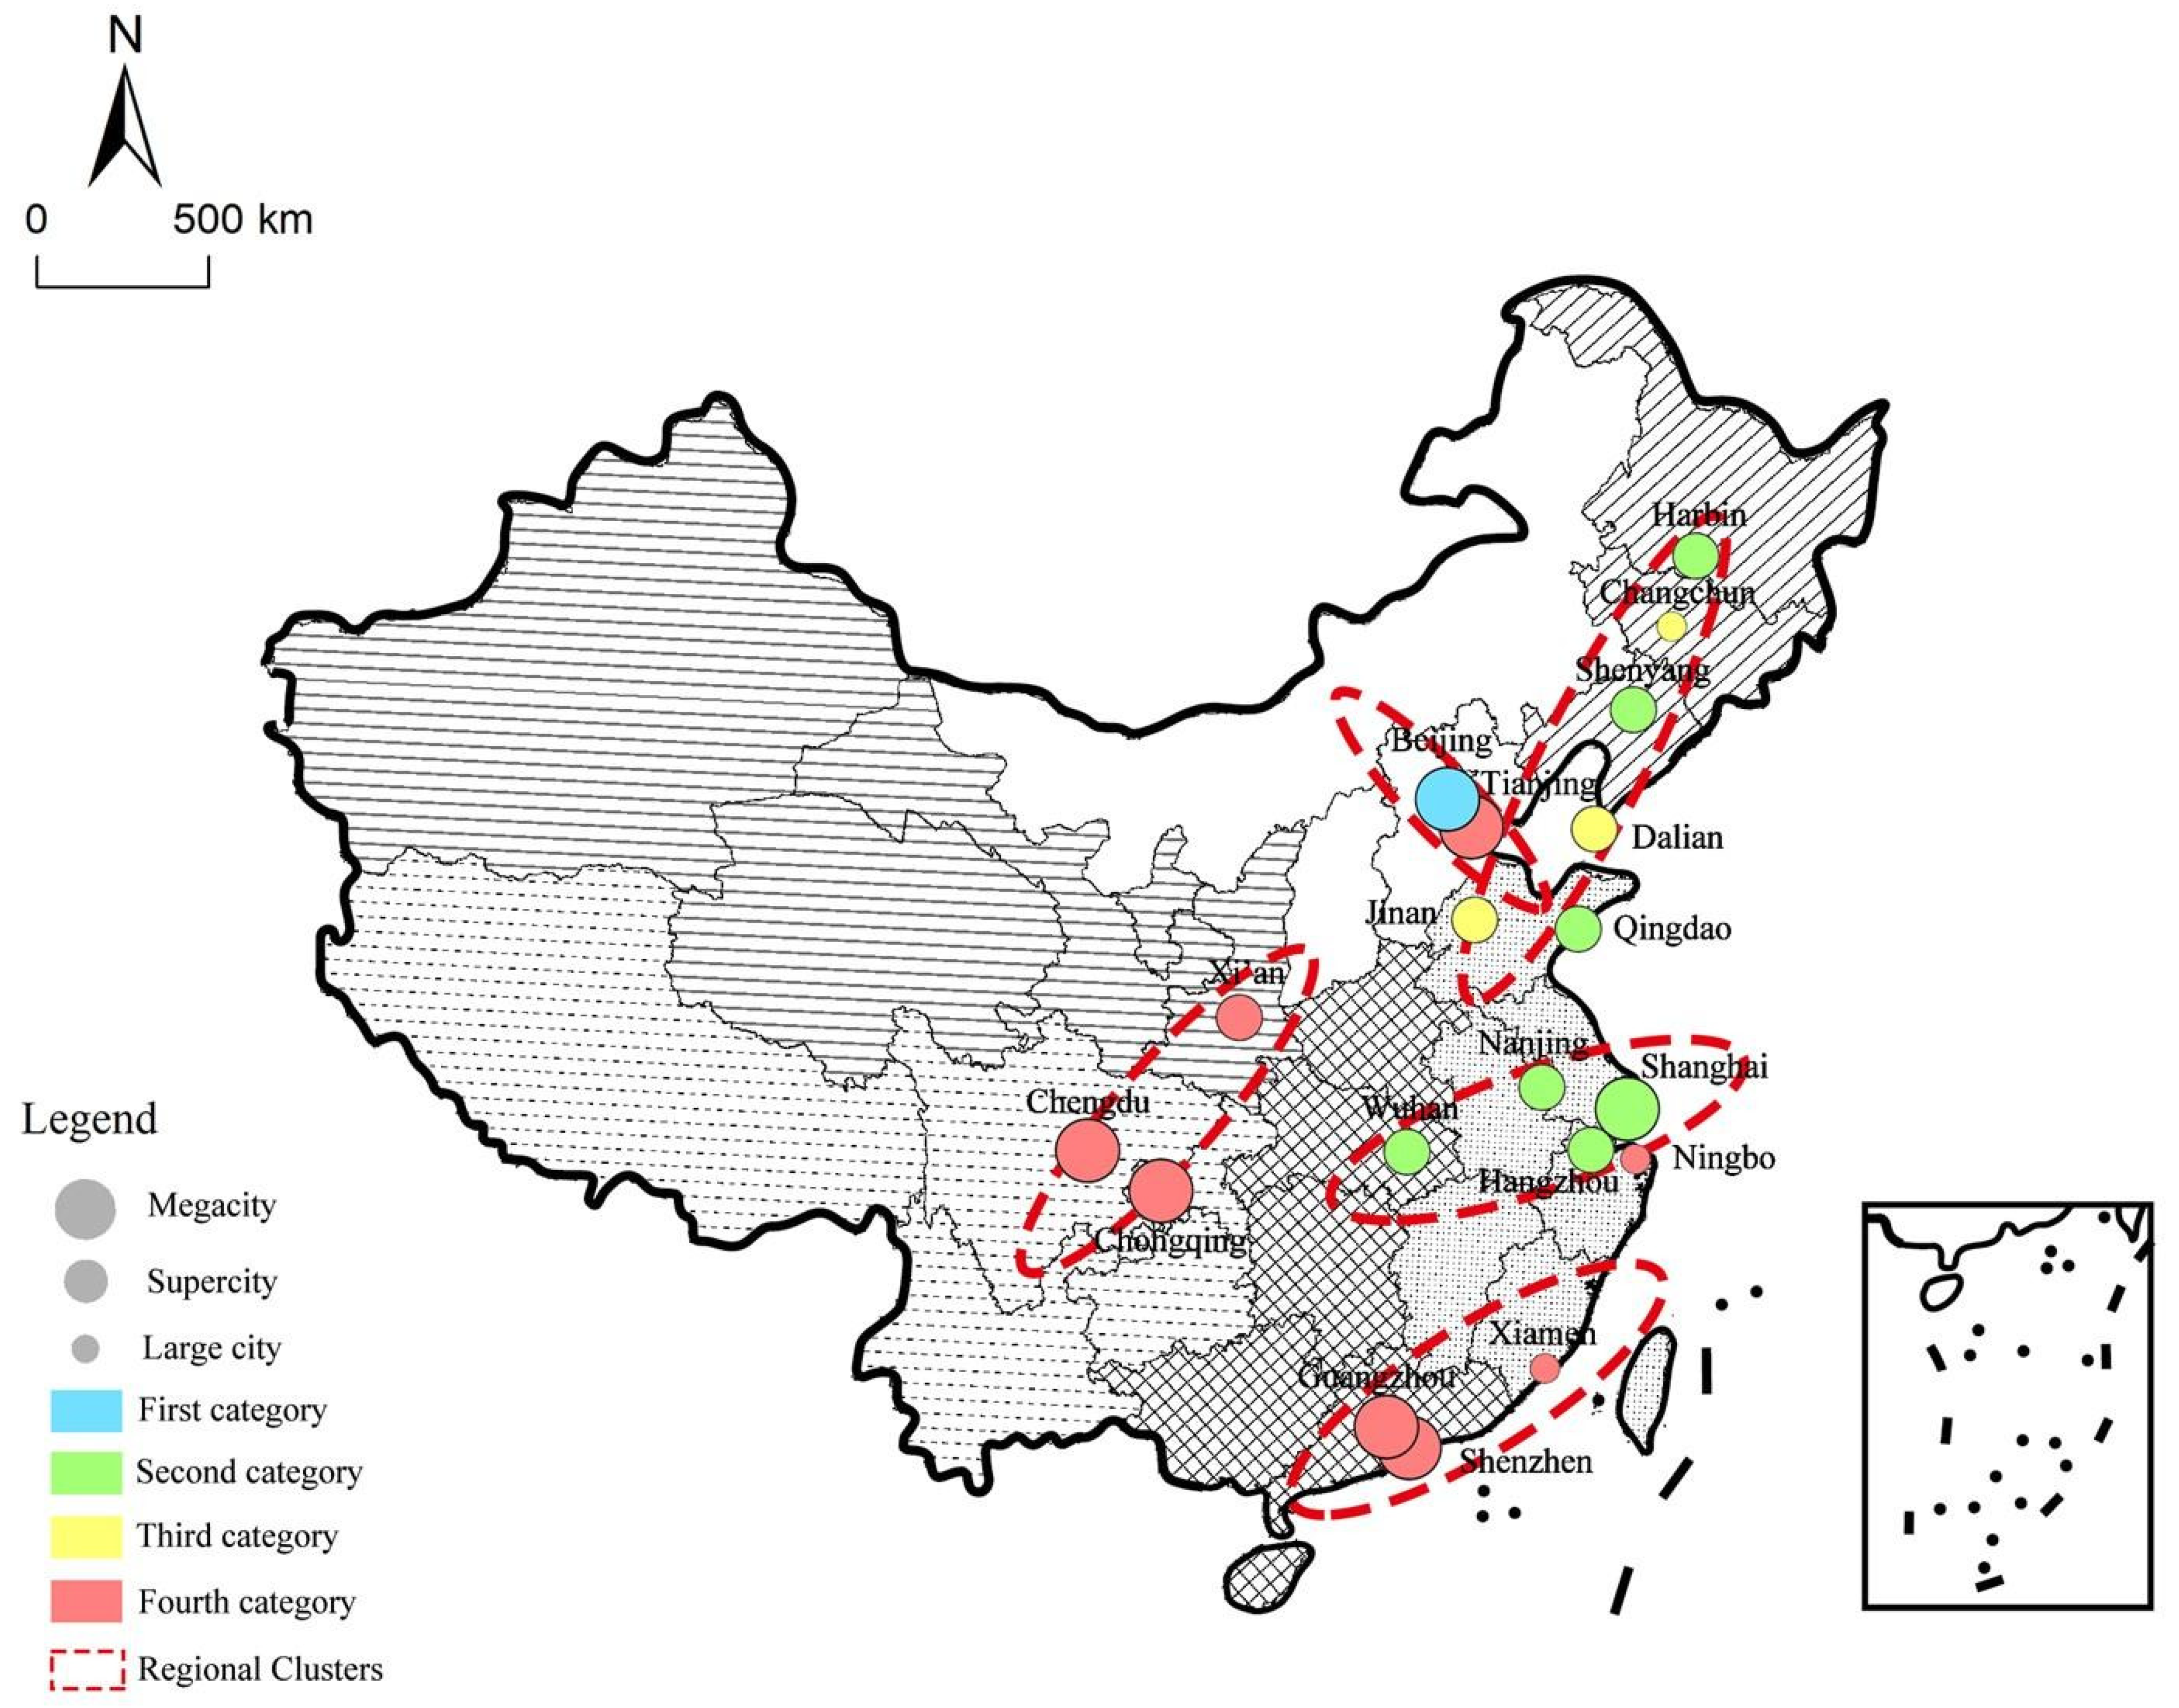
3.4. Clustering Identification of Facility Supply and Demand Balance Level

The results of the clustering calculations are shown in Table 4. Among the educational service facilities, the largest proportion of kindergartens was clustered in cities in the first category, with a comprehensive resource endowment and a strong matching of supply and demand. The share of cities in the second and third categories, where primary schools were clustered, was larger. The only city in the first category was Beijing, where there was a gap in the matching of supply and demand for facilities. There was a break in the clustering results for medical service facilities, with only Beijing in the first category. The overall development level of facilities varied significantly. The number of cities in the library cluster interval was relatively even, and the gap in the match of cultural service facilities between cities was small. Among social security facilities, the second category of elderly care facilities had the largest proportion; however, the number of cities within each gradient was small, and the matching of the supply and demand of facilities between cities was similar. In the clustering results of service facilities for people with disabilities, most cities were evenly distributed in categories one, two, and three. There was a small difference in the matching of supply and demand between cities, but the overall match was low.
The results of the clustering calculations are shown in Table 5. At the city level, a high supply-high demand match was found in Beijing, represented by an adequate supply of basic public service facilities, with even distribution. A high supply-high demand mismatch was found in the international metropolis of Guangzhou, which had a relatively high supply capacity. However, due to the city’s strong attractiveness to the population, the demand for facilities was excessive, and there was an oversupply within the city. A low supply-high demand mismatch was found in fast-growing cities, such as Shenzhen and Chengdu, which had a strong population attractiveness, while the supply of basic public services was relatively lagging. A low supply-low demand pseudo-match was found in general provincial capital cities, such as Shenyang and Harbin, with low population demand and average levels of facility supply.

4. Discussion

4.1. Different Levels of Matching of Supply and Demand for Each Type of Facility

This study found that there are many matching patterns of supply and demand in public service facilities, and this finding is consistent with previous research [40,41]. However, this study not only uses spatial data to unify the evaluation criteria to make the facilities directly comparable, but also finds the differences of matching modes of different types of facilities. Educational facilities and medical facilities have a high degree of matching of supply and demand. Typical high-quality human settlements occupy urban spaces, and the overall change level is relatively stable. The construction of elderly facilities continues to develop, but the overall matching level of supply and demand needs to be improved. The construction of cultural and disabled service facilities is not reasonable. It is necessary to optimize the spatial layout of facilities and improve the matching level of the supply and demand of facilities.
In many urban areas, the spatial mismatch between population and public service facilities will lead to excess resources or a lack of facility resources in some areas. If only matching in quantity, it is difficult to ensure that services can be obtained in space. Therefore, we need to emphasize the importance of spatial matching between supply and demand. Different from the previous spatial hotspot analysis, our study found that there are regular spatial distribution patterns among different types of facilities. The multi-layer typical community in this study reflects the matching degree of supply and demand of public service facilities. The research results can provide a targeted reference template for future public service facilities planning.

4.2. Level Gaps Causing Demand Pressure Transmission between Cities

In the past, few studies have proposed the matching index of supply and demand to compare the matching degree of multiple cities. On the one hand, this study attempts to propose a multi-level index to measure the matching degree of supply and demand of public service facilities and quantify the matching of supply and demand of public service facilities in 19 typical cities in China. On the other hand, the spatial distribution characteristics of public service facilities are classified (Figure 5). The results show that there are differences in the matching of supply and demand of public service facilities in various cities, but they have some similarities. Firstly, the supply level of public service facilities in some cities is high, but there is still a shortage of space facility resources in the city, which is consistent with the previous research emphasizing supply and demand assessment [40]. Secondly, compared with previous studies, this study not only found differences between cities, but also found potential causes of pressure transmission between cities. This study found that there is a gap in the matching degree of supply and demand of public service facilities between cities, and there will be service inequality in cities with a low level. This kind of difference may be the reason why residents choose to migrate across regions to obtain higher-quality services. This further leads to the transmission of demand pressure between cities [42], resulting in the mismatch between the supply and demand of a variety of public services in cities. For example, cities with small populations and facilities such as Shenyang and Harbin have a pseudo-match of low supply and low demand.
This study shows that there are also significant differences in the matching of supply and demand public service facilities between regions. Different urban agglomerations have been formed in different regions of China [43], and the level of urban agglomerations in the East and West is also different. These results are consistent with the previous research results emphasizing “regional differences and social inequality in China” [44]. This study identified several major urban clusters, which are consistent with the geographical counterparts of China’s urban agglomeration classification. This shows that the supply and demand matching of urban public service facilities is closely related to the level of urban economic development.
As shown in Figure 8, regional development characteristics were summarized based on the match of regional representative cities, and the results were divided into several categories. The Northeast and Bohai Rim stable areas, including Harbin, Changchun, Shenyang, Dalian, Qingdao, and Jinan, and the Northeast and Bohai Rim regions demonstrated relatively stable facility supply and demand matches. Livable areas in the middle and lower reaches of the Yangtze River, including Wuhan, Nanjing, Shanghai, Hangzhou, and Ningbo, had a relatively high level of overall supply and demand balance. Slumped areas around Beijing, including Beijing and Tianjin, had a spatial pattern with low peripheral levels and high central levels. Western regions under development, including Xi’an, Chengdu, and Chongqing, revealed a low matching of supply and demand, with a relatively lagging resource allocation of basic public service facilities. Southeast coastal areas with rapid urbanization, including Guangzhou, Shenzhen, and Xiamen, were mainly composed of rapidly urbanizing cities. The rapid development of cities and the large influx of population resulted in an imbalance between the supply and demand of facilities in this region.

5. Conclusions

This study proposes a comprehensive framework (multi-scale spatial quantification of supply and demand balance, spatial matching of supply and demand, and spatial cluster analysis of supply and demand balance), which takes a number of public service facilities in 19 large cities in China as the research object to evaluate the current situation of supply (accessibility) and demand (population carrying pressure) of various public facilities. We have put forward a supply and demand matching model between different public service facilities. This study shows that people pursue high-quality public services on the basis of rational choice. Population transfer between cities will produce demand pressure transmission and affect the overall supply-demand balance of facilities. This can also be attributed to differences in resources. At the level of supply-demand matching, there are various dynamic matching phenomena, which may lead to a waste of resources and insufficient supply. Therefore, the future development of basic public service facilities should ensure basic supply, make up for deficiencies, give full play to advantages, and build a people-oriented long-term urban development vision.
Our findings may not be applicable to all types of cities in the world (e.g., educational services, on which urban residents in China may choose their communities) [35]. However, in cities with unstable economic development in Iran, the residential options of urban residents can be limited by economic income [45], but the theoretical approach is universal. Within the framework of this methodology, it is possible to standardize criteria and conduct comparative studies between facilities and cities suitable for rapidly assessing urbanizing cities with large populations.
This study had some limitations. The accessibility assessment based on the road network was limited by the density of the road network, ignoring the requirements of the slow travel mode for walking environment and safety. However, at the demand level, people’s rigid needs were mainly considered, and the population size was used to represent the burden of the population. This approach does not fully consider the characteristics of people’s individual behavior and is only suitable for macro-level facility assessments. Future research should enrich and refine the indicators that represent accessibility and improve the accuracy of accessibility assessments. In addition, subjective assessments, considering the individual needs of residents, should be included, combining subjectivity and objectivity and improving the relevance of the conclusions.

Author Contributions

Conceptualization, W.W. and S.G.; methodology, W.W.; software, X.R.; validation, W.W., X.R. and S.G.; formal analysis, S.G.; investigation, X.R.; resources, W.W; data curation, X.R.; writing—original draft preparation, W.W. and X.R.; writing—review and editing, W.W. and S.G.; visualization, X.R.; supervision, S.G.; project administration, W.W.; funding acquisition, W.W. All authors have read and agreed to the published version of the manuscript.

Funding

This research was funded by the Key Program of the National Social Science Foundation of China, “Study on People Oriented Planning of Community Public Service Facilities “(NO. 19FGLB034).

Data Availability Statement

Not applicable.

Conflicts of Interest

The authors declare no conflict of interest.

References

  1. Dajani, J.S. Cost Studies of Urban Public Services. Land Econ. 1973, 49, 479. [Google Scholar] [CrossRef]
  2. Knox, P.; Pinch, S. Urban Social Geography: An Introduction, 6th ed.; Routledge: London, UK, 2009. [Google Scholar]
  3. Wang, W.; Zhou, Z.; Chen, J.; Cheng, W.; Chen, J. Analysis of Location Selection of Public Service Facilities Based on Urban Land Accessibility. Int. J. Environ. Res. Public Health 2021, 18, 516. [Google Scholar] [CrossRef] [PubMed]
  4. Shi, Y.; Yang, J.; Shen, P. Revealing the Correlation between Population Density and the Spatial Distribution of Urban Public Service Facilities with Mobile Phone Data. ISPRS Int. J. Geo-Inf. 2020, 9, 38. [Google Scholar] [CrossRef] [Green Version]
  5. Barbosa, H.; Hazarie, S.; Dickinson, B.; Bassolas, A.; Frank, A.; Kautz, H.; Sadilek, A.; Ramasco, J.J.; Ghoshal, G. Uncovering the socioeconomic facets of human mobility. Sci. Rep. 2021, 11, 8616. [Google Scholar] [CrossRef] [PubMed]
  6. Hu, L.; He, S.; Luo, Y.; Su, S.; Xin, J.; Weng, M. A social-media-based approach to assessing the effectiveness of equitable housing policy in mitigating education accessibility induced social inequalities in Shanghai, China. Land Use Policy 2020, 94, 104513. [Google Scholar] [CrossRef]
  7. Li, H.; Wang, Q.; Shi, W.; Deng, Z.; Wang, H. Residential clustering and spatial access to public services in Shanghai. Habitat Int. 2015, 6, 119–129. [Google Scholar] [CrossRef]
  8. Meijers, E. Summing Small Cities Does Not Make a large City: Polycentric Urban Regions and the Provision of Cultural, Leisure and Sports Amenities. Urban Stud. 2008, 45, 2323–2342. [Google Scholar] [CrossRef]
  9. Stanley, B.W.; Dennehy, T.J.; Smith, M.E.; Stark, B.L.; York, A.M.; Cowgill, G.L.; Novic, J.; Ek, J. Service Access in Premodern Cities: An Exploratory Comparison of Spatial Equity. J. Urban Hist. 2016, 42, 121–144. [Google Scholar] [CrossRef] [Green Version]
  10. Ju, H.; Ze, Q.; Hong, L. Accessibility of Medical Facilities in Multiple Traffic Modes: A Study in Guangzhou, China. Complexity 2020, 2020, 8819836. [Google Scholar]
  11. He, J.; Dang, Y.; Zhang, W.; Chen, L. Perception of Urban Public Safety of Floating Population with Higher Edu-cation Background: Evidence from Urban China. Int. J. Environ. Res. Public Health 2020, 17, 8663. [Google Scholar] [CrossRef] [PubMed]
  12. Yang, W.; Wang, X.; Zhang, K.; Ke, Z. COVID-19, Urbanization Pattern and Economic Recovery: An Analysis of Hubei, China. Int. J. Environ. Res. Public Health 2020, 17, 9577. [Google Scholar] [CrossRef] [PubMed]
  13. Shah, A.; Garg, A. Urban commons service generation, delivery, and management: A conceptual framework. Ecol. Econ. 2017, 135, 280–287. [Google Scholar] [CrossRef]
  14. Deruyter, G.; Fransen, K.; Verrecas, N.; De Maeyer, P. Evaluating spatial inequality in pre-schools in Ghent, Belgium by accessibility and service area analysis with GIS. In Proceedings of the 13th International Multidisciplinary Scientific GeoConference-SGEM, Albena, Bulgary, 16–22 June 2013; Volume 1, p. 717. [Google Scholar]
  15. Lu, C.; Zhang, Z.; Lan, X. Impact of China’s referral reform on the equity and spatial accessibility of healthcare re-sources: A case study of Beijing. Soc. Sci. Med. 2019, 235, 112386. [Google Scholar] [CrossRef] [PubMed]
  16. Hu, S.; Song, W.; Li, C.; Lu, J. The Spatial Equity of Nursing Homes in Changchun: A Multi-Trip Modes Analysis. ISPRS Int. J. Geo-Inf. 2019, 8, 223. [Google Scholar] [CrossRef] [Green Version]
  17. Xie, Q.; Lu, M. Measures of Spatial and Demographic Disparities in Access to Urban Green Space in Harbin, China. Complexity 2020, 2020, 11. [Google Scholar] [CrossRef]
  18. Chen, T.; Hui, E.C.-M.; Lang, W.; Tao, L. People, recreational facility and physical activity: New-type urbanization planning for the healthy communities in China. Habitat Int. 2016, 58, 12–22. [Google Scholar] [CrossRef]
  19. Zhao, Y.; Zhang, G.; Lin, T.; Liu, X.; Liu, J.; Lin, M.; Ye, H.; Kong, L. Towards Sustainable Urban Communities: A Composite Spatial Accessibility Assessment for Residential Suitability Based on Network Big Data. Sustainability 2018, 10, 4767. [Google Scholar] [CrossRef] [Green Version]
  20. Feng, S.; Chen, L.; Sun, R.; Feng, Z.; Li, J.; Khan, M.S.; Jing, Y. The Distribution and Accessibility of Urban Parks in Beijing, China: Implications of Social Equity. Int. J. Environ. Res. Public Health 2019, 16, 4894. [Google Scholar] [CrossRef] [PubMed] [Green Version]
  21. Kong, X.; Liu, Y.; Wang, Y.; Tong, D.; Zhang, J. Investigating Public Facility Characteristics from a Spatial Interaction Perspective: A Case Study of Beijing Hospitals Using Taxi Data. ISPRS Int. J. Geo-Inf. 2017, 6, 38. [Google Scholar] [CrossRef]
  22. Liu, S.; Wang, Y.; Zhou, D.; Kang, Y. Two-Step Floating Catchment Area Model-Based Evaluation of Community Care Facilities’ Spatial Accessibility in Xi’an, China. Int. J. Environ. Res. Public Health 2020, 17, 5086. [Google Scholar] [CrossRef]
  23. Jing, C.; Zhu, Y.; Du, M.; Liu, X. Visualizing spatiotemporal patterns of city service demand through aspace-time exploratory approach. Trans. GIS 2021, 25, 1766–1783. [Google Scholar] [CrossRef]
  24. Li, J.; Li, J.; Shao, L.; Sun, S. Evaluation of spatial matching between urban green space and population: Dynamics analysis of winter population data in Xi’an. J. Urban Plan. Dev. 2021, 147, 05021012. [Google Scholar] [CrossRef]
  25. Li, Z.; Chen, H.; Yan, W. Exploring Spatial Distribution of Urban Park Service Areas in Shanghai Based on Travel Time Estimation: A Method Combining Multi-Source Data. ISPRS Int. J. Geo-Inf. 2021, 10, 608. [Google Scholar] [CrossRef]
  26. Karra, M.; Fink, G.; Canning, D. Facility distance and child mortality: A multi-country study of health facility access, service utilization, and child health outcomes. Int. J. Epidemiol. 2017, 46, 817–826. [Google Scholar] [CrossRef] [Green Version]
  27. Vadrevu, L.; Kanjilal, B. Measuring spatial equity and access to maternal health services using enhanced two step floating catchment area method (E2SFCA)—A case study of the Indian Sundarbans. Int. J. Equity Health 2016, 15, 87. [Google Scholar] [CrossRef] [PubMed] [Green Version]
  28. Gyasi, R.; Phillips, D.; Buor, D. The Role of a Health Protection Scheme in Health Services Utilization Among Community-Dwelling Older Persons in Ghana. J. Gerontol. Ser. B 2020, 75, 661–673. [Google Scholar] [CrossRef] [PubMed]
  29. Kapologwe, N.A.; Kibusi, S.M.; Borghi, J.; Gwajima, D.O.; Kalolo, A. Assessing health system responsiveness in primary health care facilities in Tanzania. BMC Health Serv. Res. 2020, 20, 104. [Google Scholar] [CrossRef] [PubMed]
  30. Almohamad, H.; Knaack, A.L.; Habib, B.M. Assessing Spatial Equity and Accessibility of Public Green Spaces in Aleppo City, Syria. Forests 2018, 9, 706. [Google Scholar] [CrossRef] [Green Version]
  31. Comber, A.; Brunsdon, C.; Green, E. Using a GIS-based network analysis to determine urban greenspace accessibility for different ethnic and religious groups. Landsc. Urban Plan. 2008, 86, 103–114. [Google Scholar] [CrossRef] [Green Version]
  32. Guo, M.; Liu, B.; Tian, Y.; Xu, D. Equity to Urban Parks for Elderly Residents: Perspectives of Balance between Supply and Demand. Int. J. Environ. Res. Public Health 2020, 17, 8506. [Google Scholar] [CrossRef] [PubMed]
  33. Li, J.; Feng, C. Spatial Balance Analysis on Urban Public Service in Beijing City. Areal Res. Dev. 2017, 36, 1003–2363. [Google Scholar]
  34. Zhang, L.; Zhou, T.; Mao, C. Does the Difference in Urban Public Facility Allocation Cause Spatial Inequality in Housing Prices? Evidence from Chongqing, China. Sustainability 2019, 11, 6090. [Google Scholar] [CrossRef] [Green Version]
  35. Shen, Y.; Li, L. The influence of medical facility accessibility on residents’ health seeking behaviors from the perspective of age stratification: A case study of shanghai Chongming island. Hum. Geogr. 2021, 36, 46–54. [Google Scholar]
  36. Deng, Z.; Li, Z.; Zhou, Y.; Chen, X.; Liang, S. Measurement and spatial spillover effects of port comprehensive strength: Empirical evidence from China. Transp. Policy 2020, 99, 288–298. [Google Scholar]
  37. Tan, X.; Huang, D.; Zhao, X.; Yu, Y.; Leng, B.; Feng, L. Jobs housing balance based on Baidu thermodynamic diagram. J. Beijing Norm. Univ. (Nat. Sci.) 2016, 52, 622–627. [Google Scholar]
  38. Li, J.; Li, J.; Yuan, Y.; Li, G. Spatiotemporal distribution characteristics and mechanism analysis of urban population density: A case of Xi’an, Shaanxi, China. Cities 2019, 86, 62–70. [Google Scholar] [CrossRef]
  39. Rezaee, M.; Lelieveldt, B.; Reiber, J. A new cluster validity index for the fuzzy c-mean. Pattern Recognit. Lett. 1998, 19, 237–246. [Google Scholar] [CrossRef]
  40. Liu, H.; Remme, R.; Hamel, P.; Nong, H.F.; Ren, H. Supply and demand assessment of urban recreation service and its implication for greenspace planning-A case study on Guangzhou. Landsc. Urban Plan. 2020, 203, 103898. [Google Scholar] [CrossRef]
  41. Liu, Z.; Huang, Q.; Yang, H.Y. Supply and demand spatial patterns of park cultural services in megalopolis area of Shenzhen, China. Ecol. Indic. 2021, 121, 107066. [Google Scholar] [CrossRef]
  42. Cao, G.Z.; Chen, S.C.; Liu, T. Changing spatial patterns of internal migration to five major urban agglomerations in China. Acta Geogr. Sin. 2021, 76, 1334–1349. [Google Scholar]
  43. Fang, C.L. New structure and new trend of formation and development of urban agglomerations in china. Sci. Geogr. Sin. 2011, 31, 1025–1034. [Google Scholar]
  44. Huang, L.; Yan, L.; Wu, J. Assessing urban sustainability of Chinese megacities: 35 years after the economic reform and open-door policy. Landsc. Urban Plan. 2016, 145, 57–70. [Google Scholar] [CrossRef]
  45. Dadashpoor, H.; Rostami, F.; Alizadeh, B. Is inequality in the distribution of urban facilities inequitable? Exploring a method for identifying spatial inequity in an Iranian city. Cities 2016, 52, 159–172. [Google Scholar] [CrossRef]
Figure 1. The Integrated framework for the assessment of supply and demand of facilities.
Land 11 00149 g001
Figure 2. Location of 15 sub-provincial cities and 4 municipalities (Source: repainted by the author, http://bzdt.ch.mnr.gov.cn/browse.html?picId=%224028b0625501ad13015501ad2bfc0002%22, accessed on 26 November 2021).
Land 11 00149 g002
Figure 3. Principles of cost service area construction.
Land 11 00149 g003
Figure 4. Classification of typical residential space. Public service per capita is the reciprocal of population carrying pressure.
Land 11 00149 g004
Figure 5. Statistical results of the accessibility circle of basic public service facilities. (a) Statistical results of the accessibility circle of Kindergarten. (b) Statistical results of the accessibility circle of Primary School. (c) Statistical results of the accessibility circle of Medical Services Facilities. (d) Statistical results of the accessibility circle of Library. (e) Statistical results of the accessibility circle of Elderly Care Facilities. (f) Statistical results of the accessibility circle of Disabled People’s Services Facilities.
Land 11 00149 g005
Figure 6. Statistical results of the population carrying pressure of facilities. (a) Statistical results of the population carrying pressure of Kindergarten. (b) Statistical results of the population carrying pressure of Primary School. (c) Statistical results of the population carrying pressure of Medical Services Facilities. (d) Statistical results of the population carrying pressure of Library. (e) Statistical results of the population carrying pressure of Elderly Care Facilities. (f) Statistical results of the population carrying pressure of Disabled People’s Services Facilities.
Land 11 00149 g006
Figure 7. Representative cities of typical spatial distribution patterns of human settlements. (a) Stable tiling mode. (b) Gentle decline mode. (c) Undulating decline mode. (d) Central collapse mode. (e) Single-arm collapse mode.
Land 11 00149 g007
Figure 8. Regional horizontal spatial distribution results. (Source: repainted by the author, http://bzdt.ch.mnr.gov.cn/browse.html?picId=%224028b0625501ad13015501ad2bfc0002%22, accessed on 26 November 2021).
Land 11 00149 g008
Table 1. Analytic hierarchy process judgment matrix analysis and consistency test statistic results.
AHP Judgment MatrixAHP Result of the
Hierarchical Analysis
Result of Consistency Test
H-H
Community
H-M
Community
H-L
Community
L-H
Community
L-M
Community
L-L
Community
Feature VectorWeightMaximum Characteristic RootCIRICR
H-H
community
1355794.0960.45656.2560.0511.260.041
H-M
community
1/3133572.1720.2421
H-L
community
1/51/311351.0000.1115
L-H
community
1/51/311351.0000.1115
L-M
community
1/71/51/31/3130.4600.5130
L-L
community
1/91/71/51/51/310.2440.2720
Table 2. Facility supply and demand matching level results.
CityKindergartenPrimary SchoolMedical
Service
Facilities
LibraryAged-Care
Facilities
Disabled
Facilities
Comprehensive Supply and Demand Matching Level
Beijing0.37620.41710.40090.15610.22590.15031.7264
Shanghai0.29840.37600.28240.11330.15690.13291.3599
Tianjin0.23820.26110.28240.07160.15420.04791.0553
Chongqing0.24530.30640.24940.05780.13240.09581.0870
Shenyang0.26530.40410.31150.10460.20800.12011.4136
Wuhan0.31450.39080.32570.12900.17460.12801.4625
Nanjing0.33880.39440.30580.14020.18760.07341.4401
Guangzhou0.27140.29470.22240.07290.08510.04000.9866
Chengdu0.21760.25740.35130.04840.10480.06631.0457
Xi’an0.26130.30860.20110.06720.06060.09860.9975
Hangzhou0.29990.37100.30520.12250.17230.12051.3913
Shenzhen0.30330.35570.16200.08300.08330.07691.0642
Harbin0.23450.38160.25770.14270.22690.13401.3772
Changchun0.19570.35510.18290.12430.17150.10621.1358
Xiamen0.26650.33720.18090.06470.06210.06880.9802
Jinan0.28900.38170.21020.09250.11530.11911.2079
Ningbo0.20510.34120.21170.06080.08270.07820.9797
Qingdao0.33270.37830.35440.09200.23950.12791.5249
Dalian0.28870.33270.27670.12430.19550.06771.2856
Average value0.27590.34970.26710.09830.14940.09751.2380
Table 3. Classification results of typical human settlement spatial distribution patterns.
CityKindergartenPrimary SchoolMedical Service
Facilities
LibraryAged-Care
Facilities
Disabled Facilities
Beijing232331
Shanghai253531
Tianjin333352
Chongqing333432
Shenyang233331
Wuhan233351
Nanjing233334
Guangzhou333333
Chengdu433334
Xi’an333333
Hangzhou233333
Shenzhen333434
Harbin253531
Changchun233333
Xiamen333351
Jinan233333
Ningbo233443
Qingdao232531
Dalian233334
1 Stable tiling mode; 2 Gentle decline mode; 3 Undulating decline mode; 4 Central collapse mode; 5 Single-arm collapse mode.
Table 4. Cluster classification results of various facilities in the city.
Clustering ClassificationMinimumMaximumMeanStandard
Deviation
City
Kindergarten10.37100.41710.38830.0148Beijing, Shanghai, Shenyang, Wuhan, Nanjing, Hangzhou, Harbin, Jinan, Qingdao
20.33270.35570.34440.0105Shenzhen, Changchun, Xiamen, Ningbo, Dalian
30.29470.30860.30320.0075Chongqing, Guangzhou, Xi’an
40.25740.26110.25920.0026Tianjin, Chengdu
Primary school10.37620.37620.3762-Beijing
20.28870.33880.30820.0190Shanghai, Wuhan, Nanjing, Hangzhou, Shenzhen, Jinan, Qingdao, Dalian
30.23450.27140.25460.0150Tianjin, Chongqing, Shenyang, Guangzhou, Xi’an, Harbin, Xiamen
40.19570.21760.20620.0110Chengdu, Changchun, Ningbo
Medical service facilities10.40090.40090.4009-Beijing
20.30520.35440.32560.0224Shenyang, Wuhan, Nanjing, Chengdu, Hangzhou, Qingdao
30.24940.28240.26970.0152Shanghai, Tianjin, Chongqing, Harbin, Dalian
40.16200.22240.19590.0213Guangzhou, Xi’an, Shenzhen, Changchun, Xiamen, Jinan, Ningbo
Library10.14020.15610.14630.0086Beijing, Nanjing, Harbin
20.10460.12900.11970.0090Shanghai, Shenyang, Wuhan, Hangzhou, Changchun, Dalian
30.07160.09250.08240.0100Tianjin, Guangzhou, Shenzhen, Jinan, Qingdao
40.04840.06720.05980.0073Chongqing, Chengdu, Xi’an, Xiamen, Ningbo
Aged-care facilities10.20800.23950.22510.0129Ningbo, Shenyang, Shenyang, Qingdao
20.15420.19550.17320.0149Shanghai, Tianjin, Wuhan, Nanjing, Hangzhou, Changchun, Dalian
30.10480.13240.11750.0139Chongqing, Chengdu, Jinan
40.06060.08510.07480.0123Guangzhou, Xi’an, Shenzhen, Ningbo, Xiamen
Disabled facilities10.12790.15030.13460.0092Beijing, Shanghai, Wuhan, Harbin, Qingdao
20.09580.12050.11010.0113Chongqing, Shenyang, Xi’an, Hangzhou, Changchun, Jinan
30.06630.07820.07190.0050Nanjing, Chengdu, Shenzhen, Xiamen, Ningbo, Dalian
40.04000.04790.04400.0056Tianjin, Guangzhou
Table 5. Comprehensive cluster classification results of basic facilities.
Clustering
Classification
Matching Level
Classification
MinimumMaximumMeanStandard DeviationCity
1Primary school0.37620.37620.3762-Beijing
Kindergarten0.41710.41710.4171-
Medical service facilities0.40090.40090.4009-
Library0.15610.15610.1561-
Aged-care facilities0.22590.22590.2259-
Disabled facilities0.15030.15030.1503-
Comprehensive matching level1.72641.72641.7264-
2Primary school0.23450.33880.29770.0371Shanghai, Shenyang, Wuhan, Nanjing, Hangzhou, Harbin, Qingdao
Kindergarten0.37100.40410.38520.0117
Medical service facilities0.25770.35440.30610.0307
Library0.09200.14270.12060.0186
Aged-care facilities0.15690.23950.19510.0306
Disabled facilities0.07340.13400.11950.0211
Comprehensive matching level1.35991.52491.42420.0569
3Primary school0.19570.28900.25780.0538Dalian, Jinan, Changchun
Kindergarten0.33270.38170.35650.0245
Medical service facilities0.18290.27670.22330.0483
Library0.09250.12430.11370.0183
Aged-care facilities0.11530.19550.16080.0412
Disabled facilities0.06770.11910.09770.0268
Comprehensive matching level1.13581.28561.20980.0749
4Primary school0.20510.30330.25110.0314Tianjin, Chongqing, Guangzhou, Chengdu, Xi’an, Shenzhen, Xiamen, Ningbo
Kindergarten0.25740.35570.30780.0362
Medical service facilities0.16200.35130.23270.0610
Library0.04840.08300.06580.0105
Aged-care facilities0.06060.15420.09560.0330
Disabled facilities0.04000.09860.07160.0206
Comprehensive matching level0.97971.08701.02450.0431
Publisher’s Note: MDPI stays neutral with regard to jurisdictional claims in published maps and institutional affiliations.

