1. Introduction
In Alto Guadiana (province of Ciudad Real—Spain), the transformation of the funerary rituals of the Motilla Culture (Bronze Age), based on burial, gave way to the introduction of cremation practices towards the end of the 8th or 7th century BC [
1].
In this territory, there is little knowledge about Iberian sanctuaries and necropolises, unlike in the neighbouring provinces of Albacete or Jaén. From the data obtained, it is possible to establish the ritual in the excavation of a pit in which the remains of the cremation are deposited. These are secondary depositions, since the sizes of the pits are too small to contain the cremation pyre. In the centre of these pits was placed the funerary urn—which was usually covered—small vessels and small amounts of very crushed bones. These burial rituals perpetuated the indigenous traditions until late in the first century AD; not only because of the fact of cremation itself, but also because of a similar organization of the funerary spaces and the reuse of the use of the same cemetery sites [
2].
In the La Mancha area, necropolises from the 1st millennium BC have only been excavated in Camino del Matadero (Alhambra), Los Toriles-Casas Altas (Villarrubia de los Ojos) and Cerro de las Cabezas (Valdepeñas). The interventions in all of them have been short and punctual, without having enjoyed continuity. These three examples present certain common characteristics, such as the permanence in the use of the place or the execution of burial sites that have been widely verified in the neighbouring provinces of Albacete and Jaén, and that allow us to increase our knowledge about the Iberian necropolis of Ciudad Real. The materials found in these necropolises show the increase in trade both with the orientalising world and, later on, with the Mediterranean area [
3].
The necropolis of El Toro is now beginning to be studied and joins the three previously mentioned necropolises. Before proceeding to its systematic excavation, its study by georadar was considered. Georadar surveys have never before been carried out in Iberian necropolises in the Upper Guadiana.
The objective of this work is threefold: to present the results of the geophysical exploration applied for the first time to a necropolis in this territory and, in addition, to determine the real extension of the site, in order to be able to fence it and then proceed to its systematic archaeological excavation in the area. In addition, as regards Landscape Archaeology, it allows us to understand a funerary centre of high symbolic power in the heart of the Campo de Montiel region, unexplored until now in this sense.
2. Study Site
The necropolis of El Toro is located on the Camino del Medio estate, in the area of Los Cotos, next to the Camino Viejo de Valdepeñas [
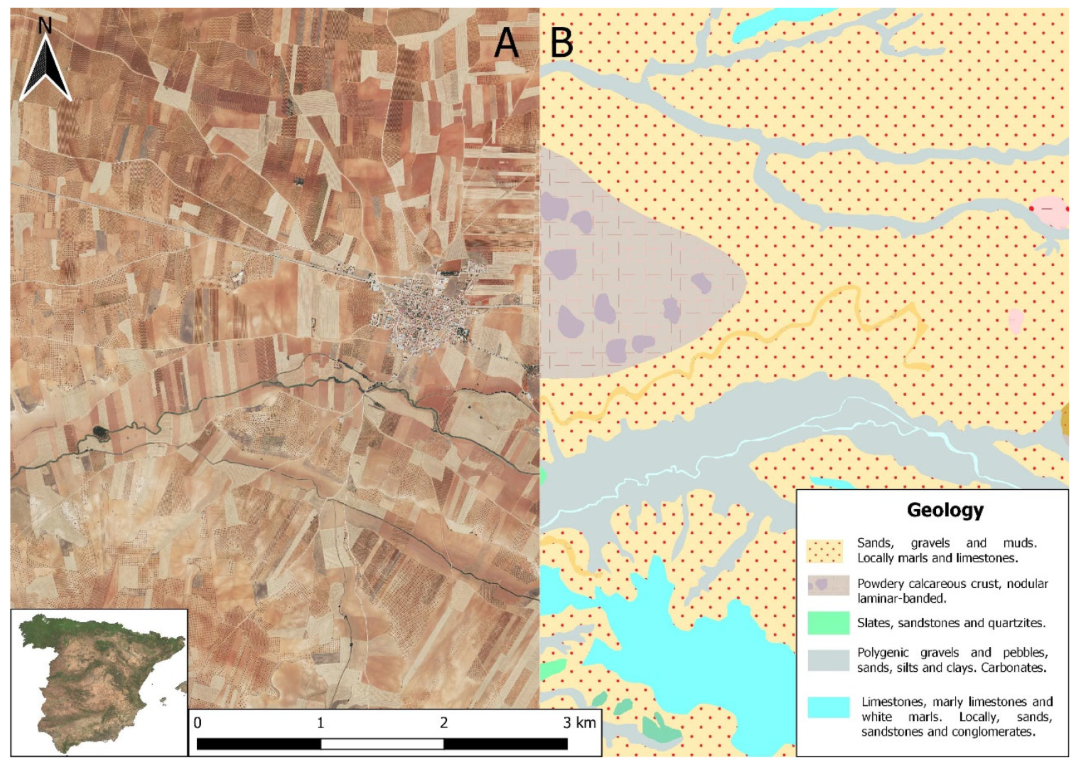
4], located on the right bank of the Jabalón river as it passes through Alcubillas (province of Ciudad Real, Spain). From a geomorphological point of view, it is a detritic glacis or colluvium formation (represented cartographically by gravels, some pebbles, sands and clays) over red earthy material and carbonate crusts. These are older geological units degraded in processes occurring during the Pliocene-Quaternary [
5],
Figure 1.
The Iron Age necropolis of El Toro is located on a flat ground next to a historic road that crosses E/W over the natural area of Campo de Montiel in La Mancha. The area affected by the necropolis could be as large as 1 ha according to the dispersion of materials found on the surface. It was discovered by chance in 1975 when a carving in ferruginous sandstone representing the head of a bull was found. The sculpture showed ancient fractures and was dated to the 4th century BC. Due to the importance of these findings, the site has been the victim of numerous acts of plundering and looting, endangering the integrity of the heritage. For this reason, for the elaboration of this article, it has been determined necessary to eliminate any spatial reference and coordinates that could cause further damage to the site.
In 2016, L. Benítez de Lugo Enrich and J.L Fuentes Sánchez led an archaeological research project aimed at resolving the question of the existence of an Iron Age necropolis with an orientalising sequence at the site [
6]. The existence of high concentrations of ceramic materials of Iberian chronology was confirmed, mainly necks and rims of earthenware jars, lids and walls of oxidising firing vessels. A large number of fragments of Iberian burnished greyware bowls and vessels, fusayoles and remains of bronze elements belonging to ring-shaped fibulae, as well as others of undetermined function, were also found. Test Pit 1 led to the discovery of one of the ustrina of the necropolis and in Test Pit 2, evidence was found of funerary enclosures consisting of a circular hole in the ground. Test Pit 3 led to the discovery of a tomb structure no more than 1 m in diameter: in Tomb 5 (T5) a-b-c; three urns belonging to three different individuals were found. The contextualised sculptural finds were concentrated in Test Pit 4, where numerous small and medium-sized fragments carved in ferruginous sandstone were documented, belonging to sculptures that would have formed part of funerary monuments from an earlier phase. The archaeological materials recovered include anthropomorphic sculptural fragments (relief with a male head), zoomorphic [
7] (bull’s hooves and horse canes, feline bodies) and vegetal (scrolls and ovals) and architectural fragments (fragments of gola, helicoidal column). All of these are accompanied by occulted vitreous paste beads and Attic pottery with red figures. The bell-shaped Attic krater from the necropolis of El Toro corresponds to the most common types of a late variant, widespread among the indigenous populations of the Iberian Peninsula between 450 and 320 BC. This krater would have a main decoration on its face A that is in keeping with the ‘Aphrodite–Eros’ theme identified on the three fragments of the rim/wall. This is undoubtedly the part with the greatest profusion of decoration, as can be seen in the presence of the three divinities and the profusion of colour in shades of red, black, ochre and white, the latter as an added colour, this polychromy being characteristic of a later period with respect to classicism [
8].
Once the archaeological interest of the site was confirmed, a perimeter security fence was installed. As a preliminary step to the planned archaeological excavations, this geophysical study was carried out in order to obtain as much information as possible and thus guide the study of the archaeological site in the best possible way [
9]. However, the material conditions found at the site were altered. It is not known whether the origin of the intrusion corresponded to the criminal act of looting or whether it was a form of reuse perpetuated by the inhabitants of the area, something that is still controversial and under debate [
10].
In February 2022, before the perimeter fence was erected, the site was plundered with a metal detector by poachers. The crime was reported to the Guardia Civil (SEPRONA), which has included the site in its police surveillance rounds.
To prevent possible future looting, we avoid providing the specific location of the archaeological elements described in this paper.
3. Materials and Methods
To carry out the explorations, the research group used up to three different geophysical devices in order to verify the results that they reflected in the deposit. The first two correspond to two GPRs (Ground Penetrating Radar) [
11]. Both GPR systems were multi-channel instruments. The third was a modulable multi-channel magnetometer. As a common point, the three survey tools used were equipped with a GPS positioning system that allowed the data resulting from the different explorations to be geo-referenced. This was a major improvement in terms of analysis and interpretation of results, which will be discussed later on.
The first device, indicated above, is a GPR Stream X model from the Italian company IDS (Ingenierie dei Sistemi), from Pisa, Italy. This georadar has a 200 MHz centre frequency configuration consisting of a set of 15 antennas. The equipment has a wingspan of nearly two metres and a considerable weight, which is why it is used with a lifting system attached to an all-terrain vehicle. This model’s tough wingspan allows it to explore large areas of terrain, reaching a maximum speed of 15 km/h.
The second of the georadar models consists of an MK IV from the Norwegian brand Kontur (formerly known as 3D-Radar). This model, unlike the previous one, has a multi-frequency configuration ranging from 30 to 3000 MHz, which allows for a better quality of the resulting data [
12]. The 28-antenna equipment is somewhat longer than the previous one, reaching 2.10 m in length; therefore, we are talking about a tool that is also used by means of a towed system coupled to a motor vehicle.
The third of the instruments used in the exploration was a multi-channel modulable magnetometer from the German company Sensys(Bad Saarow, Germany), specifically, the MX V3 model. It features a gradiometer arrangement that can be configured in three modes: two manual modes of five and ten gradiometers and a third motorised configuration of 16 gradiometers. The instrument allows us to operate at a multitude of frequencies, the most commonly used being 20 MHz.
As for the method used to obtain the different types of data, we can divide it into methodology applied in the field and methodology applied in the laboratory.
For the methodology applied in the field, once the general parameters corresponding to the delimitation of the plot, the identification of the areas to be surveyed and the use of a GIS as a support tool for the research had been determined, data collection was carried out with each of the above-described pieces of equipment.
The samples obtained using Stream X had a working configuration of 80 nanoseconds (ns) with 512 samples per scan (512 sample/scan) carried out at a wave propagation speed of 10 cm/ns. During the scan, a series of corrections are automatically applied to the collected raw data to mitigate the generation of noise consisting of possible interferences caused by the irregularity of the terrain or by sudden movements generated by collisions with small obstacles. In parallel, these data are combined with the information from the GPS system, resulting in a set of geo-referenced data.
The methodological difference between magnetic and ground radar surveying is very clear. We have been able to observe different graphical expressions between the two. However, they are complementary. In the same way, we thought it would be interesting to use two different types of radar: the pulse radar (Stream X) and the stepped frequency radar (3D Radar) [
13].
The configuration of the MK IV model has similar characteristics to the Stream X model, 80 ns at a propagation speed of 10 cm/ns. This is because the differences are more noticeable in the processes carried out in the laboratory, as will be seen below.
Finally, the MX V3 magnetometer was configured in two systems: a manual push system of 10 gradiometers and a mechanised drag configuration with 16 gradiometers. Both the former and the latter were operated with a sampling rate of 20 Hz at 5 km/h.
The methodology applied in the laboratory presents notable differences due to the use of different data processing software, each of them exclusively dedicated to the GPR models used in this sample.
To process the data obtained from the survey using the Stream X georadar model, Gred HD software, an exclusive IDS programme, was used. The following sequence was selected for filtering: vertical bandpass filter between a range sequence of 100 and 1000 MHz, Timezero correction, application of GainSEC gain and, finally, the background noise was eliminated with background removal and the average was obtained. From the selection of these criteria, a visualisation of the data is obtained both in 2 dimensions and in 3D. Among the resulting products, we highlight the plan images, which are very useful to provide an overall view of the data, and the radargrams, which are a set of images in which the different levels at which the electromagnetic anomalies collected by the georadar can be appreciated.
The raw data collected by the MK IV 3D Radar model are processed using the Examiner 3 software. This software allows the visualisation of 3D data from the processing of large amounts of information. This tool allows the researcher to configure, from the beginning, the set of processes required, giving total freedom to the qualified user. For this particular case, we have chosen the following processing and filtering parameters: first, we have selected a value of the dielectric constant or epsilon: average value used around 9. Next, we have proceeded to the selection of a parameter called “Interference Suppression”, which consists of elimination of interferences coming from external sources.
The Time Window, a vertical extension of the data, was acquired at a depth of 83 ns.
Another filter used was the “ISDFT” (Inverse Selective Discrete Fourier Transform), which transforms the data from the frequency domain to the time domain. It allows certain variations in the processing and visualization through some parameters. The configuration of these was as follows: attenuation: 0.025. Type of calculation: Kaiser. Algorithm of compensation of the raw data before conversion. Maximum frequency: 1500 MHz and minimum frequency: 200 MHz. Finally, the data were subjected to a background removal, with which a background noise subtraction was performed.
Finally, to process the data obtained by magnetic prospecting, two processing programmes were used: DLM GPS and MAGNETO. The first one consists of a tool that allows the combination of the raw data from the magnetometer with the coordinates collected by the GPS, giving the product a georeferencing with millimetric precision. The second programme, MAGNETO, is responsible for transforming the unfiltered georeferenced data into a product that allows the visualisation of magnetic disturbances in a zenithal view, commonly referred to as a magnetogram. This magnetogram was exported with dipole values between the positive/negative +15/−15 nT/m (nanoteslas per meter) values, making this option the most suitable for the visualisation of anomalies for this deposit [
14].
All these tools described above have in common that they allow for the exporting of their results in various formats, such as point clouds, GeoTIFF format or even animated formats such as video or gif. These products provide the historian with a vision of the buried elements, improving the understanding and interpretation of the site on which he is working, without the need to carry out extensive archaeological interventions, making htem able to intervene only in those areas of greatest interest for the research. This way of proceeding is one of the lines within the so-called “non-invasive archaeology”.
4. Results
The following is a summary of the results obtained during the explorations using the three geophysical types of equipment used for this purpose.
A total of five projects were carried out with the Stream X georadar. The sum of the works made it possible to reach a total of 12,970 m
2. On the same surface, the area explored with the MK IV georadar was 10,607 m
2. Finally, the magnetic exploration covered an approximate area of 13,639 m
2 (
Table 1).
In order to safeguard the integrity of the site, it has been decided to present the results obtained avoiding any type of geospatial reference that would allow for possible despoilment. For this reason, the following images will be shown with the greyish background of the DTM (Digital Terrain Model) and at a scale adjusted to the geophysical data.
4.1. Results Obtained Using Stream X
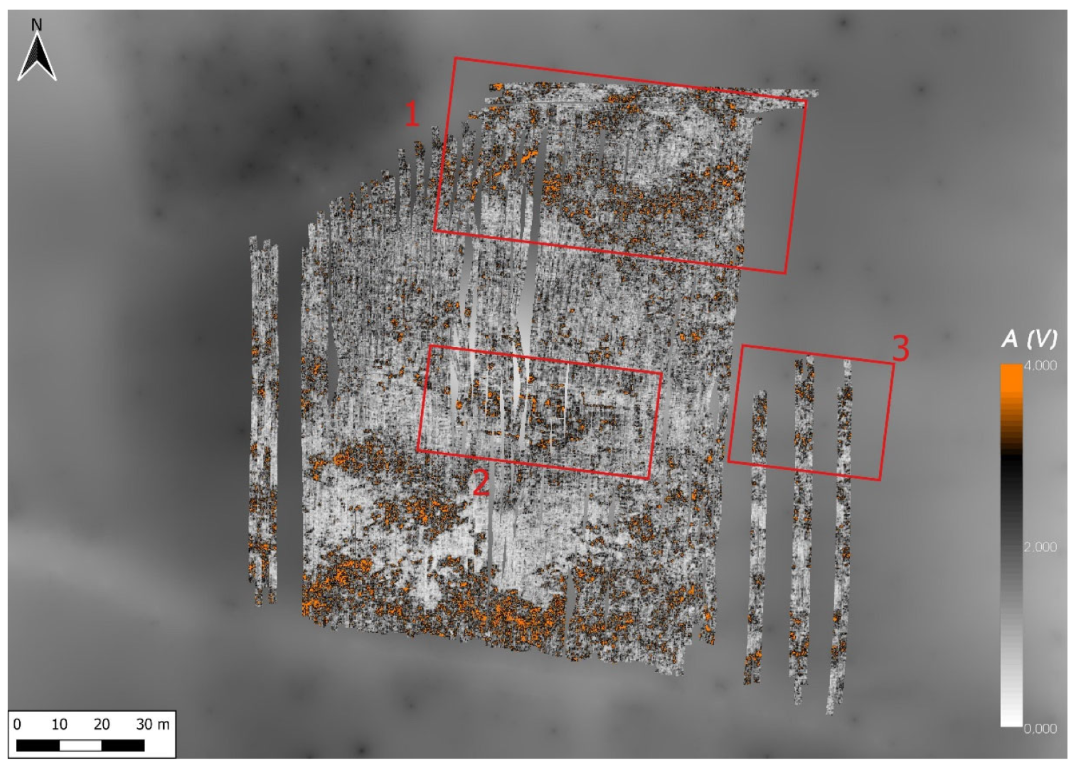
The results obtained from the implementation and processing of the five projects have been brought together on a single floor to provide an overview and thus facilitate their interpretation by researchers. Likewise, for security reasons, in order to avoid the possible despoiling of the area, it has been decided not to indicate the exact location of the exploration (
Figure 2). It will only be mentioned that the property is currently in private hands and that it is in the process of being acquired by the local administration for its protection and preservation.
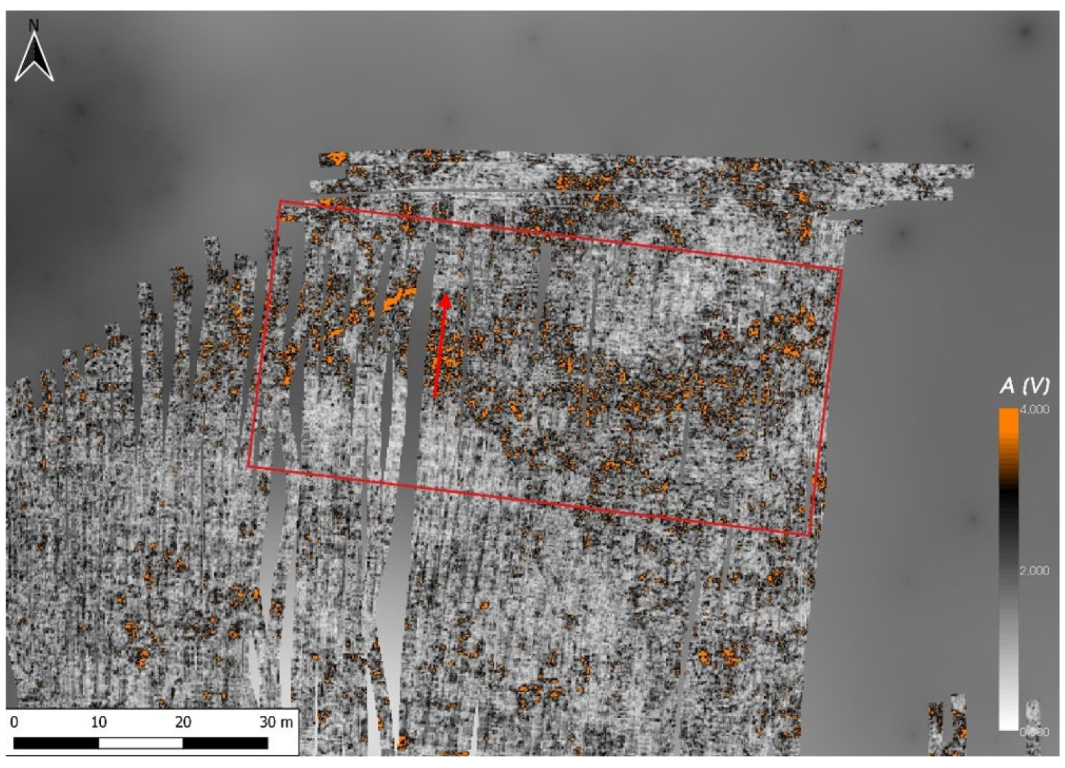
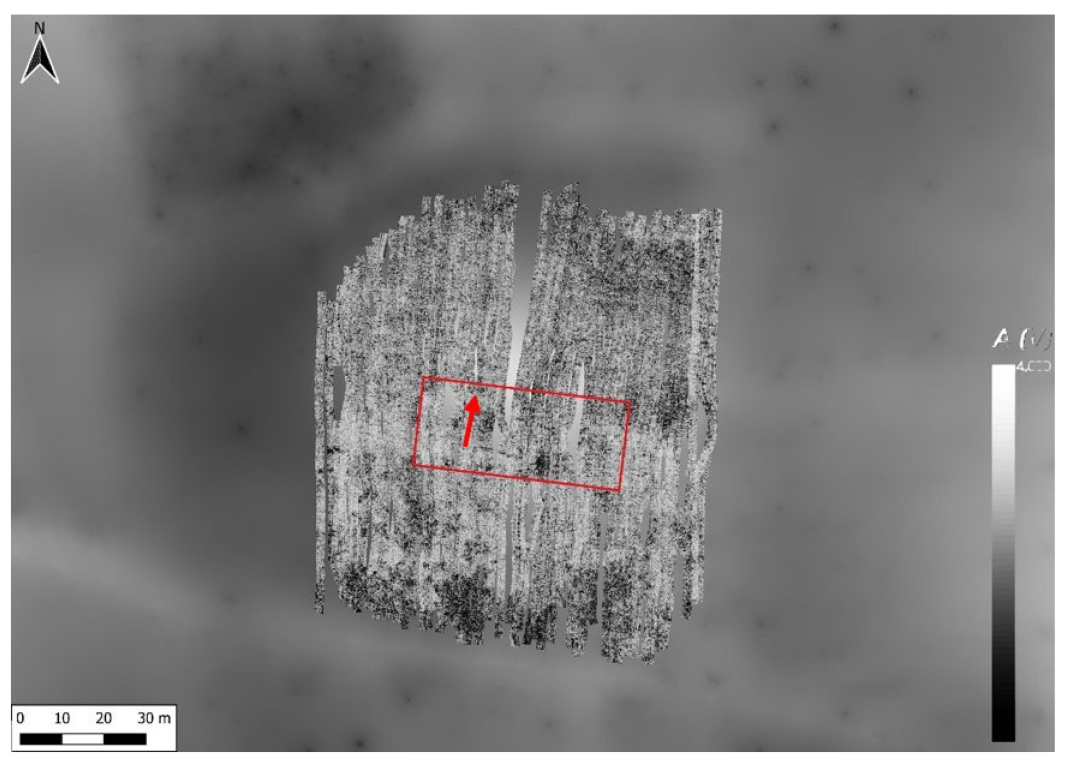
The areas of interest are marked in red, numbered and described from north to south. The northernmost set of anomalies in the exploration has a series of alterations that draw orthogonal shapes with a northwest–southeast orientation. The largest group of signals is concentrated to the right of the plot, as can be seen in
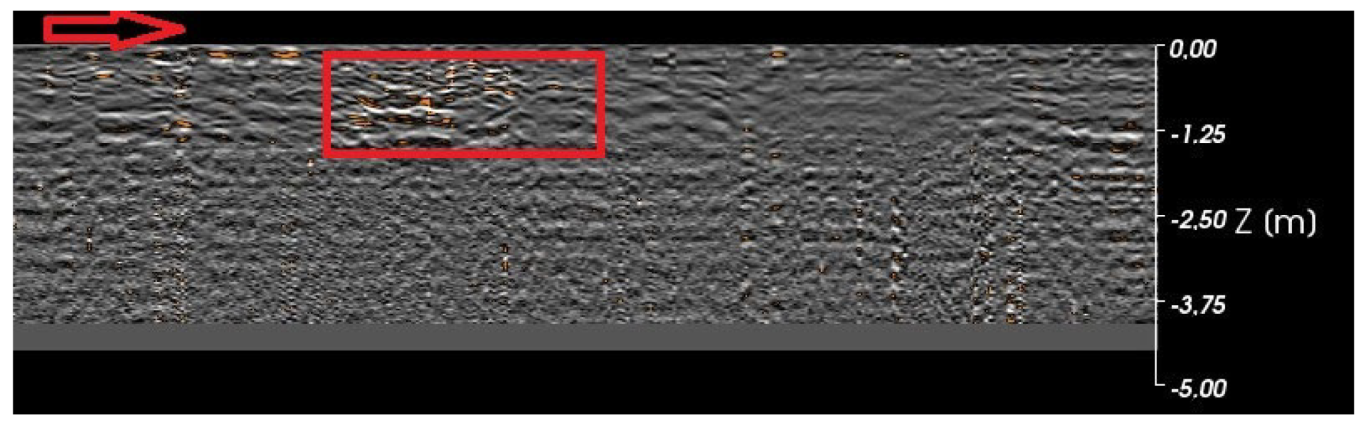
Figure 3, which seems to correspond with a rectangular structural group with dimensions of 30 m high and 15 m wide, with a northwest–southeast orientation. Within this complex, smaller structures can be discerned, possibly associated with separation elements such as cells or small individualised rooms. In the radargram view (
Figure 4), some of the alterations described in the plan can be observed. The recorded signal power reaches depths between −0.30 m and −1.25 m at depth.
Finally, to the left, there is an alignment approximately 20 m long, which may correspond to a walled system. After isolating a section of the anomaly in question, it can be seen that the imprint left by the signal on the radargram (
Figure 5) is, to say the least, remarkable. It becomes visible from depths of approximately −0.20 m down to −1.30 m. From then on, the signal seems to lose power.
The second area of interest,
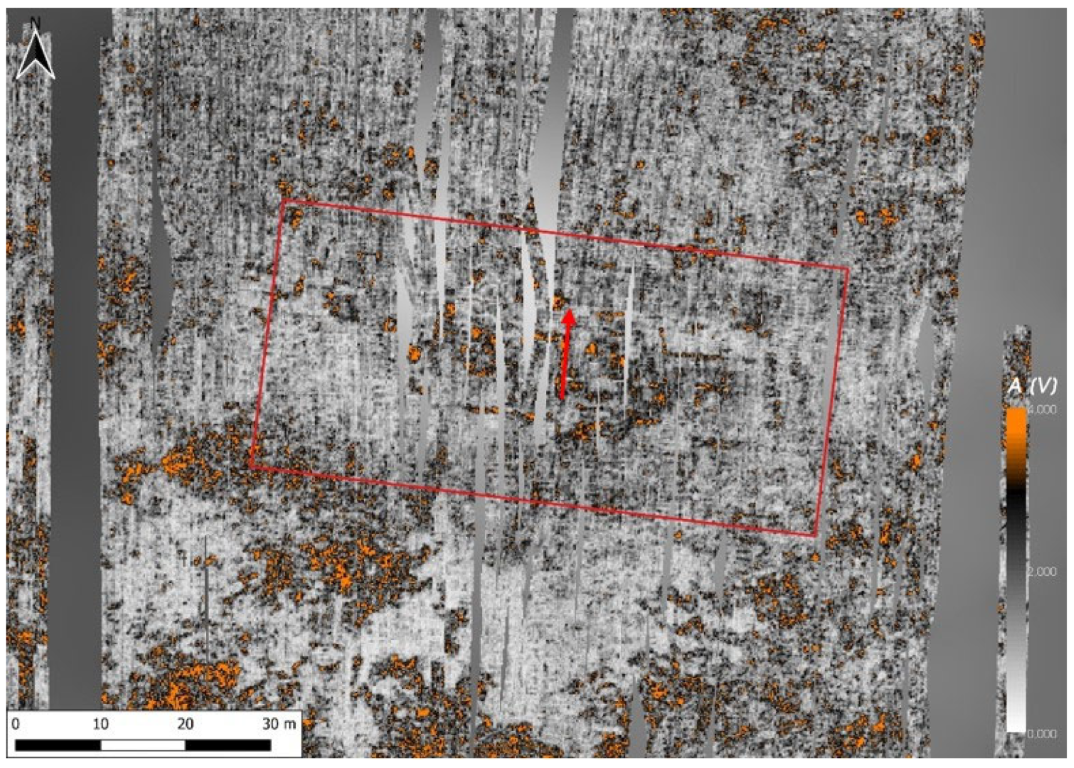
Figure 5, is located in the central area of the site. This area is clearer, probably due to the fact that it is in a better state of preservation in the subsoil than the rest of the site. In this area, a structural group of 30 per 15 m can be observed, with a northwest–southeast orientation. As in the first of the areas of interest, a group subdivided into small flats or cells can be seen with greater quality. Around this group, small quadrangular signs of between 3 and 5 m can be seen, some of them with different orientations to those of the central group, which may be due to a different date of construction or to conditions caused by the topography.
This central area coincides with the area in which, in 2016, the nine test pits were taken and in which several tombs, barrows and walls were found, there was an “area of ash dispersion”, which we can see as a “small anomaly” in
Figure 6, an object of a micro-prospection in 2021.
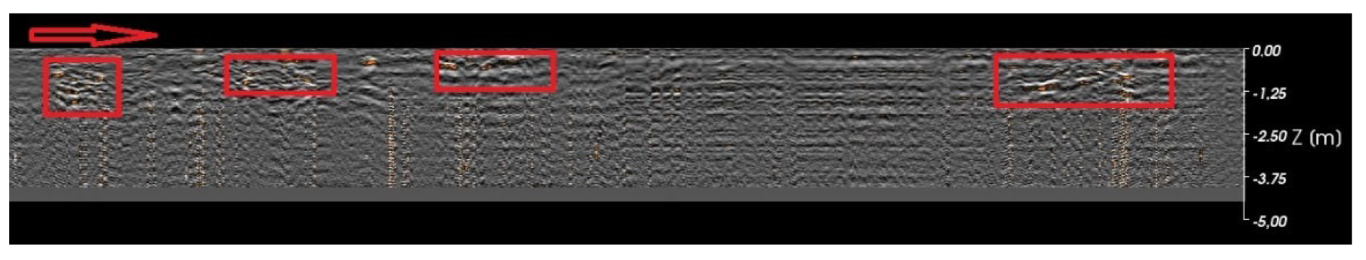
If we turn to the radargram view (
Figure 7), we can obtain a sectional image of a large part of the set of structures described above. In it, a series of anomalies with intensities located between the depths of −0.30 m and −1.25 m can be detected. In addition, a set of small signals can be seen, which are recorded from the depth of −1.20 m to the depth limit that can be reached by the georadar reading. These small signals could be identified with small elements of a metallic nature, which would not be out of place considering the nature of the deposit in question.
The third area of interest (
Figure 8) is located to the east of the central area described above. As it is a plot differentiated from the main one and with olive tree plantations, it was only possible to explore where the equipment could enter without difficulty. Although the data collected are not complete due to the conditions described above, small groups of anomalies of an archaeological nature can be observed, presenting a series of alignments of varying dimensions (between 3 and 7 m) with the same orientation as the structural groups seen so far. The results of the radargram (
Figure 9) show traces of alterations with an intensity in depth is similar to those already seen and described in the other projects. It is located next to the “finding area of the sculpture of El Toro”.
Finally, in the southern area, there are a series of anomalies with a strong signal intensity. However, after laboratory analysis, it has been determined that they correspond to geological elements consisting of accumulations of clays that are typical in the territory, which are used for agricultural use and are sometimes replaced by the owners of the plots in order to not lose soil fertility.
4.2. Results Obtained Using MK IV 3D Radar
The results obtained from the geophysical exploration with the MK IV 3D Radar georadar model show some notable differences when compared with the results obtained with the Stream X model.
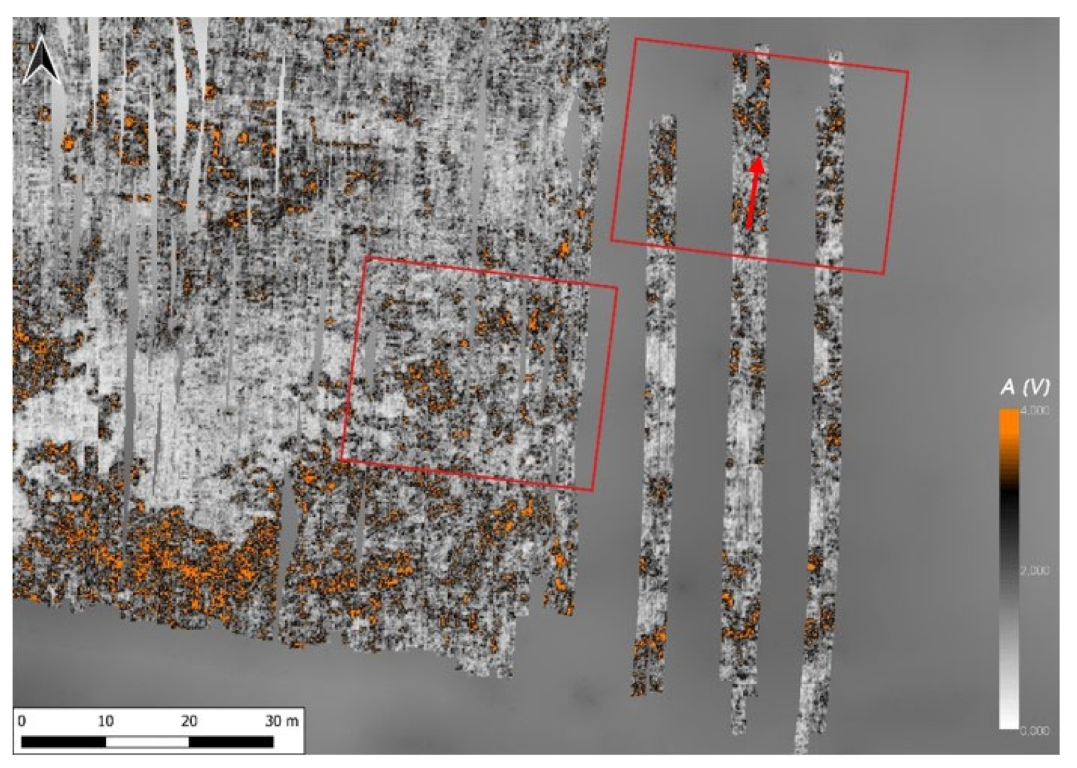
The following figure (
Figure 10) shows a single exploration project represented in a range of greys. This colour palette has proved to be the most informative when interpreting the data, as when a colour range is applied to it, the results tend to become dirty, which is not the case with the IDS results. In general terms, it is possible to distinguish, by means of the darker shades, the most prominent geophysical disturbances. In particular, it can be seen how, in the northern and southern extremes, this black tonality is intensified. This fact may correspond to the detection of the geological outcrops, which are found at a shallower depth in these areas. The central area of the plan is marked with a red box, in which a set of rectangular alterations of an archaeological nature oriented in a northwest–southeast direction can be glimpsed. This set of signs coincides with those already detected and analysed previously and which can be seen in
Figure 6.
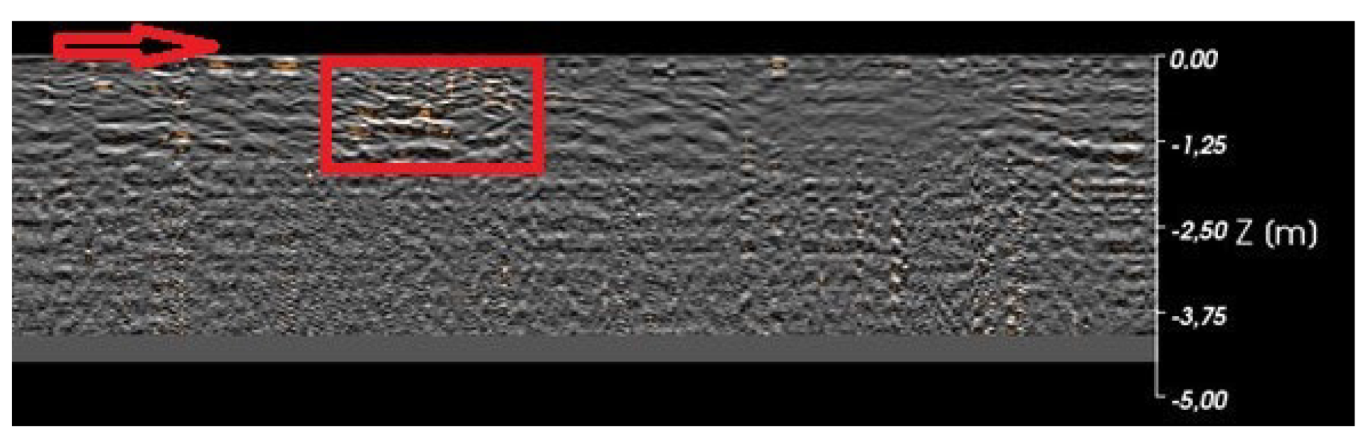
A visualisation of the radargram (
Figure 11) shows how the set of rectangular alterations is reproduced in the stratigraphic sequence. These clusters, distributed along the radargram, have a signal power that is located between the approximate depths of −0.25 and −1.1 m.
In addition to these signals, there are a series of alterations that may correspond to elements identifiable with the geological substrate. This fact may be due to the fact that the georadar model in question consists of highly sensitive equipment, which is highly influenced by the types of soil and the resistivity reflected in the data. Therefore, the results provided by this model must be taken into special consideration, paying special attention to the external conditions of the device, in this case, the levels of resistivity offered by the ground.
4.3. Results Obtained Using Magnetometer
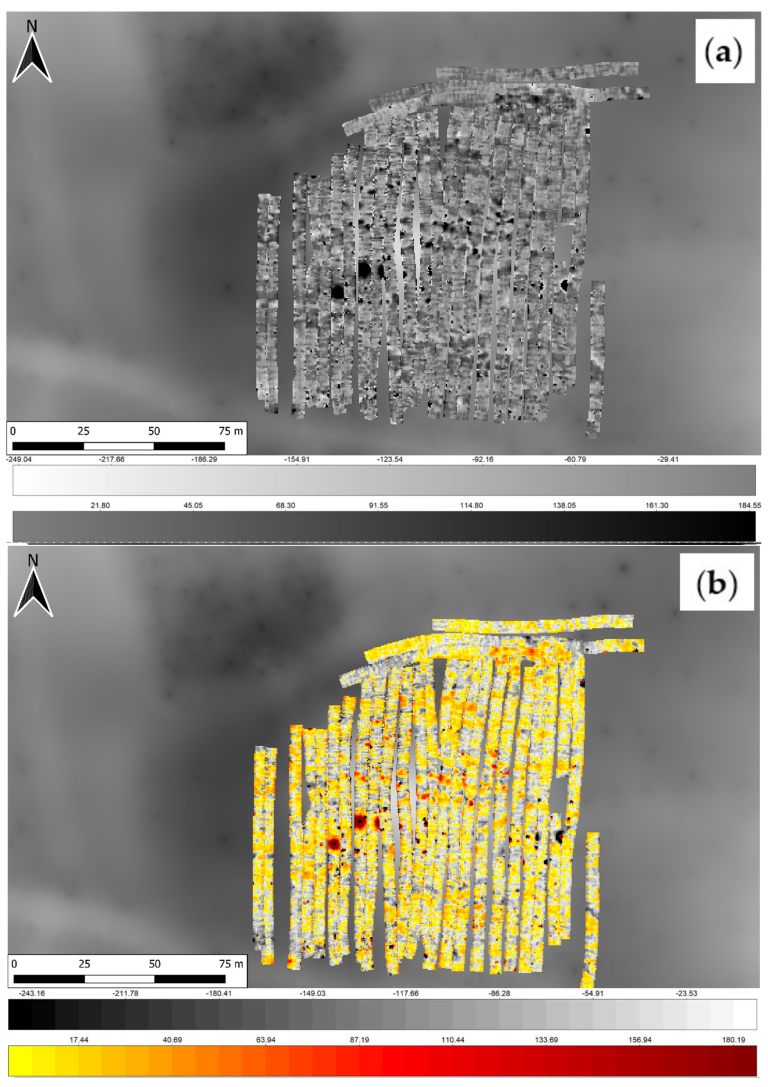
The results of the magnetometry carried out from the exploration with the MX V3 magnetometer are represented in a single project where the dipole anomalies can be appreciated as a whole. For better visualization and analysis, the magnetogram is presented in the following figure (
Figure 12) using a double colour palette, the first being a greyscale representation and the second a palette with shades from red to black, depending on its positive and negative value. This method has proved very useful in other archaeological sites explored with this equipment and methodology [
15].
In general terms, the most outstanding magnetic anomalies coincide in a location with geophysical alterations detected through the use of georadar (
Figure 6 and
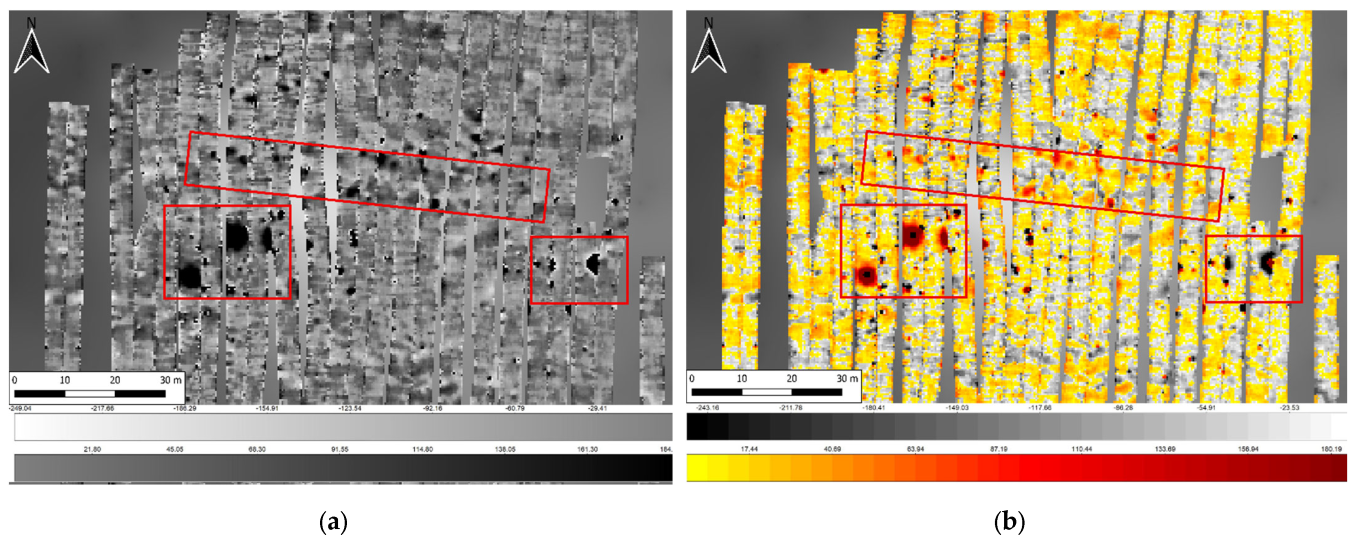
Figure 10). Specifically, a series of circular magnetic anomalies that appear in the central area of the exploration plot stand out among the others. In the
Figure 13, these alterations are located, which present positive dipole values of 65.3 nT/m and negative values around −362.5 nT/m.
This fact determines that the areas identified with these signs may also contain metallic elements, detected in the results offered by the Stream X georadar. Although this fact has been verified through the use of various equipment, such statements must be taken with caution, and it is considered necessary to compare these results with future perspectives or precise archaeological manifestations in the analysed area.
5. Discussion
After its discovery, the necropolis of El Toro was investigated using a traditional non-georeferenced methodology: surface prospecting and excavation. Subsequently, a non-invasive georeferenced methodology has been chosen that uses two geophysical techniques: GPR and magnetometer. The aim is not so much to use each of these techniques individually, but rather to use them together. Hence, the areas studied can be coupled as overlapping layers.
This procedure has improved the processes of understanding and interpretation, adding a number of improvements to the methodology used by more traditional archaeology. In the following paragraphs, a series of observations on these improvements are presented, as well as some considerations to take into account when carrying out geophysical surveys in this type of archaeological site.
At first, the methodological difference between magnetic and ground radar surveying is very clear. We have been able to observe different graphical expressions between the two. However, they are complementary. In the same way, we thought it would be interesting to use two different types of radar: the pulse radar (Stream X) and the stepped frequency radar (3D Radar). Our work confirms Leckebusch’s observations on the poor depth penetration of the step-frequency system in contrast to the pulse system [
16].
The detection result is influenced by ground conditions, electronic interference and the uneven balance of antenna signals that hinder data processing [
16].
An aspect of major interest for non-invasive research is the contrast with the archaeological reality provided by the excavated features and structures, in this case in 2017 (
Figure 14). From a strictly comparative point of view, it is observed that both the magnetogram and the stepped frequency radargram (SFCW) go less deep and provide a less defined image of the subsoil, showing similar trends in the orientations of the recorded anomalies.
However, the pulse GPR provides radargrams with more in-depth information and richer detail, to the extent that structures in the excavated boreholes can be discerned, and structures can be predicted to the north and east of the scanned area, as well as in the ash dispersal zone. This is especially relevant in Test Pit 4 (
Figure 14c), where the highest degree of fit between the alterations provided by the georadar and the archaeological remains recorded is observed.
Additionally, although this methodology has very positive results, it is true that it has some limitations in this respect. The first of these is due to the constraints offered by some surfaces. It is known that each type of structure has its own geophysical properties; each type of structure has a very wide range of properties. Moreover, in addition to this factor, buried remains are not detected in isolation, but by their contrast with the geology that is present in the ground [
17].
In this case, the electromagnetic properties of the soil have meant that the readings are not as clear as they should be (its geological composition has made it difficult to take data). This has been particularly noticeable in the results obtained with the Kontur multi-channel georadar, whose data have not been sufficiently clear to establish a clear interpretation of the deposit. On the other hand, the Stream X model georadar did provide a little more clarity, but with numerous layers of magnetic noise that have detracted from the final product.
This type of problem does not seem to occur at sites where the terrain has remained intact in the face of agricultural exploitation. The application of geophysics on flat, undisturbed land has given better results, a comparative case being, for example, the archaeological sites of
Italica [
18] in the south of the Iberian Peninsula and
Falerii Novi [
19] in the Lazio region of Italy, where the planimetry of the buildings can be analysed without problems.
Another difficulty that has been encountered relates to the handling of the surface. Over time, the site has suffered the continuous impact of ploughing machines which have eroded and damaged the structures located on the surface. In addition to this damage, the site has been plundered since the first publications of notable finds, leaving a geomagnetic footprint which has sometimes led to errors in interpretation.
6. Conclusions
The application of geophysics based on the use of georadar and magnetic prospecting equipment in the field of archaeology has meant a great advance in archaeological methodology. Thanks to these applications, researchers have moulded a transdisciplinary methodology that enriches the spatial and conceptual conception of archaeological sites where traditional archaeology can no longer work. This way of proceeding, very present in so-called “non-invasive archaeology” [
20], presents high levels of synergy, an aspect that makes it very valid when it comes to being able to carry it out and maintain a harmonious relationship between researchers, the owners of the explored plots and local and provincial administrations.
These facilities have a series of characteristics that make them very conducive to archaeological research. However, due to their particularities, special attention must be paid to certain external conditioning factors, such as, for example, the aforementioned resistivity conditions of the soil in which the survey is to be carried out. Another important factor to take into account is the degree of protection of the sites. In certain cases, such as the study of the Iberian Necropolis of El Toro, we have come across numerous attempts at despoilment and material damage, and the site is currently awaiting protection, which is why it has been decided not to indicate any geospatial reference in this article, as it is in serious danger of destruction.
For this and other reasons, the procedure when carrying out work on such sites must be meticulous and conscientious, in order to avoid possible errors in carrying out the analytical processes of an archaeological nature. Only in this way will it be possible to give a historical sense to the site, thus facilitating its correct study and protection.
Author Contributions
Conceptualization, F.J.C.G., L.B.d.L.E. and J.A.R.G.; methodology, F.J.C.G., L.B.d.L.E. and J.A.R.G.; software, F.J.C.G. and J.A.R.G.; validation, F.J.C.G., L.B.d.L.E., J.A.R.G., J.A.R.G. and I.R.S.; formal analysis, F.J.C.G., L.B.d.L.E., J.A.R.G. and I.R.S.; research, F.J.C.G., L.B.d.L.E., J.A.R.G. and I.R.S.; resources, F.J.C.G., L.B.d.L.E., J.A.R.G. and I.R.S.; data preservation, F.J.C.G.; original drafting-drafting, F.J.C.G., L.B.d.L.E., J.A.R.G. and I.R.S.; drafting—revising and editing, F.J.C.G., L.B.d.L.E., J.A.R.G. and I.R.S.; viewing, F.J.C.G., L.B.d.L.E., J.A.R.G. and I.R.S.; supervision, F.J.C.G., L.B.d.L.E., J.A.R.G. and I.R.S.; project administration, L.B.d.L.E.; fund raising, L.B.d.L.E. All authors have read and agreed to the published version of the manuscript.
Funding
This research was funded (12.690€) by the private company E2IN2 and the Autonomous University of Madrid, grant number 465.035 (file 2020/0527).
Data Availability Statement
The data on which this research is based are privately sourced. They have been produced with material purchased by the University of Cadiz and with software licensed by the university administration. The geomorphological data have been consulted in the public data of the National Geographic Institute and the Geological and Mining Institute of Spain.
Acknowledgments
The research was authorized by the regional government of Castilla La Mancha.
Conflicts of Interest
The authors declare no conflict of interest. The funders had no role in the design of the study; in the collection, analyses, or interpretation of data; in the writing of the manuscript; or in the decision to publish the results.
References
- Mata, R.; Panadero, M.; Pillett, F.; Sancho, J.; Tapiador, F.J.; Del Pozo, C. Atlas de los Paisajes de Castilla La Mancha; Universidad de Castilla La Mancha: Ciudad Real, Spain, 2011. [Google Scholar]
- Benítez de Lugo Enrich, L.; Poveda, A.M.; Urbina, D.; Urquijo, C. La Tumba 1 de la necrópolis del oppidum Cerro de las Cabezas (Valdepeñas, Ciudad Real): Nuevo ejemplo del uso de sigillata aretina en rituales funerarios oretanos. Saguntum 2016, 48, 89–101. [Google Scholar]
- Urbina, D.; Urquijo, C.; Benítez de Lugo Enrich, L. La romanización a través de las necrópolis de incineración en el entorno de Daimiel. Contextos arqueológicos e inferencias culturales dentro del Área Manchega a partir de Los Toriles-Casas Altas (Villarrubia de los Ojos), Laminium (Alhambra) y Cerro de las Cabezas (Valdepeñas). In III Jornadas de Historia de Daimiel; Museo Comarcal de Daimiel: Daimiel, Spain, 2015; pp. 45–59. [Google Scholar]
- Mena, P.; Ruiz, A. Una nueva muestra de escultura ibérica en la Provincia de Ciudad Real: El toro de Alcubillas. Oretum 1985, 1, 251–256. [Google Scholar]
- Hevia Gómez, L.; Esteban Borrajo, L. Protohistoria y Antigüedad en la Provincia de Ciudad Real (800 a.C.–500 d.C); C&G: Ciudad Real, Spain, 2004. [Google Scholar]
- Fuentes Sánchez, J.L.; Benítez de Lugo Enrich, L. Representaciones del poder en ámbitos funerarios de Oretania Septentrional. In Proceedings of the Congreso Internacional ‘El Reflejo del Poder en la Muerte ‘La Cámara Sepulcral de Toya (1918–2018)’, Jaén, Spain, 7–9 June 2022; pp. 443–467. [Google Scholar]
- Caballero, A. Neolítico y Edad de los Metales. In Ciudad Real y su Provincia II; Géver: Sevilla, Spain, 1996; pp. 17–60. [Google Scholar]
- Fuentes Sánchez, J.L.; Benítez de Lugo Enrich, L. Crátera de campana ática de figuras rojas de la necrópolis oretana del Toro (Alcubillas, Ciudad Real). In Abantos. Homenaje a Paloma Cabrera; Ministerio de Cultura y Deporte: Madrid, Spain, 2021; pp. 99–110. [Google Scholar]
- Brunet, T.C. La destrucción de la escultura funeraria ibérica. Trab. Prehist. 1993, 50, 185–195. [Google Scholar] [CrossRef][Green Version]
- Clark, A. Seeing Beneath the Soil. Prospecting Methods in Archaeology; Batsford: London, UK, 1990. [Google Scholar]
- Boschi, F. Introduzione alla geofisica per l’archeologia. Groma 2009, 2, 291–315. [Google Scholar]
- Gustavsen, L.; Stamnes, A.; Fretheim, S.; Gjerpe, L.; Nau, E. The Effectiveness of Large-Scale, High-Resolution Ground-Penetrating Radar Surveys and Trial Trenching for Archaeological Site Evaluations—A Comparative Study from Two Sites in Norway. Remote Sens. 2020, 12, 1408. [Google Scholar] [CrossRef]
- Persico, R.; Sato, M. Ground Penetrating RadarTechniques and Data Processing Issues for Applications in the Field of Cultural Heritage. In Sensing the Past. From Artifact to Historical Site; Masini, N., Soldovieri, F., Eds.; Springer: Berlin/Heidelberg, Germany, 2017; pp. 175–202. [Google Scholar]
- Aspinall, A.; Gaffney, C.; Schmidt, A. Magnetometry for Archaeologists; AltaMira Press: Lanham, MD, USA, 2009. [Google Scholar]
- Ruiz Gil, J.A.; Catalán González, F.J.; Lagóstena Barrios, L.G. La aplicación de la magnetometría sobre el yacimiento y el procesamiento de sus datos. In Torregarcía, Purpura y Agua: Historia y Arqueología de una Officina Purpuraria en el Litoral Almeriense (España); Lagóstena Barrios, L.G., López, J.J., Eds.; Almería, Spain, 2022. (in press)
- Leckebusch, J. Comparison of a stepped-frequency continuous wave and a pulsed GPR system. Archaeol. Prospect. 2011, 18, 15–25. [Google Scholar] [CrossRef]
- Carreras, C.; Jordan, D. El uso complementario de la resistividad y la prospección magnética en arqueología. Caesaraugusta 1997, 73, 361–368. [Google Scholar]
- Rodríguez, J.M.; Keay, S.J.; Jordan, D.; Creighton, J.; Rodá, I. La Itálica de Adriano. Resultados de las prospecciones arqueológicas de 1991 y 1993. Arch. Esp. Arqueol. 1999, 72, 73–97. [Google Scholar] [CrossRef]
- Verdonck, L.; Launaro, A.; Vermeulen, F.; Millett, M. Ground-penetrating radar survey at Falerii Novi: A new approach to the study of Roman cities. Antiquity 2020, 94, 705–723. [Google Scholar] [CrossRef]
- Corsi, C.; Slapsak, B.; Vermeulen, F. Good practice in archaeological diagnostics. In Non-Invasive Survey of Complex Archaeological Sites; Springer: Berlin/Heidelberg, Germany, 2013. [Google Scholar]
Figure 1.
Location of the study area. (A) Satellite image from the National Aerial Orthophotography Plan (PNOA) corresponding to the area. (B) Representation with the same scale where the geomorphological units that make up the landscape are represented: Source: Instituto Geológico y Minero de España (IGME).
Figure 2.
General plan of the projects elaborated with the Stream X georadar at a depth of −0.5 m below the surface. The white-orange colour scale indicates the resistivity of the signals. The areas with the highest accumulation of archaeological anomalies are marked in red.
Figure 2.
General plan of the projects elaborated with the Stream X georadar at a depth of −0.5 m below the surface. The white-orange colour scale indicates the resistivity of the signals. The areas with the highest accumulation of archaeological anomalies are marked in red.
Figure 3.
Detail of the northern Area 1. On the right, (red square) the set of alterations consisting of the rectangular structure with its subdivisions. On the left, the sign where the alignment is interpreted, possibly a wall delimiting the area. The red arrow indicates the area chosen for the radargram analysis (
Figure 4).
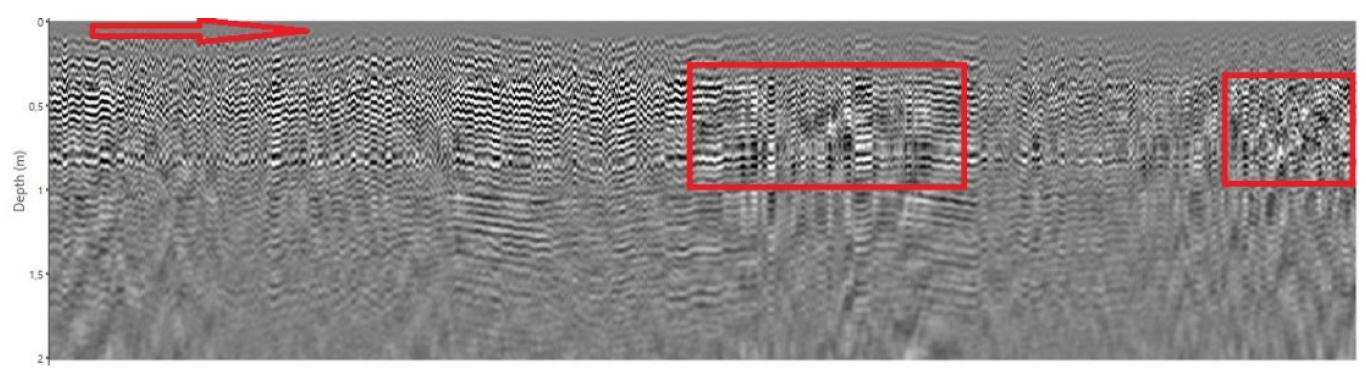
Figure 4.
Radargram image. The red arrow indicates the direction of the pass and the red rectangle shows the alterations detected to the northeast of the archaeological site.
Figure 4.
Radargram image. The red arrow indicates the direction of the pass and the red rectangle shows the alterations detected to the northeast of the archaeological site.
Figure 5.
Radargram image. Section describing the alteration corresponding to the linear signal located to the northwest of the archaeological site.
Figure 5.
Radargram image. Section describing the alteration corresponding to the linear signal located to the northwest of the archaeological site.
Figure 6.
Detail of the central area (Area 2) at −0.5 m depth. Above, a small quadrangular anomaly. Below, the large rectangular structure with its compartmentalised zones. The red arrow indicates the area chosen for the radargram analysis (
Figure 7).
Figure 6.
Detail of the central area (Area 2) at −0.5 m depth. Above, a small quadrangular anomaly. Below, the large rectangular structure with its compartmentalised zones. The red arrow indicates the area chosen for the radargram analysis (
Figure 7).
Figure 7.
Radargram image. The image shows the geophysical alterations corresponding to the archaeological features described in the previous figure. Some of the signals that may correspond to small metallic echoes.
Figure 7.
Radargram image. The image shows the geophysical alterations corresponding to the archaeological features described in the previous figure. Some of the signals that may correspond to small metallic echoes.
Figure 8.
Detail of the east side (Area 3) at 0.5 m depth. Above, a small quadrangular anomaly. Below, the large rectangular structure with its compartmentalised zones. The red arrow indicates the area chosen for the radargram analysis (
Figure 9).
Figure 8.
Detail of the east side (Area 3) at 0.5 m depth. Above, a small quadrangular anomaly. Below, the large rectangular structure with its compartmentalised zones. The red arrow indicates the area chosen for the radargram analysis (
Figure 9).
Figure 9.
Alterations detected on the radargram.
Figure 9.
Alterations detected on the radargram.
Figure 10.
Plan obtained from the processing of data from the MK IV 3D georadar scanner at the same depth as IDS GPR (−0.5 m). The black–white scale indicates the resistivity of the localised signals. The red box indicates the highest concentration of disturbance.
Figure 10.
Plan obtained from the processing of data from the MK IV 3D georadar scanner at the same depth as IDS GPR (−0.5 m). The black–white scale indicates the resistivity of the localised signals. The red box indicates the highest concentration of disturbance.
Figure 11.
Radargram corresponding to the project, elaborated with the MK IV 3D Radar georadar model, processed with the Kontur software of the same brand. A route can be seen in which the archaeological anomalies are arranged between approximate depths of one metre.
Figure 11.
Radargram corresponding to the project, elaborated with the MK IV 3D Radar georadar model, processed with the Kontur software of the same brand. A route can be seen in which the archaeological anomalies are arranged between approximate depths of one metre.
Figure 12.
Results of the magnetic exploration carried out in the area of the El Toro necropolis. (a) Magnetogram with a grey scale representation; (b) Same magnetogram represented with a colouring scale ranging from red to black, depending on the positive/negative (+/−) values of the anomalies detected, represented between −245 and +190 nT/m.
Figure 13.
Details of the central zone of the reservoir, where the circular anomalies can be visualized. (a) Anomalies in grey scale; (b) Anomalies with red and black scale.
Figure 13.
Details of the central zone of the reservoir, where the circular anomalies can be visualized. (a) Anomalies in grey scale; (b) Anomalies with red and black scale.
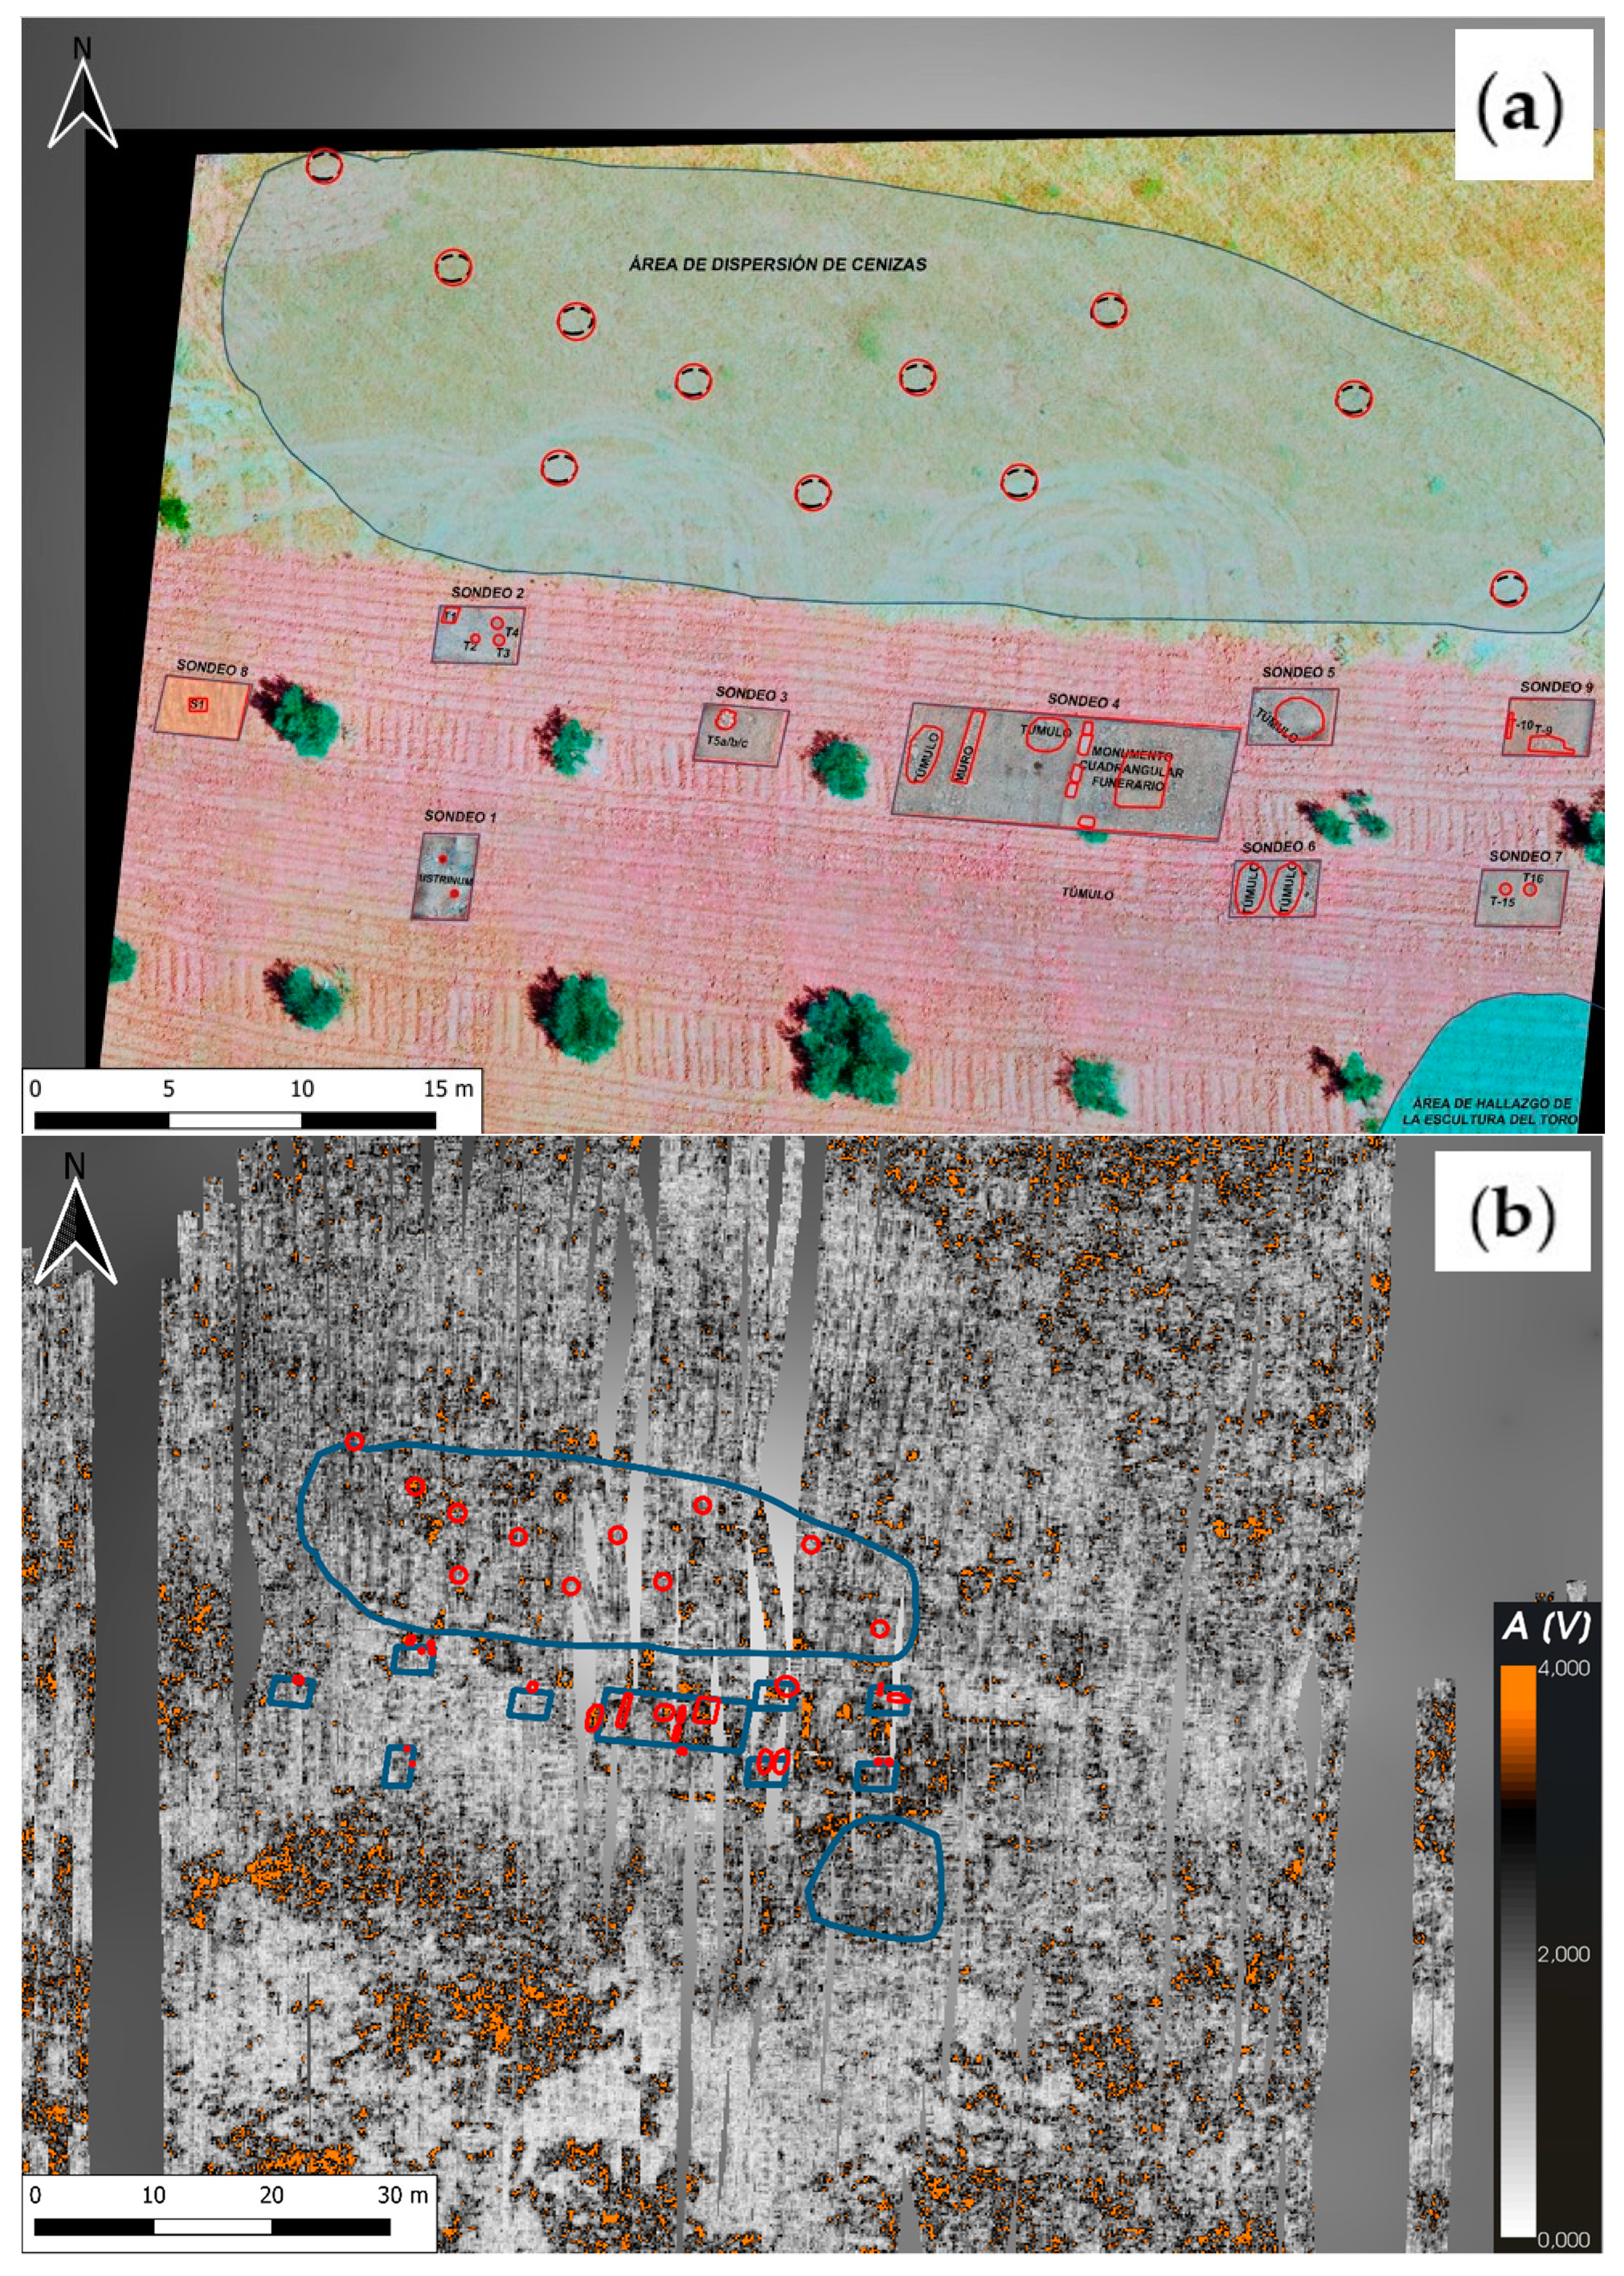
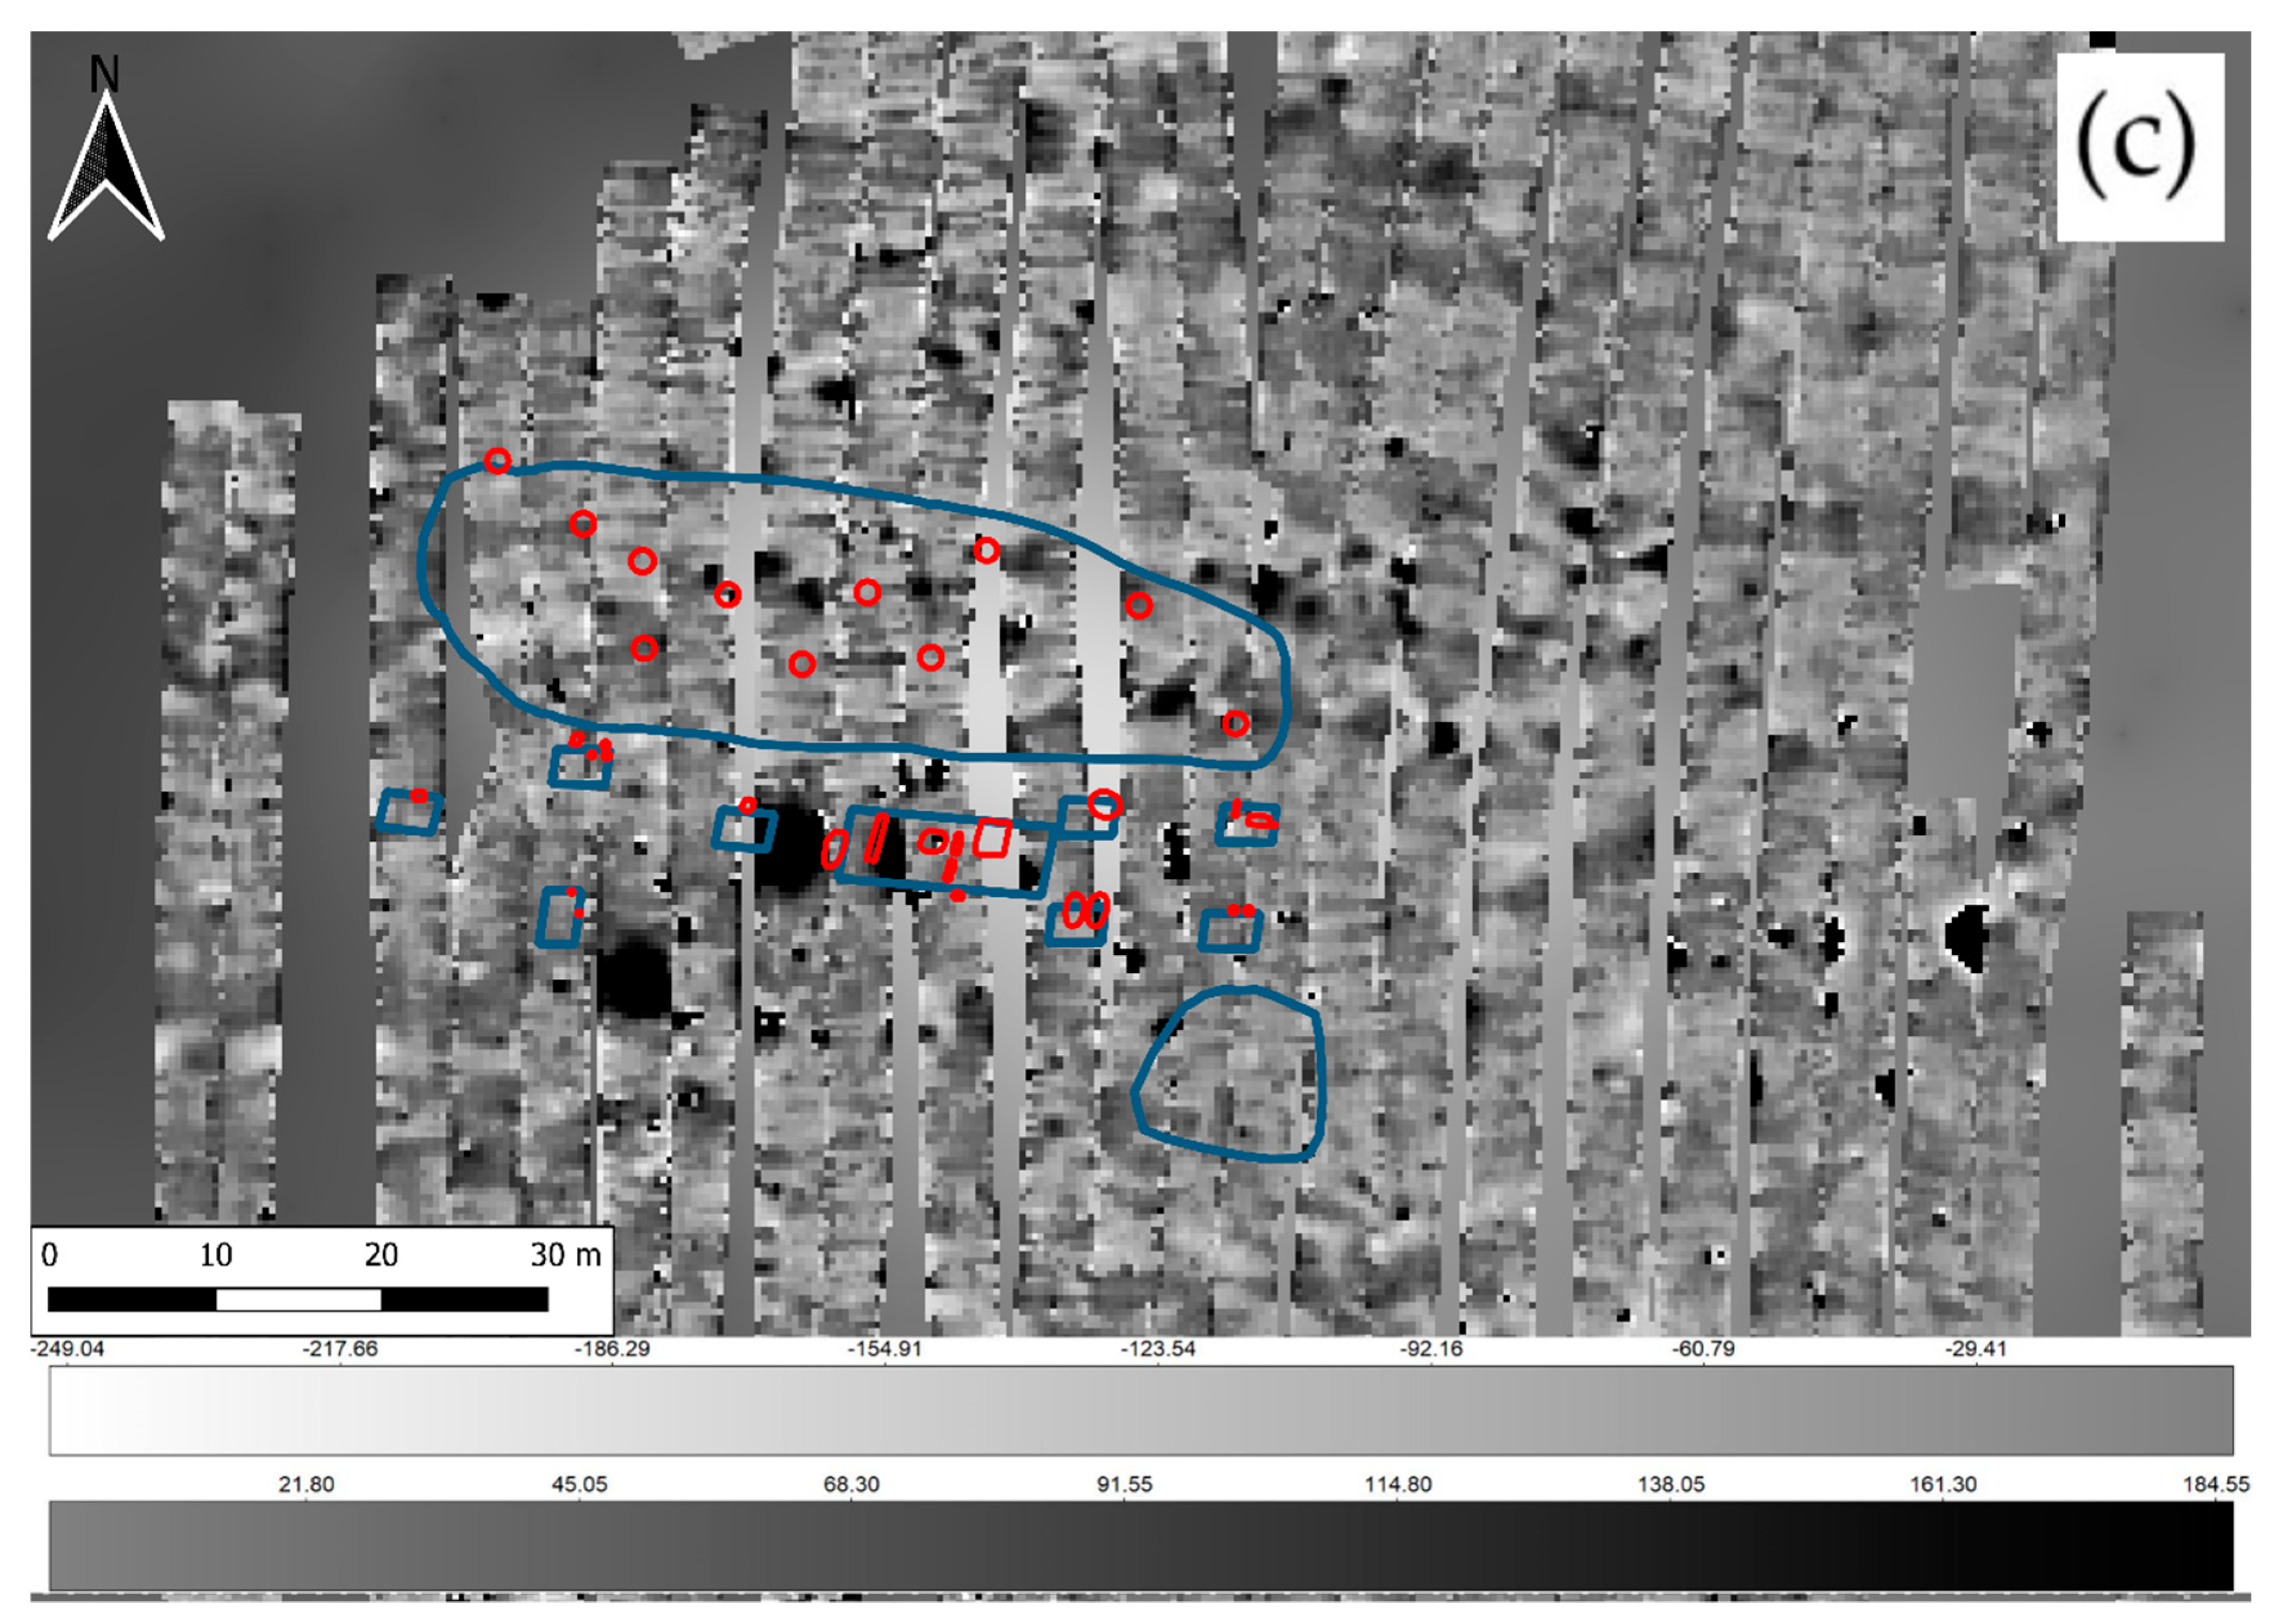
Figure 14.
Comparison between archaeological and geophysical results. (a) Georeferencing of the archaeological surveys and reproduction of the results in shape format (Source: Fuentes Sánchez and Benítez de Lugo Enrich, 2021); (b) Comparison between the archaeological surveys and the results of the Stream X georadar. It can be seen how the geophysical anomalies coincide with the excavated mural assemblages; (c) Comparison with the magnetic results. Coincidences between both results can be observed.
Table 1.
Total area in m2 completed by each geophysical tool used for this archaeological sample.
Table 1.
Total area in m2 completed by each geophysical tool used for this archaeological sample.
| Geophysical Survey | Exploited m2 Areas |
|---|
| Stream X Survey | 12,970 |
| MK IV Survey | 10,607 |
| MX V3 Survey | 13,639 |
| Publisher’s Note: MDPI stays neutral with regard to jurisdictional claims in published maps and institutional affiliations. |
© 2022 by the authors. Licensee MDPI, Basel, Switzerland. This article is an open access article distributed under the terms and conditions of the Creative Commons Attribution (CC BY) license (https://creativecommons.org/licenses/by/4.0/).


 ,
, 


