Article

Impact of Farmland Change on Vegetation NPP in the One River and Two Streams Region of Tibet

1
Key Laboratory of Land Surface Pattern and Simulation, Institute of Geographic Sciences and Natural Resources Research, CAS, Beijing 100101, China
2
University of Chinese Academy of Sciences, Beijing 100049, China
*
Authors to whom correspondence should be addressed.
Land 2022, 11(12), 2223; https://doi.org/10.3390/land11122223
Submission received: 22 October 2022 / Revised: 3 December 2022 / Accepted: 5 December 2022 / Published: 7 December 2022
(This article belongs to the Special Issue Agricultural Land Use and Food Security)

Abstract

:
Studies on the impacts of a particular land use type change are relatively rare, especially in the Tibetan Plateau region (TP). This study focused on the impacts of farmland use change on grain supply and ecosystem stability in the Yarlung Zangbo river and its two tributaries (also known as One River and Two Streams, ORTS), using net primary productivity (NPP), known as the total amount of organic matter left after removal of carbon absorbed from the atmosphere by vegetation through photosynthesis, as a common proxy for farmland productivity and ecosystem stability. The trend analysis method was applied to measure the inter-annual change of NPP, and an ecological impact index was constructed to quantify the impact of farmland use change on the NPP change in the ORTS region. The results showed that: (1) The total area of farmland decreased by 6.09% from 2000 to 2018. Built-up land occupation and ecological restoration were the main reasons for the decrease of farmland area, while there was also new reclaimed farmland, transferred from ecological land. (2) The NPP in the ORTS region was roughly on an increasing trend, while the trends of NPP in different farmland change areas were not the same. Specifically, the NPP of ecological restoration, newly reclaimed farmland, and unchanged farmland areas all showed a significant increasing trend, while the NPP in the area of farmland occupied by built-up land showed a significant decreasing trend. (3) The impact of farmland changes from 2000 to 2018 contributed 1.22% to the increase of NPP in the ORTS region. This study not only provides a research paradigm in quantifying the production and ecological impacts of a particular land use type change that can be applied in related studies in other regions, but at the same time, the results of the empirical analysis in the ORTS region can also provide suggestions for the rational use and conservation of farmland and the stability and sustainable development of ecosystems for the region and even the TP.

1. Introduction

In the context of climate change, human activities are also exerting extensive and far-reaching impacts on global ecosystems, especially in the ecologically fragile areas. The Tibetan Plateau (TP) is a typically ecologically fragile area, which is known as the “roof of the world”, the “third pole of the earth”, the “water tower of Asia”, and an important ecological security barrier area in China [1,2,3]. In recent years, the productivity and stability of the ecosystems in the TP are being affected by increasing human activities. Among them, land use is the most typical representation of human activities acting on the ecological environment of the TP [4]. The magnitude of farmland change on the TP is increasing, and is more pronounced in areas such as the Yarlung Zangbo river and its two tributaries (also known as One River and Two Streams, ORTS) region of Tibet and the eastern valleys.
The ORTS region is one of the areas with a strong influence of human activities, and is also one of the most important farmland concentrated distribution areas in the TP [5,6]. With the implementation of the concept of ecological civilization construction and the acceleration of urbanization, the use of farmland in this region has been changed. On the one hand, the implementation of “Tibet Ecological Safety Barrier Protection and Construction Plan (2008–2030)”, issued by the State Council in 2009, the afforestation project of “Two Rivers and Four Rivers” in 2014, and the construction of many other nature reserves have all affected the use of farmland in the ORTS region [7]. On the other hand, as a state-level urban agglomeration with priority development and key construction in Tibet and a typical economic circle in western China [8,9], rapid economic development and urbanization have led to drastic changes in land use pattern, and a large amount of farmland has been converted to construction land. At the same time, with the increasing agricultural inputs and the increasing level of agricultural mechanization and modernization, the intensity of farmland use in ORTS region is also changing rapidly, which will inevitably affect the food supply and the sustainable development of the ecosystem in this region and even the TP [10]. In this context, it is an important scientific problem to clarify the farmland change and its influence on grain supply and ecosystem stability in the ORTS region.
In this study, net primary productivity (NPP) was selected as a common proxy for farmland productivity and ecosystem stability. NPP refers to the total amount of organic matter left by removing the carbon absorbed by vegetation from the atmosphere through photosynthesis per unit time, which is a direct reflection of the productivity of farmland and an important index for evaluating the productivity of ecosystem and its structural and functional stability [11,12,13]. NPP has a sensitive response to the land use change [14]. Land use change can affect the structure and distribution of the ecosystem, cause changes in surface vegetation and soil physical and chemical properties, and then lead to significant differences in NPP [15,16]. Previous studies on NPP by domestic and foreign scholars mainly focused on the spatial and temporal evolution patterns of NPP and their driving mechanism at different scales [17,18], as well as the impact of land use change on NPP in rapid economic development areas or major grain producing areas [19,20,21,22,23,24,25,26]. Most of these studies discuss the impact of multiple land use types on NPP, while few studies analyzed the impact of a particular land use type change in farmland on NPP [27,28,29].
Considering the above, this paper first analyzed the trend of farmland use and NPP change in the ORTS region from 2000 to 2018. On this basis, an ecological impact index was constructed to quantitatively assess the impact of farmland change on NPP. The aim of this study is to fully understand the changes of farmland and ecosystem in the ORTS region, and also to provide suggestions for promoting sustainable agricultural and ecological development, not only in the ORTS region, but also in the entire TP.

2. Materials and Methods
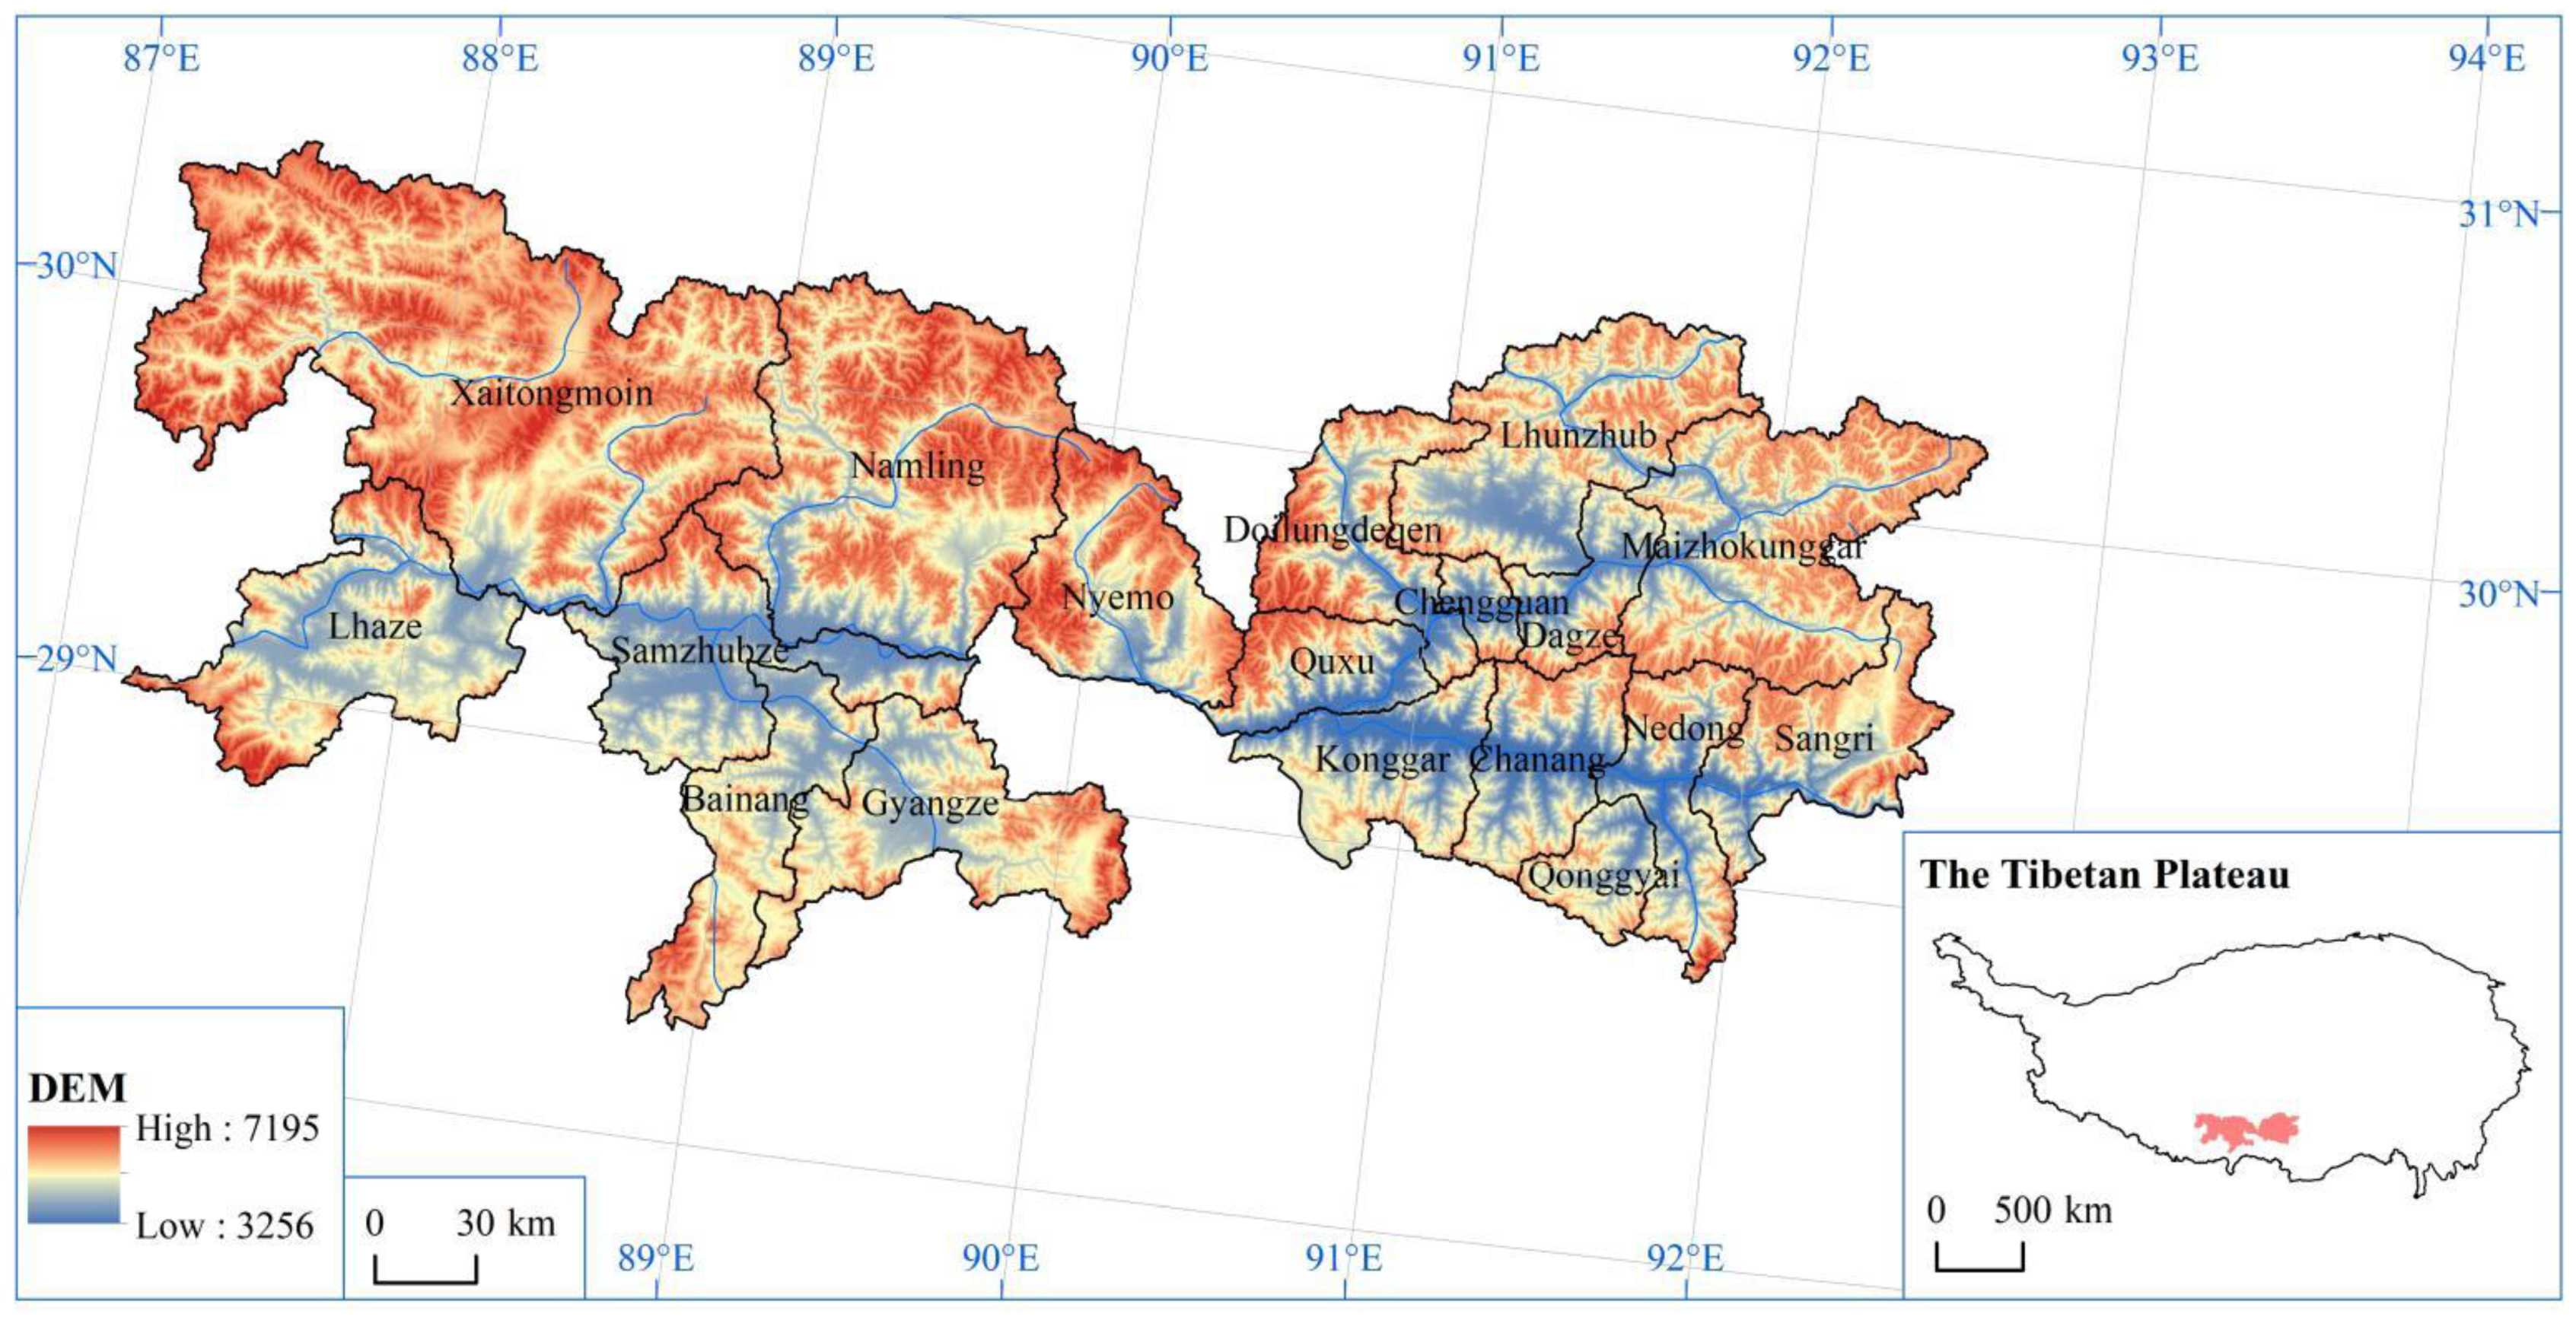
2.1. The Study Area

The ORTS region, with the geographical coordinates of 28°20′~30°20′ N, 87°00′~92°35′ E, refers to the middle reaches of the Yarlung Zangbo River and its main tributaries, the Lhasa River and Nianchu River in the Tibet Autonomous Region (Figure 1). It is located in the central and southern part of the TP [30], including 18 counties in Lhasa (Chengguan, Doilungdeqen, Dagze, Maizhokunggar, Lhunzhub, Nyemo, Quxu), Xigaze (Lhaze, Samzhubze, Namling, Xaitongmoin, Gyangze, Bainang), and Lhoka (Nedong, Chanang, Konggar, Sangri, Qonggyai). The total area of the ORTS region is about 66,700 km2, accounting for 5.48% of the area of Tibet [6]; the farmland area is about 1010 km2, accounting for about 60% of the farmland area in Tibet [31]. The ORTS region has superior natural conditions where the Nianchu River Valley, the Lhasa River Valley, and the Shannan Valley in this region are known as important agricultural production areas and commodity grain production bases of Tibet [32].

2.2. Data Sources

The data used in this paper mainly include the following two types:
The NPP data was obtained from the MODIS v6 MOD17A3H dataset provided by the National Aeronautics and Space Administration website (https://lpdaac.usgs.gov/ (accessed on 23 April 2021)). Specifically, the BIOME-BGC model and the light energy utilization model were used to establish the NPP estimation model, and the annual NPP value of the global ecosystem was simulated, with a spatial resolution of 500 m × 500 m. In this paper, the corresponding data products from 2000 to 2018 were selected, which were mainly used to analyze the changes of NPP in the study area.
Considering that the farmland in the ORTS region was significantly fragmented into small parcels, and thus cannot be accurately extracted from the low spatial resolution remote sensing images data, the farmland data used in this paper were obtained by visual interpretation of 1 m resolution Google Earth high-resolution images in 2000 and 2018. Google Earth high-resolution images were characterized by clear recognition of ground objects and obvious land features, ensuring the accuracy of the translation results (the interpretation accuracy of farmland in the study area is as high as 95.22%) [33]. Farmland data were mainly used to analyze the features of farmland change and its contributions in NPP change in the ORTS region from 2000 to 2018.

2.3. Methodology

2.3.1. Trend Analysis Method

In this paper, farmland change can be divided into farmland area change and farmland use intensity change, among which farmland use intensity change can be measured from both input (replanting index, sowing area, mechanization, etc.) and output (change in unit yield, etc.) perspectives [34]. As a common proxy indicator that can reflect the yield of farmland and ecosystem stability, NPP can not only measure the degree of change in farmland use intensity from the output perspective, but also determine the direction of change in farmland area based on its change trend, which is in line with the research concept of this paper. Compared with the other commonly used indicators, i.e., the Normalized Difference Vegetation Index (NDVI), NPP avoids the problems of background influence and easy saturation [35,36], which is more suitable for reflecting changes in farmland intensification and the ecological impacts of farmland area change.
The method used to measure the inter-annual change rate of NPP is the trend analysis method [37]. This method started by constructing a linear regression model for the NPP values at each pixel from 2000 to 2018, and then the trend of NPP change in each pixel can be calculated [38], using the following formula:
β i = n × t = 1 n t N P P i t t = 1 n t × t = 1 n N P P i t n × t = 1 n t 2 ( t = 1 n t ) 2
where β i represents the variation trend of NPP in pixel i, i.e., the annual change of NPP (gC·m−2·a−1); n represents the total number of years during the study period; t represents the year ( t = 1 ~ n ). N P P i t represents the value of NPP in pixel i in year t. β i greater than 0 indicates that the NPP of pixel i shows an increasing trend during the study period, while β i less than 0 shows a decreasing trend. The absolute value of β i reflects the magnitude of the rate at which NPP increases or decreases.
Another common method for calculating the change of inter-annual rates is the compound interest formula in economics [39]. Compared with the compound interest formula, the trend analysis method can more fully reflect the trend of time series data, and thus has a wide application in the analysis of inter-annual variation of long time series elements, such as temperature, precipitation, NDVI, and NPP.

2.3.2. The Ecological Impact Index Method

The ecological impact index method, proposed by Wei et al. [39] in evaluating the contribution rate of farmland change to the NDVI change in the Huangshui River Basin, was applied in this study to asses the contribution of NPP change induced by farmland changes to the regional mean NPP change in the ORTS region. The farmland change in the ORTS region can be roughly summarized into the following four aspects: (1) Ecological restoration (ER), i.e., the conversion of farmland to ecological land; (2) Built-up land occupation (BO), which refers to the transformation of farmland into construction land; (3) New farmland reclamation (FR), which is the newly-added farmland during the study period; (4) Unchanged farmland (UF), which refers to the farmland with no change in spatial location, but does not exclude the possibility of change in intensification during the study period. Among them, we considered ER, BO, and FR as farmland area change, UF as farmland use intensity change, and the farmland area change and the farmland use intensity change constitute the change of farmland change. At the same time, this paper randomly selected the forestland or grassland within 1–2 km around the farmland that was not or less disturbed by humans and had basically the same climatic conditions as the control zone to exclude the interference of climatic factors on the final measurement index.
For ER, the contribution rate to regional NPP change was estimated by Formula (2):
C e r = ( β e r β c ) × A e r β h × A h × 100 %
C e r represents the contribution rate of ER to regional mean annual NPP change; β e r represents the mean annual NPP change of the pixels with farmland fully converted to forestland, grassland, or other ecological land; β h represents the annual average change of NPP in the ORTS region; A e r and A h represent the area of ER and the total area of the ORTS region, respectively; β c represents the annual average change of NPP in the control zone, which can roughly reflect the impact of climate change in agricultural areas of the ORTS region from 2000 to 2018.
For FR, Formula (3) was used to estimate its contribution rate to regional NPP change:
C f r = ( β f r β n ) × A f r β h × A h × 100 %
C f r represents the contribution rate of FR to regional mean annual NPP change; β f r represents the mean annual change of the NPP of the FR; β n represents the mean annual change of the NPP of the UF, which was induced by improved field management during the study period; A f r is the total area of FR.
The contribution rate of BO was estimated by Formula (4):
C b o = β b o × A b o β h × A h × 100 %
where C b o refer to the contribution rate of BO to the regional mean annual NPP change; β b o represents the mean annual change of the NPP in the pixels with farmland fully occupied by construction land; A b o is the total area of BO.
The contribution rate of UF was estimated as follows:
C u f = ( β u f β c ) × A u f β h × A h × 100 %
C u f represents the contribution rate of UF to regional average annual NPP change; β u f denotes the average annual NPP change where the pixels are completely occupied by unchanged farmland; A u f represents the total area of UF.
In conclusion, the total contribution rate ( C h ) of farmland change to the regional mean annual NPP change should be the sum of the contribution rates of four types of farmland change to the regional average annual NPP, as shown in Equation (6):
C h = C e r + C f r + C b o + C u f

3. Results

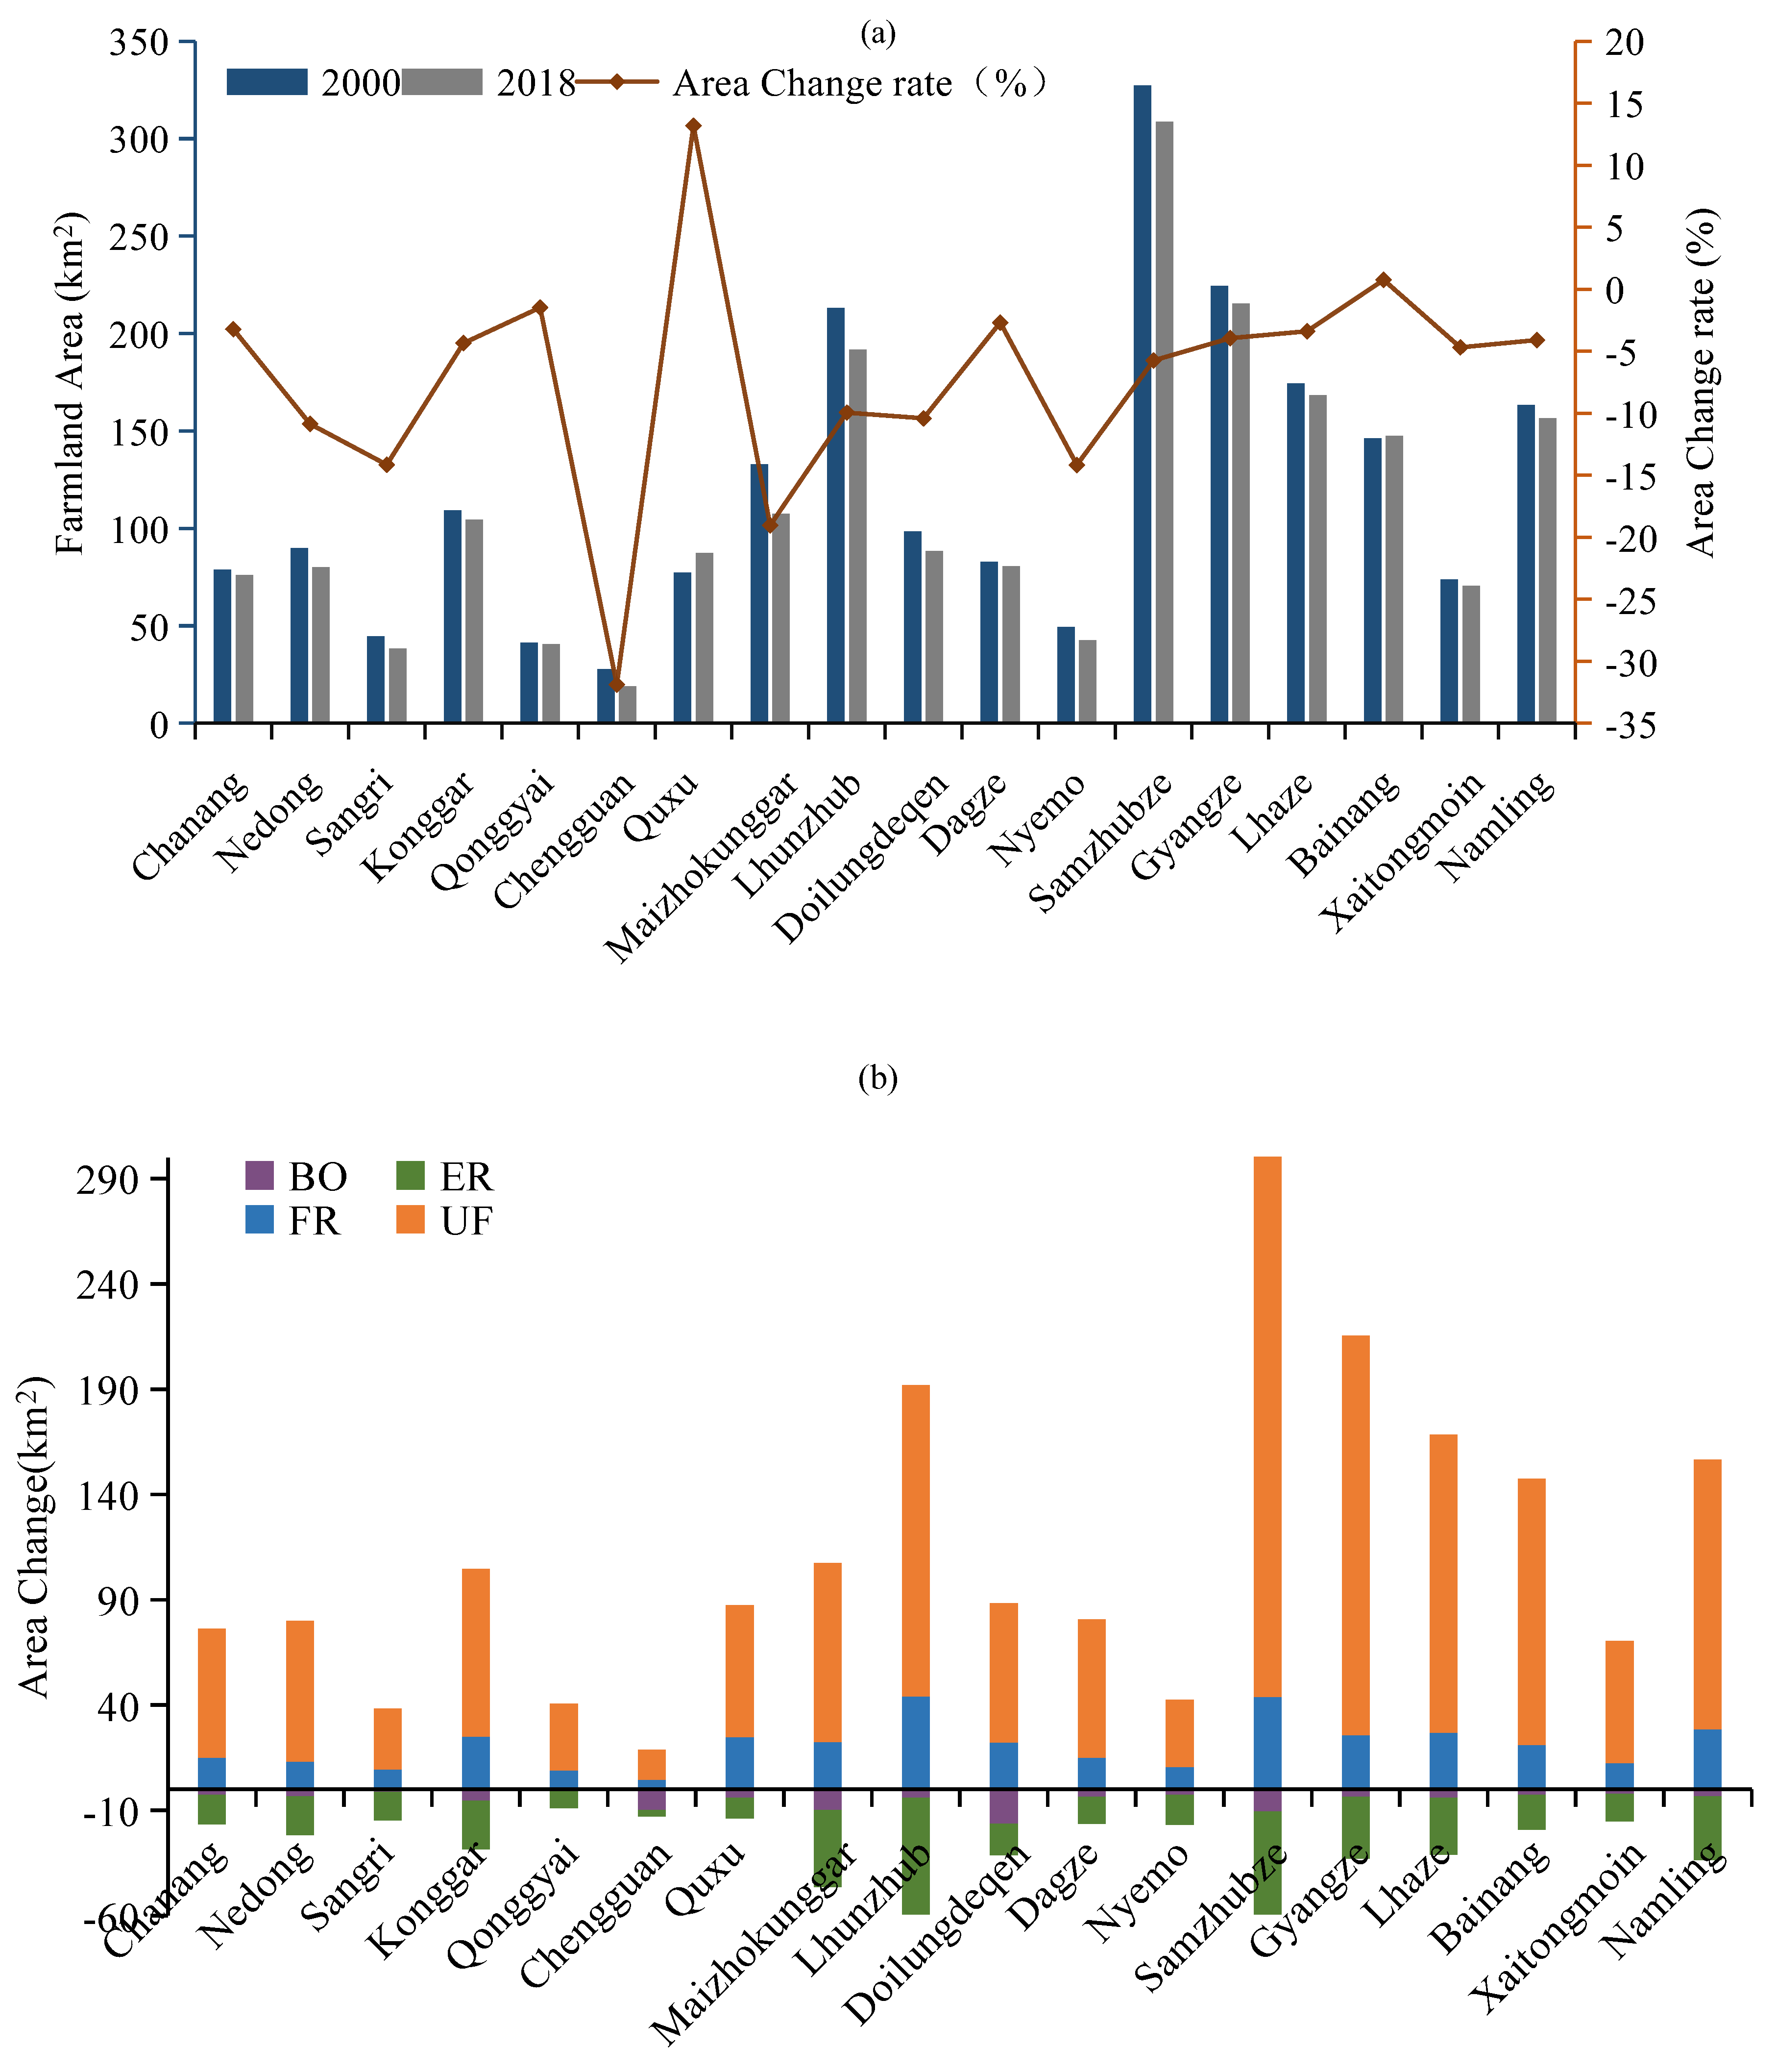
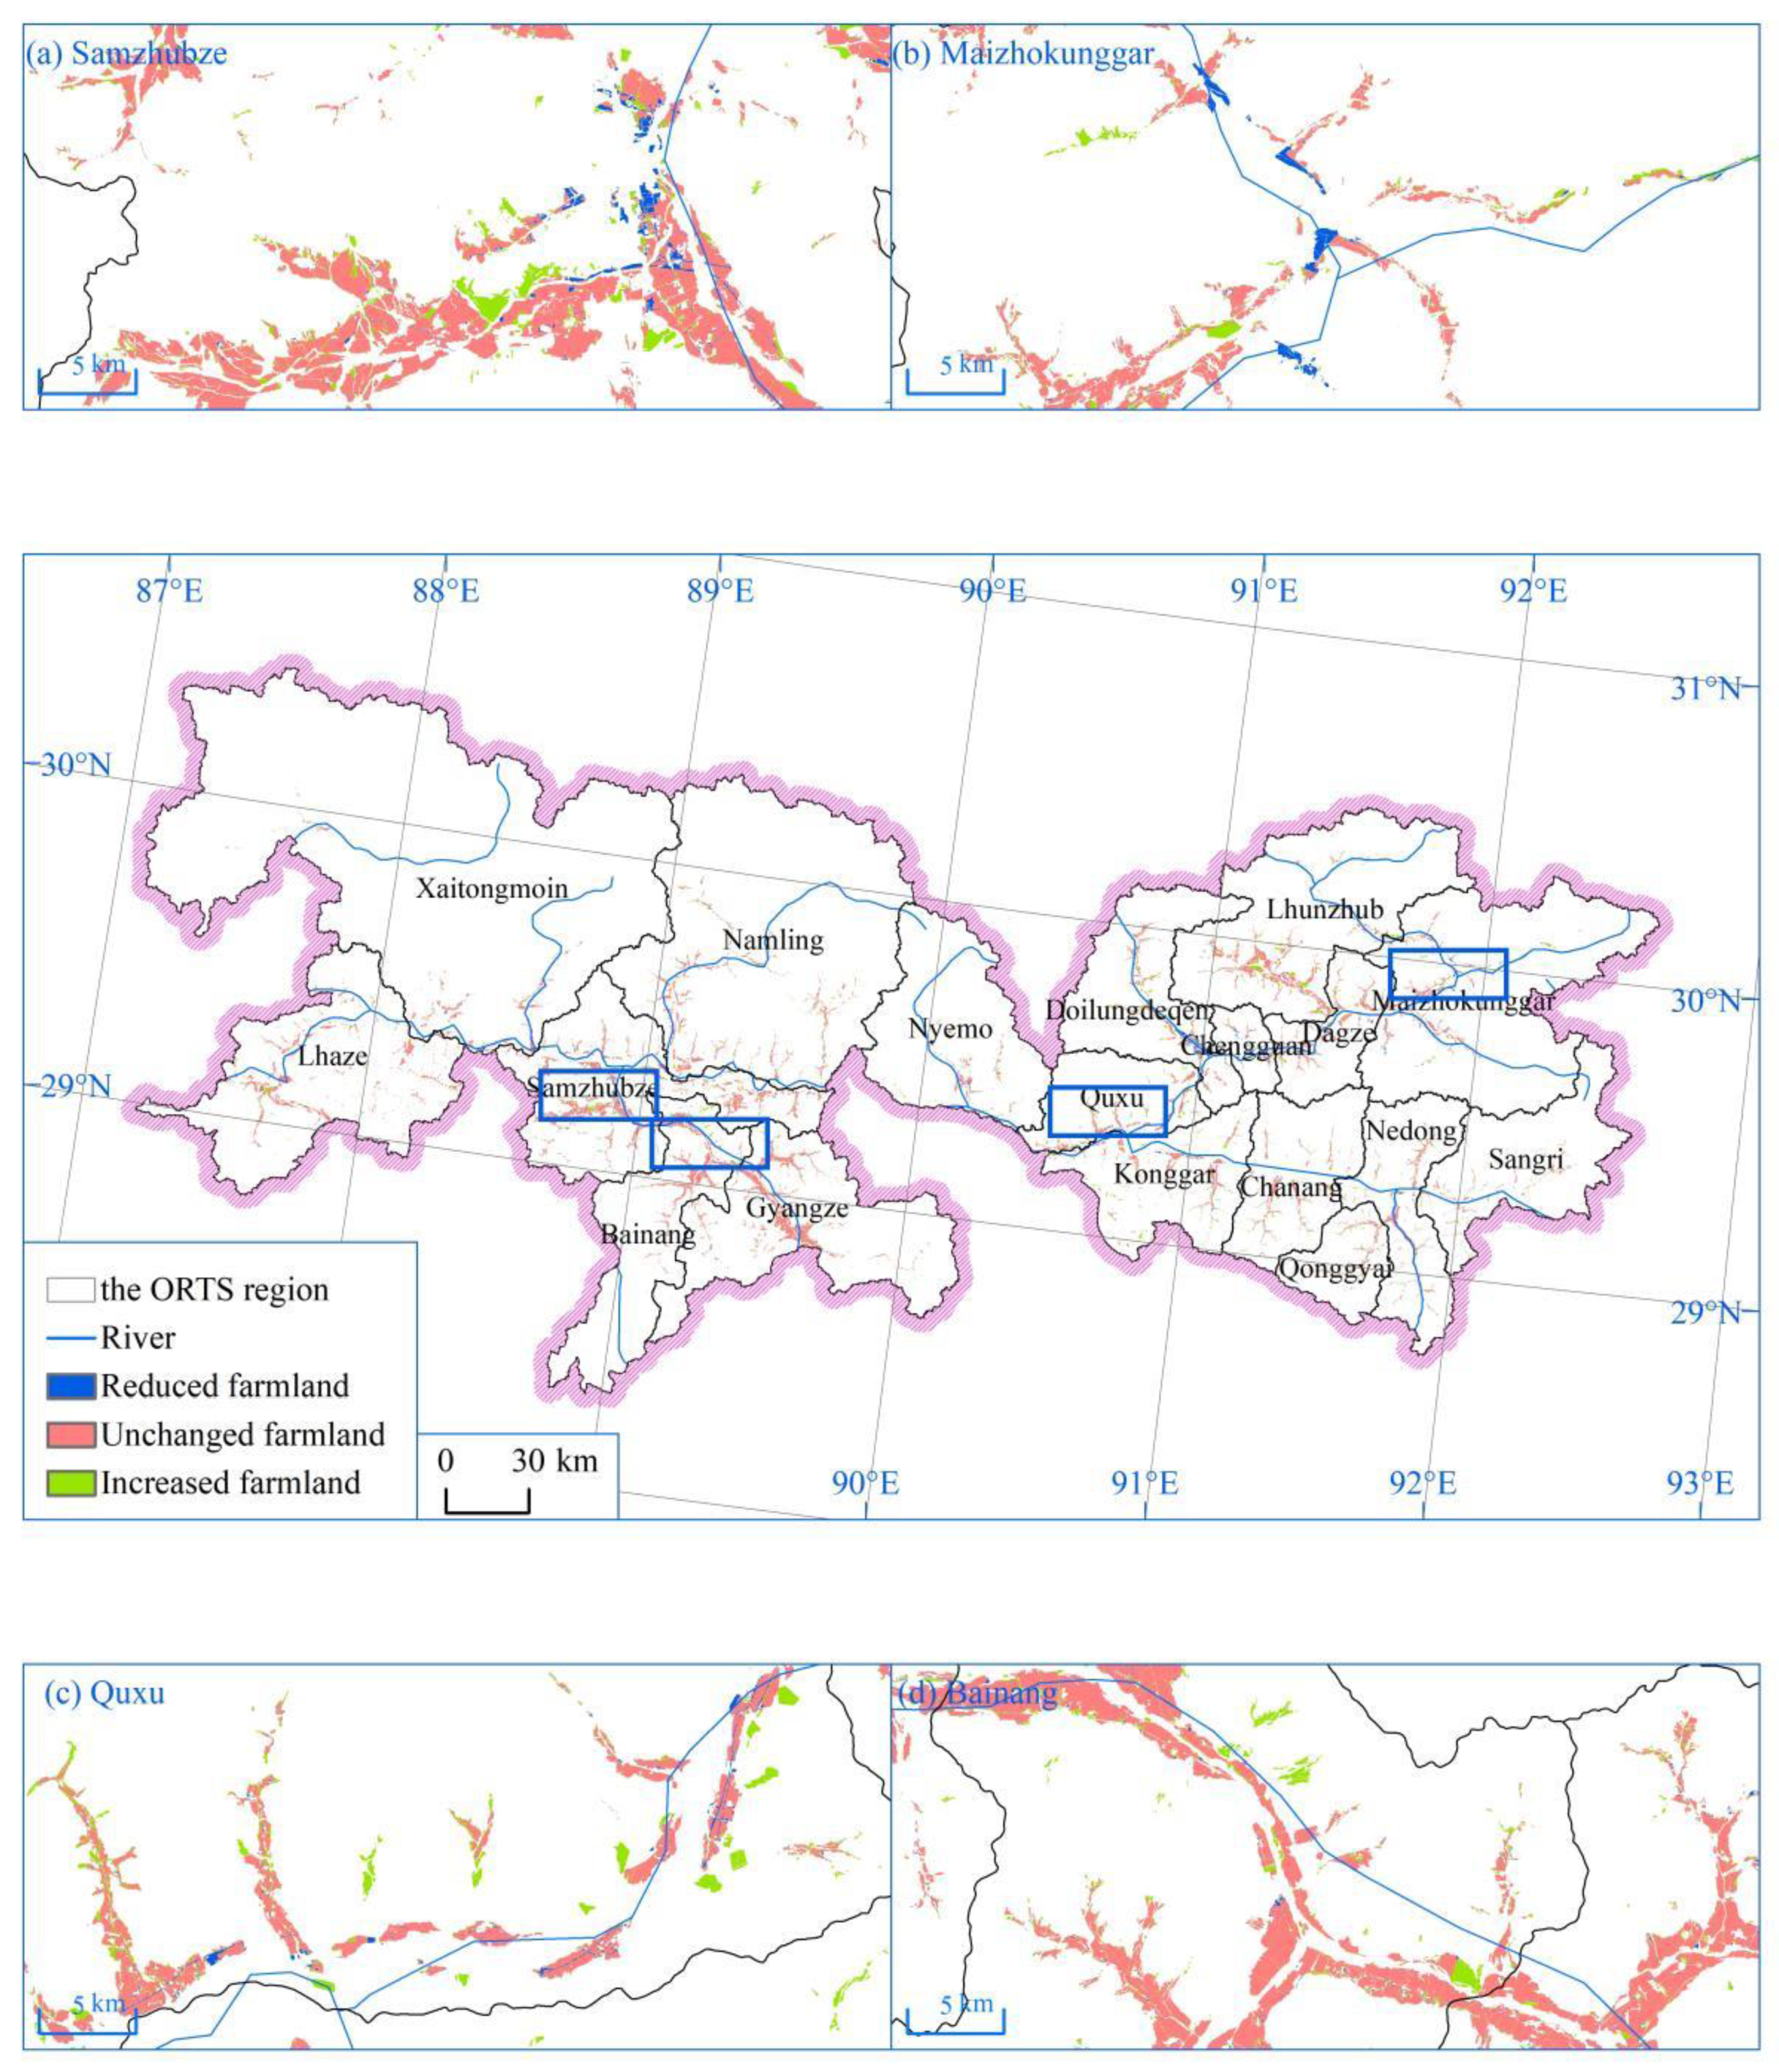
3.1. Farmland Change and Its Spatial–Temporal Distribution Characteristics

In 2018, the farmland area in the ORTS region varied considerably among counties, ranging from 308.55 km2 to 18.83 km2 (Figure 2a). Among them, the counties with larger areas (>150 km2) are Samzhubze, Gyangze, Lhunzhub, Lhaze, and Namling, while Nyemo, Qonggyai, Sangri, and Chengguan have smaller farmland areas (<50 km2). Overall, the farmland is mainly concentrated in the valley zone of Yarlung Zangbo River, Nianchu River, and Lhasa River (Figure 3).
The farmland area of the ORTS region decreased from 2154.32 km2 in 2000 to 2023.17 km2 in 2018, with a total decrease amount of 131.15 km2 and a total decrease rate of 6.09%. Except for Quxu and Bainang, the farmland area of the other 16 counties showed a decreasing trend. Among them, the reduction rates of farmland area in Maizhokunggar, Lhunzhub, Samzhubze, and Doilungdeqen were more than 10% (10.26–25.28%) over 18 years, while the reduction rates of farmland in Nedong, Gyangze, Nyemo, Chengguan, Namling, and Sangri were smaller, ranging between 6.31 and 9.75%. Other than that, the remaining counties had a low rate of reduction in farmland area, ranging from 0.61% to 4.76%.
As shown in Figure 3a–d, pixels with blue, pink and green, respectively, represent the reduced farmland (including built-up land occupation and ecological restoration), unchanged farmland, and increased farmland. In total, the area of unchanged farmland from 2000 to 2018 was 1648.82 km2, accounting for 81.50% of the total farmland area in the ORTS region. In addition, a total of 90.58 km2 of farmland was converted to built-up land, 393.23 km2 of farmland was converted to ecological land, and the area of newly reclaimed farmland was 374.27 km2. From 2000 to 2018, the built-up land occupation mainly occurred around the big cities such as Doilungdeqen and Chengguan (Figure 2b), while the farmland area change in other counties was mainly occupied by ecological land, especially in Lhoka city. Large amounts of newly reclaimed farmland (over 25 km2) mainly occurred in Lhunzhub, Samzhubze, Namling, Lhaze, and Gyangze.

3.2. Impacts of Farmland Change on NPP

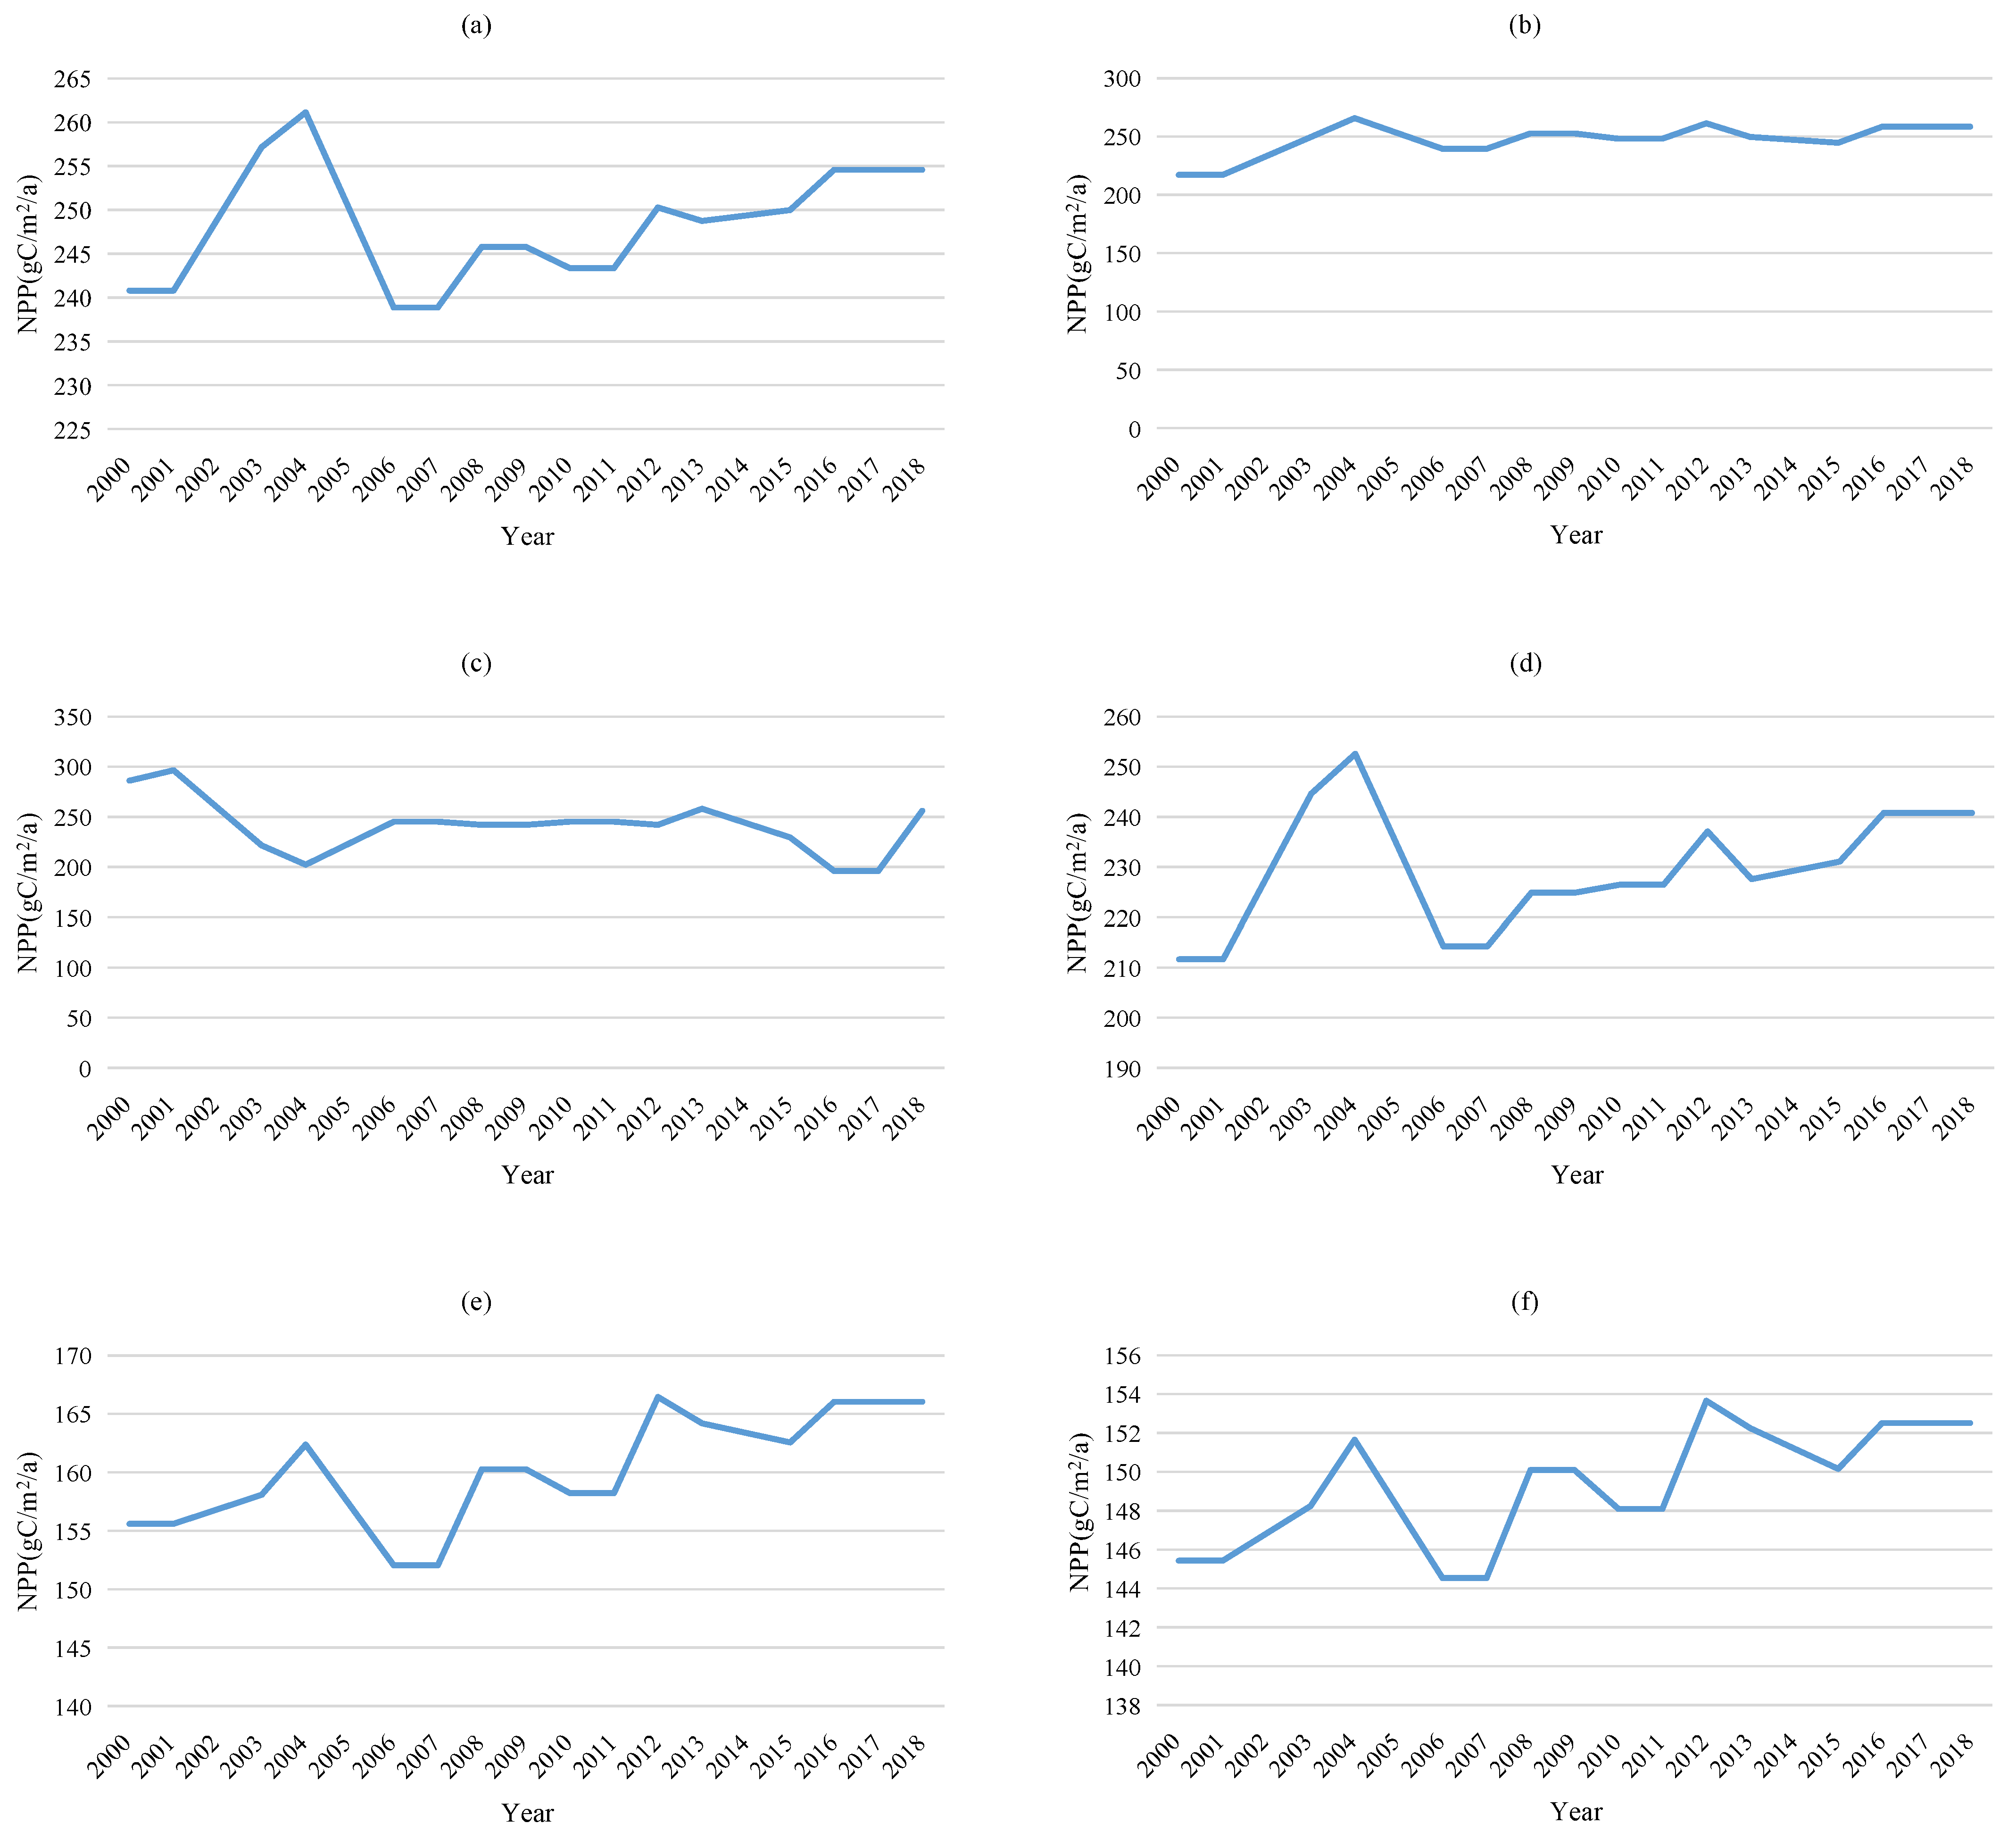
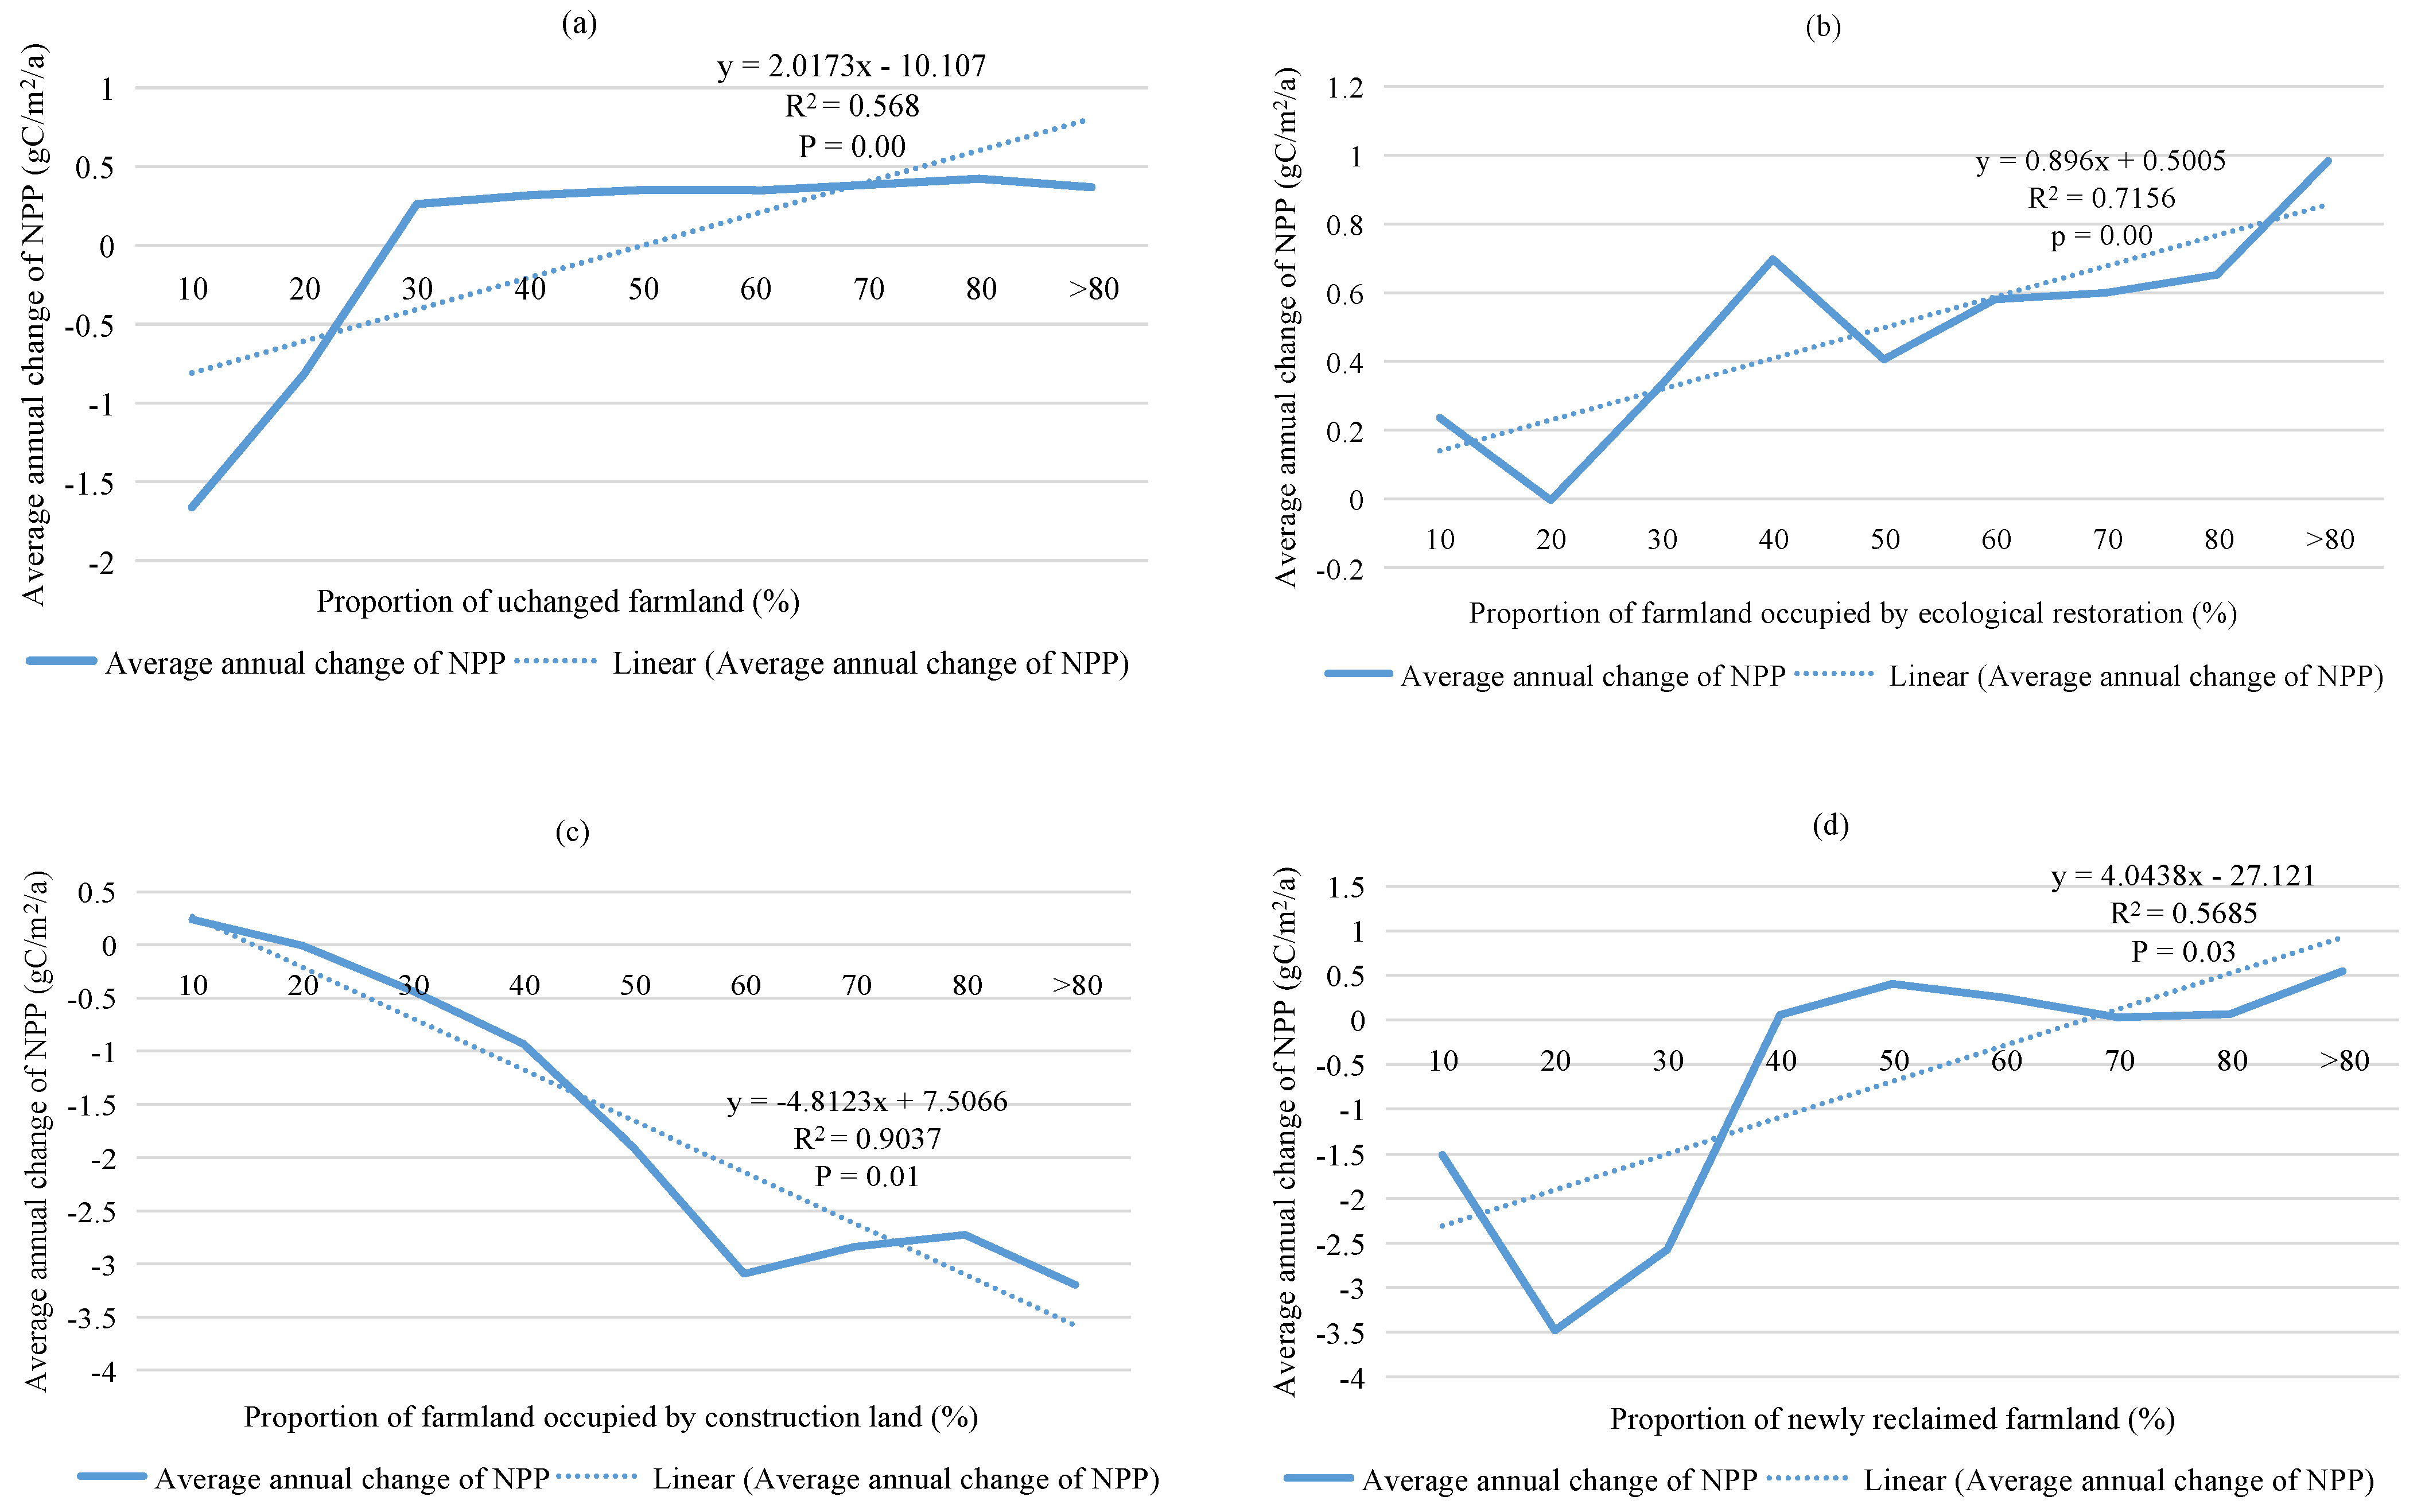
3.2.1. Changes of NPP in Different Farmland Change Areas

In the ORTS region, the average annual NPP was higher in the UF and ER areas, which were 248.26 gC·m−2·a−1 and 247.08 gC·m−2·a−1, respectively, followed by those of the BO area and the FR area, being 240.86 gC·m−2·a−1 and 229.52 gC·m−2·a−1, respectively, while the annual average NPP were much lower in the control area and the whole ORTS region, which were 160.08 gC·m−2·a−1 and 149.26 gC·m−2·a−1, respectively (Figure 4).
From 2000 to 2018, the average annual NPP in the whole region and the control zone both showed roughly increasing trends; while the changing trends of different farmland change areas were not the same. Specifically, the average annual NPP in the UF, ER, and FR areas showed roughly increasing trends. In comparison, the inter-annual variation of NPP in the BO areas showed a general decreasing trend, which is opposite of other areas of the ORTS region.
We used a simple statistical analysis method to further prove the impact of farmland area change on NPP both in terms of direction and extent of change, and the results are shown in Figure 5. The solid line represents the average annual NPP change in pixels with a different area proportion of a certain farmland change type; the dashed line (i.e., the linear trend line) represents the change trend of the average annual NPP change of the corresponding pixel with the increase in the area proportion of a certain type of farmland use change (Figure 5). Specifically, the average annual change of NPP in the UF area increased with the increase of the area proportion of unchanged farmland (Figure 5a). For the ER areas, the average annual change of NPP also increased with the continuous increase of the area proportion of ecological restoration. In the plots where the farmland was completely occupied by ecological restoration, the NPP increased by 0.983 gC·m−2·a−1 per year (Figure 5b). For the BO areas, the average annual change of NPP decreased significantly with the continuous increase of the area proportion of farmland occupied by built-up land. When the farmland is completely occupied by built-up land, the NPP roughly decreased by 3.198 gC·m−2·a−1 per year (Figure 5c). For FR areas, the average annual change of NPP showed a significant increasing trend with the increase of the proportion of FR, and when the original ecological land was completely transformed into farmland, NPP increased by 0.575 gC·m−2·a−1 per year on average (Figure 5d). Some studies have shown that after returning farmland to forestland or grassland, agricultural input of unchanged farmland will be increased, thus improving crop growth and grain yield [40].

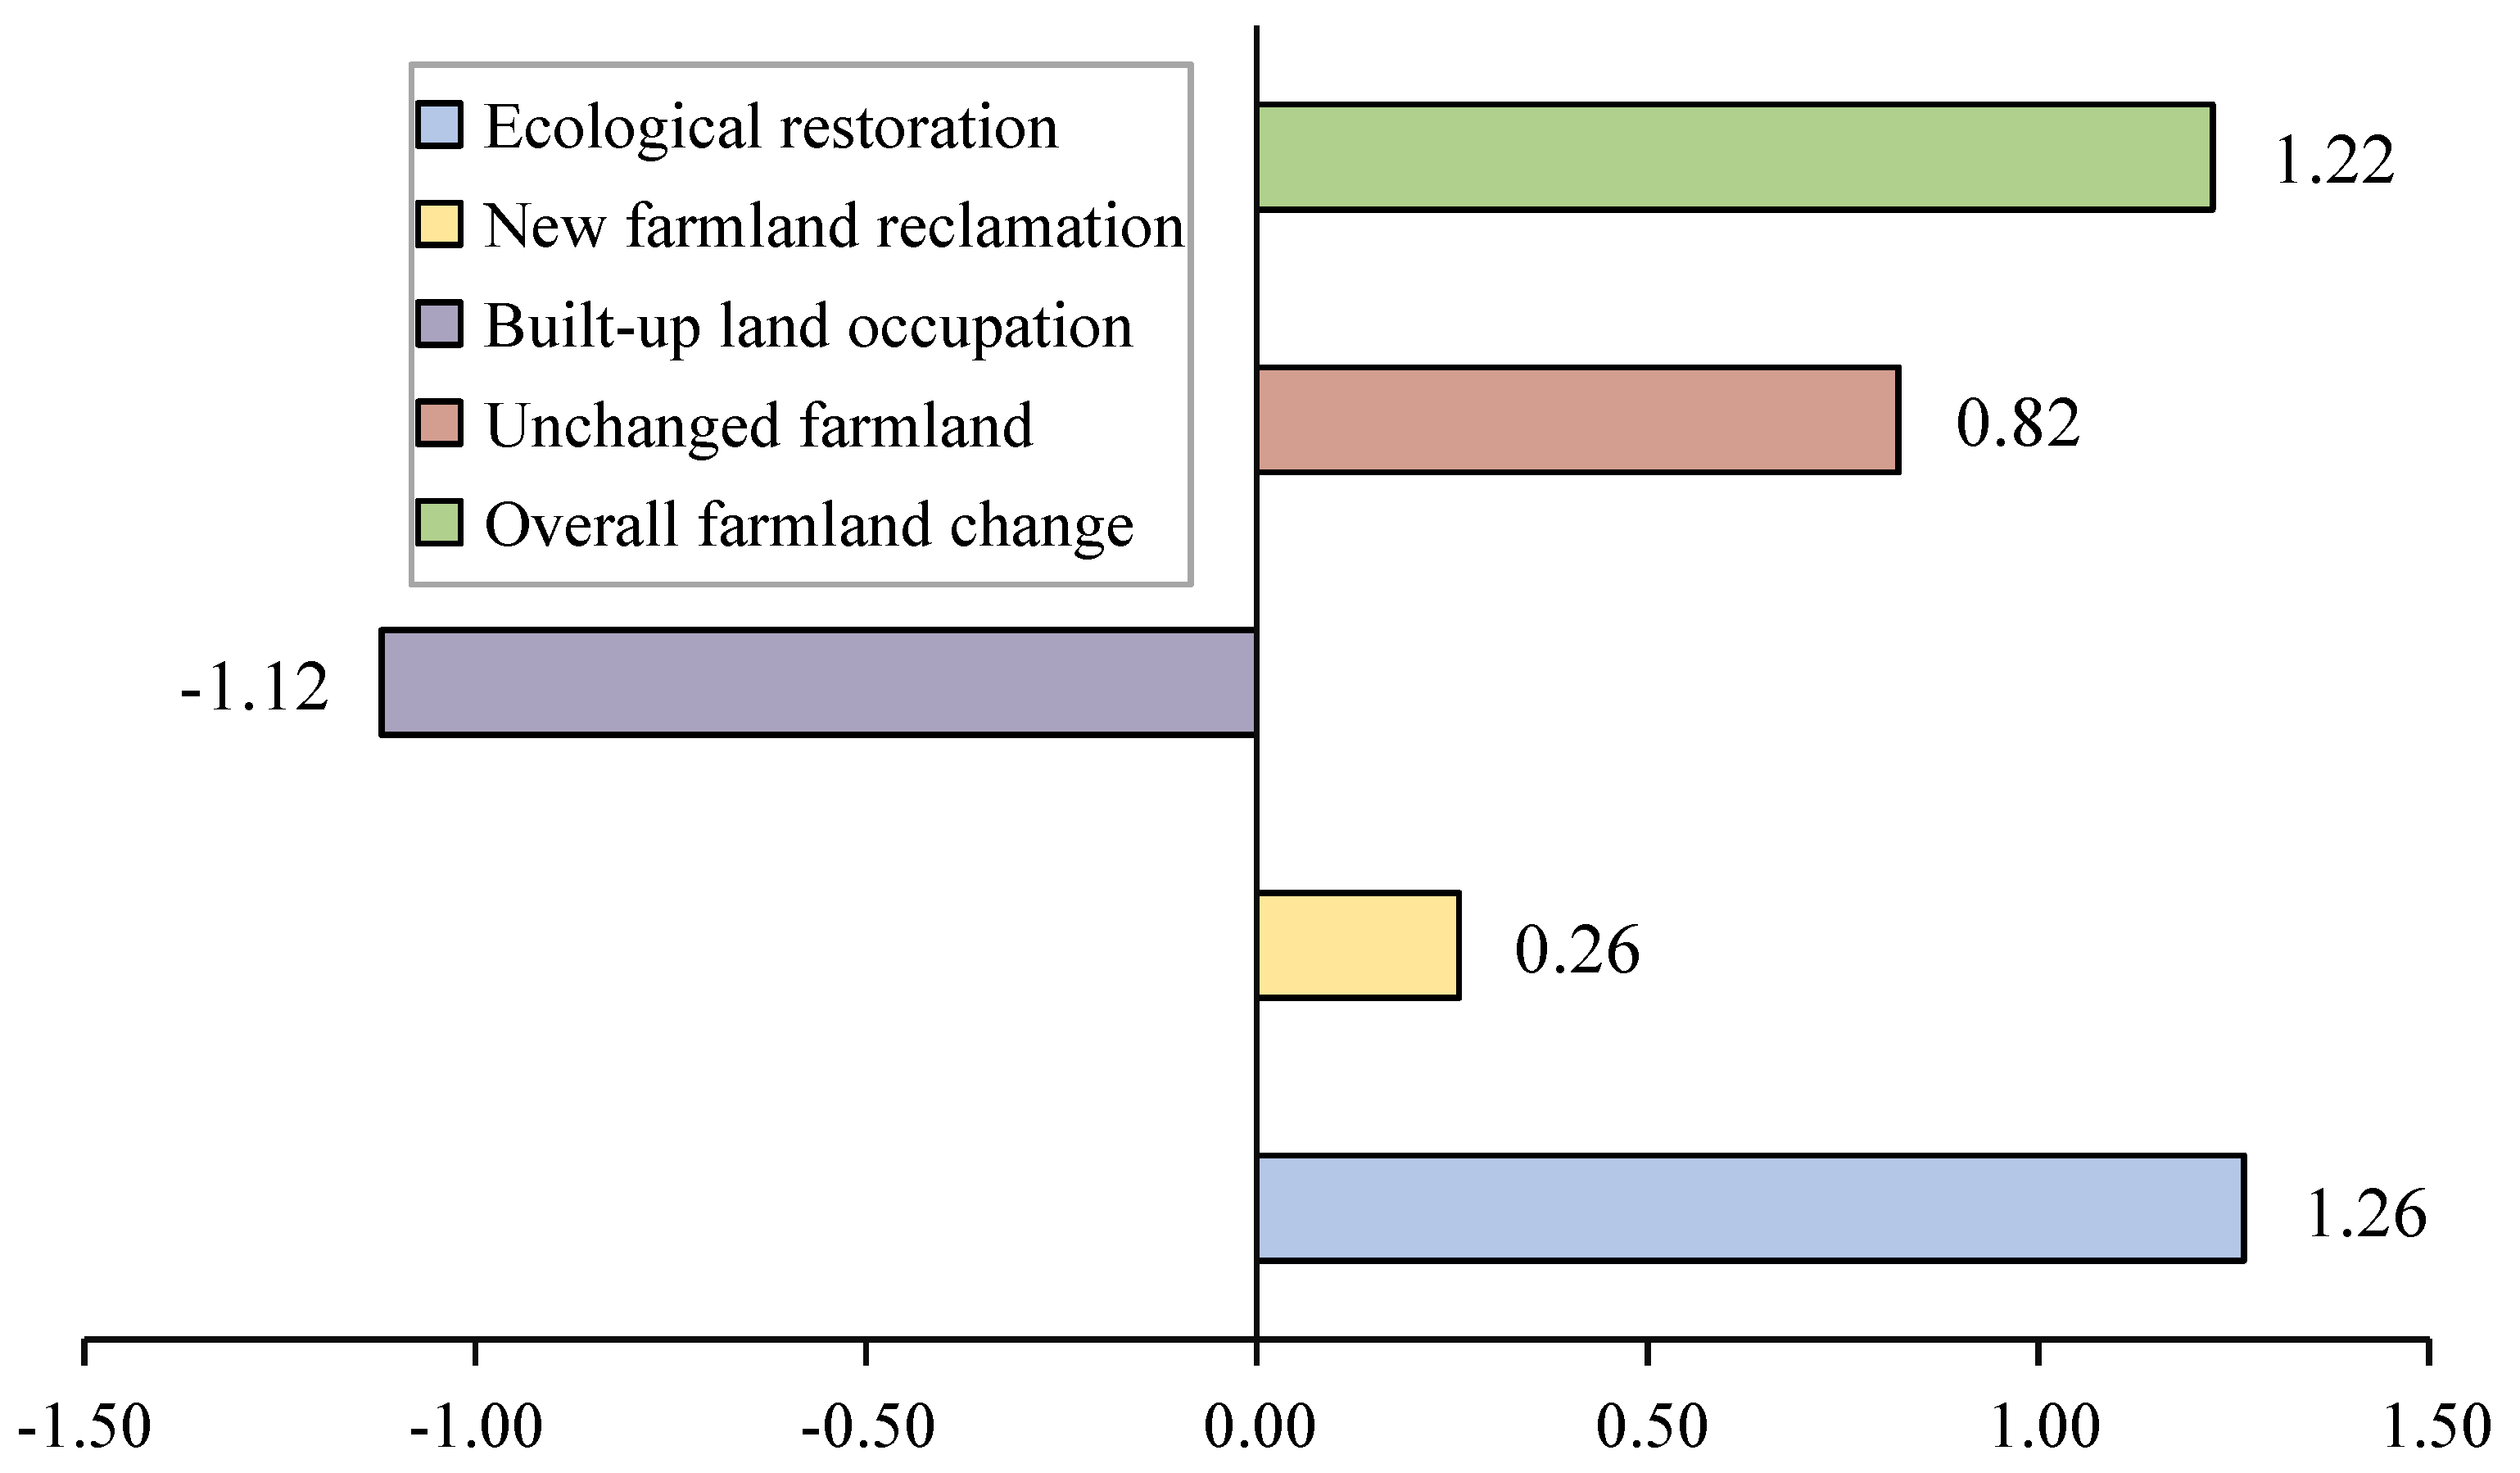
3.2.2. Contribution Rate of Farmland Change to NPP Change

According to the Formulas (2)–(5) in Section 2.3.2, the contribution rates of BO, ER, FR, and UF to the change of NPP were first calculated respectively and then summarized (Figure 6). The total contribution rate of farmland changes to the increase of NPP in the ORTS region from 2000 to 2018 turned out to be 1.22%. Specifically, the built-up land occupation resulted in a 1.12% decrease in NPP, while ER, FR, and UF all contributed to an increase in NPP in the ORTS region. Among them, FR contributed the most with 1.26%, followed by UF with 0.82%, and the least was ER whose contribution rate was only 0.26%. In conclusion, the total contribution rate of farmland use pattern change, i.e., BO, ER, and FR, to the change of NPP was 0.4%, while the contribution of the change in farmland use intensity, characterized as the contribution rate of UF, turned out to be 0.82%.

4. Discussion

4.1. Causes of Farmland Change

According to the results of our study on the farmland area change in the ORTS region, a total of 393.23 km2 of farmland was transformed into ecological land, 90.58 km2 of farmland was transformed into built-up land, and another 374.27 km2 of farmland was newly reclaimed, with 1648.82 km2 of unchanged farmland from 2000 to 2018.
The implementation of ecological restoration programs may be the main cause for the change in farmland use in the ORTS area [41]. By 2018, 47 nature reserves had been established in the Tibet Autonomous Region, covering a total area of 412,300 km2, accounting for one-third of the territory of the region. It also established 22 ecological function reserves, 4 national scenic spots, 9 forest parks, 18 wetland parks, and 3 geological parks, effectively protecting the animal and plant resources and ecological environment in the Tibet. The reforestation project of “Two Rivers and Four Rivers” (Yarlung Zangbo River, Nujiang River, Lhasa River, Nianchu River, Yarlung River and Shiquan River) is planning to invest RMB 34 billion over 17 years to achieve reforestation of 10,744,900 mu in the planning area [42]. The implementation of the above-mentioned ecological construction projects may thus strongly contribute to the transformation of farmland to ecological land. In addition, the increasing demand for land from industrial and urban construction as a result of rapid economic development has also had a profound impact on land use change. According to relevant information, the established counties in the ORTS region only account for 24.3% of the Tibet Autonomous Region, and the area only accounts for 5.48% of all of Tibet. However, the population has risen from 1,081,034 in 2010 to 1,482,123 in 2020, accounting for more than 40% of the total population of the region [43,44,45]; The gross product of primary, secondary, and tertiary industries has a crucial position in the whole region, among which, the primary sector accounted for about one-third of the region’s gross domestic product in 2018, and the gross domestic product of the secondary and tertiary industries could reach more than half of the region [46]. This indicates that the population agglomeration effect and economic agglomeration effect of the ORTS region are becoming more and more prominent. The ORTS region, as an important economic growth pole of the TP, have promoted the growth of the demand for built-up land such as housing and public infrastructure, which has intensified the occupation of farmland by built-up land in the basins.
Newly reclaimed farmland is also an important cause for the change in the use of farmland in the ORTS region. According to the documents published by the Department of Natural Resources of Tibet Autonomous Region in 2019, as of 2018, the autonomous government invested a total of RMB 43,171,400, organized and reclaimed 1330.9 ha of land, and implemented nine land preparation and development projects, which are expected to increase the farmland area by 364.76 ha. The continuous promotion of land reclamation work in Tibet by the national and autonomous region governments has significantly changed the land use in the ORTS region.
The increase in agricultural production factor inputs such as fertilizers and pesticides may be the main cause for the change in the intensification of farmland use in the ORTS region. The increase in agricultural inputs in Tibet from 2011–2017 was relatively high, with total agricultural machinery power input per unit of farmland increasing nearly eight times compared to 1990–1995. The average pesticide application and fertilizer application per unit of farmland in the plateau from 1990 to 2017 were 25 kg/ha and 127 kg/ha, respectively, with a general increased trend [47]. The significant increase in agricultural production factor inputs has strongly contributed to the increase in farmland intensification.

4.2. Trends and Causes of NPP Change

The significant impact of climate change on NPP has been confirmed by many scholars [48], among which the TP region, as the “third pole of the earth”, is significantly affected by climate change and shows an obvious increasing trend of NPP [49]. However, the impact of climate change on NPP in this study is only in the control area, while the other four regions (BO, ER, FR, and UF) eliminate the effects of climate change as a direct result of changes in farmland. The four types of farmland change areas can be divided into farmland area change areas and farmland use intensity change areas [50,51]. The farmland area change is due to the change of land use type, which in turn leads to the change of NPP. Specifically, BO is changed from crop to impervious surface and the vegetation is sharply reduced, thus the NPP decreases [52]. The farmland transformed by ER is mainly the result of the ecological restoration programs mentioned above. Through these programs, the marginalized farmland with lower NPP was transformed into ecological lands such as woodland with higer NPP. The productivity of the land has increased and therefore the NPP has increased [53]. The FR tends to develop lands with less difficulties, such as wild land, grassland, and other ecological land, rather than forestland, which tends to have lower NPP. There is increased surface vegetation cover after conversion to farmland, which in turn increased the NPP [54]. Farmland use intensity change area will also have a moderate increase in NPP as a characterization indicator of yield, due to the increase in the intensification of inputs such as fertilizer and pesticide on farmland leading to an increase in crop yield.
The overall impact of farmland changes on NPP is relatively small in the ORTS region, which is mainly due to the small proportion of farmland area to the total area. Among the two types of farmland changes, the contribution of farmland use intensity changes is greater, which is mainly due to the following two causes: First, the area of unchanged farmland is larger than the area of changed farmland; second, the level of agricultural inputs in the TP increased significantly from 2000 to 2018. Some studies show that the agricultural input index and agricultural output index of the TP from 1990 to 2017 is 0.121 a−1 and 0.091 a−1, showing a gradual increasing trend [55], which is consistent with the findings of this study.

4.3. Policy Suggestions

Considering the NPP in the BO area decreased significantly, which has negative impacts on the sustainability of the ecosystems at local levels, it is suggested that the government should strictly limit the disorderly expansion of cities and reduce the unreasonable occupation of farmland by construction land in the future. At the same time, as local governments are faced with the dual tasks of economic growth and farmland protection, it is necessary to develop a scientific performance evaluation index system as the basis to stimulate farmland protection, promote the innovation of land expropriation system, and reduce the excessive occupation of farmland.
The NPP of ER areas increased significantly, indicating that the transformation from farmland with low productivity to ecological land is beneficial to the regional ecosystem. This requires the government evaluate the quality of farmland, and encourage the farmland with low productivity to realize ecological conversion. They can also reasonably improve the intensity of the rest of the farmland, and further promote the mechanization and modernization process of centralized contiguous farmland, so as to improve the intensity of farmland productivity and the level of grain yield per unit area.
Considering the significant increase in NPP in the FR area, the government should to take active measures to rationalize the use of this land and avoid its abandonment. Due to land with a steep slope not being suitable for mechanical operation, land of low soil fertility, and land with long distance from residential areas, land abandonment in plateau areas is more common. From the Huangshui River for example, the upstream farmland abandonment situation occurs, where abandoned area accounted for a farmland area ratio of up to 24.01% [56].
The high contribution of the change in farmland use intensity to the increased value of NPP in the ORTS region indicates that increasing the input of production factors such as fertilizers and pesticides per unit area of farmland can improve the agricultural production efficiency of farmland in the region. Related studies show that the TP has a low penetration rate of mechanization and a low level of modernization, with a high potential for development [57]. Improving the intensification of farmland use is the main goal of improving agricultural productivity in the ORTS region in the future.

5. Conclusions

This study firstly analyzed the spatial and temporal distribution of farmland changes in the ORTS region from 2000 to 2018, then calculated the inter-annual changes in NPP for ER, BO, FR, and UF using the trend analysis method, and finally analyzed the contribution of the above four types of farmland changes to NPP changes in the region by using the ecological impact index. The main conclusions are as follows:
(1) The farmland area in the ORTS region decreased by a total of 6.09% (131.15 km2) from 2000 to 2018. Specifically, a total of 90.58 km2 of farmland was converted to built-up land, 393.23 km2 of farmland was converted to ecological land, and 374.27 km2 farmland was newly reclaimed. (2) The NPP in the ORTS region was roughly on an increasing trend, while the trends of NPP in different farmland change areas were not the same. Specifically, the NPP of ER, FR, and UF all showed a significant increasing trend, while the NPP of BO showed a significant decreasing trend. (3) Farmland change contributed 1.22% to the increase of NPP in the ORTS region during 2000–2018, of which the farmland area change contributed 0.4% to NPP and farmland use intensity contributed 0.84% to NPP. This study not only gives a research paradigm to quantitatively assess the production and ecological impacts of a particular land use type change, but also conducts an empirical analysis in the ORTS region, which can be used as a reference for related studies in other regions, and can also provide suggestions for the rational use and conservation of farmland and the stability and sustainable development of ecosystems for the region and the TP.
It should also be pointed out that the main uncertainty in this paper comes from the inseparability of NPP data and farmland data. Limited by the low resolution of NPP data, only the overall analysis was carried out in the area of the ORTS region, and there was not enough data to support regional comparative analysis. In the future, we will strive to collect data from multiple sources to improve the spatial resolution of NPP and conduct more detailed analysis. At the same time, the ecological impact of farmland change should be comprehensively considered from other perspectives, such as soil and water conservation, biodiversity, and so on. This is also an important part of our future research.

Author Contributions

X.W. conceived the content and revised the manuscript; Y.L. (Yunxi Liu) conducted the data acquisition and processing and wrote the draft manuscript; Y.L. (Yunxi Liu), Y.L. (Yahan Lu) and L.X. collected the basic data for this paper. All authors have read and agreed to the published version of the manuscript.

Funding

This research was funded by the Second Tibetan Plateau Scientific Expedition and Research (grant number 2019QZKK0603) and Strategic Priority Research Program of Chinese Academy of Sciences “Pan-third pole environmental change and the construction of green Silk Road” (grant numbers XDA20040000, XDA20090000).

Data Availability Statement

Data available on request from the authors.

Conflicts of Interest

The authors declare no conflict of interest.

References

  1. Sun, H.L.; Zheng, D.; Yao, T.D.; Zhang, Y.L. Protection and Construction of the National Ecological Security Shelter Zone on Tibetan Plateau. Acta Geogr. Sin. 2012, 67, 3–12. [Google Scholar]
  2. Xie, G.D.; Lu, C.X.; Leng, Y.F.; Zheng, D.; Li, S.C. Ecological assets valuation of the Tibetan Plateau. J. Nat. Resour. 2003, 18, 189–196. [Google Scholar]
  3. Chen, H.; Zhu, Q.A.; Peng, C.H.; Wu, N.; Wang, Y.F.; Fang, X.Q.; Gao, Y.H.; Zhu, D.; Yang, G.; Tian, J.Q.; et al. The impacts of climate change and human activities on biogeochemical cycles on the Qinghai-Tibetan Plateau. Glob. Chang. Biol. 2013, 19, 2940–2955. [Google Scholar] [CrossRef] [PubMed]
  4. Li, X.B. A Review of the International Researches on Land Use/Land Cover Change. Acta Geogr. Sin. 1996, 51, 553–558. [Google Scholar]
  5. Liu, Y.J.; Dai, L.; Zhang, J.; Feng, Z.M.; Pan, T.; Ge, Q.S. Research on monitoring resource carrying capacity: Taking Three-Rivers Region in Tibet as an example. J. Nat. Resour. 2020, 35, 1699–1713. [Google Scholar]
  6. Zhao, T.T.; Song, B.G.; Chen, Y.S.; Yan, H.M.; Xu, Z.R. Analysis of Population Distribution and Its Spatial Relationship with Terrain Elements in the Yarlung Zangbo River, Nyangqu River and Lhasa River Region, Tibet. J. Geo-Inf. Sci. 2017, 19, 225–237. [Google Scholar]
  7. Research on the Evaluation and Monitoring Achievements of Ecological Security Barrier Protection and Construction of Tibet. Bull. Chin. Acad. Sci. 2018, 33, 988–989.
  8. Tao, H.P.; Gao, P.; Zhong, X.H. A Study of Regional Eco-environment Vulnerability—A Case of “One-River-Two-Tributaries”,Tibet. Mt. Res. 2006, 6, 761–768. [Google Scholar]
  9. Tang, W.; Zhong, X.H.; Zhou, W. The Evolvement and Optimization of Urbanization Dynamics in “Three-River Area” on Tibetan Plateau. Mt. Res. 2011, 29, 378–384. [Google Scholar]
  10. Li, D.; Tian, P.P.; Luo, H.Y.; Luo, Y.F.; Cui, Y.L. Spatio-temporal Characteristics and Obstacle Diagnosis of Cultivated Land Ecological Security in One River and Two Tributaries” Region in Tibet. Trans. Chin. Soc. Agric. Mach. 2020, 51, 213–222. [Google Scholar]
  11. Wang, Z.M.; Guo, Z.X.; Song, K.S.; Liu, D.W.; Zhang, B.; Zhang, S.Q.; Li, F.; Jin, C.; Yang, T.; Huang, N. Effects of Land Use/Cover Change on Net Primary Productivity of Sanjiang Plain, during 2000–2005. J. Nat. Resour. 2009, 24, 136–146. [Google Scholar]
  12. Ma, Z.X.; Cui, H.J.; Ge, Q.S. Prediction of net primary productivity change pattern in China based on vegetation dynamics models. Acta Geogr. Sin. 2022, 77, 1821–1836. [Google Scholar]
  13. Hong, L.L.; Shen, Y.; Ma, H.B.; Zhang, P.; Huo, X.R.; Wen, H.C. Temporal and spatial variation of vegetation net primary productivity and its driving factors in Ningxia, China from 2000–2019. Chin. J. Appl. Ecol. 2022, 33, 2769–2776. [Google Scholar] [CrossRef]
  14. Schimel, D.S.; Emanuel, W.; Rizzo, B.; Smith, T.; Woodward, F.I.; Fisher, H.; Kittel, T.G.F.; McKeown, R.; Painter, T.; Rosenbloom, N.; et al. Continental scale variability in ecosystem processes: Models, data, and the role of disturbance. Ecol. Monogr. 1997, 67, 251–271. [Google Scholar] [CrossRef]
  15. Dai, L.; Peng, H.; Wu, S.H.; Lin, C.; Huang, L.H. Net Primary Productivity of Source Jiangsu in Response to Land Use Cover/Change. Soils 2013, 45, 565–571. [Google Scholar]
  16. Dong, G.T.; Bai, J.; Yang, S.T.; Wu, L.N.; Cai, M.Y.; Zhang, Y.C.; Luo, Y.; Wang, Z.W. The impact of land use and land cover change on net primary productivity on China’s Sanjiang Plain. Environ. Earth Sci. 2015, 74, 2907–2917. [Google Scholar] [CrossRef]
  17. Piao, S.L.; Fang, J.Y. Terrestrial net primary production and its spatio-temporal patterns in Qinghai-Xizang Plateau, China during1982–1999. J. Nat. Resour. 2002, 17, 373–380. [Google Scholar]
  18. Zhang, Y.L.; Qi, W.; Zhou, C.P.; Ding, M.J.; Liu, L.S.; Gao, J.G.; Bai, W.Q.; Wang, Z.F.; Zheng, D. Spatial and temporal variability in the net primary production of alpine grassland on the Tibetan Plateau since 1982. Acta Geogr. Sin. 2013, 68, 1197–1211. [Google Scholar] [CrossRef]
  19. Zhang, F.; Xiong, H.G.; Feng, J.; Xu, Z.L. Dynamic change of net primary productivity during process of new artificial oasis expansion in Xinjiang based on remote sensing. Trans. Chin. Soc. Agric. Eng. 2017, 33, 194–200. [Google Scholar]
  20. Cheng, F.Y.; Liu, S.L.; Zhang, Y.Q.; Yin, Y.J.; Hou, X.Y. Effects of land-use change on net primary productivity in Beijing based on the MODIS series. Acta Ecol. Sin. 2017, 37, 5924–5934. [Google Scholar]
  21. Zhao, X.; Zhou, W.Z.; Tian, L.; He, W.H.; Zhang, J.C.; Liu, D.H.; Yang, F. Effects of land-use changes on vegetation net primary productivity in the Three Gorges Reservoir Area of Chongqing. Acta Ecol. Sin. 2018, 38, 7658–7668. [Google Scholar]
  22. Yuan, J.; Shen, F.; Wang, T.T.; Luo, X.R. Impact of Land Use/Cover Change on Regional Net Primary Productivity in Wanjiang City Belt During the Period from 2000 to 2010. Res. Soil Water Conserv. 2016, 23, 245–250. [Google Scholar]
  23. Chen, T.; Liu, M.; Hu, Y.M.; Lu, J.J.; Ma, J.; Sun, F.Y.; Gong, J.P. Land use and net primary productivity changes in Shenyang Metropolitan Area. Acta Ecol. Sin. 2015, 35, 8231–8240. [Google Scholar]
  24. Wang, S.; Zhang, Y.F.; Wei, H.J.; Zhang, H.Y. The NPP Change and the Vegetation Carbon Fixation/Oxygen Release Values in Shaanxi-Gansu-Ningxia Region of China. J. Desert Res. 2015, 35, 1421–1428. [Google Scholar]
  25. Luo, L.; Wang, Z.M.; Song, K.S.; Ren, C.Y.; Zhan, B.; Liu, D.W. Research on Farmland Productivity about Spatial-temporal Features and Influential Factors in Songnen Plain from 2000 to 2006. Syst. Sci. Compr. Stud. Agric. 2010, 26, 468–474. [Google Scholar]
  26. Zhu, F.; Liu, Z.M.; Wang, Z.M.; Song, K.S. Temporal-Spatial Characteristics and Factors Influencing Crop NPP across Northeastern China. Resour. Sci. 2010, 32, 2079–2084. [Google Scholar]
  27. Xie, B.N.; Qin, Z.F.; Wang, Y.; Chang, Q.R. Spatial and temporal variation in terrestrial net primary productivity on Chinese Loess Plateau and its influential factors. Trans. Chin. Soc. Agric. Eng. 2014, 30, 244–253. [Google Scholar]
  28. Jiang, C.; Wu, Z.F.; Cheng, J.; Qian, L.X. Analyzing the Effects of Lang Cover Change on Vegetation Net Primary Productivity in Guangdong Province. J. Nat. Resour. 2016, 31, 961–972. [Google Scholar]
  29. Tian, Z.H.; Zhang, D.D.; He, X.H.; Guo, H.L.; Wei, H.T. Spatiotemporal Variations in Vegetation Net Primary Productivity and Their Driving Factors in Yellow River Basin from 2000 to 2015. Res. Soil Water Conserv. 2019, 26, 255–262. [Google Scholar]
  30. Hao, W.Y.; Guo, T.; Wang, Z.B.; Yang, H.; Yang, S.; Zhang, H.F. Analysis on Spatial and Temporal Changes of Wetlands of Yarlung Zangbo River and Its Two Tributaries in Tibet from 1990 to 2021. Tianjin Agric. Sci. 2022, 28, 72–77. [Google Scholar]
  31. Wei, X.H.; Yang, P.; Dong, G.R. Agricultural Development and Farmland Desertification in Middle“One River and Its Two Branches” River Basin of Tibet. J. Desert Res. 2004, 24, 84–88. [Google Scholar]
  32. He, W.H.; Zhou, W.Z.; Tian, L.; Zhao, X.; Liu, D.H.; Zhang, J.C. Relationship Between Spatio-Temporal Distribution of Land Use and Topographic Factors in the Valleys of the Yarlung Zangbo River and Its Two Tributaries--the Nyangqu River and the Lhasa River in Tibet. J. Southwest Univ. (Nat. Sci. Ed.) 2018, 40, 113–123. [Google Scholar]
  33. Wei, H.; Lu, C.H. A high-resolution dataset of farmland area in the Tibetan Plateau. PANGAEA 2021. [Google Scholar] [CrossRef]
  34. Zhu, H.Y.; Li, X.B.; Xin, L.J. Intensity Change in Cultivated Land Use in China and Its Policy Implications. J. Nat. Resour. 2007, 22, 907–915. [Google Scholar]
  35. Li, H.J.; Deng, L.; Lei, Y.P.; Li, C.Q.; Zhou, K. Comparison of NDVI and EVI based on EOS/MODIS data. Prog. Geogr. 2007, 26, 26–32. [Google Scholar]
  36. Li, W.M.; Qin, Z.H.; Li, W.J.; Yang, Q. Comparison and Analysis of MODIS NDVI and MODIS EVI. Remote Sens. Inf. 2010, 6, 73–78. [Google Scholar] [CrossRef]
  37. Liu, S.L.; Zhao, H.D.; Dong, S.K.; Su, X.K.; Liu, Q.; Deng, L.; Zhang, X. Dynamic of vegetation in the Altun Mountain Nature Reserve Based on SPOT NDVI. Arid Zone Res. 2014, 31, 832–837. [Google Scholar]
  38. Zhao, W.Q.; Du, H.M.; Dong, T.X.; Hu, L.L. Temporal-Spatial Characteristics of the vegetation Net Primary Production in the Farming-Pastoral Eco-Tone of southern China During 2005–2014. Res. Soil Water Conserv. 2018, 25, 236–241. [Google Scholar]
  39. Wei, H.; Lu, C.H. Farmland Changes and Their Ecological Impact in the Huangshui River Basin. Land. 2021, 10, 1082. [Google Scholar] [CrossRef]
  40. Feng, Z.M.; Zhang, P.T.; Song, Y. Food security: The impact of land conversion from farmland to forest or grassland on grain production in Northwest China. J. Nat. Resour. 2002, 17, 299–306. [Google Scholar]
  41. Wei, H.; Lu, C.H. Farmland change and its implications in the Three River Region of Tibet during recent 20 years. PLoS ONE 2022, 17, 13. [Google Scholar] [CrossRef] [PubMed]
  42. Dang, Y. Striving to Promote the Construction of Ecological Civilization in Tibet. New Tibet 2018, 25–28. [Google Scholar]
  43. China Statistical Yearbook; China Statistics Publishing House: Beijing, China, 2019.
  44. Major Figures on Population Census of China; China Statistics Publishing House: Beijing, China, 2011.
  45. Major Figures on 2020 Population Census of China; China Statistics Publishing House: Beijing, China, 2020.
  46. Tibet Statistical Yearbook; China Statistics Publishing House: Beijing, China, 2019.
  47. Liu, Y.J.; Lu, S.; Chen, J.; Zhang, J.; Qiu, S.J.; Hu, Y.F.; Ge, Q.S. Spatio-temporal differentiation of agricultural modernization and its driving mechanism on the Qinghai-Tibet Plateau. Acta Geogr. Sin. 2022, 77, 214–227. [Google Scholar]
  48. Jiang, C.; Wang, F.; Mu, X.M.; Li, R. Effect of climate change on net primary productivity (NPP) of natural vegetation in Wei river basin (II). NPP of natural vegetation in Wei river basin. J. Arid Land Resour. Environ. 2013, 27, 53–57. [Google Scholar]
  49. Sun, R.; Zhu, Q.J. Effect of Climate Change of Terrestrial Net Primary Productivity in China. Natl. Remote Sens. Bull. 2001, 5, 58–61, 83. [Google Scholar]
  50. Li, X.B.; Zhu, H.Y.; Tan, M.H.; Xin, L.J. Measurement of Land Use Intensity. Prog. Geogr. 2008, 27, 12–17. [Google Scholar]
  51. Shao, X.M.; Liu, Q.; Zhang, Y.Y. Advances and Expectations of Intensive Land Use Researches. Prog. Geogr. 2006, 25, 85–95. [Google Scholar]
  52. Qiao, X.N.; Gu, Y.Y.; Zou, C.X.; Huang, X.F.; Hu, T. The impact of urban expansion on net primary productivity in the Taihu Lake basin based on nighttime light images. Acta Ecol. Sin. 2018, 38, 5883–5893. [Google Scholar]
  53. Zhang, Y.L.; Liu, L.S.; Wang, Z.F.; Bai, W.Q.; Ding, M.J.; Wang, X.H.; Yan, J.Z.; Xu, E.Q.; Wu, X.; Zhang, B.H.; et al. Spatial and temporal characteristics of land use and cover changes in the Tibetan Plateau. Chin. Sci. Bull. 2019, 64, 2865–2875. [Google Scholar]
  54. Wang, C.L.; Zhang, Y.L.; Wang, Z.F.; Bai, W.Q. Analysis of Landscape Characteristics of the Wetland Systems in the Lhasa River Basin. Resour. Sci. 2010, 32, 1634–1642. [Google Scholar]
  55. Zhang, Y.L.; Li, X.B.; Fu, X.F.; Xie, G.D.; Zheng, D. Urban Land Use Change in Lhasa. Acta Geogr. Sin. 2000, 55, 395–406. [Google Scholar]
  56. Li, Y.Y.; Chen, Q.; Liu, F.G.; Zhou, Q.; Chen, H.G.; Ma, W.D. Analysis on the influencing factors of farmland abandoning behaviers in the northeastern Qinghai-Tibet Plateau: A case study of the upper reaches of Huangshui River. Res. Agric. Mod. 2019, 40, 993–1001. [Google Scholar]
  57. Yang, A.W.; Jia, L.L. A Empirical Study on Tibet’s Agricultural Modernization from the Perspective of Rural Revitalization. J. Tibet Univ. 2019, 34, 147–154. [Google Scholar]
Figure 1. Location of the One River and Two Streams (ORTS) region in the Tibetan Plateau (TP).
Land 11 02223 g001
Figure 2. Farmland area change (a) and its four types (b) at the county level of the ORTS region between 2000 and 2018.
Land 11 02223 g002
Figure 3. Spatial pattern of farmland change in the ORTS region between 2000 and 2018.
Land 11 02223 g003
Figure 4. Inter-annual variation of NPP in unchanged farmland (UF, (a)), ecological restoration (ER, (b)), built-up land occupation (BO, (c)), newly reclaimed farmland (FR, (d)), control zone (e), and the ORTS region (f) from 2000 to 2018.
Land 11 02223 g004
Figure 5. Effects of different area proportions of unchanged farmland (UF, (a)), ecological restoration (ER, (b)), built-up land occupation (BO, (c)), and newly reclaimed farmland (FR, (d)) on the annual average change of NPP in the ORTS region between 2000 and 2018. (Note: The solid line represents the average annual NPP change in pixels with a different area proportion of a certain farmland change type; the dashed line (i.e., the linear trend line) represents the change trend of the average annual NPP change of the corresponding pixel with the increase in the area proportion of a certain type of farmland use change.)
Land 11 02223 g005
Figure 6. Contribution of the four farmland change types to the increase of NPP in the ORTS region between 2000 and 2018.
Land 11 02223 g006
Publisher’s Note: MDPI stays neutral with regard to jurisdictional claims in published maps and institutional affiliations.

