Article

Monitoring Beach Shape Development and Sediment Dynamics on a Sandy Beach with Low Anthropogenic Influence

by
Alain Zuber
1,
María-Carmen Álvarez
1,
Edgar Mendoza
2,*,
Miguel Ángel Díaz-Flores
3,
Marco Galicia-Pérez
1 and
Ernesto Torres-Orozco
4
1
Centro Universitario de Investigaciones Oceanológicas, Universidad de Colima Manzanillo, Colima 28860, Mexico
2
Instituto de Ingeniería, Universidad Nacional Autónoma de México Delegación Coyoacán, Ciudad de México 04510, Mexico
3
Instituto de Geofísica, Universidad Nacional Autónoma de México Delegación Coyoacán, Ciudad de México 04510, Mexico
4
Facultad de Ciencias Marinas, Universidad de Colima Manzanillo, Colima 28860, Mexico
*
Author to whom correspondence should be addressed.
Land 2022, 11(12), 2219; https://doi.org/10.3390/land11122219
Submission received: 18 October 2022 / Revised: 16 November 2022 / Accepted: 26 November 2022 / Published: 6 December 2022
(This article belongs to the Section Land – Observation and Monitoring)

Abstract

:
This study examined the evolution of the beach profile and sedimentary balance in Playa del Coco, Mexico, during one year (September 2013–September 2014) to monitor these conditions at a site with little or no anthropogenic influence. The type of beach profile was determined according to the energy profile of the geomorphology, resulting in three types of profiles: low, medium, and high energy. In addition, sediment volumes were quantified, and erosion or accumulation at each study site was described. The results showed that the medium-energy profile was characteristic of the beach most of the time. High-energy conditions were recorded only once due to the influence of a high-category hurricane (Odile, III) during the hurricane season. The dominant sediment size was medium, moderately well-classified to well-classified, coinciding with the medium-energy profile. Coarse, well-sorted sand was recorded at the end of the study, coinciding with the highest loss of sediment on the beach. Playa del Coco showed a state of quasi-equilibrium before the end of the annual cycle, recovering the characteristics of the beach at the beginning of the study. After that time, there was a great loss of sedimentary material influenced by Hurricane Odile (III), modifying the beach’s state of recovery. Therefore, the stability of this beach could be cyclical and respond to the self-organization principle rather than to seasonal parameters. However, the duration of the cycles that influence Playa del Coco seems to be determined by the hurricane season, especially the combination of two main factors: the proximity to the coast of the hurricane and the amount of rainfall associated with the hurricane.

1. Introduction

The coastal zone is a transitional environment between the ocean and the continents. It is a very complex system where several forces such as waves, winds, currents, and tides simultaneously interact. The morphology of the coast is determined by the balance of these forces. In particular, the shape of the coast is a function of the flux in sedimentary material along the beach and erosion and accumulation cycles. Under stable conditions, sedimentary material is often removed from the beach during storms yet deposited back during mean conditions [1,2,3].
Seasonal changes in beach profiles have been widely evaluated over the last several decades as key determinants of beach evolution over time, e.g., [4,5]. Currently, beach classifications are generally based on grouping areas with similar characteristics, e.g., beaches with sandy bars to barless beaches in micro- to meso-tidal environments subject to moderate- to high-wave energy conditions at a large scale [6,7].
Unfortunately, the anthropogenic influence generates negative impacts on these systems. For example, poor planning in tourism development has a negative impact on the dune-beach system, causing loss of sedimentary material [8]. This study was carried out at Playa del Coco along the western Pacific Coast of Mexico (Figure 1). Playa del Coco is an open ocean beach that is ideal for studying natural coastal processes that directly impact the beach profile, without any topographical feature that transforms or weakens the energy of each process, which does occur on other beaches, as explained in [9,10]. In addition, the anthropogenic influence is low, guaranteeing that the beach profile reflects the balance of natural processes rather than human influence. Specifically, the study focused on the dry beach (dry beach includes foreshore plus backshore) from the first dune cordon to the swash zone (see Section 2.1) and aimed to understand the morphodynamic processes influencing the sedimentary environment. The main objectives were to (1) describe the geomorphological changes to the beach profile, (2) describe the sedimentological variations, (3) quantify the volume of sediment eroded or deposited, and (4) evaluate the recovery time over one year of monitoring.

2. Materials and Methods

The methods used in this study are described below. Field work was carried out to determine the beach profile at sampling stations and to collect sand samples. The sediment size of the samples was analyzed in the laboratory through granulometric analysis in addition to the form of the sediments. The eroded or deposited sediment volumes were also calculated. Finally, an analysis of the hydrometeorological phenomena affecting the beach profile was performed.

2.1. Study Area

Playa del Coco is located near the small town of El Rebalse in the state of Jalisco, Mexico, between the geographical coordinates 104°36′ W to 104°42′ W and 19°09′ N to 19°11′ N (Figure 1). It is 11 km long, extending from the main mouth of the Marabasco River to San Francisco Hill near the town of Isla Navidad [11,12,13].
The closest river to the study area is the Marabasco River, with length of 64 km. The river has one principal mouth and two secondary mouths. The principal mouth flows directly into the Pacific Ocean and is located near the following coordinates: 19°08′57.19″ N–104°35′25.42″ W. The first secondary mouth diverts to the northeast, flowing into the Barra de Navidad Lagoon, and the other secondary mouth diverts 6 km southeast from the principal mouth, flowing into the Pacific Ocean in the vicinity of Playa de Oro near Manzanillo International Airport. In the dry season, a sandbar develops and blocks the main mouth, preventing runoff from reaching the ocean. In the rainy season when runoff increases, the sandbar disappears, and runoff once again reaches the ocean through the main mouth of Marabasco River [11].
Local marine circulation has been described in detail by other researchers e.g., [14,15,16,17]. In general, it presents a direct relationship with the platform slope and seasonal changes [18]. Meyer et al. [13] indicated that cyclones that move near the area during the summer cause strong waves and lead to morphological changes on the beach and, in addition, almost always cause heavy rains that increase river flows, which in turn break the sandy barrier at the mouth of the Marabasco River. Bulgakov and Martinez [17], who made direct measurements, indicated that NW winds dominate in the winter–spring period, causing a general circulation in a southeasterly direction. During the other seasons, southerly wind components are more frequent, causing the circulation to occur in a northwesterly direction. In addition, Meyer et al. [13] indicated that the direction of surface currents along the coast was from southeast to northwest in December and from northwest to southeast in February.
The tide on the coast of Colima is semidiurnal with a range of 70 cm on each tidal day, with the particularity that the second high and low tides are progressively damped [19,20].
The climate of this zone is tropical, type Aw0, according to Köppen’s classification, modified by García [21]. The warm season is from June to October when the average temperature is 31.2 °C, while the rest of the year is 23.0 °C. The rainy season is summer, and the average rainfall is 800 mm/year (Meteorological Station of the Pacific Oceanographic Institute, Office of the Secretary of the Navy) [13,22,23,24].

2.2. Sand Sample and Beach Profiles

Seven sampling stations were established along Playa del Coco based on GPS coordinates, with a distance of 300 m between them (bottom panel of Figure 1). The distance between beach profiles should lead to an error of about 0.5%, following [25]. The beach profile at each station was determined every two months at low tide over a one-year period (September 2013–September 2014). The inflection point was measured from the dune scarp to the swash zone. Since our study focused on the geomorphological analysis of the dry beach, waves and currents were not measured.
Sand samples were also collected every two months (starting September 2013 and ending September 2014) at each sampling station. Superficial sand samples were collected at the dune scarp, scarp of the storm berm, middle of the berm, scarp of the berm, and shoreline at an approximate depth of 5 cm (see Figure A1 in Appendix A). If the storm berm was absent, the sample was collected from the middle berm. Additional samples were collected when a remarkable feature was observed, e.g., shell accumulation, sediment of a different color, etc.

2.3. Granulometric Analysis

This analysis was performed following the ASTM D6913 procedure. The samples were dried in a stainless steel oven at 35–40 °C to avoid salt precipitation and conglomerate formation. Samples of 100 g of sand were obtained using a sample splitter. Next, to determine grain size, the samples were subjected to vibratory movement in a sifter using a series of increasingly larger sieves at quarter-phi intervals of –3.0 to 4.0 Φ, corresponding to medium gravel to very fine sand, respectively.
The mean grain size (1) and sorting (2) were calculated in the GRADISTAT software, version 4, based on the Folk and Ward [26] methodology, which is as follows:
M z = Φ 16 + Φ 50 + Φ 84 3 ,
σ I = Φ 84 Φ 16 4 + Φ 95 Φ 5 6.6 ,
The data were processed in the Surfer 11® software using Kriging interpolation, which is based on statistical auto-correlation. The statistical relationships between points are used to produce a prediction surface and can also provide a measure of the certainty or accuracy of predictions [27,28].

2.4. Beach Profile Analysis

The data obtained from the SOKKIA SET610® total station were processed in Excel 2010®. The beach profiles were georeferenced using the ellipsoidal height of a reference pillar with a height of 5.73 m at El Rebalse, Jalisco, at the coordinates 19°10′37.76101″ N and 104°38′28.88354″ W according to the Instituto Nacional de Estadística y Geografía (INEGI). The geoid height was obtained from the model GGM10 (INEGI) to calculate the orthometric height of each beach profile.
The beach profiles were processed in the MATLAB® software. The volumes were calculated according to V = A P 1 + A P 2 / 2 d , where AP is the area of each beach profile and d is the distance between them (300 m). The erosion or deposition of sediments was calculated bimonthly, considering the first measurements as the initial conditions.
Finally, the beach profiles were classified according to their energetic levels as determined by their geomorphology. The main studies on beach profile classification define two extreme conditions: high energy and low energy, corresponding with sea conditions of storm and calm, respectively. In our study, since the energetic conditions were between both extremes, the beach profiles were classified as moderate energy or as a transitional state (see Appendix A for a more in-depth description).

2.5. Tropical Storms and Hurricanes

The meteorological data were obtained from Manzanillo International Airport at Playa de Oro, with the ID serial MMZO from METAR. The data on wind direction, wind velocity, and rainfall were downloaded from the website Real Pronóstico available at https://rp5.ru/Tiempo_en_Manzanillo (accessed on 10 August 2022) and plotted in the Grapher 8® software. The information on tropical storms and hurricanes was collected from the National Hurricane Center, National Weather Service.

3. Results

The results for the classification of Playa del Coco are described below, including a description of the temporal and spatial characteristics of the beach profiles; the granulometric size and form; and the accumulation or erosion of sedimentary material.

3.1. Temporal and Spatial Variability

The low-energy profile was the least observed, especially in the months of March and July 2014. The high-energy profile was only recorded in September 2014 (Table 1). Conversely, the shape of the beach profile was highly variable at all stations (Figure 2). Notably, a large setback in the shoreline was observed between the months of July and September 2014 at all stations.
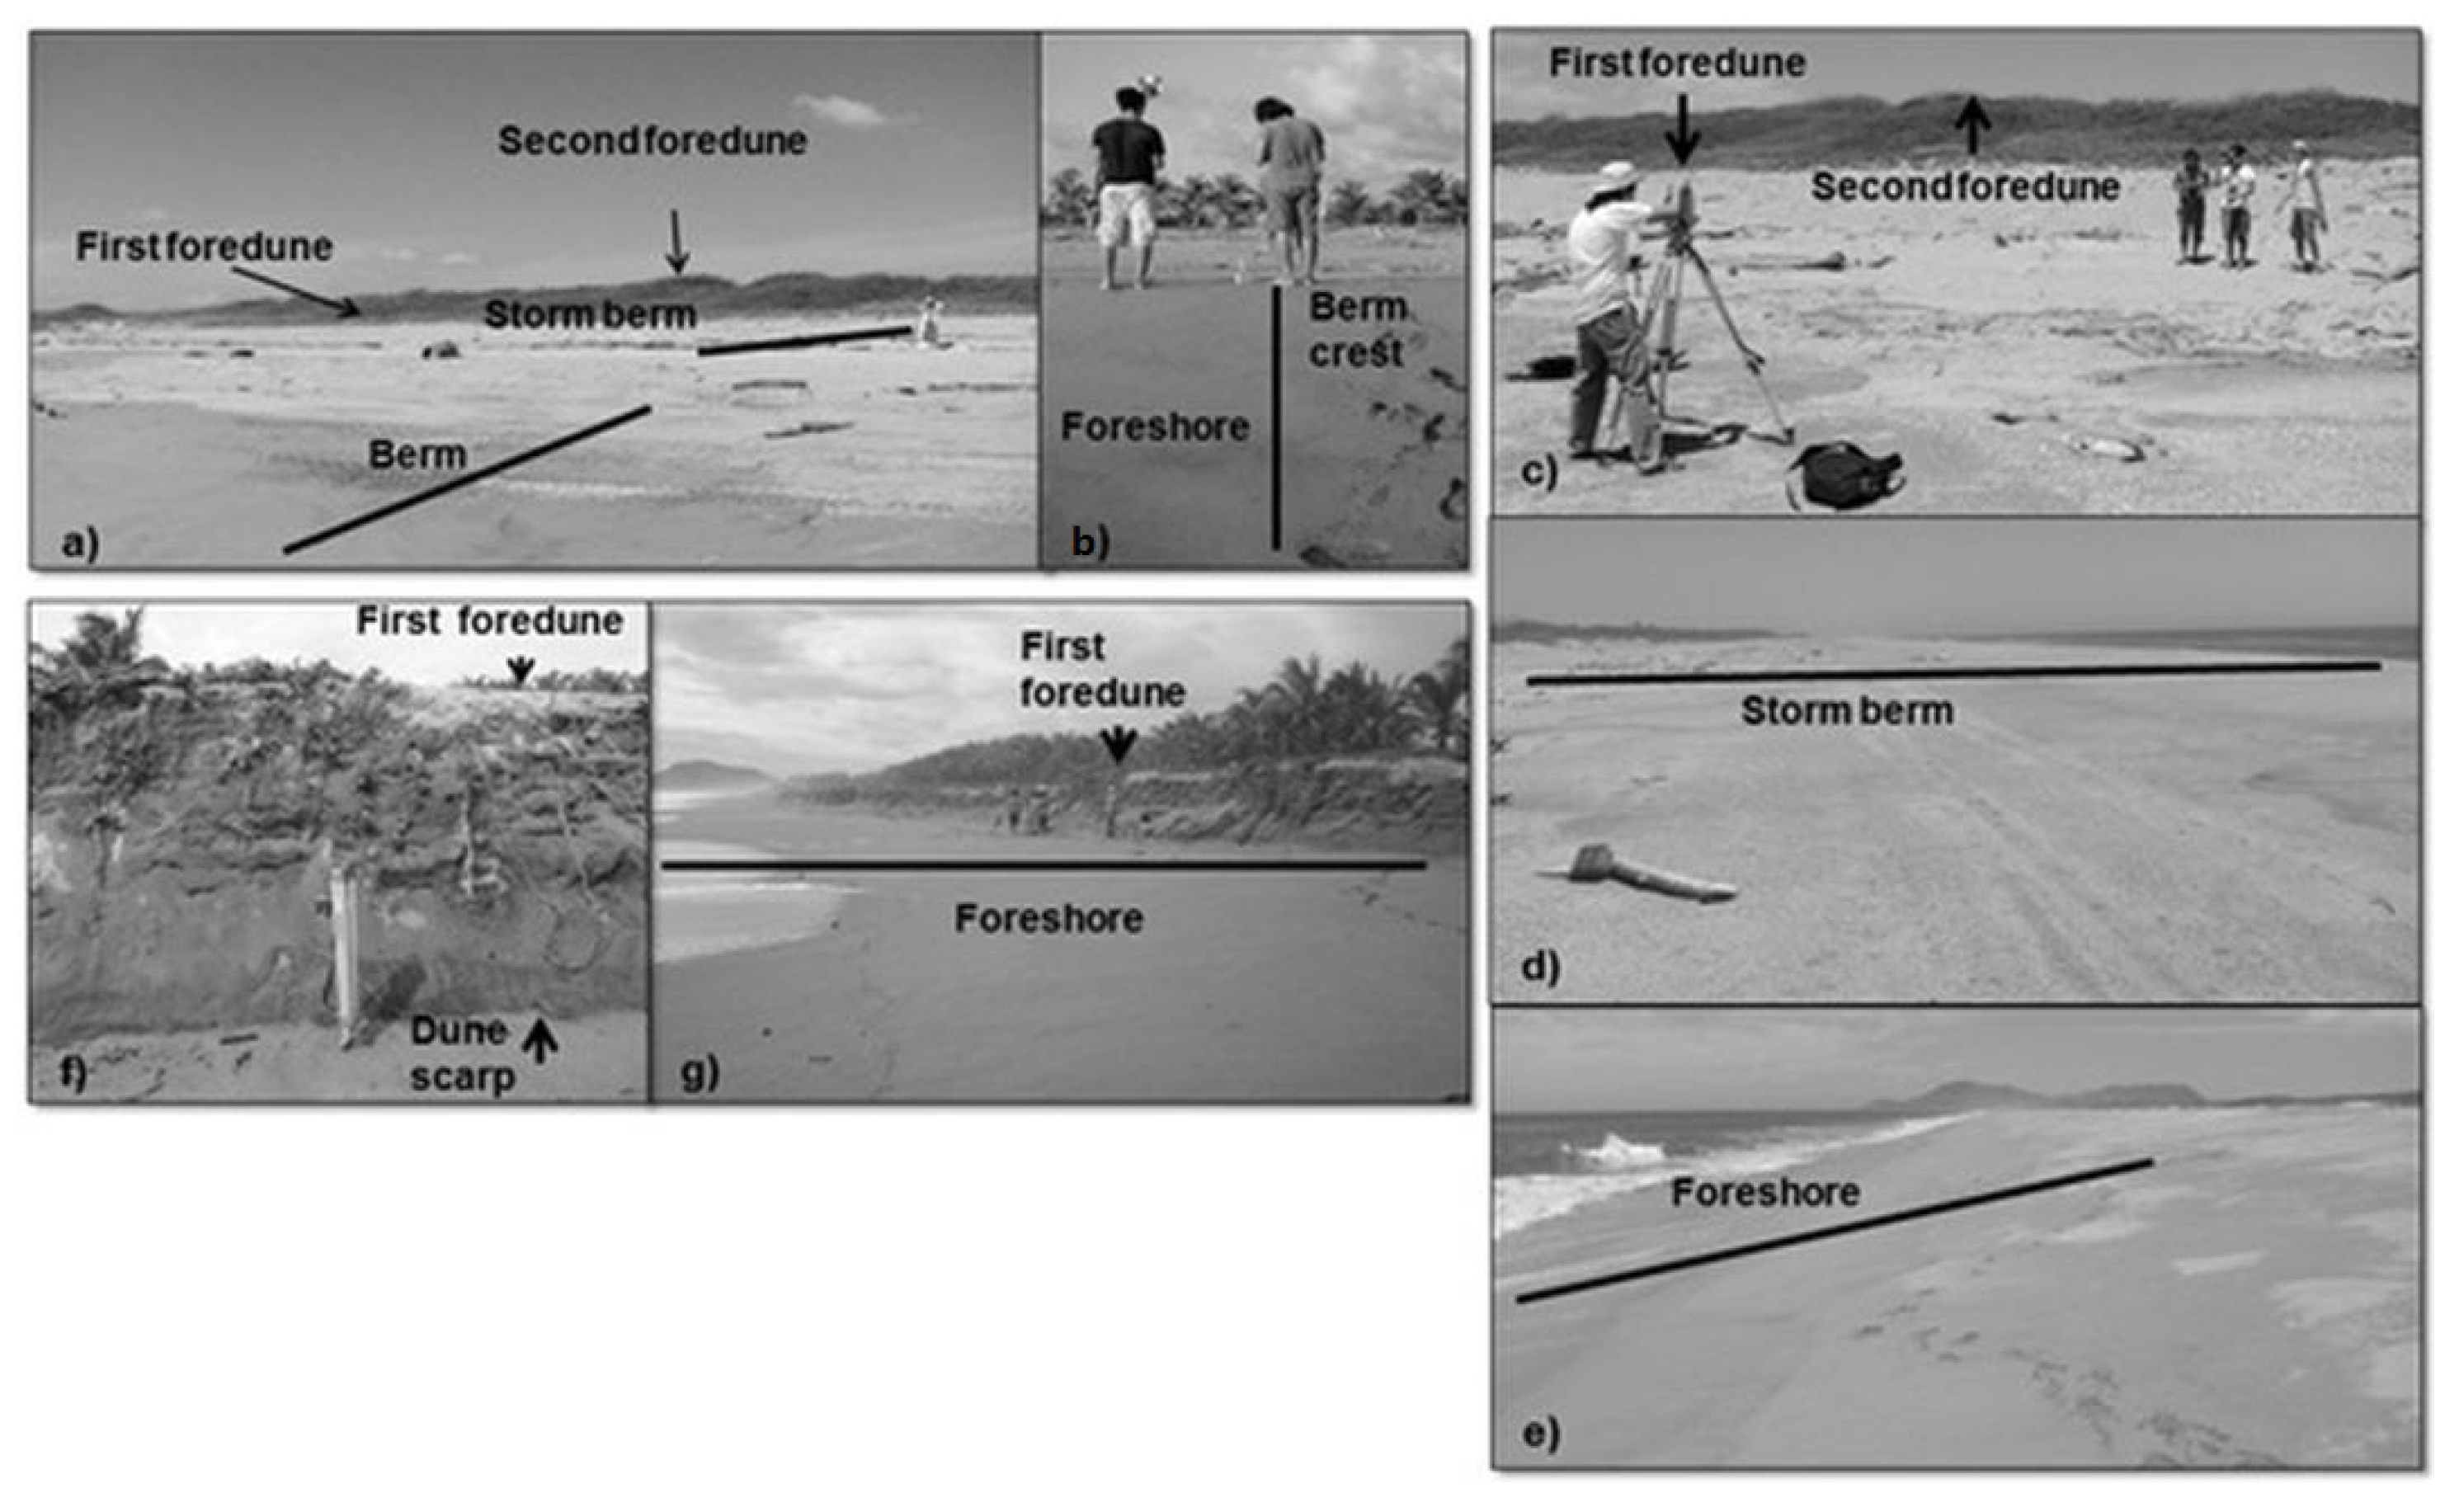
According to Figure A2 (see Appendix A), a low-energy beach profile or reflective beach can be identified when the scarp of the berm marks the beginning of the foreshore and when the remains of previous berms or scarps can be detected in the backshore (Figure A2a,b). The moderate-energy beach profile is characterized by a large storm berm without the remains of previous berms and the presence of a steep slope with the crest of a well-defined berm (Figure A2c–e). The high-energy beach profile is characterized by the presence of geomorphological features produced by the influence of a storm or a hurricane (Figure A2f,g).

3.2. Textural Parameters of Sediment

In September 2013, a clear change of sand from moderately well-sorted to well-sorted was observed at the dune scarp. Over the following months (November, January, and March), medium sand from well-sorted to moderately well-sorted was observed across most of the beach. Only in September 2014 was well-sorted coarse sand observed in the swash zone (Figure 3).

3.3. Erosion Versus Accumulation

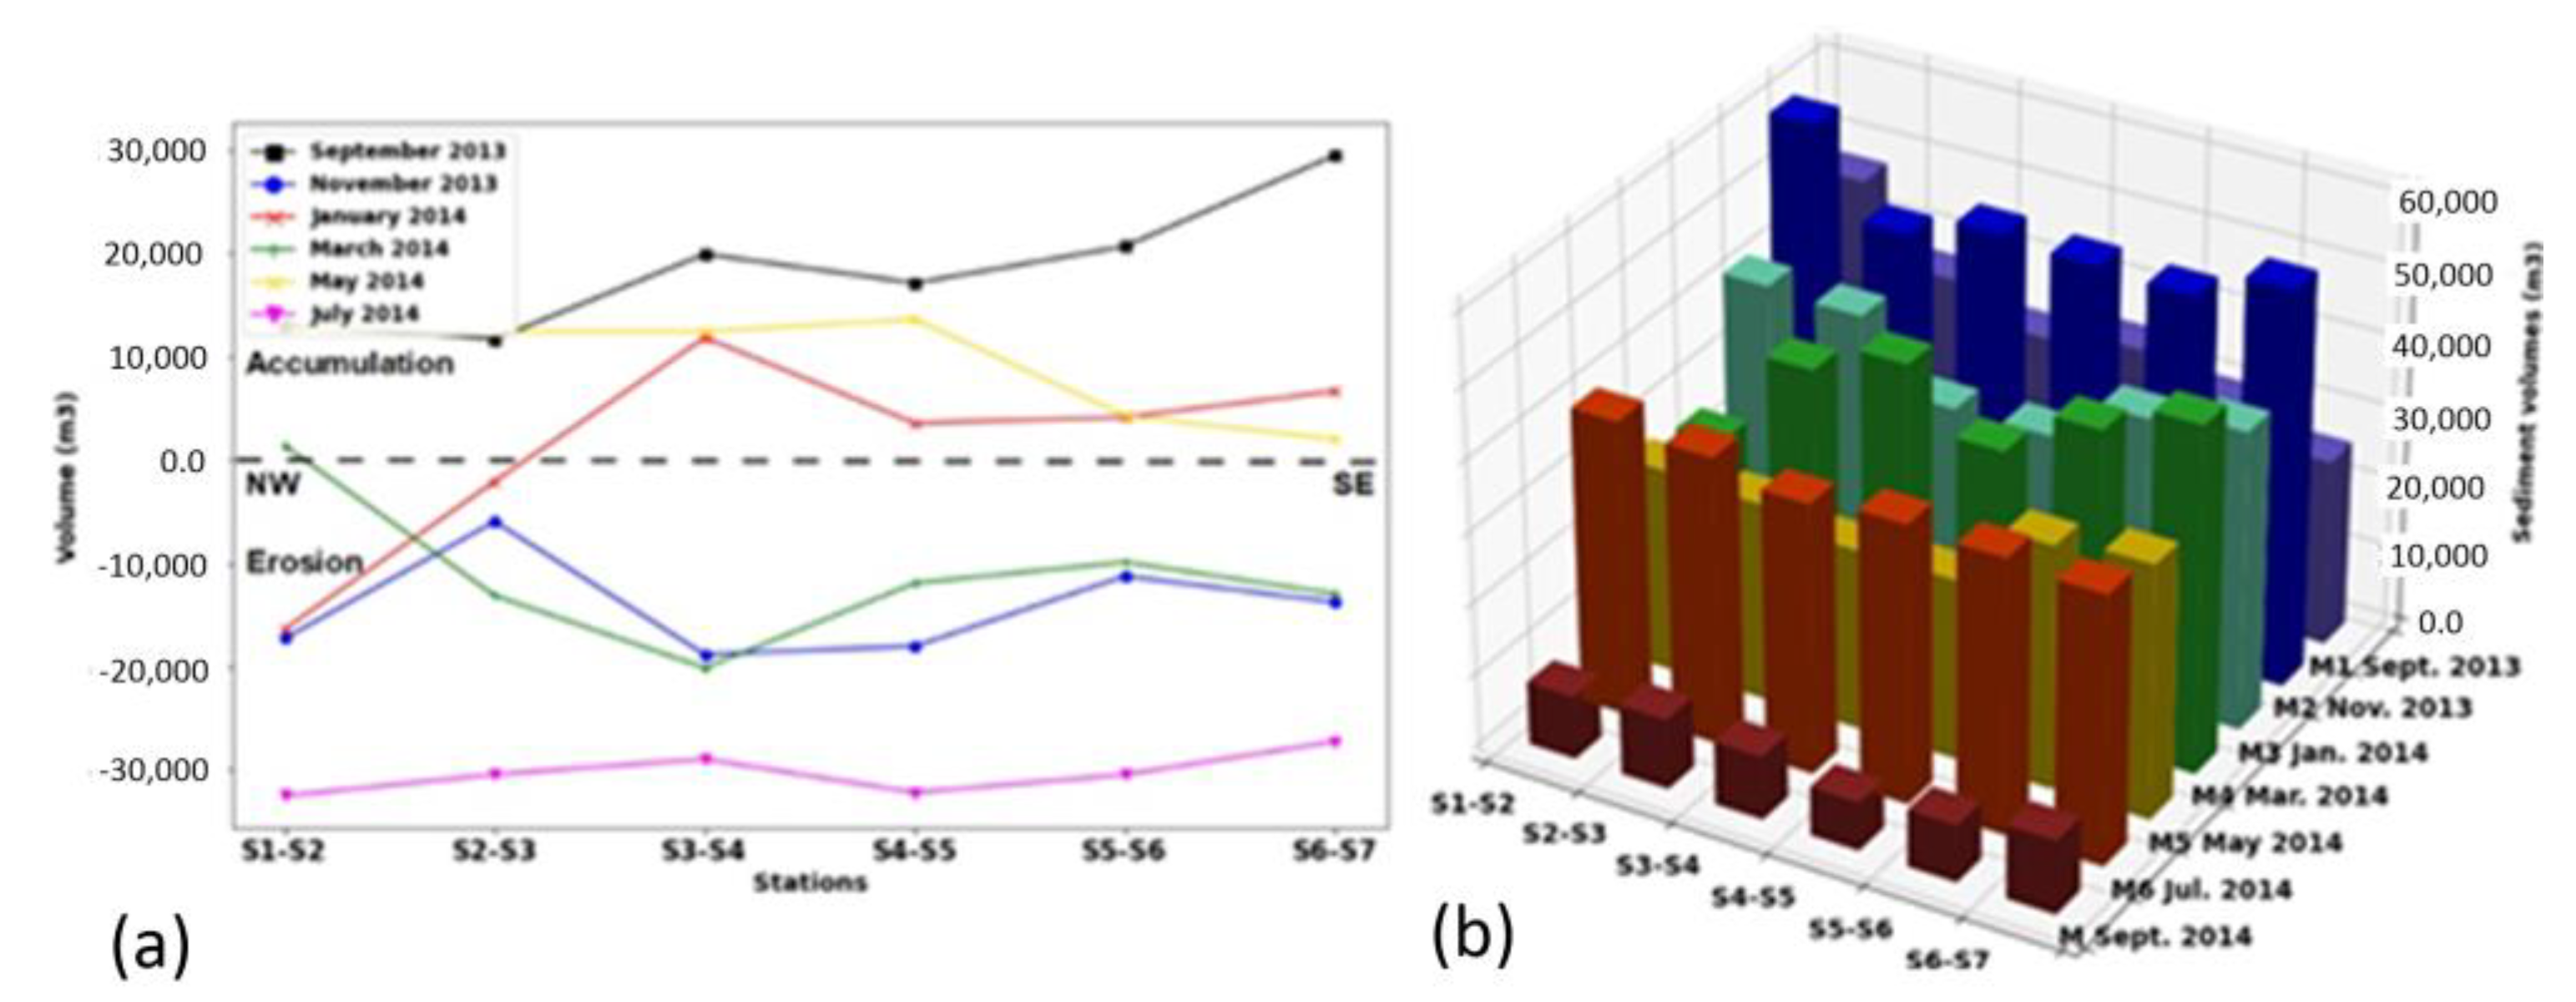
Sediment volumes observed throughout the study are depicted in Figure 4b. The figure indicates a greater variation in volume for M1, M2, and M4, while the remaining months show less variation. They are shown in Table 2. Conversely, it is important to highlight that Figure 4a shows the direction of the littoral drift and therefore the accumulation or erosion of the sediment. The accumulation during September 2013–November 2013, January 2014–March 2014, and May 2014–July 2014 was in the SE direction, coinciding with the direction of the mouth of the Marabasco River.
An analysis of the erosion section shows that from November 2013 to January 2014 and from March 2014 to May 2014, the least affected stations were in the SW direction, while July 2014–September 2014 did not show a defined direction.
In summary, Playa del Coco registered an oscillation between accumulation and erosion of the sediment from the beginning of the study to its end. This phenomenon was more evident between March and July 2014, when the dune-beach system showed sediment volumes similar to those at the beginning of the study. This could indicate a possible quasi-equilibrium.
The sediment volumes observed throughout the study are described in Figure 4a and Table 2. At the beginning of the study, we observed accumulation toward the northwest. In the following months, we observed alternation between accumulation and erosion until July 2014. Notable erosion occurred at all stations in September 2014.
A more detailed analysis showed that the greatest sediment loss occurred in a NW-SE direction. Curiously, analyzing the wind directions shown in Figure 5, the sediment transport did not coincide with the direction of the incident winds (W–E). Conversely, analyzing Table 3, the influence of Tropical Storm Norbert [29], Hurricane Odile [30,31], and Tropical Storm Polo [32,33] could have caused this scenario due to their distance from the coast and its magnitude (see Table 3).

4. Discussion

4.1. Geomorphologic Variation of the Beach Profile

Previous studies highlighted the importance of bathymetric analysis for understanding the morphodynamics of beach states [4,5,34]. Other studies carried out both quantitative and qualitative analyses of dry beaches to characterize beach states based on sedimentary contribution (quantitative) and geomorphology (qualitative), for example [35,36,37]. In addition, beach profiles are often characterized according to relative energy levels, as in our study according to Appendix A (Figure A1 and Figure A2) and the corresponding authors. At Playa del Coco, it was possible to analyze beach profiles over time based on the prevailing conditions (and their frequencies). The moderate-energy profile was dominant, followed by the low-energy profile and an isolated case of a high-energy profile. Playa del Coco can therefore be characterized as a reflective intermediate beach that presents low- and moderate-energy conditions most of the time.
Hesp [38] described the interaction between a dry beach and the winds and found that the energy profile of dry beaches is different from that of wet beaches due to greater wind transport on wider, sandy beaches, leading to greater wind dissipation. He indicated that wet beaches may have an intermediate-reflective beach profile, while dry beaches may have a dissipative profile, which contrasts with the results of our study.

4.2. Relationship between Granulometric Parameters and Wind

Figure 5 shows the wind speeds and directions observed between October 2013 and September 2014. The figure shows a high frequency of winds from the North (N), winds from the West–Southwest (W–SW) greater than 4 m/s, and even winds of up to 15 m/s.
In general, the sediment size and sorting showed some correlation with the incidence and frequency of winds in the study area, especially with wind speeds of 6–15 m/s (relationship between Figure 3 and Figure 5). However, there were times when no correlation was observed, for example, in January and July 2014. According to [35], high-energy levels tend to be more selective of granulometric sediment parameters, while low-energy levels tend to be less selective. Specifically, high-energy levels produce better sorting and coarser sediments, whereas low-energy levels produce poorer sorting and greater variance in sediment size.

4.3. Relationship between Recovery Time and Hydrometeorological Events

Using the initial conditions in September 2013 as the baseline, an accumulation of sedimentary material was observed at all stations by November 2013, which may be associated with rainfall and the influence of Hurricanes Lorena [36,37] and Manuel [36,39]. According to [11] and [13], in the rainy season, the main mouth of Marabasco River opens to the ocean and therefore contributes more sediment to the beach (Table 3).
The loss of sediment from January to May 2014 may be related to the absence of rainfall, as few rainfall events were recorded. During the dry season at the study area, the main mouth of the Marabasco River usually closes, interrupting sediment supply to the beach.
Later accumulation in July 2014 was related to rainfall and the influence of the Amanda [40], Cristina [41,42], Douglas [43,44], and Elida [45,46] phenomena; the periods of influence of these phenomena coincide with periods of higher rainfall at the study stations, as recorded by the meteorological station (Table 3).
The rainfall recorded during the final days of July 2014 could be attributed to the Hernan phenomenon [36]. The highest rainfall of the year was recorded in September 2014 as a result of the Norbert, Odile, and Polo phenomena; we consider that the influence of these latter three phenomena eroded the previously recovered material, contrary to events between May and July 2014, during which the beach experienced a higher sediment contribution.

4.4. Relationship between Alongshore Transport Direction and Winds

A relationship was observed between the direction of accumulation and the incidence of winds, as shown in Figure 4a and Figure 5. The direction of alongshore transport can be deduced from the difference between the deposition and erosion at different stations. As seen in Table 4, in some months this relationship is not evident, for example, from November 2013 to January 2014. According to [47], the main source of energetic changes to beaches is sea waves, where the processes of reflection and dissipation transfer energy to other processes’ modes of movement that, in some cases, may then come to dominate the influence of the waves. These processes may have also had an influence during this period.
The greatest loss of sediment occurred in the NW–SE direction. Interestingly, this direction did not match the direction of the incident winds (W–E). The influence of Tropical Storm Norbert, Hurricane Odile, and Tropical Storm Polo could have caused this scenario.

4.5. Quasi-Equilibrium System

The largest erosion event in Playa del Coco occurred in September 2014. It was probably caused by the influence of Hurricanes Norbert, Odile, and Polo. Therefore, at the end of the study, Playa del Coco reflected a retrograding system.
According to [48], beach vulnerability to erosion can be determined by the zonal vegetation of the dune. Hesp [38] and Short el al. [49] studied the relationship between dry beach geomorphology and dune vegetation cover and defined five morpho-ecological stages. Namely, these stages are: stage 1 (topographically continuous, vegetation cover of 90–100%, and gently undulating); stage 2 (small-scale unvegetated troughs, and vegetation cover of 75–90%); stage 3 (hummocky topography, small- to moderate-size blowouts, and vegetation cover of 45–75%); stage 4 (pronounced topographic variability, moderate to large blowouts, sand sheets, and partially vegetated ridges with cover of 20–45%); and stage 5 (remnant knobs, large-scale deflation basins, blowouts and sheets, and vegetation cover of 5–20%). At Playa del Coco, we observed stage 1 in September and November 2013 and stage 2 in the remaining months. The dune cover during these months oscillated between 75% and 100%. In September 2014, the vegetation cover was in an intermediate state between stage 1 and stage 2. Notably, the degree of alteration produced by Hurricane Odile was lower in areas with greater vegetation cover (Figure 6).
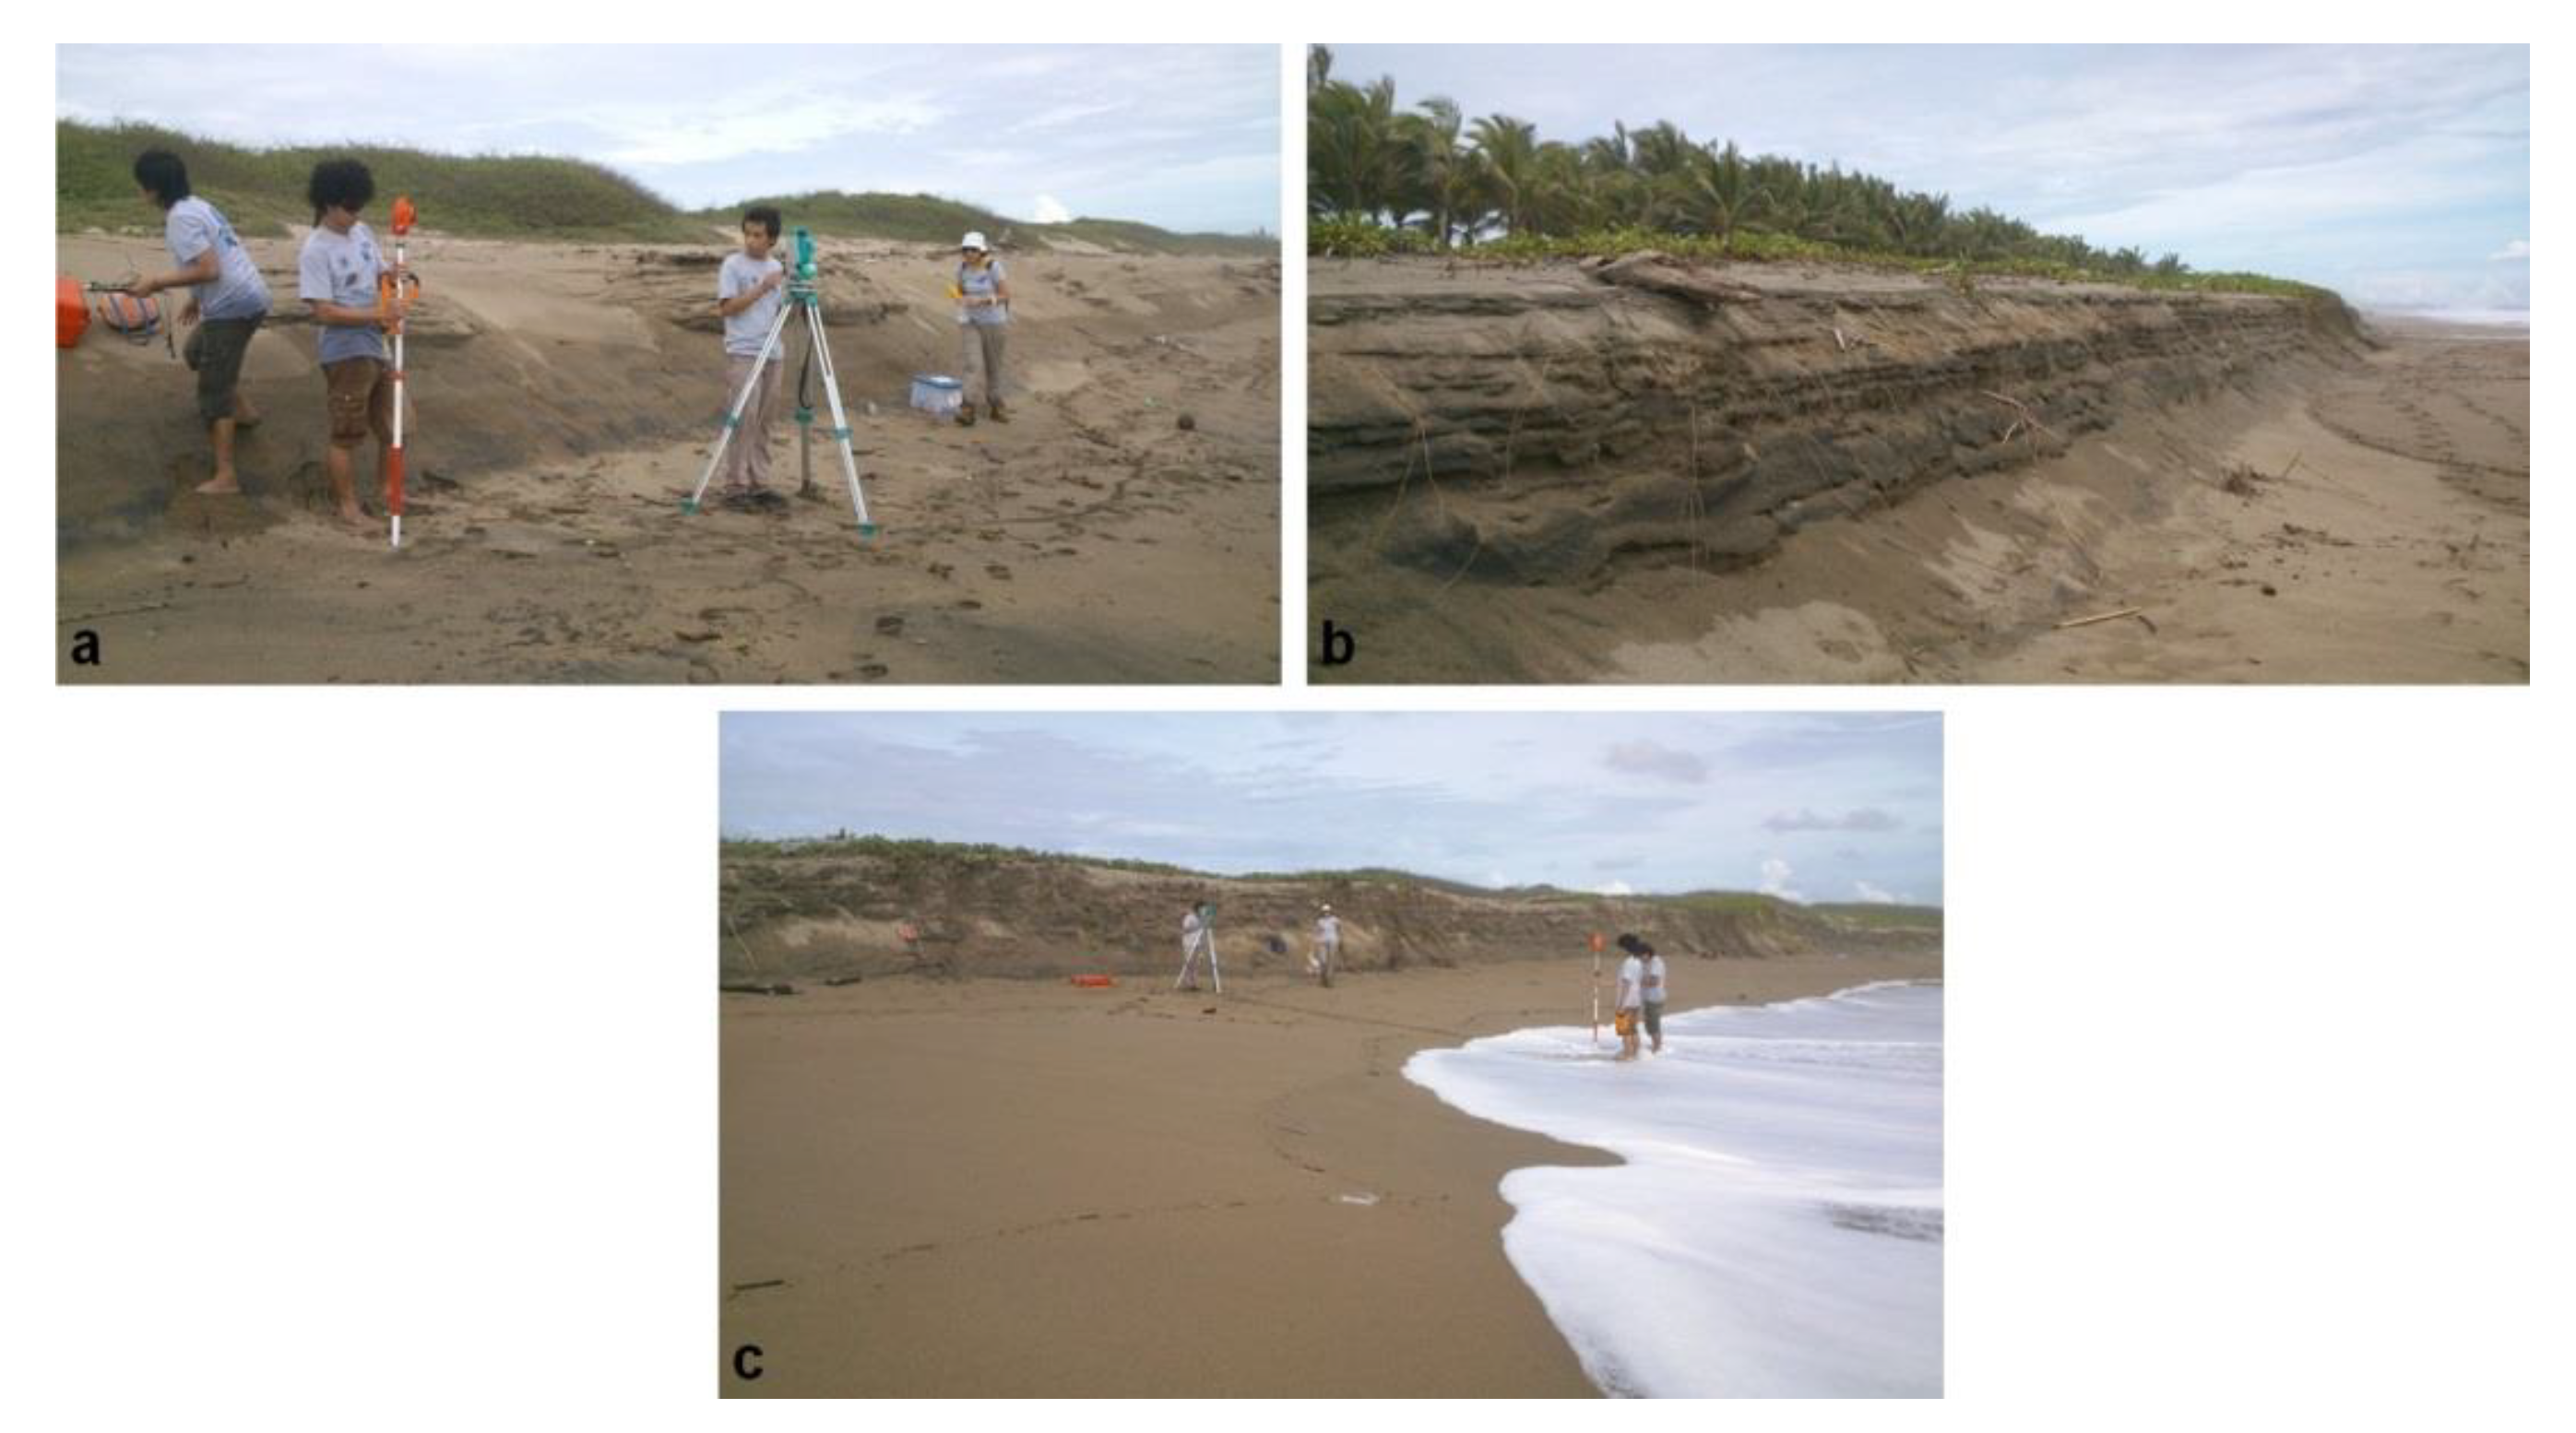
The relationships between the geomorphology and dune vegetation at Playa del Coco are highlighted in Figure 7. In Figure 7a, a high impact on the beach profile and landward sediment was observed at section S1–S2. In Figure 7b, a higher dune scarp and greater dune vegetation cover were observed between sections S3 and S4, relative to section S1–S2. In Figure 7c, the highest dune scarp and vegetation cover were observed between sections S5 and S6.
As evidenced at Playa del Coco, the response of beaches to disturbance is to return to their pre-disturbance state. In this regard, construction and erosion forces associated with the movement of the submerged bar during the different phases of beach evolution are occurring in continual equilibrium [50]. Woodroffe [50], who described accretion–erosion processes at open beaches similar to Playa del Coco found that a metastable equilibrium state was dominant most of the time. This state was similar to the pre-disturbance state (positive feedback) at Playa del Coco, which was followed by occasional states of disturbance (negative feedback).
Because significant changes to a beach profile can occur on a small timescale of days to months, the balance cannot be described as an on-time state. Therefore, our study assumed a certain quasi-equilibrium state where disturbances that modified the beach were followed by a return to the pre-disturbance state or a period of calm [50]. In March and July 2014, the geomorphological energetic profile (qualitative) and sediment volume (quantitative) were very similar, with a small difference in sediment volume between S1–S2 in March 2014.
The self-organization concept described by [51] in reference to the geomorphologic changes occurring in a system, e.g., beach, assumes that more significant changes only occur due to external forces, e.g., tropical storms or hurricanes. After disturbances, the general tendency of systems is to auto-organize and return to their pre-disturbance state. According to the auto-organization concept described by [51], positive interactions were recorded at Playa del Coco from September to November 2013 and in January 2014. The system resisted the agents of change, and beach cups were presented, a clear evidence of resistance to change. Accumulation and erosion occurred between each station, reflecting a dynamic scenario of sediment transport. Meanwhile, negative interactions were registered during March and May 2014. The beach cups disappeared, and a foreshore with a steep slope emerged. The waves directly broke and plunged onto the beach profile. The agents of change at this time were modified or absent, reflecting less dynamic conditions and lower sediment transport.
In July 2014, positive interactions were once again reported. Although an equilibrium state was not recorded between May and July 2014, this state might have been quickly and briefly reached. The relative velocities of the different states strongly depend on the beach state at a particular time and the environmental conditions [49].
However, Playa del Coco showed a quasi-equilibrium state prior to the end of the annual cycle (July 2014), following a large loss of sedimentary material (September 2014). Therefore, the stability of this beach could be cyclical and respond to the self-organization principle rather than to seasonal factors.

5. Conclusions

Playa del Coco is a microtidal beach controlled by swells and can be characterized as a reflective intermediate beach. From September 2013 to July 2014, it had a very steep slope and beach cups at the foreshore. In addition, waves broke directly on the beach profile, causing a beach profile of medium energy in most of the study; this type of profile was registered even in the calm season. Conversely, the high-energy profile was recorded only in the last month of the study, a consequence of hurricane Odile.
The sand of Playa del Coco had a medium grain size and was moderately well-sorted most of the year, matching with the medium-energy beach profile. The high-energy swells caused by tropical storms and hurricanes led to the subsequent dominance of well-sorted coarse sand, matching with the large loss of sedimentary material on the beach at the end of the study.
The geomorphological conditions of Playa del Coco indicate cyclical stability rather than seasonal influence. Therefore, the changes are conditioned by the auto-organization of the beach itself, where sediment gain and loss occur at the same time. This indicates that the loss and gain of sediment is not conditioned by the cycles of storms and calm seasons, unless there is a high-category hurricane at the vicinity of Playa del Coco.
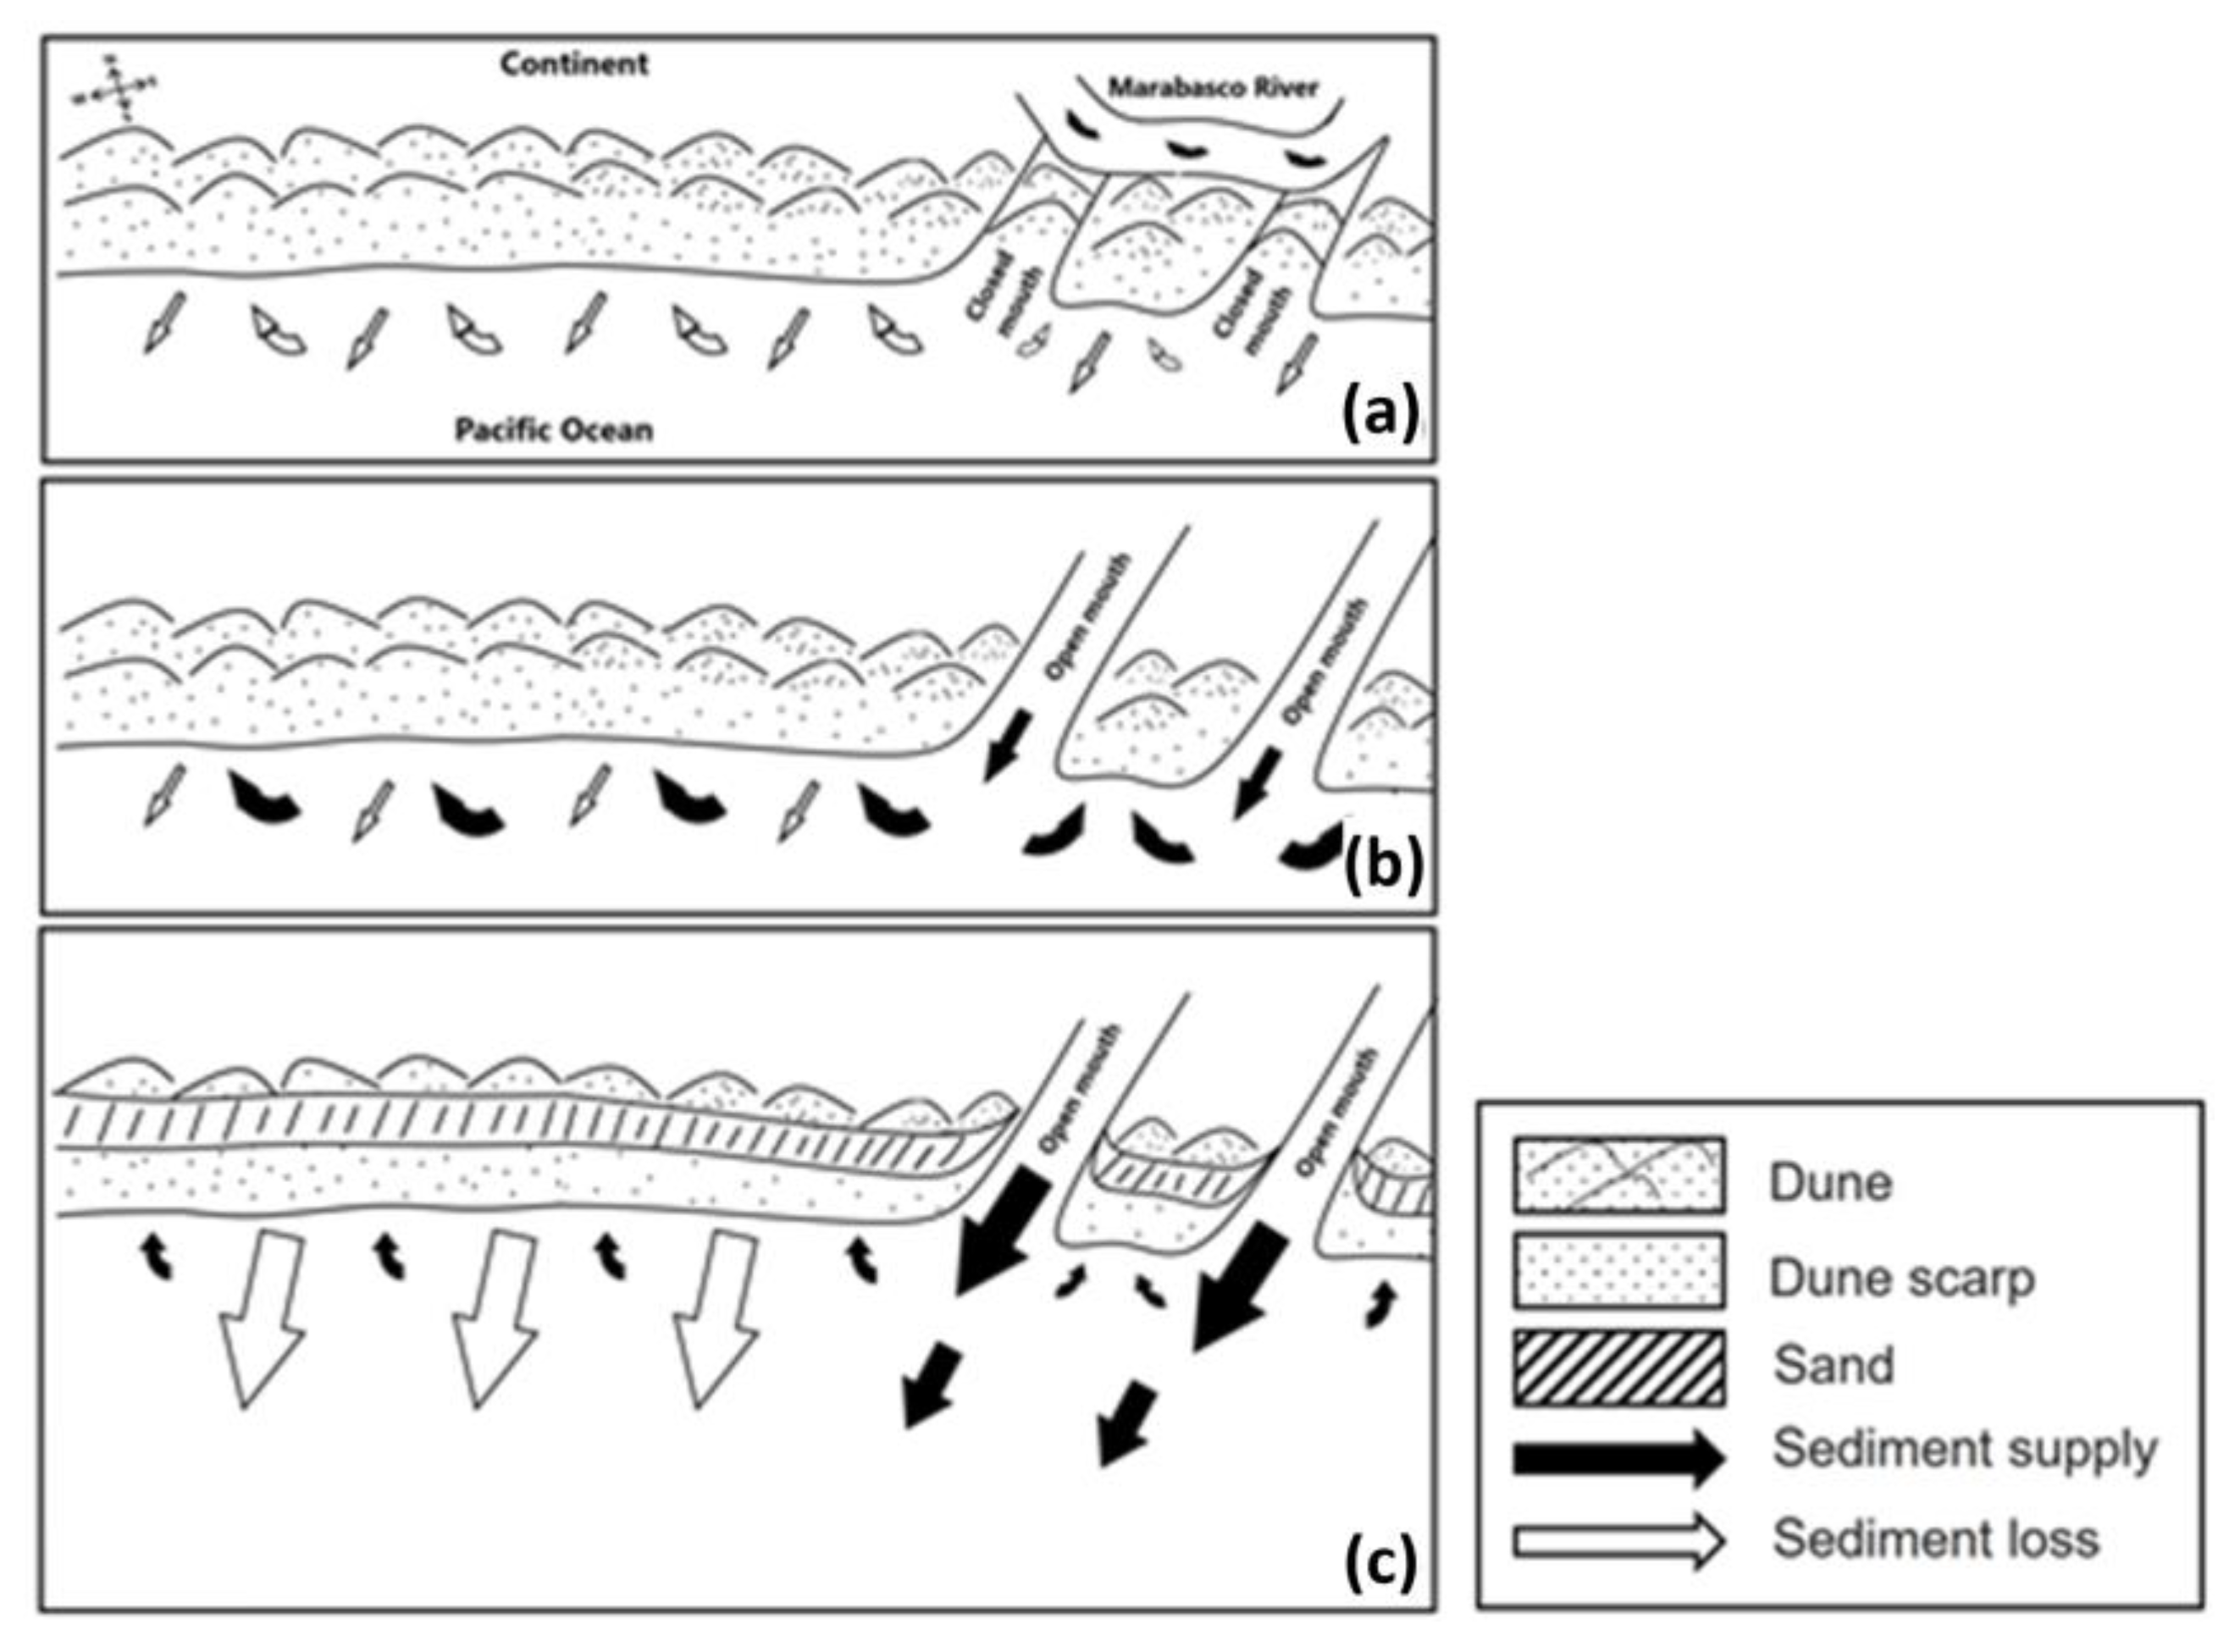
Finally, Playa del Coco registered an oscillation between accumulation and erosion of the sediment; this oscillation could indicate a possible quasi-equilibrium. The sedimentary balance is controlled by the contributions of continental sediments from the Marabasco River, its distribution by coastal/longshore drift, and the influence of energy swells, which exert their maximum influence during the storm season, as depicted in the simple model in Figure 8.
(a)
Low-energy stage: both mouths of the Marabasco River are closed at this time of the year (Meyer et al., 2006) [13]. Therefore, there is no supply of sediment. The processes of erosion and accumulation are carried out with the previously deposited sediment. There is a quasi-equilibrium between the processes of erosion and accumulation.
(b)
Medium-energy stage: both mouths of the Marabasco River are open. There is a large supply of sediment to Playa del Coco. This material is mostly deposited on the beach, although a part of it can go to the ocean. Destructive and constructive processes are present, although the latter dominate over the former.
(c)
High-energy stage: both mouths of the Marabasco River are open, and since the energy of the river and the supply of sediments to Playa del Coco is greater than it is in the medium-energy stage, erosion of the previously deposited material occurs. The loss of sediment on the beach is greater than the supply of the Marabasco River, and it is assumed that a large part of the supply of the Marabasco River could be deposited in submerged sandbars. The first dune cordon disappears.

Author Contributions

Conceptualization, A.Z. and M.-C.Á.; methodology, M.-C.Á. and M.Á.D.-F.; validation, E.M.; formal analysis, M.-C.Á. and E.M.; investigation, A.Z.; resources, E.M.; data curation, A.Z., M.-C.Á. and M.Á.D.-F.; writing—original draft preparation, A.Z. and M.Á.D.-F.; writing—review and editing, M.-C.Á. and E.M.; supervision, M.G.-P. and E.T.-O. All authors have read and agreed to the published version of the manuscript.

Funding

This research was funded by the “Becas Apoyo para la Titulación 2015” grant from the Secretaría de Educación Pública of México, given to A.Z., and by the FRABA 14-2013 project.

Data Availability Statement

Not applicable.

Acknowledgments

We want to thank the Centro Universitario de Investigaciones Oceanológicas (CEUNIVO), University of Colima and the El Rebalse ejido.

Conflicts of Interest

We want to specify that there is no conflict of interest between the authors and other people or organizations that could inappropriately influence or bias the content of this study.

Appendix A

Figure A1. Typical beach profile and collection points of sand samples (image taken from USACE, 1995).
Land 11 02219 g0a1
The low-energy beach profile was established based on the geomorphological classification of de Seoane et al. (2007) and G.O.I.C. (2000). These authors defined a low-energy beach profile or reflective beach as when the scarp of the berm marks the beginning of the foreshore and when the remains of previous berms or scarps can be detected in the backshore (Figure A2a,b). The moderate-energy beach profile is characterized by a large storm berm without the remains of previous berms and the presence of a steep slope with the crest of a well-defined berm (Figure A2c–e). The high-energy beach profile is characterized by the presence of geomorphological features produced by the influence of a storm or a hurricane (Figure A2f,g).
Figure A2. (a,b) Low-energy beach profile; (ce) moderate-energy beach profile; (f,g) high-energy beach profile.
Land 11 02219 g0a2

References

  1. Cabrera-Ramirez, M.; Carranza-Edwards, A. The beach environment in Mexico as a potential source of placer minerals. Mar. Georesources Geotechnol. 2002, 20, 187–198. [Google Scholar] [CrossRef]
  2. Tarbuck, J.; Lutgens, F.; Tasa, D. Aguas subterráneas. In Ciencias de la Tierra: Una Introducción a la Geología Física, 11th ed.; Martín-Romo, M., Vázquez, M., Eds.; Pearson/Prentice Hall: Madrid, Spain, 2013; pp. 559–572. [Google Scholar]
  3. U.S. Army Corps of Engineers. Coastal Geology, 1st ed.; U.S. Army Corps of Engineers: Washington, DC, USA, 1995; p. 297. [Google Scholar]
  4. Larson, M.; Kraus, N.C. Temporal and spatial scales of beach profile change, Duck, North Carolina. Mar. Geol. 1994, 117, 75–94. [Google Scholar] [CrossRef]
  5. Nordstrom, C.E.; Inman, D.L. Sand Level Changes on Torrey Pines Beach, California; USACE: Norfolk, VA, USA, 1975; 176p. [Google Scholar]
  6. Quesada-Roman, A.; Pérez-Briceño, P.M. Geomorphology of the Caribbean coast of Costa Rica. J. Maps 2019, 15, 363–371. [Google Scholar] [CrossRef]
  7. Nicolae Lerma, A.; Castelle, B.; Marieu, V.; Robinet, A.; Bulteau, T.; Bernon, N.; Mallet, C. Decadal beach-dune profile monitoring along a 230-km high-energy sandy coast: Aquitaine, southwest France. Appl. Geogr. 2022, 139, 102645. [Google Scholar] [CrossRef]
  8. González, J.; Silva, R.; Mendoza, E.; Delgadillo, A. Towards coastal management of a degraded system: Barra de Navidad, Jalisco, Mexico. J. Coast. Res. 2014, 71 (Suppl. S1), 107–113. [Google Scholar] [CrossRef]
  9. Bernabeu-Tello, A.M.; Muiñoz-Pérez, J.J.; Medina-Santamaría, R. Influence of a rocky platform in the profile morphology: Victoria Beach, Cadiz (Spain). Cienc. Mar. 2002, 28, 181–192. [Google Scholar] [CrossRef]
  10. Gallop, S.L.; Kennedy, D.M.; Loureriro, C.; Naylor, L.A.; Muñoz-Pérez, J.J.; Jackson, D.W.T.; Fellowes, T.E. Geologically controlled sandy beaches: Their geomorphology, morphodynamics and classification. Sci. Total Environ. 2020, 731, 139123. [Google Scholar] [CrossRef]
  11. Comisión Nacional del Agua. Respuesta a Solicitud de Acceso a la Información: Organismo de Cuenca Lerma- Santiago- Pacífico; Comisión Nacional del Agua: Jalisco, Mexico, 2011. [Google Scholar]
  12. Fregoso, J.L. Resolución Presidencial en el Expediente de Dotación de Ejidos al Poblado de EL REBALSE, Municipio de Cihuatlan, Jalisco; Registro Agrario Nacional: Mexico City, Mexico, 1945. [Google Scholar]
  13. Meyer, A.; Vargas, R.; Galicia, M. Caracterización y transporte de sedimentos en la costa Norte de Colima. In Los Recursos Pesqueros y Acuícolas de Jalisco, Colima y Michoacán, 1st ed.; Jiménez-Quiroz, M., Espino-Barr, E., Eds.; SAGARPA: Manzanillo, Mexico, 2006; pp. 60–80. [Google Scholar]
  14. Gaviño, J.; Galicia, M. Estudio de refracción de oleaje y de oscilaciones del nivel del agua (seiches) en el Puerto Interior de San Pedrito, Manzanillo Colima. GEOS 1995, 15, 16–17. [Google Scholar]
  15. Galicia, M.; Gaviño, J. Estudio numérico de refracción de oleaje y circulación en la costa de Colima. GEOS 1996, 16, 256. [Google Scholar]
  16. Galicia, M.; Gaviño, J.; Torres, E.; Sánchez, M. Condiciones hidrológicas y de circulación en el litoral de Colima durante el año 2002. In Los Recursos Pesqueros y Acuícolas de Jalisco, Colima y Michoacán, 1st ed.; Jiménez-Quiroz, M., Espino-Barr, E., Eds.; SAGARPA: Manzanillo, Mexico, 2006; pp. 41–50. [Google Scholar]
  17. Bulgakov, S.; Martínez Zatarain, A. Surgencia y vientos favorables en la costa oriental del Pacífico mexicano. In Los Recursos Pesqueros y Acuícolas de Jalisco, Colima y Michoacán, 1st ed.; Jiménez-Quiroz, M., Espino-Barr, E., Eds.; SAGARPA: Manzanillo, Mexico, 2006; pp. 29–40. [Google Scholar]
  18. Olivos, A.; Salas, J.; García, G.; Galicia, M.; Torres, E.; Quijano, S. Distribución horizontal de nutrientes y clorofila-a sobre la plataforma continental del estado de Colima durante 2002. In Los Recursos Pesqueros y Acuícolas de Jalisco, Colima y Michoacán; Jiménez Quiroz, M.C., Espino Barr, E., Eds.; SAGARPA: Manzanillo, Mexico, 2006; pp. 55–65. [Google Scholar]
  19. Gámez, E. Aplicaciones de Cómputo Para Determinar la Hidrodinámica Aledaña a los Estados de Jalisco y Colima. Master’s Thesis, Universidad de Colima, Manzanillo, Mexico, 1998. [Google Scholar]
  20. Secretaría de Marina. Estudio geográfico de la región de Manzanillo Colima; Secretaría de Marina: Mexico City, Mexico, 1973. [Google Scholar]
  21. García, E. Modificaciones al Sistema de Clasificación Climática de Koppen; Instituto de Geografía, UNAM: Ciudad de México, Mexico, 1964; 96p. [Google Scholar]
  22. Magaña, V.; Amador, J.A.; Medina, S. The midsummer drought over Mexico and Central America. J. Clim. 1999, 12, 1577–1588. [Google Scholar] [CrossRef]
  23. Quijano, S.; Vidaurri, A. Evaluación de parámetros fisicoquímicos y productividad primaria en las bahías y lagunas de Manzanillo. IOM SEMAR 1987, 115. [Google Scholar]
  24. Trasviña, A.; Lluch-Cota, D.; Filonov, A.E.; Gallegos, A. Oceanografía y El Niño. In Los Impactos de El Niño en México, 1st ed.; Magaña, E., Ed.; Centro de Ciencias de la Atmósfera, UNAM: Mexico City, Mexico, 1999; 228p. [Google Scholar]
  25. Muñoz-Pérez, J.J.; Payo, A.; Roman-Sierra, J.; Navarro, M.; Moreno, L. Optimization of beach profile spacing: An applicable tool for coastal monitoring. Sci. Mar. 2012, 76, 791–798. [Google Scholar] [CrossRef] [Green Version]
  26. Folk, R.L.; Ward, W.C. Brazos River bar: A study in the significance of grain size parameters. J. Sediment. Res. 1957, 27, 3–26. [Google Scholar] [CrossRef]
  27. Oliver, A.; Webster, R. Kriging: A method of interpolation for geographical information systems. Int. J. Geogr. Inf. Syst. 1990, 4, 313–332. [Google Scholar] [CrossRef]
  28. Royle, G.; Clausen, L.; Frederiksen, P. Practical universal kriging and automatic contouring. Geoprocessing 1981, 1, 377–394. [Google Scholar]
  29. Avila, L. Hurricane Norbert; National Hurricane Center: Miami, FL, USA, 2014. [Google Scholar]
  30. Bravo, C. Reseña del Huracán “Odile” del Océano Pacífico; Servicio Meteorológico Nacional: Ciudad de México, México, 2014. [Google Scholar]
  31. Cangialosi, J.; Kimberlain, T. Hurricane Odile; National Hurricane Center: Miami, FL, USA, 2015. [Google Scholar]
  32. Berg, R. Hurricane Polo; National Hurricane Center: Miami, FL, USA, 2014. [Google Scholar]
  33. Trejo, L. Reseña del Huracán “Polo” del Océano Pacífico; Servicio Meteorológico Nacional: Ciudad de México, México, 2014. [Google Scholar]
  34. Aleman, N.; Robin, N.; Certain, R.; Anthony, E.J.; Barusseau, J.P. Longshore variability of beach states and bar types in a microtidal, storm-influenced, low-energy environment. Geomorphology 2015, 241, 175–191. [Google Scholar] [CrossRef]
  35. Morton, A.; Paine, G.; Gibeaut, C. Stages and durations of post-storm beach recovery, southeastern Texas coast, USA. J. Coast. Res. 1994, 10, 884–908. [Google Scholar]
  36. Albanil, A.; Pascual, R.; López, M.; Martínez, J. Reporte Anual; CONAGUA: Ciudad de México, México, 2013. [Google Scholar]
  37. Blake, E. Tropical Storm Lorena; National Hurricane Center: Miami, FL, USA, 2014. [Google Scholar]
  38. Hesp, P. Surfzone, beach, and foredune interactions on the Australian South East Coast. J. Coast. Res. 1988, SI 3, 15–25. [Google Scholar]
  39. Pasch, R.; Zelinsky, D. Hurricane Manuel; National Hurricane Center: Miami, FL, USA, 2014. [Google Scholar]
  40. Stewart, S. Hurricane Amanda; National Hurricane Center: Miami, FL, USA, 2014. [Google Scholar]
  41. Blake, E. Hurricane Cristina; National Hurricane Center: Miami, FL, USA, 2014. [Google Scholar]
  42. Bravo, C. Reseña del Huracán “Cristina” del Océano Pacífico; Servicio Meteorológico Nacional: Ciudad de México, México, 2014. [Google Scholar]
  43. Díaz, J. Reseña de la Tormenta Tropical “Douglas” del Océano Pacífico; Servicio Meteorológico Nacional: Ciudad de México, México, 2014. [Google Scholar]
  44. Pasch, R. Tropical Storm Douglas; National Hurricane Center: Miami, FL, USA, 2015. [Google Scholar]
  45. Avila, L. Tropical Storm Elida; National Hurricane Center: Miami, FL, USA, 2014. [Google Scholar]
  46. Díaz, J. Reseña de la Tormenta Tropical “Elida” del Océano Pacífico; Servicio Meteorológico Nacional: Ciudad de México, Mexico, 2014. [Google Scholar]
  47. Vidal, C.; Losada, Á.; Medina, R.; Losada, J. Modelos de morfodinámica de playas. Ing. Del Agua 1995, 2, 55–62. [Google Scholar] [CrossRef] [Green Version]
  48. Durán, O.; Moore, L.J. Vegetation controls on the maximum size of coastal dunes. Proc. Natl. Acad. Sci. USA 2013, 110, 17217–17222. [Google Scholar] [CrossRef] [Green Version]
  49. Short, D.; Hesp, A. Wave, beach and dune interactions in southeastern Australia. Mar. Geol. 1982, 48, 259–284. [Google Scholar] [CrossRef]
  50. Woodroffe, D. The Natural Resilience of Coastal Systems: Primary Concepts; University of Wollongong: Wollongong, Australia, 2007. [Google Scholar]
  51. Werner, T.; Fink, M. Beach cusps as self-organized patterns. Science 1993, 260, 968–971. [Google Scholar] [CrossRef] [PubMed]
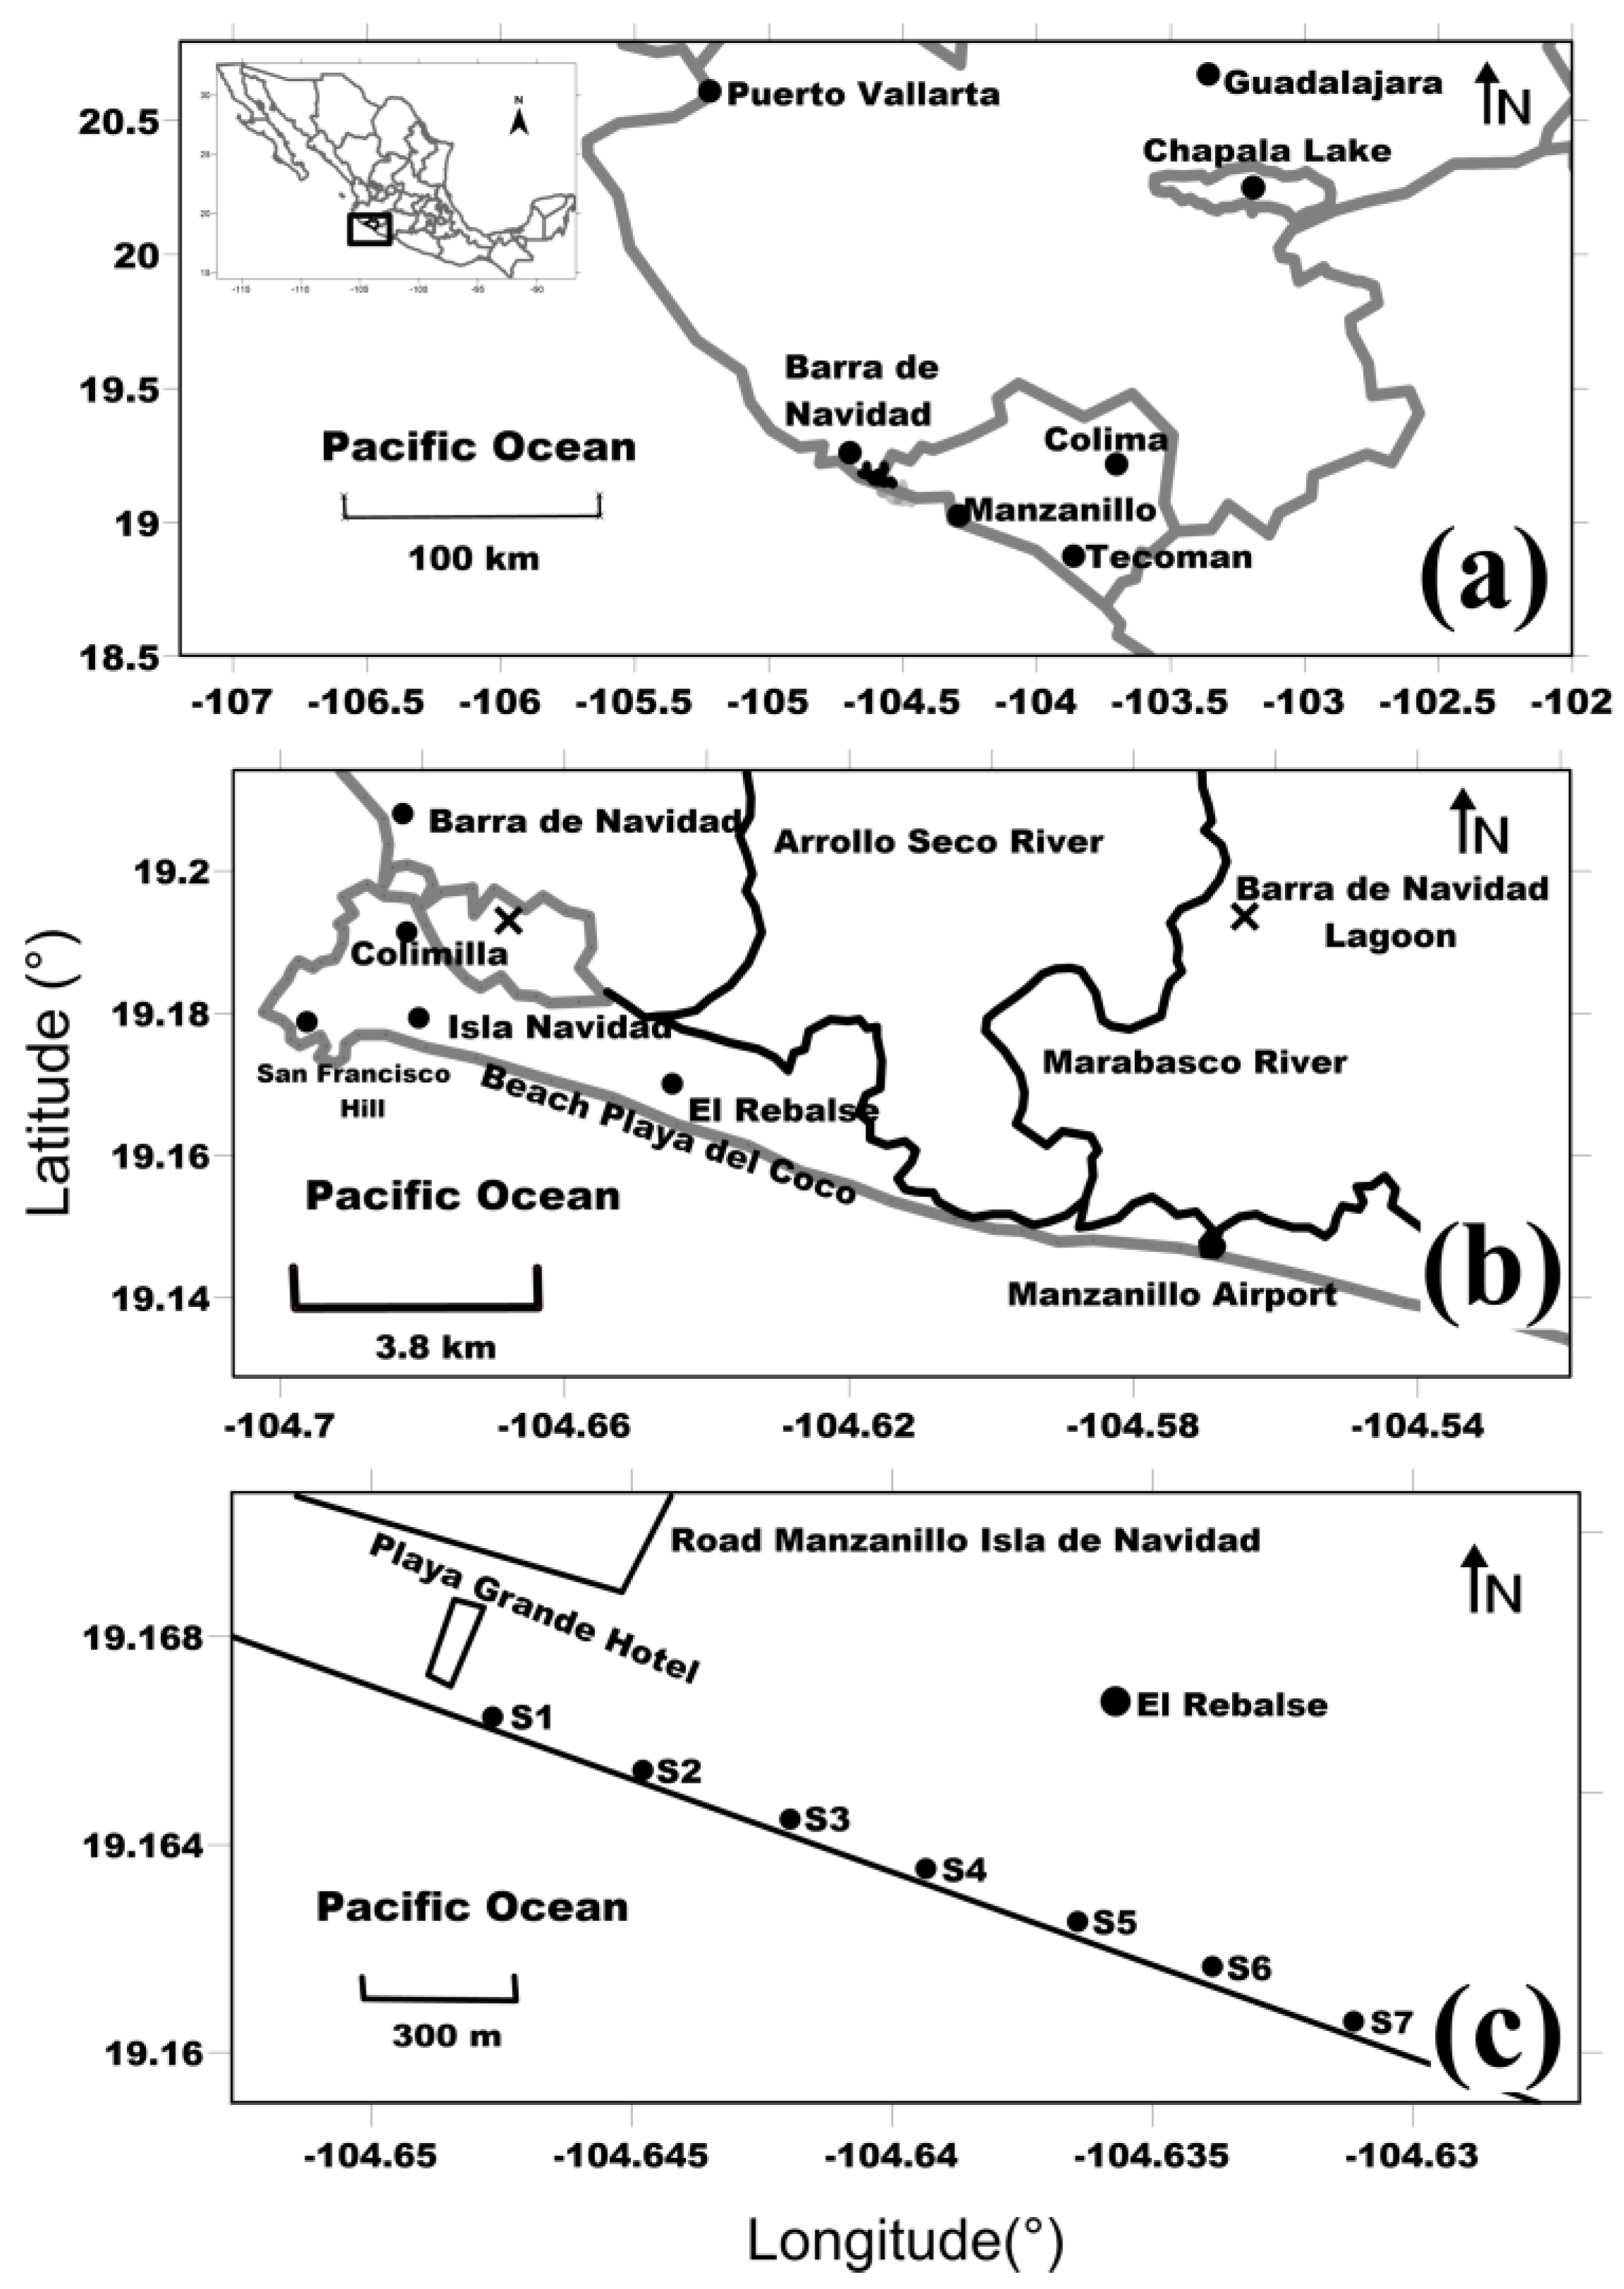
Figure 1. (a) Location of Playa del Coco along the Pacific Coast. (b) Location of Playa del Coco with respect to Colimilla and Manzanillo Airport. (c) Location of the seven sampling stations. Study area of Playa del Coco depicting the mouths of the Marabasco River and the seven sampling stations. A previous design of the sampling points was carried out using a GPS, establishing a distance between points of 300 m.
Land 11 02219 g001
Figure 2. Beach profiles recorded at sampling stations from September 2013–September 2014. For more information about the energy beach profile classification, see Table 1 and the Appendix A.
Land 11 02219 g002
Figure 3. Mean sediment size and sorting recorded bimonthly from September 2013 to September 2014. Left panel; size legend bar: VCS (very coarse sand), CS (coarse sand), MS (medium sand), and FS (fine sand). Right panel; sorting legend bar: WS (well-sorted), MWS (moderately well-sorted), MOS (moderately sorted), and PS (poorly sorted).
Land 11 02219 g003
Figure 4. (a) Sediment volumes eroded or accumulated between sampling stations, and (b) sediment volumes between sampling stations with respect to the initial conditions in September 2013.
Land 11 02219 g004
Figure 5. Wind roses recorded every two months from the Manzanillo International Airport meteorological station.
Land 11 02219 g005
Figure 6. Vegetation cover on the foredunes in (a) September 2013, (b) November 2013, (c) January 2013, (d) March 2014, (e) May 2014, and (f) July 2014. The presence of high vegetation cover rates provided resistance and resilience to the dune-beach system when Hurricane Odile occurred.
Land 11 02219 g006
Figure 7. Dune scarps (steps) and vegetation cover at sections (a) S1–S2, (b) S3–S4, and (c) S5–S6 after Hurricane Odile.
Land 11 02219 g007
Figure 8. Playa del Coco: schematic morphodynamic functioning model. (a) Low energy, (b) medium energy, and (c) high energy. In all cases, the size of the arrow denotes the intensity of the event.
Land 11 02219 g008
Table 1. Energy beach profile classification: high (H), middle (M), and low (L).
StationM1
September 2013
M2
November 2013
M3
January 2014
M4
March 2014
M5
May 2014
M6
July 2014
M7
September 2014
S1LLLMMMH
S2LMLMLMH
S3MMLMMMH
S4MLMMMMH
S5MMMMLMH
S6MMLMMMH
S7MLLMLMH
Table 2. Sediment volumes in m3 registered among the stations. The volumes were calculated according to V = A P 1 + A P 2 / 2 d , where AP is the area of each beach profile and d is the distance between them (300 m).
StationM1
September 2013
M2
November 2013
M3
January 2014
M4
March 2014
M5
May 2014
M6
July 2014
M7
September 2014
S1–S247,83660,85043,57527,19828,52741,3628850
S2–S337,32949,00843,05140,99027,86140,2649826
S3–S432,32952,49833,67045,52025,39937,8218874
S4–S534,63051,74733,72337,27625,36638,9796793
S5–S630,48451,15739,91844,04634,14938,4347974
S6–S726,14355,62941,86648,52535,55937,55510,323
Table 3. Main hydrometeorological events drove morphodynamic changes. Details below are from the National Hurricane Center, National Service Weather.
Sampling DateNameDurationMinimal Distance to Study AreaTypeWind Speed
M1
September 2013
Lorena5–7 September 2013232 km SW from ManzanilloTropical Storm83 km/h
Manuel13–19 September 2013509 km SE from ManzanilloHurricane (I)120 km/h
M2
November 2013
Calm season
M3
January 2014
Calm season
M4
March 2014
Calm season
M5
May 2014
Amanda22–29 May 20141005 km SE from ManzanilloHurricane (III)195 km/h
M6
July 2014
Cristina9–16 June 2014375 km SSW from ManzanilloHurricane (II)155 km/h
Douglas28 June—5 July 2014525 km SSW from ManzanilloTropical Storm55 km/h
Elida30 June—2 July 2014195 km SSE from ManzanilloTropical Storm85 km/h
Hernan26–29 July 2014580 km SW from ManzanilloTropical Storm85 km/h
Karina13–26 August 2014370 km SW from ManzanilloTropical Depression 55 km/h
Marrie21–29 August 2014555 km SSW from ManzanilloHurricane (I)148 km/h
M7
September 2014
Norbert2–8 September 2014230 km W from ManzanilloTropical Storm75 km/h
Odile10–18 September 2014260 km W from ManzanilloHurricane (III)175 km/h
Polo16–22 September 2014215 km W from ManzanilloTropical Storm110 km/h
Table 4. Net sediment volume in m3 registered among the stations.
StationSeptember–November 2013November–January 2013–2014January–March 2014March–May 2014May–July 2014July–September 2014
S1–S213,014−17,275−16,377137412,790−32,512
S2–S311,679−5956−2061−13,12912,403−30,438
S3–S419,923−18,82811,850−20,12112,421−28,947
S4–S517,116−18,0243553−11,91013,612−32,185
S5–S620,673−11,2394128−98974285−30,460
S6–S729,485−13,7626658−12,9661996−27,232
Publisher’s Note: MDPI stays neutral with regard to jurisdictional claims in published maps and institutional affiliations.