Abstract
High rates of land conversion due to urbanization are causing fragmented and dispersed spatial patterns in the wildland-urban interface (WUI) worldwide. The occurrence of anthropogenic fires in the WUI represents an important environmental and social issue, threatening not only vegetated areas but also periurban inhabitants, as is the case in many Latin American cities. However, research has not focused on the dynamics of the local climate in the WUI. This study analyzes whether wildfires contribute to the increase in land surface temperature (LST) in the WUI of the metropolitan area of the city of Guanajuato (MACG), a semi-arid Mexican city. We estimated the pre- and post-fire LST for 2018–2021. Spatial clusters of high LST were detected using hot spot analysis and examined using ANOVA and Tukey’s post-hoc statistical tests to assess whether LST is related to the spatial distribution of wildfires during our study period. Our results indicate that the areas where the wildfires occurred, and their surroundings, show higher LST. This has negative implications for the local ecosystem and human population, which lacks adequate infrastructure and services to cope with the effects of rising temperatures. This is the first study assessing the increase in LST caused by wildfires in a WUI zone in Mexico.
1. Introduction
The global trend of urban migration is characterized by high rates of land conversion. Here, the ongoing process of urban expansion produces fragmented spatial patterns as it replaces agricultural and forest areas with built-up [,,,]. This process is mainly characterized by dispersed urban development [,,]. The continuous displacement of the population in recent decades towards periurban areas has encouraged the incorporation, mixing, and interaction of agricultural and/or forest areas with human settlements [], resulting in the configuration of the forest–urban interface [,]. In this study, we refer to the forest–urban interface as the wildland–urban interface (WUI). The WUI is characterized by a combination of residential, productive, recreational, and other uses in a periurban area [], with rural characteristics —such as areas of forest vegetation— along with seasonal and irrigated agriculture. This gives rise to a new and complex spatial configuration between urban and rural areas [].
According to the analysis of approximately 400 articles by Bento-Gonçalves and Vieira [], during the last decade, the occurrence of fires in WUIs has increased around the world. This increase was first evident in Canada, the United States of America, and Australia, and more recently in southern Europe, including Portugal and Greece. However, Latin-American countries were excluded from this analysis because there are only a few studies on the subject to date, such as the case of Chile [].
One of the many impacts of fires that take place in forested areas is the post-fire increase in the land surface temperature (LST), a fact that proves how important vegetation as a regulator of the land surface energy flux is [,]. On the earth’s surface, LST is the main factor influencing the physical processes responsible for balancing energy, water, and CO2 [,,]. In the past few decades, LST has been employed to determine the surface urban heat island (SUHI) of cities around the world, which corresponds to the presence of higher temperatures within cities than in their surroundings [,,,,]. The inclusion of spatial statistics such as hot and cold spot detection, has contributed to determining spatially the thermal performance of urban environments [,,]. Hotspot analysis can show areas of particularly high and low LST. There are several studies that have used Landsat imagery to perform this type of analysis []. In Mexico, few studies have implemented multitemporal hot and cold spot approaches [].
According to Kosatsky et al. [], climate change has currently triggered conditions that have caused heat waves which in turn have had an impact on the environment and human health. The deaths recorded in Europe in the summer of 2003, mainly in France, due to the increase in temperature, or the numerous wildfires that affected air quality in the city of Moscow, Russia, in the summer of 2010, are examples of this [,]. Such cases emphasize the need to develop studies that estimate temperature and heat maps to inform on temperature increase. It is important to mention that the study of heat islands has been developed mainly in urban areas, but little has been explored about their occurrence in the urban peripheries and their possible causes. In this context, the present study focuses on the assessment of LST and wildfires in the WUI zone of the metropolitan area of Guanajuato (MACG), Mexico.
This analysis aims to provide relevant information on the occurrence of wildfires and their consequences in terms of LST increase in the WUI. Our objectives were: (1) to estimate LST; (2) to determine local LST hot spots; and (3) to determine the effect of wildfires on LST in the WUI during the period 2018–2021. Our results can spatially explicitly inform on the contribution of wildfires to increase LST in the WUI. This effect highlights the need to explicitly incorporate the WUI in the regional planning of the study area, where there is a high occurrence of wildfires.
2. Study Area
Guanajuato is the capital city of the Guanajuato state. The city is located in the southwestern area of the municipality of Guanajuato (21°01′04″ N, 101°15′24″ W). Its altitude ranges from 1740 to 2959 m above sea level (masl). The municipality presents a semi-arid climate, with 650 mm of average rainfall per year. It has a semi-hot climate and an average temperature of 25 °C [].
The MACG was employed as spatial unit to include the surrounding localities that were developed due to the dispersed urban expansion of the city (Figure 1). Therefore, six localities in the south of the city were integrated into the MACG, in addition to the polygon of the city of Guanajuato itself. According to the most recent Population and Housing Census conducted by the National Institute of Statistics and Geography [], the MACG has an area of 25 km2 and a population of 154,799. By 2030, it is expected to increase to 211,680 inhabitants.
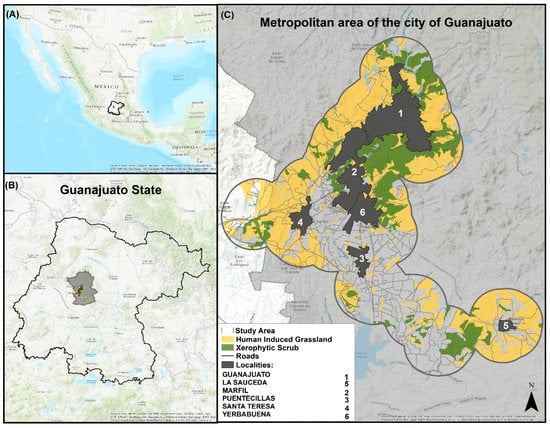
Figure 1.
(A) Location of the state of Guanajuato, Mexico. (B) Location of the study area in the municipality. (C) Location of the study area, including the localities that comprise the MACG, labeled with numbers 1 to 6.
Definition of the Wildland-Urban Interface of the Metropolitan Area of Guanajuato
To define the WUI, we used the method proposed by Lampin-Maillet et al. [,]. First, we established four main categories of WUI based on housing configuration: isolated (I), comprising groups of three or four houses located over 100 m away from the rest; scattered (S), for groups of 4 to 80 houses more than 100 m away from the rest; densely clustered (DC), comprising clusters of less than 80 houses located less than 30 m apart from each other; and very densely clustered (VDC), which included groups of more than 80 houses 30 m apart from each other. We classified the remaining zones (R) based on their land uses and vegetation types. The characterization was carried out using the open source Geographical Information System (GIS) QGIS, version 3.16. We included the MACG and a 2 km buffer around it, which spatially overlaps very closely with the micro-basin of the Guanajuato River, enabling us to assess the local ecosystem comprised by the WUI of the MACG (Figure 2).
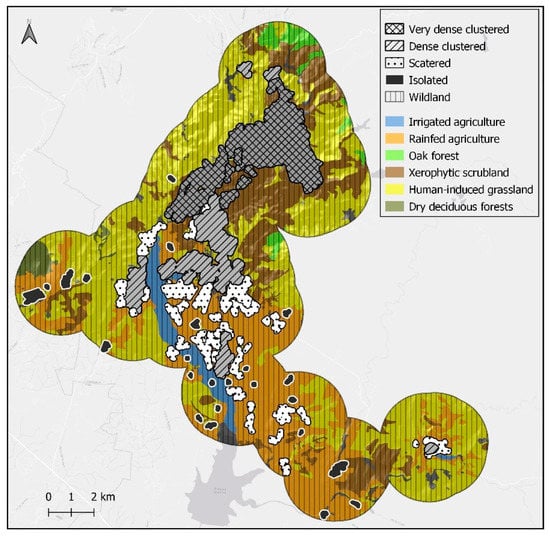
Figure 2.
Map of the housing spatial patterns categories, land use, and vegetation cover in the WUI of the study area.
The wildland areas were characterized according to the 2014 scale of 1:50,000 vegetation and land use map issued by the Secretary of Environment and Territorial Planning (Secretaría de Medio Ambiente y Ordenamiento Territorial) []. The native vegetation of the study area includes xerophytic scrub, dry deciduous forest, and oak forest. This type of vegetation is adapted to drought conditions, but not to fire []. Non-native land cover types include rainfed agriculture, irrigated agriculture, and human-induced grassland, which is the predominant vegetation type in the study area (Figure 2).
The topographic profile shows the altitudinal range in which the previously mentioned types of housing spatial patterns were distributed (Figure 3). It is important to note that the very dense clustered type is located at 2155 masl, in contrast with the scattered and isolated types, which are at 1850 masl. The latter are the result of unplanned urban growth in this part of the MACG. The urbanization gradient shows that scattered and isolated urban categories represent the nearest zones to the wildland category.
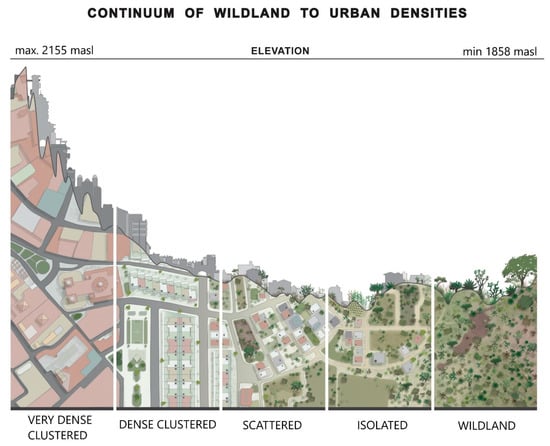
Figure 3.
Topographic profile of the WUI in the MACG including the housing spatial categories. The gradient of elevation above sea level ranges from 1858 m to 2155 m.
3. Methodological Approach
3.1. Land Surface Temperature Estimation
To estimate LST values, we used Landsat 8 OLI/TIR images of the pre- and post-fire dates covering the areas shown in Table A1 (Appendix A). These images have a spatial resolution of 30 m (in the case of the thermal band resampled from 100 m) and were free of clouds. All subsequent processing steps were performed in Rstudio. The R package LSTtools [,] was used to process the Landsat bands. Spectral radiance values (Lλ) based on the thermal band (TIR; 10) were obtained by applying the rescaling and multiplicative factors from the metadata of each image following the equations suggested by the United States Geological Survey (USGS) []. To calculate LST for each image, we first estimated the soil emissivity values for each pixel, according to the modified Normalized Difference Vegetation Index (NDVI) threshold technique [].
NDVI was calculated using the red and near-infrared (NIR) bands. The modified NDVI threshold technique classifies pixels into soil pixels (NDVI < 0.2), totally vegetated pixels (NDVI > 0.5), and mixed pixels (pixels with mixed infrastructure and vegetation with neither category accounting for >80% of pixels; NDVI ≥ 0.2 and NDVI ≤ 0.5). Fixed emissivity values of 0.97 and 0.99 were set for soil pixels and vegetation pixels respectively. The brightness temperature (BT) was obtained based on the TIR band values. Afterward, we applied the Planck function to correct BT based on the estimated per-pixel emissivity values. Finally, we converted the Kelvin temperature values to Celsius degrees.
3.2. Hot Spots Estimation
Hot spots were detected using the Getis-Ord Gi* statistics. This technique measures the degree of clustering of atypically high or low values for a given study area. Applying this method to a given variable allows the application of Tobler’s principle, which states that all things are related to each other, but things closer in space have a greater relationship than distant things []. Getis and Ord [] developed such statistics by performing an analysis based on the hypothesis that a phenomenon is randomly represented in space. For this phenomenon, they estimated z-values which were then validated through a p-value of confidence to accept the phenomenon or reject it []. Depending on the result, categories can be established to represent clusters of high or low values.
Although an entity with a high value is salient, it is not necessarily a statistically significant hot spot unless there are other entities with high values in the immediate vicinity, thus creating a spatial cluster. The same principle applies to extremely low values (cold spots). If the statistical test yields a significant p-value, the cluster is categorized either as a hot spot (extremely high values) or as a cold spot (extremely low values), while non-significant clusters denote areas whose values are near the average of the whole image. For this analysis, we assess the presence of LST hot spots in the MACG for the pre- and post-fire dates 2018, 2019, 2020, and 2021. For this purpose, we used the R software with the R package LSTtools version 0.0.2 [,] and the distance parameters of two pixels (i.e., 60 m) and a p-value of 0.05.
3.3. Determination of Burned Area and Assessment of Mapping Accuracy
For the detection of burned areas in the post-fire years 2019, 2020, and 2021, we employed the burned area product of the Sentinel Hub EO Browser, which includes different spectral products relevant to detect forest fires []. The Sentinel Hub EO implementation that detects burned areas uses three spectral indexes: the normalized difference moisture index (NDMI), NDVI, and a custom index based on bands 12, 11, and 8. SWIR bands 11 and 12 detect heat, since they cover low-reflectance values where land was recently burned and has already cooled, and high-reflectance values in areas that continue to be hot. These bands were combined into a normalized SWIR difference index. Since band 8 also has low reflectance in recently burned areas, we added it to the index to improve its accuracy []. We complemented our detection of burned areas using the atmospheric penetration spectral index, a composite that uses different bands from the non-visible part of the spectrum to minimize the impact of atmospheric noise in the image. Short-wave infrared bands 11 and 12 represent heated areas with high values, which makes them useful for fire and burned-area mapping [].
We independently assessed the accuracy of the burned area mapping product for the dates 2019, 2020, and 2021, following Stehman and Foody []. We employed a stratified random sampling design with 506, 459, and 797 independent samples for the years 2019, 2020, and 2021, respectively. These points were visually inspected using high-resolution images available on Google Earth to determine both burned and non-burned areas. The methods proposed by Oloffson et al. [] were applied in order to estimate overall cartographic accuracy. In addition to this reliability analysis, we also used the freely available data from the mobile application IGNIS citizen fire report, which allows citizens to report wildfires in real-time in the state of Guanajuato. IGNIS is available at [].
3.4. Statistical Analyses
To assess whether hot spots were related to fire occurrence, we generated a database by randomly sampling pre-fire scenes from April and May 2018 and 2020 and post-fire scenes from April and May 2019 and 2021 (Table 1). These were the months with the highest temperatures in the state of Guanajuato []. We compared the same months for each selected year. One hundred random points were generated from the pre-fire (not burned) and post-fire (burned) dates, then R software was used to perform an analysis of variance (ANOVA) that set LST as the explanatory variable.

Table 1.
Dates used in the study of pre-fire and post-fire dates and their respective randomly sampled points.
The null hypothesis considered the equality of the mean values and the groups as subsets of the same population. Rejection of the null hypothesis implies that the mean values of at least two groups are different. When the ANOVA was significant, a Tukey’s HSD post-hoc test was applied to determine pairwise differences between groups. The Shapiro–Wilk normality test was also performed. When the p-value was greater than 0.5, the normality assumption was not violated, nor was the Bartlett test of homogeneity of variances, in which case, given a p-value greater than 0.5, variances are homogeneous. To further validate the assessment of the LST differences between burned and unburned areas, we assessed statistical differences of LST values in three unburned areas, and at different distances from them (i.e., 400 m, 800 m, and 1200 m). Moreover, we monitored the LST values in 20 randomly selected pixels of burned and unburned areas over the three-year period (May 2019, May 2020, and April 2021) to explore their evolution.
4. Results
4.1. Burned Areas, Hot Spots, and ANOVA Statistics
The estimated total burned area in the years following the fire was 444.56 ha in 2019, 198.95 ha in 2020, and 549.42 ha in 2021. The burned areas were distributed mainly in the southern part of the MACG, which exhibited an LST range of 20 °C to 50 °C (Figure 4). The accuracy assessment of the burn map showed an overall accuracy above 95% for the post-fire years of 2019, 2020, and 2021 (Table A2, Table A3 and Table A4, Appendix A).
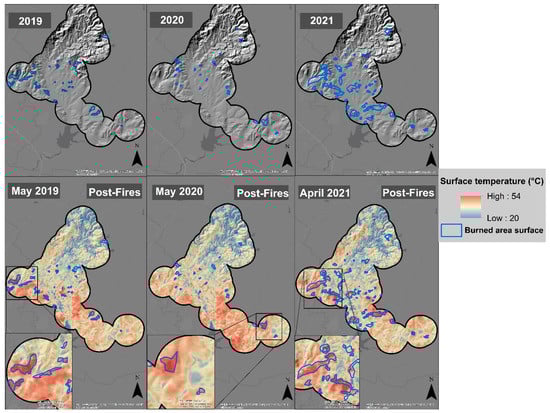
Figure 4.
Distribution of burned areas and LST range at the MACG.
As a result of the Getis & Ord spatial autocorrelation analysis, clusters of hot spots and cold spots were obtained (Figure 5). The hot spots in the southern part of the study area mainly overlapped with the burned areas, especially in 2021, which was the year with the largest burned area. According to the results of the Tukey post-hoc analysis (Table A5, Appendix A), there is a significant difference between the mean LST of the non-burned areas and the areas identified as hot spots, which also spatially overlap with the burned areas for the post-fire years 2019, 2020, and 2021.
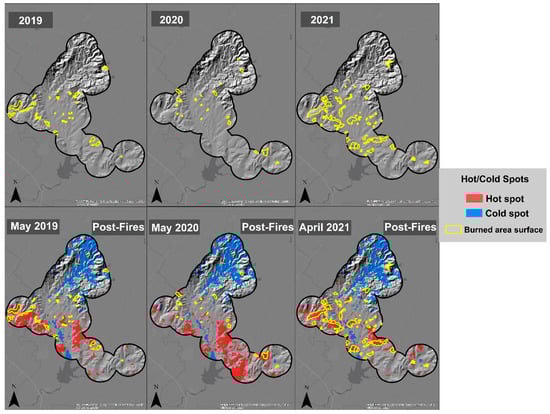
Figure 5.
Maps of burned areas for the post-fire years (top) and hot and cold spots for post-fire (2019, 2020, and 2021) seasons and burned areas (bottom).
The mean LST of the unburned areas for the years 2019, 2020 and 2021 is 37 °C, 38 °C, and 37 °C, respectively, while the burned areas presented a mean LST of 47 °C, 43 °C, and 39 °C (Figure 6). LST significantly differs between the unburned and burned areas, showing the significant impact of wildfires on the increase in LST in the burned areas compared to the unburned areas. As for the Shapiro–Wilk normality test and the Bartlett test of homogeneity of variances, the results of both tests show a normal distribution and homogeneity of variance, respectively, with p-values greater than 0.5.
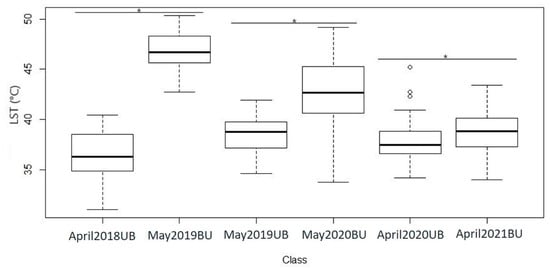
Figure 6.
Mean and distribution of LST values of unburned sites (UB) for the dates April 2018, May 2019 and April 2020, and burned sites (BU) for the dates May 2019, May 2020 and April 2021 assessed by the ANOVA statistical test (p < 0.05 *).
In Figure A1 (Appendix A), we show the LST monitoring at the pixel level for the years 2019, 2020, and 2021 for burned and unburned sites to validate our results. It is possible to observe that the LST values found in burned and unburned sites are significantly different. Although the values of burned pixels decrease again after the post-fire year, they are still significantly higher than those of the unburned areas during our study period (Figure A1, Appendix A).
4.2. Wildland–Urban Interface Categories and Hot Spot Distribution
Based on the classes defined for the WUI, Table 2 shows the surface area in ha of each category, the percentage of the total study area, and the estimated pre-fire and post-fire LST in Celsius degrees. The area and percentages of the densely and very densely clustered categories are similar to the scattered clustered category, but the estimated average post-fire temperatures are ~37 °C for the first category and 40 °C for the second one. Moreover, the average post-fire LST is even higher for the isolated category, reaching 43 °C. These results show that the highest LST values are present in the scattered and isolated housing categories of the MACG (Figure 7). All the data presented in Figure 6 is described in detail in Table A5.
Table 2.
Housing spatial categories, surface area (ha), percentage of the study area, and mean LST (°C) of the types of housing spatial patterns and land use and vegetation cover in the WUI of the MACG.
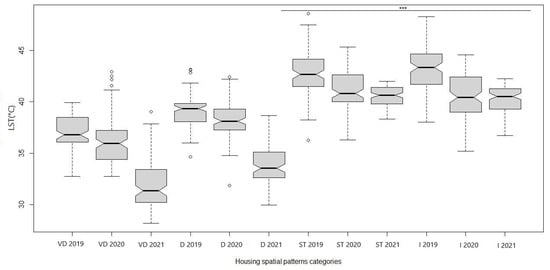
Figure 7.
Average LST of the housing spatial patterns categories for the post-fire years of the study area evaluated by ANOVA statistical test (p < 0.001 ***). The housing categories are: Very dense (VD) May 2019, May 2020, April 2021; Dense (D) May 2019, May 2020, April 2021; Scattered (ST) May 2019, May 2020, April 2021; and Isolated (I) May 2019, May 2020, and April 2021.
5. Discussion
An intensive urbanization process has been active in Latin America since the 1970s. This process has been characterized by a scattered spatial pattern since the advent of the articulation of a capitalist development model [] and has produced one of the most urbanized regions in the world []. However, this urban expansion has not been sufficiently characterized by policies and planning instruments to match the complexity of this phenomenon []. Our results confirm this spatial pattern, showing that the southern zone of the MACG presents a fragmented and isolated pattern of urbanization in the WUI. This type of urban development not only creates environmental conditions that are not sustainable but also implies wildfire risks and heat hazard conditions for the population []. Further research complemented by air temperatures is necessary to assess whether the exposure of the inhabitants of the WUI to high temperatures increases with wildfires.
The burned area estimates for 2021 showed a maximum area of 1096.34 ha, followed by 444.66 ha for 2019, and 198.95 ha for 2020. It is important to mention that the estimated burned area in 2020 is related to the lockdown due to the COVID-19 outbreak. The COVID-19 restrictions in Mexico prevented people from attending work centers, public spaces, and other crowded places. The temporary suspension of school activities at all levels also meant fewer people on the streets. This lockdown situation potentially reduced the burned area in 2020. This suggests that the fires in the southern zone of the MACG are the result of anthropogenic activities that were suspended at that time by the lockdown.
Other studies, such as the work of Lampin-Mailleta et al. [], have also documented the relationship between high wildfire risk in the WUI, especially present in the isolated and dispersed WUI categories. Their work in southern France showed that isolated and scattered urban housing spatial patterns imply the highest wildfire risk. Some crucial characteristics of these WUI (low housing density, high rural road density, and availability of combustible vegetation, such as forests and shrublands) are factors of high wildfire risk. Another example is the study conducted by Bouillon [], who mapped the WUI in the Province of Oristano, Sardinia, Italy. This research concluded that among the different types of WUI, isolated and scattered housing incurs the highest safety costs as there is a larger surface area prone to fire risk and they are more difficult to access. Our results are also in line with those of previous studies, providing further evidence that dispersed and isolated WUI housing categories are associated with higher risks of fire occurrence.
It is important to mention that although it is possible to find studies in which wildfires are linked to WUI categories, there are no studies that have so far established the relationship between their occurrence and the formation of heat islands. In this context, our results show that there is an LST increase of at least 5.6 °C in the areas where wildfires occurred in the WUI. This pattern of high temperatures was observed in the south of the MACG during the three-year period of this study. Particularly, the hotspot analysis developed with a final resolution of 30 × 30 m as in the study employed by Mavrakou [], allowed us to successfully identify the spatial overlap between burned areas and hotspots. It is important to mention that the hotspots are distributed in scattered and isolated areas of the WUI, especially in the year 2021, in which there was a total spatial overlap between the burned areas and the detected hotspots. Moreover, according to Farfan et al. [], the study area constitutes a zone with a high probability of wildfire occurrence under the climatic conditions of the ENSO phases El Niño and La Niña. This increase in post-fire temperature, along with the occurrence of wildfires, generates conditions of vulnerability for the established population. It is important to mention that, as stated by Inostroza et al. [], due to factors such as high temperatures that generate environmental stress in urban areas coupled with climate change, social heat vulnerability levels in Latin American cities will increase. Moreover, the low-income population is more exposed to these risk conditions, as they tend to settle in suburban environments with low access to proper infrastructure and services [], high levels of urban informality, and in housing areas generally facing climate stressors that affect public health. On the other hand, Shaposhnikov et al. [] suggest that although there is no evidence of air pollution or mortality derived from forest fires, these two events usually converge, mainly affecting people over 65 years old with cardiovascular, respiratory, and nervous diseases.
In this context, the development of detailed information on vulnerability at the scale of cities and neighborhoods is an urgent step to implement specific strategies to adapt to climate change []. We suggest that, to provide solutions to mitigate the negative effects of the occurrence of wildfires and the formation of heat islands, it is necessary to develop a regional planning instrument that specifically recognizes the urbanization gradient of the WUI and the vulnerability of the population living in these complex areas. This would ease the implementation of prevention strategies such as fire breaks, fuel management and fire management plans, ideally involving the participation of the population settled in the scattered and isolated urban areas located in the WUI, which in our case study are the inhabitants of the southern MACG zone.
6. Conclusions
This is the first study that assess the increase in LST caused by wildfires in a WUI area in Mexico. In this research, we describe the characteristics of the WUI in which LST differences occur during a three-year period (2019, 2020, and 2021), as well as the distribution of burned areas that significantly contribute to the formation of hot spots in the MACG. We explored the relationships between wildfire occurrence and LST increase through the estimation of LST under pre-fire and post-fire conditions in the WUI. The results of this research show an average increase of 5.6 °C in the areas that presented wildfires in this three-year period. Among the different types of housing spatial pattern categories, the isolated and dispersed ones are the most affected by the increase in LST due to the high occurrence of forest fires. This means that the population settled in these two types of spatial categories is potentially more vulnerable to increasing temperatures due to the existing urban informality, which can be translated as precariousness in housing infrastructure and public services. Additionally, the negative effects on health due to the particles in the air derived from combustion are an important threat to the elderly and people with cardiovascular or respiratory diseases. We suggest that regional planning should incorporate the characterization of the WUI as an urbanization gradient in a spatially explicit manner. In the case of the MACG, the development of a fire management plan focused on the southern area of the city, which we detected as the most prone to the occurrence of wildfires and increasing LST, is necessary. This measure should include the participation of the inhabitants of the city’s WUI. In order to further validate our findings and detect if the LST increasing trends are persistent in the WUI, it is necessary to further monitor this area in the coming years. A spatially explicit fire risk and social vulnerability study integrating the population’s socioeconomic conditions and ignition sources for the MACG area is already planned to be developed as a next step after this research.
Author Contributions
Conceptualization, M.F. and R.L.-R.; methodology, R.L.-R., M.F. and M.A.-C.; Software R.L.-R. and M.F.; writing—reviewing, M.A.-C., M.F., R.L.-R. and A.C.-N.; data curation, M.A.-C.; writing—original draft preparation, M.A.-C.; supervision M.F. and R.L.-R. All authors have read and agreed to the published version of the manuscript.
Funding
Funding was provided by the Universidad de Guanajuato through the Dirección de Apoyo a la Investigación y al Posgrado (DAIP) in its 2021 call for proposals.
Institutional Review Board Statement
Not applicable.
Informed Consent Statement
Not applicable.
Data Availability Statement
Data supporting the findings of this study is available upon reasonable request to the corresponding author.
Acknowledgments
We thank Camilo Alcántara for his guidance in the statistical analysis and two anonymous reviewers who made important suggestions to improve our manuscript.
Conflicts of Interest
The authors declare that they are not aware of any competing financial interests or personal relationships that might have influenced the content of the information presented in this article.
Appendix A
Table A1.
Landsat 8 OLI/TIR images for the different dates of pre- and post-fires.
Table A1.
Landsat 8 OLI/TIR images for the different dates of pre- and post-fires.
| Mission | Date | Acquisition Time (GMT) | Sun Azimuth (Degrees) | Sun Elevation (Degrees) | Path/Row |
|---|---|---|---|---|---|
| 14 April 2018 | 17:11:09 | 114.11 | 64.07 | 028/045 | |
| 19 May 2019 | 17:11:27 | 90.81 | 68.55 | 028/045 | |
| Landsat 8 | 21 May 2020 | 17:11:16 | 89.25 | 68.56 | 028/045 |
| 03 April 2020 | 17:11:30 | 120.43 | 61.40 | 028/045 | |
| 01 April 2021 | 17:11:39 | 127.11 | 57.40 | 028/045 |
Table A2.
Confusion matrices for 2019. BU: burned, UN: unburned.
Table A2.
Confusion matrices for 2019. BU: burned, UN: unburned.
| Classification 2019 | Reference 2019 | Area Distribution | Estimated Error Area | |||||||
| BU | BU | Sum | Weights | Pixels | − | + | ||||
| BU | 39 | 8 | 47 | BU | 0.02 | 44,473 | 44,171 | 44,775 | ||
| UB | 10 | 449 | 459 | UB | 0.98 | 1,855,085 | 1,857,495 | 1,867,675 | ||
| Sum | 1.00 | 1,899,558.00 | ||||||||
| Sum | 49 | 457 | 506 | |||||||
| PA | Producer’s accuracy | Not adjusted | ||||||||
| UA | User’s accuracy | Overall accuracy = | 96.443% +− | 0.007 | ||||||
| O | Error of comission | Khat = | 0.7929 +− | 0.007 | ||||||
| C | Error of omission | Area-adjusted | ||||||||
| Overall accuracy = | 97.439% | |||||||||
| PA | UA | O | C | Si | Khat = | 0.9747 | ||||
| BU | 78.59% | 82.98% | 20.41% | 17.02% | 0.40 | |||||
| UB | 98.25% | 97.82% | 1.75% | 2.18% | 0.13 | |||||
Table A3.
Confusion matrices for 2020. BU: burned, UN: unburned.
Table A3.
Confusion matrices for 2020. BU: burned, UN: unburned.
| Classification 2020 | Reference 2020 | Area Distribution | Estimated Error Area | |||||||
| BU | BU | Sum | Weights | Pixels | − | + | ||||
| BU | 27 | 8 | 35 | BU | 0.0150 | 28,521 | 28,344 | 28,698 | ||
| UB | 7 | 417 | 424 | UB | 0.9850 | 1,869,792 | 1,858,204 | 1,881,380 | ||
| Sum | 1.00 | 1,898,313.00 | ||||||||
| Sum | 34 | 425 | 459 | |||||||
| PA | Producer’s accuracy | Not adjusted | ||||||||
| UA | User’s accuracy | Overall accuracy = | 96.732% +− | 0.006 | ||||||
| O | Error of comission | Khat = | 0.7649 +− | 0.006 | ||||||
| C | Error of omission | Area-adjusted | ||||||||
| Overall accuracy = | 98.0304% | |||||||||
| PA | UA | O | C | Si | Khat = | 0.9803 | ||||
| BU | 79.41% | 77.14% | 20.59% | 22.86% | 0.40 | |||||
| UB | 98.12% | 98.35% | 1.88% | 1.65% | 0.14 | |||||
Table A4.
Confusion matrices for 2021. BU: burned, UN: unburned.
Table A4.
Confusion matrices for 2021. BU: burned, UN: unburned.
| Classification 2021 | Reference 2021 | Area Distribution | Estimated Error Area | |||||||
| BU | BU | Sum | Weights | Pixels | − | + | ||||
| BU | 73 | 19 | 92 | BU | 0.0690 | 132,510 | 131,613 | 133,407 | ||
| UB | 22 | 683 | 705 | UB | 0.9310 | 1,787,843 | 1,775,744 | 1,799,942 | ||
| Sum | 1.00 | 1,920,353.00 | ||||||||
| Sum | 95 | 702 | 797 | |||||||
| PA | Producer’s accuracy | Not adjusted | ||||||||
| UA | User’s accuracy | Overall accuracy = | 94.856% +− | 0.007 | ||||||
| O | Error of comission | Khat = | 0.7516 +− | 0.007 | ||||||
| C | Error of omission | Area-adjusted | ||||||||
| Overall accuracy = | 95.6697% | |||||||||
| PA | UA | O | C | Si | Khat = | 0.9567 | ||||
| BU | 76.84% | 79.35% | 23.16% | 20.65% | 0.42 | |||||
| UB | 97.29% | 96.88% | 2.71% | 3.12% | 0.16 | |||||
Table A5.
Significance parameters of post-hoc Tukey analysis, UB = Unburned, BU = Burned.
Table A5.
Significance parameters of post-hoc Tukey analysis, UB = Unburned, BU = Burned.
| diff | lwr | upr | p adj | |
|---|---|---|---|---|
| May2019BU–April2018UB | 10.31457003 | 8.4607244 | 12.1684157 | 0.0000000 |
| May2019UB–April2018UB | 1.95186898 | 0.4630105 | 3.44407275 | 0.0027394 |
| May2020BU–April2018UB | 6.05490308 | 4.5660446 | 7.5437616 | 0.0000000 |
| April2020UB–April2018UB | 1.23945043 | −0.3528130 | 2.8317138 | 0.2265601 |
| April2021BU–April2018UB | 2.02704873 | 0.4347853 | 3.6193121 | 0.0040812 |
| May2019UB–May2019BU | −8.36270105 | −9.8515595 | −6.8738425 | 0.0000000 |
| May2020BU–May2019BU | −4.25966695 | −5.7485255 | −2.7708084 | 0.0000000 |
| April2020UB–May2019BU | −9.07511960 | −10.6673830 | −7.4828562 | 0.0000000 |
| April2021BU–May2019BU | −8.28752130 | −9.8797847 | −6.6952579 | 0.0000000 |
| May2020BU–May2019UB | 4.10303410 | 3.1047077 | 5.1013605 | 0.0000000 |
| April2020UB–May2019UB | −0.71241856 | −1.8592658 | 0.4344287 | 0.4803158 |
| April2021BU–May2019UB | 0.07517974 | −1.0716675 | 1.2220270 | 0.9999676 |
| April2020UB–May2020BU | −4.81545265 | −5.9622999 | −3.668054 | 0.0000000 |
| April2021BU–May2020BU | −4.02785435 | −5.1747016 | −2.8810071 | 0.0000000 |
| April2021BU–April2020UB | 0.78759830 | −0.4906277 | 2.0658243 | 0.4897306 |

Figure A1.
Pixel-level LST of burned and unburned sites for the years 2019, 2020, and 2021 (upper figure) and box-plot including the level of statistical significance (bottom; p < 0.001 ***).
References
- Bento-Gonçalves, A.; Vieira, A. Wildfires in the wildland-urban interface: Key concepts and evaluation methodologies. Sci. Total Environ. 2020, 707, 135–592. [Google Scholar] [CrossRef] [PubMed]
- Lemoine-Rodríguez, R.; MacGregor-Fors, I.; Muñoz-Robles, C. Six decades of urban green change in a neotropical city: A case study of Xalapa, Veracruz, Mexico. Urban Ecosyst. 2019, 22, 609–618. [Google Scholar] [CrossRef]
- Galiana-Martín, L.; Karlsson, O. Development of a methodology for the assessment of vulnerability related to wildland fires using a multi-criteria evaluation. Geogr. Res. 2012, 50, 304–319. [Google Scholar] [CrossRef]
- Galiana-Martin, L.; Herrero, G.; Solana, J. A wildland-urban interface typology for forest fire risk management in Mediterranean areas. Landsc. Res. 2011, 36, 151–171. [Google Scholar] [CrossRef]
- Covarrubias, A. Motorización tardía y ciudades dispersas en América Latina: Definiendo sus contornos; hipotetizando su futuro. In Cuadernos de Vivienda y Urbanismo; Pontificia Universidad Javeriana: Bogota, Colombia, 2013; p. 6. [Google Scholar]
- Lopez, R. Urban Sprawl in the United States: 1970–2010. Cities Environ. 2014, 7, 7. [Google Scholar]
- Zhao, P. Sustainable urban expansion andtransportation in a growing megacity: Consequences of urban sprawl for mobility on the urban fringe of Beijing. Habitat Int. 2010, 34, 236–243. [Google Scholar] [CrossRef]
- Bar-Massada, A.; Stewart, S.I.; Hammer, R.B.; Mockrin, M.H.; Radeloff, V.C. Using structure locations as a basis for mapping the wildland urban interface. J. Environ. Manag. 2013, 128, 540–547. [Google Scholar] [CrossRef]
- Stewart, S.I.; Radeloff, V.C.; Hammer, R.B.; Hawbaker, T.J. Defining the wildland-urban interface. J. For. 2007, 105, 201–207. [Google Scholar] [CrossRef]
- Badia, A.; Tulla, A.F.; Vera, A. Los incendios en zonas de interfase urbano forestal. La integración de nuevos elementos en el diseño de la prevención. Scr. Nova 2010, 60, 331. [Google Scholar]
- Ferrier, J.P. Le Contrat Géographique, Ou, L’habitation Durable Des Territoires; Payot Lausanne-Nadir: Paris, France, 1998; Volume 2. [Google Scholar]
- Castillo, M. Aspectos Técnicos para considerar en incendios de interfaz. Análisis de caso aplicado a Chile. Territorium 2015, 22, 157–165. [Google Scholar] [CrossRef]
- Vlassova, L.; Pérez-Cabello, F.; Mimbrero, M.R.; Llovería, R.M.; García-Martín, A. Analysis of the relationship between land surface temperature and wildfire severity in a series of landsat images. Remote Sens. 2014, 6, 6136–6162. [Google Scholar] [CrossRef]
- Veraverbeke, S.; Verstraeten, W.W.; Lhermitte, S.; Van De Kerchove, R.; Goossens, R. Assessment of post-fire changes in land surface temperature and surface albedo, and their relation with fire-burn severity using multitemporal MODIS imagery. Int. J. Wildland Fire 2012, 21, 243–256. [Google Scholar] [CrossRef]
- Monson, R.; Baldocchi, D. Terrestrial Biosphere-Atmosphere Fluxes; Cambridge University Press: Cambridge, UK, 2014. [Google Scholar]
- Kustas, W.; Anderson, M. Advances in thermal infrared remote sensing for land surface modeling. Agric. For. Meteorol. 2009, 149, 2071–2081. [Google Scholar] [CrossRef]
- Chakraborty, T.; Lee, X. A simplified urban-extent algorithm to characterize surface urban heat islands on a global scabs. Int. J. Appl. Earth Obs. Geoinf. 2019, 74, 269–280. [Google Scholar] [CrossRef]
- Lemoine-Rodríguez, R.; Inostroza, L.; Zepp, H. Intraurban heterogeneity of space-time land surface temperature trends in six climate-diverse cities. Sci. Total Environ. 2022, 804, 150037. [Google Scholar] [CrossRef] [PubMed]
- Rizwan, A.M.; Dennis, L.Y.; Chunho LI, U. A review on the generation, determination and mitigation of Urban Heat Island. J. Environ. Sci. 2008, 20, 120–128. [Google Scholar] [CrossRef]
- Voogt, J.A.; Oke, T.R. Thermal remote sensing of urban climates. Remote Sens. Environ. 2003, 86, 370–384. [Google Scholar] [CrossRef]
- Arnfield, A.J. Two decades of urban climate research: A review of turbulence, exchanges of energy and water, and the urban heat island. Int. J. Climatol. 2003, 23, 1–26. [Google Scholar] [CrossRef]
- Lemoine-Rodríguez, R.; Inostroza, L.; Zepp, H. Does urban climate follow urban form? Analyzing intraurban LST trajectories versus urban form trends in 3 cities with different background climates. Sci. Total Environ. 2022, 830, 154570. [Google Scholar] [CrossRef]
- Coutts, A.M.; Harris, R.J.; Phan, T.; Livesley, S.J.; Williams, N.S.; Tapper, N.J. Thermal infrared remote sensing of urban heat: Hotspots, vegetation, and an assessment of techniques for use in urban planning. Remote Sens. Environ. 2016, 186, 637–651. [Google Scholar] [CrossRef]
- Mavrakou, T.; Polydoros, A.; Cartalis, C.; Santamouris, M. Recognition of Thermal Hot and Cold Spots in Urban Areas in Support of Mitigation Plans to Counteract Overheating: Application for Athens. Climate 2018, 6, 16. [Google Scholar] [CrossRef]
- Kosatsky, T. The 2003 European Heatwaves. Euro Surveill. 2005, 10, 552. [Google Scholar] [CrossRef]
- Shaposhnikov, D.; Revich, B.; Bellander, T.; Bedada, G.B.; Bottai, M.; Kharkova, T.; Kvasha, E.; Lezina, E.; Lind, T.; Semutnikova, E.; et al. Mortality related to air pollution with the Moscow heat wave and wildfire of 2010. Epidemiology 2014, 25, 359. [Google Scholar] [CrossRef] [PubMed]
- Robin, J.M.; Cheung, S.L.K.; Le Roy, S.; Van Oyen, H.; Griffiths, C.; Michel, J.P.; Herrmann, F.R. Death toll exceeded 70,000 in Europe during the summer of 2003. Comptes Rendus Biol. 2008, 331, 171–178. [Google Scholar] [CrossRef]
- Farfán, M.; Dominguez, C.; Espinoza, A.; Jaramillo, A.; Alcántara, C.; Maldonado, V.; Tovar, I.; Flamenco, A. Forest fire probability under ENSO conditions in a semi-arid region: A case study in Guanajuato. Environ. Monit. Assess. 2021, 193, 1–14. [Google Scholar] [CrossRef] [PubMed]
- INEGI. Censo de Población y Vivienda. 2020. Available online: https://www.inegi.org.mx/programas/ccpv/2020/default.html#Resultados_generales (accessed on 5 July 2021).
- Lampin-Maillet, C.; Jappiot, M.; Long, M.; Bouillon, C.; Morge, D.; Ferrier, J.P. Mapping wildland–urban interfaces at large scales integrating housing density and vegetation aggregation for fire prevention in the South of France. J. Environ. Manag. 2010, 91, 732–741. [Google Scholar] [CrossRef] [PubMed]
- Lampin-Maillet, C.; Long-Fournel, M.; Ganteaume, A.; Jappiot, M.; Ferrier, J.P. Land cover analysis in wildland-urban interfaces according to wildfire risk: A case study in the South of France. For. Ecol. Manag. 2011, 261, 2200–2213. [Google Scholar] [CrossRef]
- Subsitema de Información Geográfica, Medio Ambiente, Ordenamiento Territorial y Urbano. Available online: http://mapas.ecologia.guanajuato.gob.mx/libs/msfw/apps/multisearchcenter/ (accessed on 15 July 2021).
- Martínez Orea, Y.; Argüero Castillo, S.; Chávez Guadarrama, M.P.; Sánchez, I. Post-fre seed bank in xerophytic shrubland. Bot. Sci. 2010, 86, 11–21. [Google Scholar] [CrossRef][Green Version]
- Lemoine-Rodríguez, R.; Mas, J.F. LSTtools: An R Package to Process Thermal Data Derived from Landsat and MODIS Images (Version v0.0.2). Zenodo. 2020. Available online: https://github.com/RichardLemoine/LSTtools (accessed on 2 July 2021). [CrossRef]
- R Core Team. R: A Language and Environment for Statistical Computing; R Foundation for Statistical Computing: Vienna, Austria, 2019. [Google Scholar]
- USGS (United States Geological Service). Landsat 8 Data Users Handbook; USGS Earth Resources Observation and Science: Sioux Falls, SD, USA, 2019. [Google Scholar]
- Sobrino, J.A.; Jiménez-Muñoz, J.C.; Sòria, G.; Romaguera, M.; Guanter, L.; Moreno, J.; Plaza, A.; Martínez, P. Land surface emissivity retrieval from different VNIR and TIR sensors. IEEE Trans. Geosci. Remote Sens. 2008, 46, 316–327. [Google Scholar] [CrossRef]
- Getis, A.; Ord, J.K. The analysis of spatial association by use of distance statistics. Geogr. Anal. 1992, 24(3), 189–206. [Google Scholar] [CrossRef]
- Rossi, F.; Becker, G. Creating forest management units with Hot Spot Analysis (Getis-Ord Gi*) over a forest affected by mixed-severity fires. Aust. For. 2019, 82, 166–175. [Google Scholar] [CrossRef]
- EO Browser Sentinel Hub. 2022. Available online: https://www.google.com/url?sa=t&rct=j&q=&esrc=s&source=web&cd=&cad=rja&uact=8&ved=2ahUKEwjK4b2XsrHzAhULmmoFHU0kBFQQFnoECA4QAQ&url=https%3A%2F%2Fapps.sentinel-hub.com%2Feo-browser%2F&usg=AOvVaw16j8hPQEZaiW09puXtzoHc (accessed on 18 June 2021).
- Burned Area Visualization. Available online: https://custom-scripts.sentinel-hub.com/sentinel-2/burned_area_ms/ (accessed on 24 June 2021).
- EOS Data Analytics. Atmospheric Penetration. Available online: https://eos.com/make-an-analysis/atmospheric-penetration/ (accessed on 25 June 2021).
- Stehman, S.V.; Foody, G.M. Key issues in rigorous accuracy assessment of land cover products. Remote Sens. Environ. 2019, 231, 111–199. [Google Scholar] [CrossRef]
- Olofsson, P.; Foody, G.M.; Stehman, S.V.; Woodcock, C.E. Making better use of accuracy data in land change studies: Estimating accuracy and area and quantifying uncertainty using stratified estimation. Remote Sens. Environ. 2013, 129, 122–131. [Google Scholar] [CrossRef]
- IGNIS Citizen Fire Report. Available online: http://www.incendiosignis.com (accessed on 3 March 2021).
- Hiernaux, D.; Lindón, A. Geografía urbana: Una mirada desde América Latina; Antropos: Barcelona, Spain, 2006; pp. 95–128. [Google Scholar]
- Gonzalez, C. Segregación urbana dirigida y segregación voluntaria. In Ciudades latinoamericanas. Desigualdad, Segregación y Tolerancia; Virgilio, M., Perelman, M., Eds.; Consejo Latinoamericano de Ciencias Sociales: Buenos Aires, Argentina, 2014; pp. 179–200. [Google Scholar]
- Inostroza, L.; Palme, M.; de la Barrera, F. A heat vulnerability index: Spatial patterns of exposure, sensitivity and adaptive capacity for Santiago de Chile. PLoS ONE 2016, 11, 0162464. [Google Scholar] [CrossRef] [PubMed]
- Bouillon, C.; Fernandez Ramiro, M.M.; Sirca, C.; Fierro Garcia, B.; Casula, F.; Vila, B.; Long Fournel, M.; Pellizzaro, G.; Arca, B.; Tedim, F.; et al. A Tool for Mapping Rural-Urban Interfaces on Different Scales; Imprensa da Universidade de Coimbra: Coimbra, Portugal, 2014; pp. 611–625. [Google Scholar]
- Mavrakou, T.; Polydoros, A.; Cartalis, C.; Santamouris, M. Reconocimiento de puntos calientes y fríos térmicos en áreas urbanas en apoyo de planes de mitigación para contrarrestar el sobrecalentamiento: Aplicación para Atenas. Clima 2018, 6, 16. [Google Scholar] [CrossRef]
- Inostroza, L. Informal urban development in Latin American urban peripheries. Spatial assessment in Bogotá, Lima and Santiago de Chile. Landsc. Urban Plan. 2016, 165, 267–279. [Google Scholar] [CrossRef]
Publisher’s Note: MDPI stays neutral with regard to jurisdictional claims in published maps and institutional affiliations. |
© 2022 by the authors. Licensee MDPI, Basel, Switzerland. This article is an open access article distributed under the terms and conditions of the Creative Commons Attribution (CC BY) license (https://creativecommons.org/licenses/by/4.0/).