Article

Multi-Agent-Based Model for the Urban Macro-Level Impact Factors of Building Energy Consumption on Different Types of Land

1
School of Architecture, Xi’an University of Architecture and Technology, Xi’an 710055, China
2
School of Architecture, Harbin Institute of Technology, Harbin 150006, China
3
Key Laboratory of Cold Region Urban and Rural Human Settlement Environment Science and Technology, Ministry of Industry and Information Technology, Harbin 150006, China
*
Authors to whom correspondence should be addressed.
Land 2022, 11(11), 1986; https://doi.org/10.3390/land11111986
Submission received: 28 September 2022 / Revised: 28 October 2022 / Accepted: 2 November 2022 / Published: 5 November 2022

Abstract

:
Urban researchers pay more and more attention to building energy consumption from different perspectives to obtain the results of urban overall energy conservation. The research at the micro level has yielded abundant accomplishments, but the macro-level research that can support urban planning decision making is still in the exploration stage. In this study, a multi-agent-based model, including the main panel, building agent, resident agent, and household appliance agent, is established by using Anylogic software. The model integrates Harbin urban macro-level impact factors of building energy consumption by designing and linking three sub-models: an urban morphology sub-model, climate sub-model, and energy use behavior sub-model. In the end, this study explored the building energy-saving potential of different types of land under the impact of variable factors through urban morphology and climate simulation scenarios and discussed the related energy-saving strategies. Findings and suggestions include: (1) The impact of urban morphology on overall urban building energy consumption is mainly reflected in residential and commercial land. The land development intensity (building density, floor area ratio, and building height) control and the coordination of land type layout and configuration can help to reduce the building energy consumption. (2) The energy-saving potential of residential land is more evident under climate impact, and ecological means should be used to adjust the climate to reduce the building energy consumption on different lands. (3) From the methodology perspective, this model can well realize the integration of multiple impact factors at the macro-level of the city and the dynamic simulation of energy consumption. The research results are expected to provide quantitative support for creating a sustainable built environment for the city.

1. Introduction

In the past 70 years, the urban population has been growing continuously. More than 50% of the world's population currently lives in cities [1]. According to the International Energy Agency (IEA) statistics, urban energy consumption accounts for about two-thirds of the world's total energy consumption [2]. From the end-use perspective, urban energy consumption mainly comes from the three major sectors of building, transportation, and industry. Among them, building energy consumption accounts for the highest proportion, about 60% of the sum of the three [3]. With the continuous development of urbanization, the number of urban populations will still increase rapidly, leading to a sharp increase in the demand for buildings. Therefore, it is of great significance to focus on building energy efficiency to achieve overall urban energy conservation and emission reduction [4]. The research at the micro level has made many theoretical and practical achievements [5,6,7]. However, the critical role of urban planning in creating an environment conducive to building energy conservation and reducing overall building energy consumption at the macro level should not be underestimated [8]. The macro-level research has gradually gained more and more attention in recent years. The discussion on the influencing factors and modeling methods of urban-scale building energy consumption has gradually emerged [9,10,11]. Some studies have begun to discuss the energy-saving effect of urban planning elements and spatial planning methods [12,13]. However, as far as the current situation is concerned, a lack of an integrated framework considering all planning impact elements is revealed [14].

1.1. Urban Macro-Level Impact Factors of Building Energy Consumption

Although the current research on the energy efficiency of single buildings has been relatively mature, the negative impact of the increase in overall energy consumption of buildings on the environment has led to the need to adopt sustainable strategies for urban planning and shift energy conservation from single buildings to the urban macro-level [15,16,17]. At the macro-level of the city, it is essential to integrate the building energy performance on each type of land in the city to find a complete picture of the overall energy performance of the urban building sector [18]. It requires full consideration of the urban environment. Otherwise, obtaining an accurate analysis of building energy performance is difficult. Existing studies have confirmed that building energy consumption at the macro-level of the city is closely related to urban morphology factors and climate [19,20].
The impact of urban morphology on building energy consumption has attracted much attention from urban planners. Previous studies show that building density significantly affects the natural ventilation of the area and the shadows between buildings [21,22,23], which play an essential role in influencing the convective heat transfer coefficient of the outer surface of the building [24], thereby affecting the thermal load of the building [25]. The floor area ratio is another density-related parameter that impacts the solar potential of buildings by increasing shading by neighboring buildings [26]. Aspect ratio and building height affect the distribution of wind speed in the street canyon and therefore affect the convective heat transfer from the surface of the building [27,28]. However, despite reducing heat loss, deep street canyons created by a cluster of high-rise buildings also reduce solar gain, which increases the heating demand in the cold season [25,29]. The shape factor is directly related to the building energy efficiency through solar radiation (heat and light) interactions [30].
There are comprehensive discussions on the impact of climate factors on building energy consumption. The temperature outside the building is recognized as the main factor that has an essential impact on building energy consumption [31], which not only affects the energy performance of the building itself but may also affect the use of household appliances such as air conditioners and heaters. The wind speed, which reflects airflow on the surface of the building, also shows a significant impact on energy consumption by influencing the heat transfer, surface temperature, and cooling rate of the building shell [31]. Relative humidity has been considered in several studies and has been found to be a vital contributor to the urban heat island effect, which in turn affects building energy consumption [32,33].

1.2. Building Energy Consumption Simulation Models

In the past decade, the focus of building energy modeling (BEM) has shifted from single building to urban-scale research [34]. Building energy consumption study at the urban macro-level is a vast, complex, and arduous task. Scholars are trying to find more effective urban-scale building energy consumption methods. In various types of models, the bottom-up engineering model, called "urban building energy models" (UBEMs) [34], is based on the building energy model (BEM) [35] and receives the most attention. However, due to data and computing capacity, such models face significant challenges in technology and methods [36]. It seems impossible to model a large number of buildings with the same complexity as single-building energy modeling [37]. In order to solve this problem, scholars began to explore ways to optimize such models [38,39] constantly. For example, Zheng et al. developed a parallel computational building-chain (PCBC) model for rapid UBEM [10]. Zhang et al. introduced a method to identify archetype buildings and generate urban building energy models for city-scale buildings where public building information was unavailable [11]. Yu et al. designed a model for community-level energy by combining GIS, simulation, and data-driven approaches [13]. In addition, climate models are also the focus of researchers' exploration in urban-scale building energy consumption simulation. At this stage, climate modeling is usually used to assist urban-scale building energy consumption calculation in the form of source-code-level urban climate mathematical modeling or meteorological data in such research, and most studies adopt the latter method [40]. For example, in the CitySim platform, urban macro-, meso-, and urban canopy climate models are run as preprocessing to modify the climate input values of other sub-models [41].
At present, the methods of establishing BEM can be roughly divided into three categories: "white box", "black box", and "gray box" [42]. The first, “white box”, which is also commonly referred as the physics-based model [43], was first used in the research on the energy consumption of a single building and based on detailed building physical information to simulate building energy consumption [44,45]. Nevertheless, for the urban macro-level, the massive amount of building information will lead to an overload in calculation, resulting in a long simulation process. At the same time, it is also difficult to calibrate the detailed simulation process. The available calibration data is usually insufficient, and uncertain parameter input will also affect the accuracy of simulation results [46]. In recent years, the “black box” method, also referred to as the data-driven model [43], has gradually attracted more attention as the advantages of this method begin to come to light in the research on macro-level building energy consumption. It relies on time-series statistical analyses and machine-learning algorithms to assess and forecast building energy consumption [44]. This modeling method is used more when the relationship between independent variables and dependent variables in the system cannot be directly explained [47]. Several specific popular techniques have been summarized for this type of model, such as machine learning, artificial neural networks (ANNs), the box method, support vector machines (SVMs), multiple linear regression (MLR), Gaussian regression (GPR), and so on [48,49,50]. “Grey box” is a combination model of the “white box” and “black box” method, that is, a data-driven method added based on a physical model [51,52]. It is the improvement of single data-driven techniques with optimization methods, or the combination of several machine learning algorithms [44].
Agent-based modeling (ABM) is a simulation technology based on decision entities [53], which can be regarded as a “black box” or “gray box” model according to different methods and compositions. Each agent evaluates its environment and makes decisions based on rules [54]. Although agent-based modeling has just started in the research on building energy consumption at the urban macro-level, it has demonstrated several advantages over other modeling techniques [55]. These advantages make it more conducive to modeling numerous and complex urban environmental factors to accurately simulate comprehensive mechanism relations and dynamic changes [56,57]. It covers emerging phenomena, provides a natural system description, and is more flexible. ABM can simulate complex, nonlinear, discontinuous, and discrete interactions between agents [53]. Some models are based on the existing building energy consumption data to simulate the building energy efficiency results under different policies [58,59]. Such models usually presuppose top-down urban policies or planning conditions and rarely consider the operation of the building itself. The other type of model focuses on the impact of the interaction between energy use behavior and the environment on building energy consumption [60,61,62]. It is widely believed that considering the energy use behavior and its response to the model's environment can effectively reduce the difference between the simulated value and the actual value [63,64].

1.3. Research Objectives

Based on the above, we want to explore a comprehensive method to support urban macro-level building energy conservation planning. This study has the following three main objectives:
  • The first objective of this study is to use agent-based modeling technology to establish a simulation model of building energy consumption on the urban scale, which includes various urban macro-level impact factors and can realize the internal dynamic interaction between the factors. This model focuses on supporting urban planning, with the elements that can be adjusted by planning means as the core.
  • The second objective is to use scenario simulation to identify the energy-saving potential of different types of land when the urban macro-level factors change. This will help planning decision-makers determine the priority areas for urban-scale building energy conservation through urban planning means.
  • The third objective is to propose planning strategies for urban macro-level impact factors for each type of land based on the discussion of simulation results to provide a scientific basis and quantitative support for constructing the low-carbon city of Harbin.
The rest of this article consists of three sections—the materials and methods, simulation results and discussion, and conclusions. The materials and methods section includes a detailed description of the data capture, the urban macro-level impact parameters, and the model system. The energy-saving potential under the urban morphology and climatic scenarios for each land use type are explored in the subsequent section, as well as the main findings, limitations, and lines for future research. It should be noted that this study is an extension based on our team’s research results on urban macro-level building energy consumption for many years. Therefore, due to the limitation of length, this paper mainly focuses on the model construction, application, and discussion of simulation results. Please refer to [33,62] for detailed research on identifying and quantifying urban macro-level impact parameters.

2. Materials and Methods

Harbin was selected as the research object. It is a provincial capital city in the severe cold area of China and is northeast China’s political, economic, cultural, and opening center. Harbin has four distinct seasons throughout the year, with cooling demand in summer and heating demand in winter. The urban environment significantly affects building energy consumption, making it an ideal research object for this study.

2.1. Energy Consumption Data

In order to study the impact factors at the macro-level of the city, it is necessary to control the individual physical information of buildings at the selection stage of sample buildings to reduce the energy consumption difference at the macro-level caused by these micro factors. (1) Location: the central urban area was selected as the study area, and the distribution of building samples was evenly distributed. (2) Building age: In 1986, China issued the Design Standard for Energy Efficiency of Civil Buildings (Heating Residential Buildings). Therefore, buildings built after 1986 were selected to ensure the unity of design standards, structures, materials, and the thermal performance of buildings with the same functions. (3) Building type: building types whose energy consumption is significantly affected by the external environment of the city, including residential buildings, retail buildings, medical buildings, education buildings, hotel buildings, and office buildings, were selected. (4) Building form: the possible building forms of various building types were comprehensively considered, such as bungalows, low-rise, mid-rise, and high-rise buildings. (5) HVAC: Most urban buildings in Harbin use central heating systems. For public buildings with independent heating, the statistical data of heating energy consumption were converted into an urban central heating unit. The Design Standard for Energy Efficiency of Civil Buildings specifies the requirements for building orientation, shape factor range, enclosure structure, thermal insulation measures, and so forth. Besides central heating, the utilization rate of air conditioners in Harbin is not high, according to our existing research survey, due to the climate condition. Natural ventilation is a major cooling method in summer. Equipment related to HVAC was set as household appliance agents in the energy use behavior sub-model.
The database of this study consists of the measured energy consumption data and physical building information of 609 civil buildings in the main urban area of Harbin in 2017, including 242 residential buildings, 48 hotels, 50 retail buildings, 35 hospitals, 107 educational buildings, and 127 office buildings. The energy consumption data were obtained from government departments, including the monthly electricity consumption, monthly heating energy consumption, and annual average energy consumption. Detailed building information was obtained from government departments and field surveys, including building floor area, total building area, building floors, building height, building function, number of floors, floor height, window wall ratio, cooling and heating ways, and so on.
The distribution of the sample buildings in the main urban area is relatively uniform and scattered while maintaining a certain degree of continuity in space. Table 1 shows the basic eigenvalue range of each type of sample building in this study. The extensive range of eigenvalues indicates that the selection of samples covers the standard building dimensions of the type.
To standardize the comparison, the energy consumption was converted into energy use intensity (EUI), defined as the energy used per unit floor area, expressed in kWh/m2. SPSS21.0 software was used for data description and analysis. The results show that the Sig of the normal test of the selected sample building annual EUI is 0.06 (Table 2), indicating that the data conforms to the normal distribution. The annual EUI of the sample buildings is 216.25 kWh/m2, and the standard deviation is 77.44 kWh/m2. Therefore, according to the PauTa criterion, EUI values higher than 448.57 kWh/m2 should be regarded as outliers. The verification results show that the annual EUIs of the selected 609 civil buildings are within the effective range.

2.2. Urban Macro-Level Impact Parameters

Urban morphology and climate can be considered the external environmental impact of building energy consumption. In view of the fact that the research was carried out based on a large number of samples at the urban macro-level, we adopted statistical methods to quantitatively identify the impact of urban morphology and climate on overall building energy consumption. As mentioned above, the physical information elements of the single building at the micro level were controlled during the sample selection process. In this section, the quantitative calculation of parameters are divided according to the building type.
To ensure accurate statistical analysis, we designed a standard experimental procedure. Correlation analysis was used to identify the significant urban macro-level impact factors of building energy consumption in Harbin. Those with a correlation significance of 0.01 (2-tailed) or 0.05 (2-tailed) were all considered in the subsequent verification process. Then, a multiple collinearity test was performed for the impact factors to test whether there was a linear correlation between independent variables (Equation (1)). The variables with VIF higher than 5 [65] were removed from the model. After that, stepwise regression analysis was used to quantitatively calculate the impact of these factors on the building energy consumption of electricity and heating from urban morphology and climate aspects. The probability of F was set to 0.05 for entry and 0.10 for removal. In the end, to examine whether the independent variable in the regression model is correlated to the dependent variable, an independent two-sample t-test was performed and calculated, as shown in (Equation (2)).
V I F i = 1 1 R i 2  
where R i 2 is the coefficient of determination of the regression model of the independent variable i to other independent variables.
t = X 1 ¯ X 2 ¯ ( n 1 1 ) S 1 2 + n 2 1 S 2 2 n 1 + n 2 2 1 n 1 + 1 n 2
where X ¯ is the average value of each sample set, S 2 is the variance of each sample set, and n is the number of records in each sample set.

2.2.1. Urban Morphology Parameters

The spatial indicators used in research and urban planning practice are not uniform [66,67], and the definition and calculation of indicators may vary significantly according to the research purposes and objectives. The indicators selected in this study not only refer to existing studies [30,68], but also comprehensively consider the difficulty of data acquisition. Therefore, we encourage the exploration of other alternative parameters in future research.
The urban morphology data were calculated from the CAD and GIS maps provided by government departments and captured from open online maps, including building density, height, floor area ratio, aspect ratio, and shape factor (Table 3). The influence radius was set to 340m [28].
According to the statistical analysis method mentioned above, we obtain the quantitative impact relationship between urban morphology factors and building electricity EUI (Table 4) and heating EUI (Table 5). These relationships are then input as parameters into the urban morphology sub-model for energy consumption calculation.

2.2.2. Climate Parameters

The climate data were collected from the National Meteorological Data Center and based on the measurement data of Harbin’s national primary meteorological station, including average temperature, wind speed, and relative humidity (Table 6). In this study, the climate parameters are tentatively referred to the data of 2017 so that the simulated values of building energy consumption can be compared with the actual value database for model validation.
According to the statistical analysis method mentioned above, we obtain the quantitative impact relationship between climate factors and building electricity EUI (Table 7) and heating EUI (Table 8). These relationships will be input as parameters into the climate sub-model for energy consumption calculation.

2.3. Model Structure and Parameterization

In this section, we will introduce the foundation and principles of the model in detail, as well as the specific parameter coding method under the Anylogic software system.

2.3.1. Input Data

The agent-based model designed in this study is a macro-scale modeling system with a high degree of integrating multi factors. In this section, only the data types required for the current construction of the model are listed. However, in future research, the data types can be flexibly expanded according to demand to enhance the function of the model and improve the accuracy of the final results.
The primary layer data include the block number, block land use type, population, and building energy-saving policies at the municipal level. The block number (“numofblock”) is set as "parameter" on the panel of each building agent (Figure 1), which corresponds to the value of urban morphology parameters in each block. Building agents in a specific block can automatically call the parameter values of this block during the simulation process. The population data is set as “parameter”. The energy-saving policy is set as “event”. The change in the resident’s energy use behavior can be triggered by the occurrence frequency, occurrence time, and issued instructions (“Action”) of the “event”.
The impact layer data mainly refer to the data of urban morphology, climate, and energy use behavior. The urban morphology data, building density, plot ratio, building height, aspect ratio, and shape factor are “variable” for each building agent panel (Figure 2). The parameter of the building number (“NumberOfBuilding”) is set on the building agent panel. The table function of urban morphology parameters is set on the main panel of the model. The urban morphology values of each building on the building agent panel are captured by the command “main.density (numofbuilding)”. It is the same with the setting and calling of climate parameters.

2.3.2. Urban Morphology Sub-Model

The main urban area of Harbin is divided into blocks, while the land use type of each block is categorized according to master planning, forming the table function “TypeOfBlock”. ArcGIS software was used to obtain the values of urban morphology parameters for each of the 77637 buildings in the urban area and to identify in which block the building was located (“BlockOfBuilding”). Variables of “BuildingDensity”, “FloorAreaRatio”, “AspectRatio”, “BuildingHeight”, “ShapeFactor”, and “TypeOfBuilding” retrieve the corresponding urban morphology values from the database based on the number of each building agent (“NumOfBuilding”) (Figure 3).
The initial value of urban morphology parameters is the current state of each block. The value of the main impact factors is dynamic, and updates according to the changes in energy-saving scenarios, while values of the others are fixed (Figure 4).
For urban renewal or newly developed blocks, the data in the table function “typeofblock” on the main panel of the model should be updated to ensure that the building in the block will also be changed during the simulation process. In addition to land use properties, it is also necessary to supplement and update the parameters of new buildings or renewal buildings in a specific block.

2.3.3. Climate Sub-Model

The primary design route of the climate sub-model is similar to that of the urban morphology sub-model. It is set as global variables on the main panel (“Main”) and includes the table functions “TEMP”, “WS”, and “RH”, as well as the climate variables “monthlytemp”, “monthlywsp”, and “monthlyrh”. The values of the climate variables are obtained by the variable “MonthOfYear”, which means the time of the simulation. For example, the command to assign a value to the temperature is “monthlytemp = TEMP(MonthOfYear)”.
In future studies, the spatial range of climate parameters can be further reduced. At the same time, the block number can be used as an intermediate parameter to further correlate the meteorological point data with buildings to improve the accuracy of regional building energy consumption simulation under the impact of the climate environment.

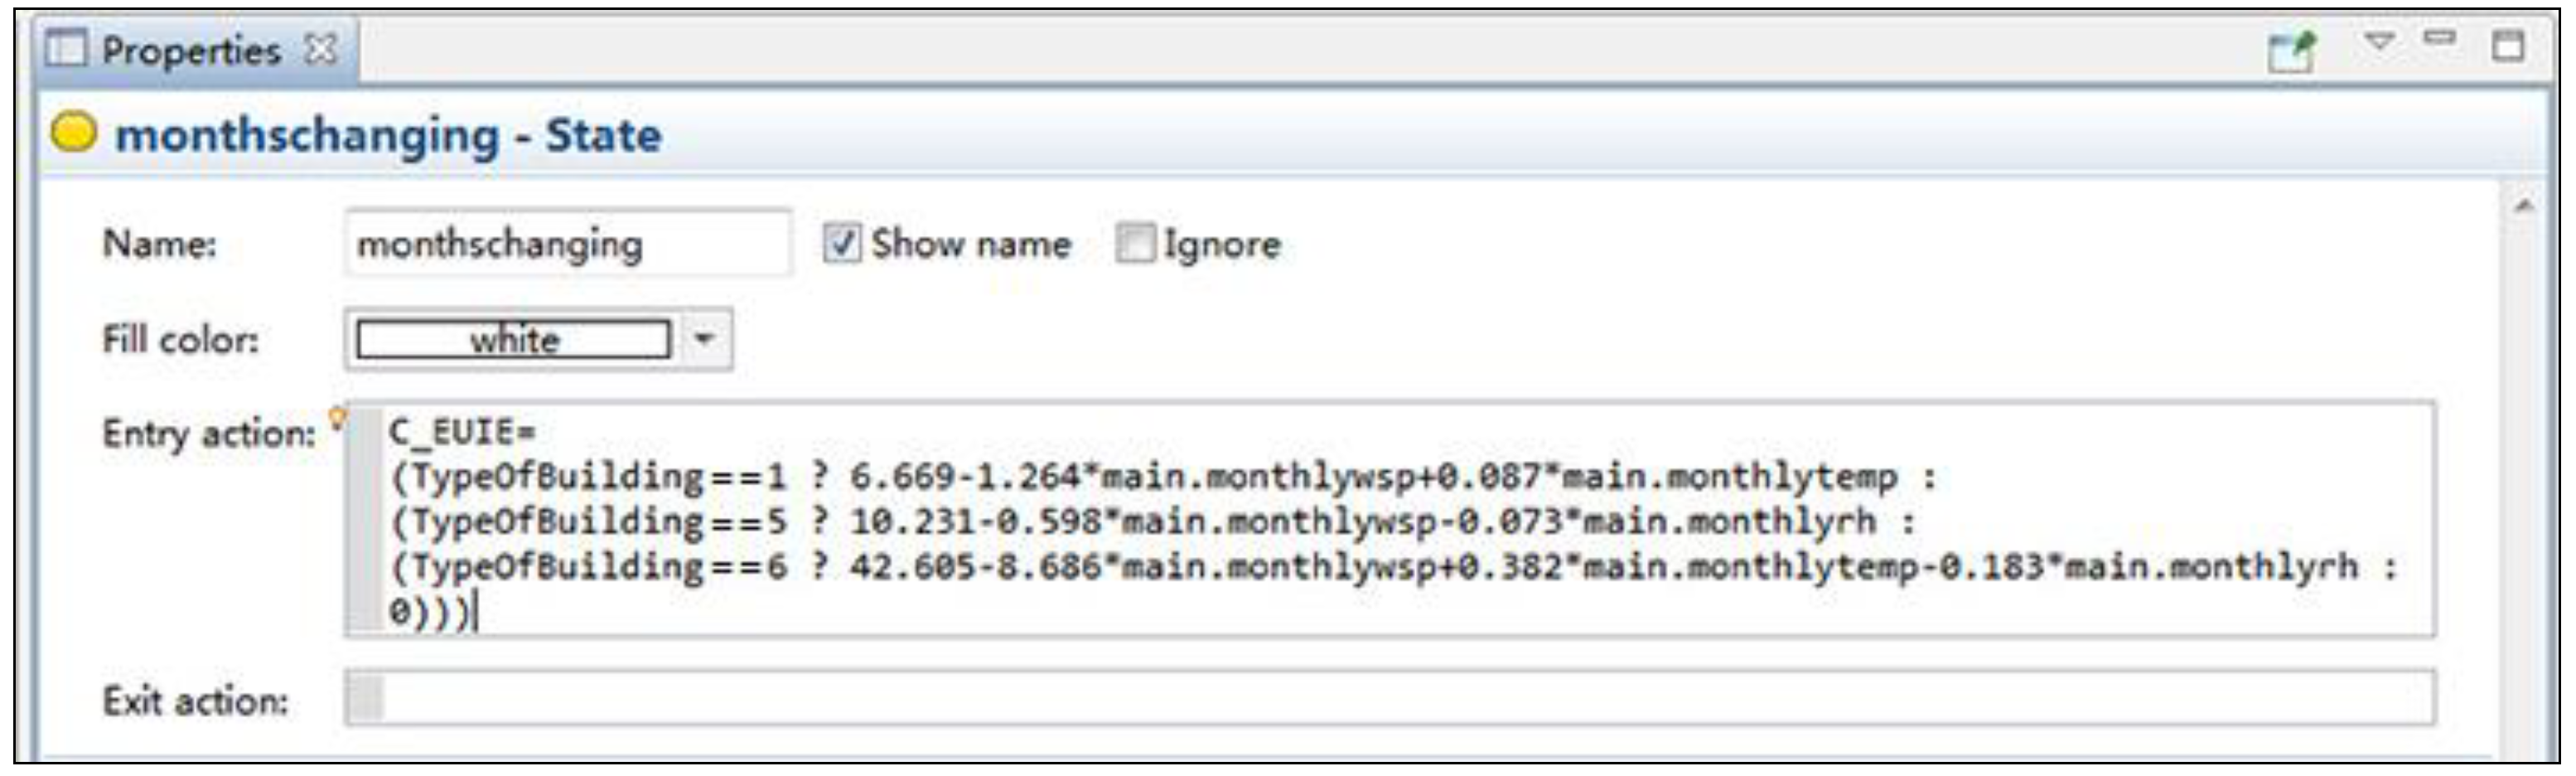
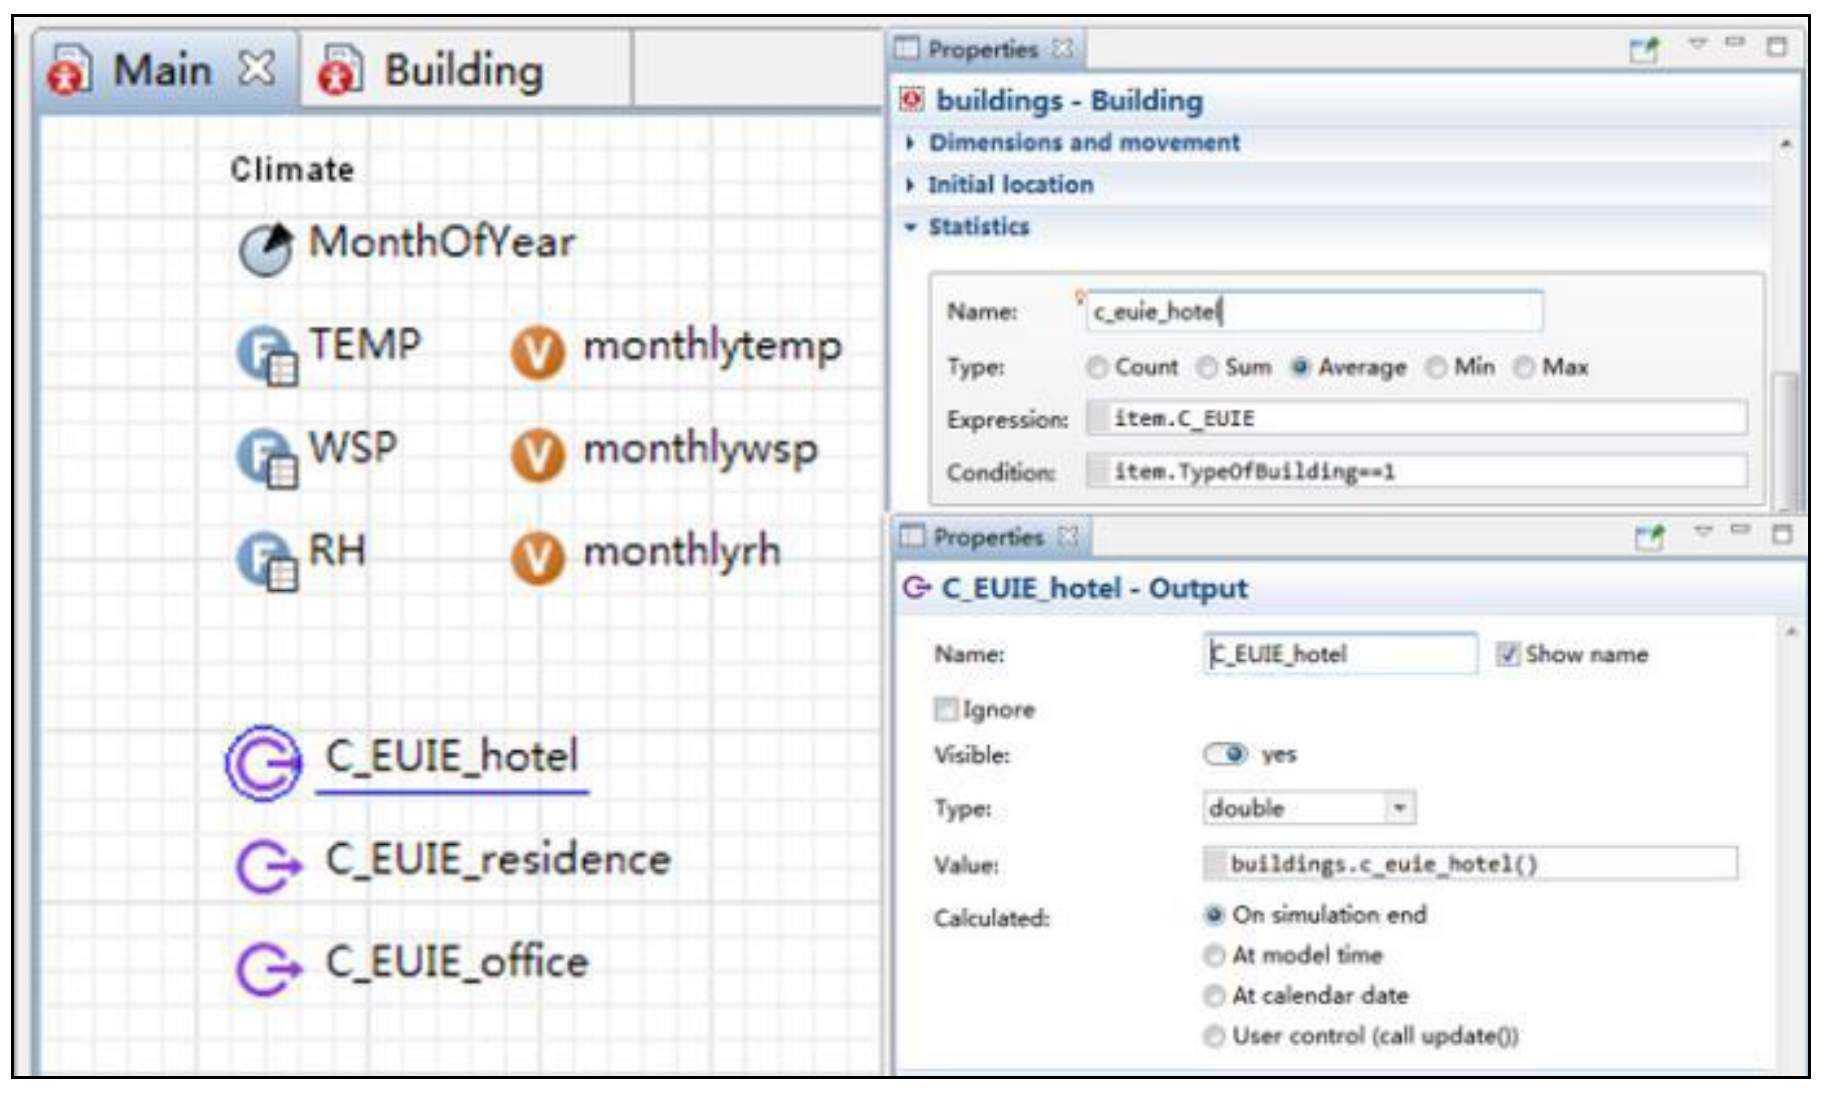
2.3.4. Energy Use Behavior Sub-Model

As energy use behavior plays a decisive role in the energy consumption of residential buildings and is affected by the external climate, a sub-model of energy use behavior linked with climate and household appliances for residential buildings only was conducted. Temperature changes cause a change in resident use behavior of electric appliances for cooling and heating, affecting the total energy consumption of these two kinds of appliances.
The setting of the energy use behavior in the building agent panel is represented by the setting of the resident agent and the household appliance agent. The personal characteristics of the resident are set according to the data collected from the questionnaire. The options for the resident’s personal characteristics are created in the “Option List” under the “Project” panel of the Anylogic model (Figure 5 and Figure 6). The state chart of the resident’s energy-saving awareness is set up on the resident agent panel and changes when an energy-saving event occurs. The household appliance agents take a specific parameter of residents as the rule of their schedule. For example, if the resident’s energy-saving awareness is low, their household appliances will be placed in standby mode when not used. We made a very detailed introduction to the energy use behavior sub-model settings in another article and, limited by article length, and it will not be described again here. Please refer to [62].

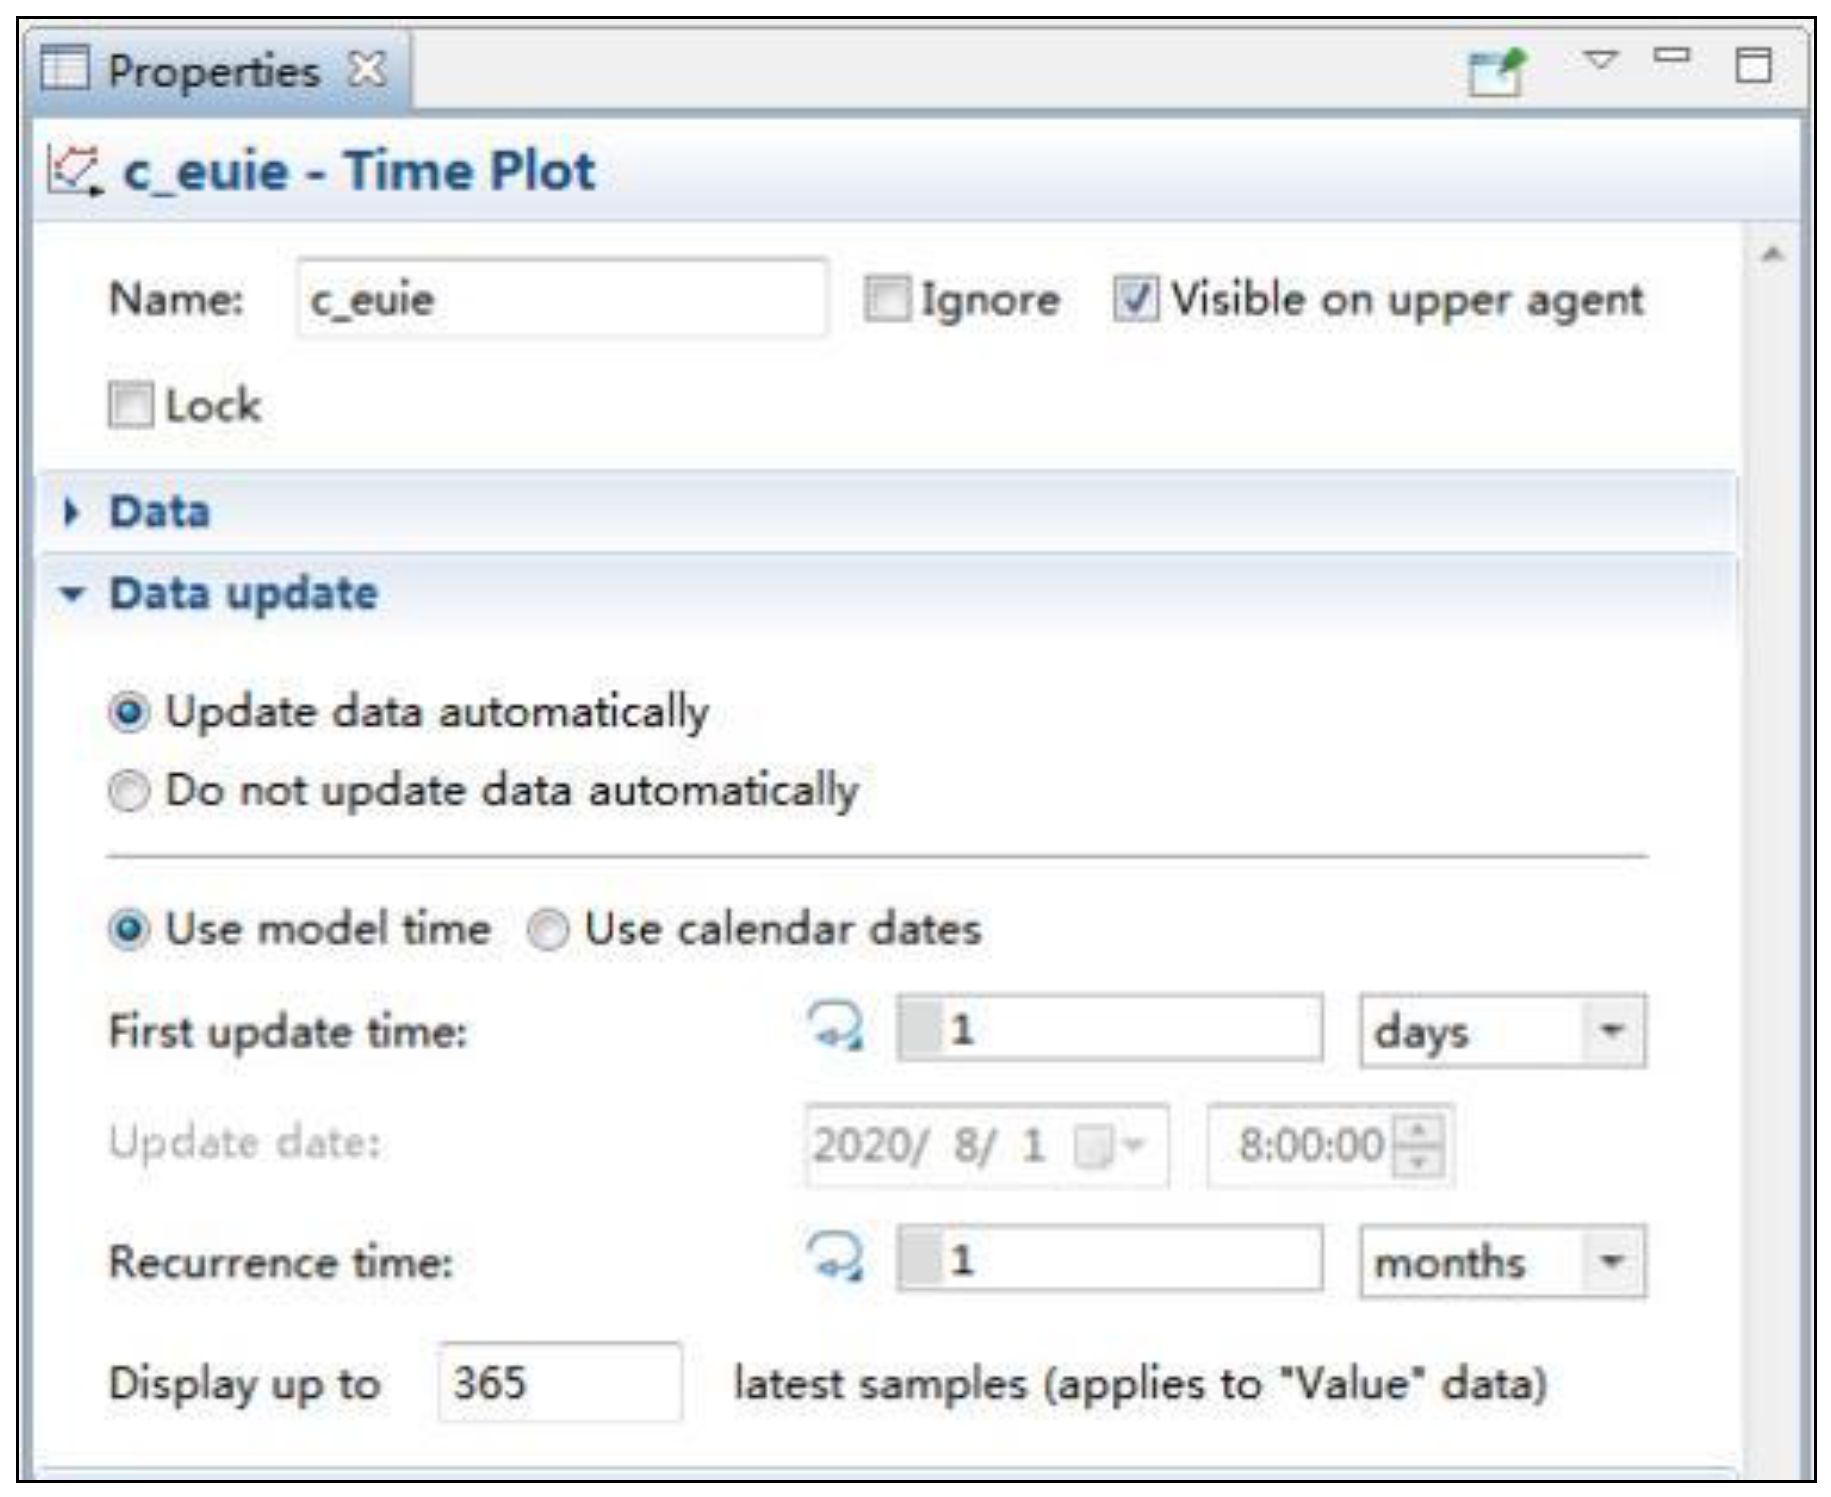
2.3.5. Simulation Output

Under the urban morphology sub-model, the building type should be determined first, as the energy consumption value is calculated according to the building type (Figure 7). The model designed in this study can tell the geographical location according to the block number where the building is located, then calculate the average level of regional building EUI and the total amount.
Compared with the calculation of energy consumption under the fixed urban morphology sub-model, the output of the climate sub-model is relatively complex and abundant. The energy consumption of buildings throughout the year fluctuates seasonally with climate change. Therefore, a time plot or time stack plot was selected for the output of results in the climate sub-model for data visualization. First, select different formulas according to the building type on the building agent panel (Figure 8). Second, set the statistical values on the “Properties” of the building agent group (buildings[...]) on the main panel (Figure 9). It is worth noting that in the climate sub-model, the calculation process needs to be updated every month, whether the energy consumption statistics of individual buildings or at the regional scale (Figure 10).

2.4. Model Validation

In traditional models, independent and dependent variables are associated. However, agent-based models include multiple independent variables and attributes to express the element’s heterogeneity, which makes it difficult to be tested simply by data [69]. The validation of an agent-based model should depend on the model structure.

2.4.1. Statistical Method

Since the urban morphology and climate sub-models were constructed based on statistical methods, we chose statistical test methods to validate these two sub-models. We refer to the method of G. Ciulla to conduct a preliminary analysis of the distribution of standardized residuals to monitor the stability of the model parameter estimates and whether the model could be used in a range outside the sample observations [70]. The effective interval of the standardized residual is (−2, 2). In addition, the mean absolute error (MAE), the mean absolute percentage error (MAPE), the mean square error (MSE), and the root mean square error (RMSE) were also calculated to deeply analyze model errors (Equations (3)–(6)).
M A E = 1 n i = 1 n x i y i   ,
M A P E = 100 1 n i = 1 n x i y i x i
M S E = 1 n i 1 n x i y i 2
R M S E = 1 n i = 1 n x i y i 2
Where x i is the i-th expected output value, y i is the i-th predicted value, and n is the number of records in each sample set.
The results of sub-model validation are shown in Table 9 and Table 10. Whether in the identification or validation sets, the standardized residual values were within the range of (−2, 2), indicating that the datasets are reliable. In the urban morphology sub-model, residential buildings have the best correlations, followed by offices, hotels, and education buildings, and retail buildings have the worst correlations. In the climate sub-model, the MSE of retail buildings is the highest, while that of offices is the lowest. The same conditions are valid for MAE and RMSE. For MAPE, residential buildings have the best correlations, while retail buildings have poor correlations.

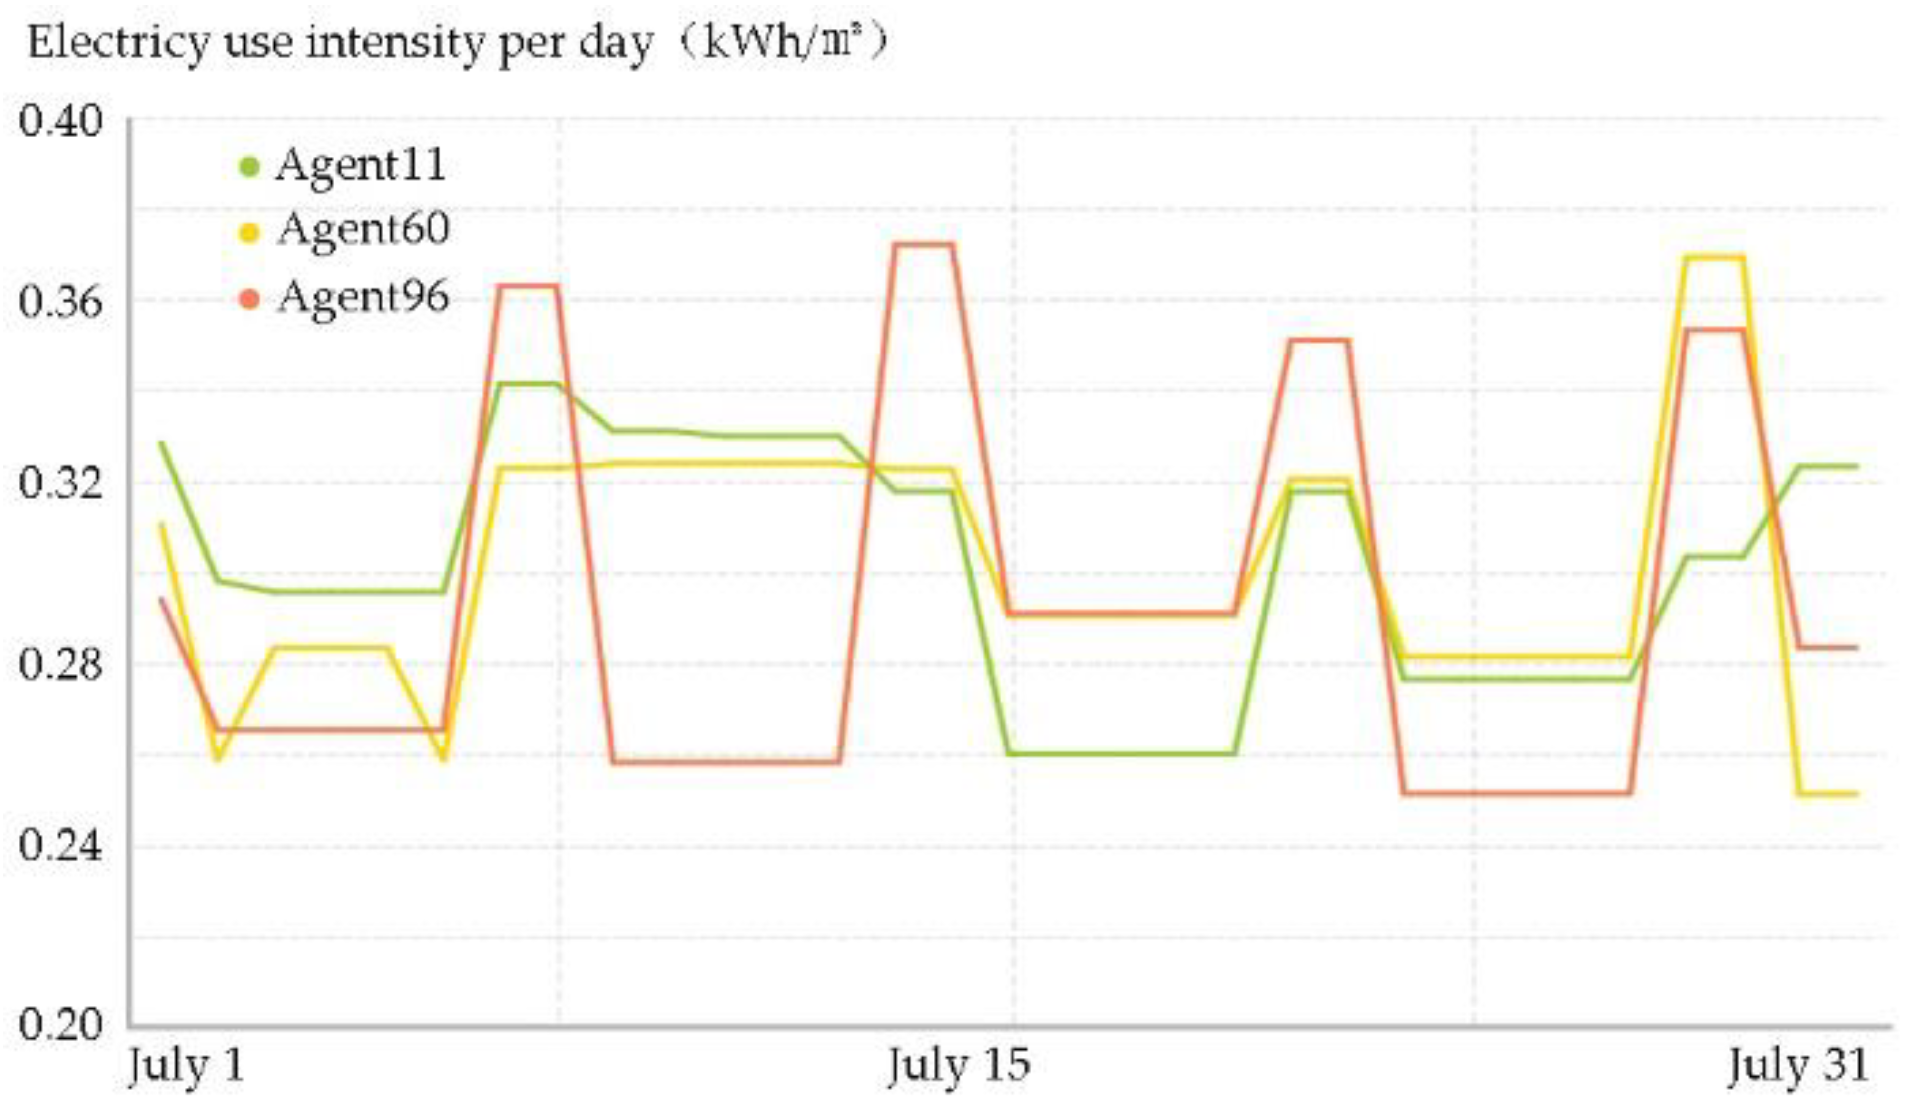
2.4.2. Agent Tracking

A comprehensive test method of agent tracking and factual value verification was used for the energy use behavior sub-model [62]. We randomly observed whether the status of household appliance agents and resident agents changed over time according to the proposed rules of behavior and whether variables and parameters were correctly calculated and updated. Figure 11 shows periodic changes in the daily electricity use: two levels are observed on weekdays and weekends, consistent with the model’s setting of energy use behavior, indicating that the single agent’s status is correct during model operation. The simulation results for the monthly electricity use intensity of 1000 samples were compared with the actual data in terms of cumulative values. The independent sample test results show that the Sig value was >0.05 (Table 11), indicating that the simulated value was very close to the actual value.

3. Simulation Results and Discussion

3.1. Simulation Scenarios and Calculation Output

Here, we explore the application of the model in two scenarios for two types of urban macro-level impact factors. The purpose of the first simulation scenario is to identify how much building energy consumption will be reduced on the land where the simulation is located when the urban morphology factors change for one unit. This result will help urban planners to identify how to adjust the land use type in urban renewal and how the planning of land type in the new urban area can contribute to the overall energy conservation of the city. Table 12 shows the adjusted parameter values of the urban morphology sub-model for different types of buildings. The second scenario in this study simulates the EUI changes of buildings on various types of land for every 1 unit increase in the average temperature, wind speed, and relative humidity. The climate simulation scenario aims to determine the energy-saving effect of different lands and which area is most sensitive. The results are expected to support planners in energy conservation decisions when dealing with climate change.
Since the study aims to discuss the building energy consumption of different land types on a macro-level, rather than a specific type of single building, we divided the simulation area into several blocks for simulation based on the land use classification in the master plan and calculate energy consumption in a block as an extra output unit (Equation (7)). According to China’s land use classification in the master plan, hotels and retail buildings correspond to commercial land. Residential buildings correspond to residential land. Educational buildings correspond to educational land, hospitals correspond to medical land, and offices correspond to office land. The building EUI of each type of land is the average value of such buildings, and the total energy consumption of buildings on each block is the sum of the products of EUI and the area of each building.
E = i = 1 n [ E U I e , i + E U I h , i A i ] ) ]   ,
where E is the total building energy consumption of the block (kWh), n is the number of buildings in the block, E U I e , i is the electricity use intensity of the building i (kWh/m2), E U I h , i is the heating energy use intensity of the building i (kWh/m2), and A i is the total building area of the building i (m2).

3.2. Energy-Saving Potential of Urban Morphology on the Different Types of Land

Table 13 shows the change in values of electricity EUI, heating EUI, and total EUI of buildings on various types of land when the urban morphology factor increases by 1 unit. This part of the simulation ensures that the macro-climate background of the city remains unchanged and the daily life pattern of the resident remains unchanged.
Residential land is the primary type of land use in the main urban area of Harbin and also determines the overall building energy efficiency to a certain extent. The simulation results show that the energy-saving effect of residential land in the west and central areas of the main urban area is noticeable (Figure 12a). For commercial land, the total energy-saving amount in the areas along the river is relatively high, gradually decreasing from the center to the outside (Figure 12b). In contrast, the total energy conservation of buildings in office land, medical land, and educational land is not high (Figure 12c–e), and are all at a low level within the main urban area. Therefore, optimizing urban morphology factors from the perspective of building energy efficiency should prioritize residential land, followed by commercial land.
Land development density is essential to building energy conservation planning and is a meaningful way to achieve energy conservation and land-saving development. In the urban construction process, the planning indicators that do not conform to the development status should be revised in time to ensure that the construction of energy-saving cities can be developed within a controllable range [71]. The development density indicators usually include building density, floor area ratio, and building height. The simulation results show that when the floor area ratio decreases by 0.1, the heating EUI of buildings on the residential land will decrease by 0.97 kWh/m2. The lower the building density, the lower the building electricity EUI of medical land. When the building density decreases by 1%, the building electricity EUI on the medical and health land decreases by 2.52 kWh/m2. The influence of building height on energy consumption is significant in office buildings and education buildings. As the building height increases by 1 m, the building electricity EUI on the office land decreases by 0.28 kWh/m2, and the building electricity EUI on the educational land decreases by 0.81 kWh/m2. However, it is undeniable that not all planning projects can reduce the floor area ratio in practical planning and design due to the limitation of land cost. Although low-density residential areas have many advantages, they must also be strictly restricted [72]. For residential land, the larger the floor area ratio is, the higher the profit will be achieved. The construction of high-rise and high-density residential areas is a passive choice. Therefore, the study suggests that the floor area ratio and building energy conservation can be replaced equivalently through specific policies and financial means.
Consistent with existing research results, the collocation of land use types significantly affects urban energy consumption [73]. The simulation results indicate that the building EUI of residential and commercial land is the most sensitive to urban morphology, which is vital for the energy conservation of urban morphology factors. Moreover, the composition of the urban morphology impact factors of these two types of land are similar. The main factors include shape factor, floor area ratio, and aspect ratio. There is also some internal relationship between the factors. Therefore, the study suggests that residential and commercial land should be arranged adjacent to or across each other. The flexible configuration of mixed commercial and residential buildings in the neighborhood space can realize the collaborative setting and overall management of critical urban morphology factors and ultimately maximize energy efficiency. The energy conservation guidance of urban morphology realized through land use function configuration can help eliminate the differences in environmental energy conservation benefits between neighboring areas and promote the coordinated development of the whole region’s internal blocks.

3.3. Energy-Saving Potential of Climate on the Different Types of Land

Simulation results of the building EUI under the climate scenario are shown in Table 14. During the simulation process, the urban morphology around the building remains unchanged, while the energy use behavior of the occupants adjusts with the temperature change.
Figure 13a shows the change in average annual energy consumption of residential land, commercial land, office land, and medical land in the main urban area of Harbin when the temperature rises by 1℃. The overall building energy consumption in the main urban area shows a downward trend, and the decline in the central area is slightly lower than that in the peripheral areas. The phenomenon that the average annual energy consumption decreases due to the temperature rise is inconsistent with conventional cognition, but it can be explained. Affected by the severe cold climate, the annual heating energy consumption of buildings in Harbin is much higher than its electricity consumption. Therefore, the reduction of heating energy consumption caused by temperatures rising is higher than the increase in electricity consumption, and the total energy consumption drops. However, considering the energy use behavior of residents, with the increase in temperature, the demand for cooling equipment will gradually increase. Therefore, the impact of temperature on total building energy consumption on various types of land will not permanently be the same. The energy consumption of commercial and office land decreases significantly, but these two types of land proportions are low. Figure 13b shows the change in building energy consumption on four types of land, namely residential, commercial, office, and education, in the main urban area of Harbin when the average wind speed rises by 1 m/s. The simulation results show that the average annual energy consumption of buildings on most of the land in the main urban area rises, and the rising rate in the central area is slightly lower than that in the peripheral areas. Figure 13c shows the energy consumption changes of buildings on land for residential and office use in the main urban area of Harbin when the average relative humidity is increased by 1%. Due to the relatively low proportion of office land, the impact of the increase in humidity on the energy consumption of buildings in the main urban area is mainly reflected in the residential land, in which it slightly increases in varying degrees.
The primary energy-saving potential area dominated by temperature in the main urban area is concentrated in the northern area along the river, showing a decreasing trend from northwest to southeast. The energy-saving potential areas dominated by wind speed are alternately distributed, and the areas with high potential are mostly extended in the north-to-south direction. The energy-saving potential area dominated by relative humidity coincides with the potential area of temperature and wind speed. By comparison, the area with high potential to the north of the river is relatively scattered, while the area to the south is relatively concentrated. We speculate that this layout is related to the development level of different city areas. The construction integrity of the area north of the river is not as good as that of the area south of the river.
Because of this difference, the researchers believe the energy conservation measures for climate regulation in these two regions should be different. The area south of the river is the center of the main urban area of Harbin, and the current development stage determines that the built space is challenging to change significantly within a certain period. This also determines that “soft” measures should be taken for energy-saving. Recent research has found that the green area ratio is one of the critical factors affecting low-carbon urban environmental planning strategy [74,75]. Therefore, more ecological means should be used to adjust the climate for different lands. First, more small scattered urban green space is suggested to be increased. At the same time, the existing green space that cannot effectively play the role of energy conservation can also be optimized by adjusting and improving plant types, reserving and transplanting trees, shrubs, and grasslands, reasonably allocating vegetation types, and designing vegetation hierarchy so as to improve the ecological benefit level of the urban landscape system [76]. For areas north of the river that are under construction and have low urban density, in addition to the above methods, the optimization and reconstruction of a climate-oriented energy-saving pattern can also be further considered at the planning level, such as ventilation corridors, landscape pattern networks, climate protection measures, and so forth.

4. Conclusions

The impact of urban macro-level factors on building energy consumption is nonnegligible. Due to the complexity of the urban environment, it is necessary to establish a model that can comprehensively analyze various impact factors and then accurately simulate building energy consumption. In this study, the agent-based modeling method is used to integrate multiple impact factors in the same model. Scenario simulation is used to explore the building energy-saving potential of different types of land in the city when the impact factors change.
The simulation results show that urban morphology's impact on overall urban building energy consumption is mainly reflected in residential and commercial land. The study suggests that the overall building energy consumption on the land can be reduced through the control of land development intensity indicators (building density, plot ratio, and building height) and the coordination of land type layout and configuration. Each climate factor impacts the building energy consumption of different types of land, but due to the large proportion of residential land, its energy-saving potential is more pronounced. According to the distribution of land with high energy-saving potential in the overall pattern of the city, the study proposes methods to adjust the climate for high-density built-up areas and low-density built-up areas to help achieve an environment conducive to energy conservation.
From the methodology perspective, the construction of the model is the integrated application of statistical data, spatial data, policy data, and other multivariate Big Data, which has certain universality and promotional significance for cities or regions with the same spatial scale, climate conditions, and development level. Compared with other existing tools, one of the core advantages is that this model is built from the perspective of urban planning, which is more convenient for planners to use. However, efforts should be made to develop the model, which (1) has simple details and technical implications and (2) is complex enough to include more urban macro-level factors [77]. We believe that this is one of the challenges of using agent-based models to support urban building energy conservation planning.
The limitations of the sample data and the randomness of resident energy use behavior may lead to potential inaccuracies in the model. Meanwhile, other impact factors affecting energy use also exist but are not included in the model for the current stage, as they are not available from open sources. In addition, it is notable that in order to discuss the impact of the urban environment on the overall energy consumption of buildings on different lands, we controlled the variables of the building envelope through some conditions when selecting sample buildings, which also has a significant impact on building energy consumption [78,79]. However, due to a large number of buildings, it is still difficult to ensure the construction of each building. For example, the air tightness of buildings and the quality of thermal insulation devices are identical. These differences will also affect the energy performance of a building, which may lead to potential simulation errors. Due to the limitations above, we will improve the model and research in the following aspects in the future: (1) Building types. This study only discusses six types of buildings and five types of land. In the follow-up study, we will continue exploring the relationship between the urban environment and building energy consumption for other land types and land use structures. (2) Database. Due to the limited available data, this study’s selection of urban macro-level parameters is not the only variable suitable for the research purpose. The potential impact of other factors will be discussed in the future. (3) Simulation scenario. In this paper, we only designed two ideal simulation scenarios. For the next step, the simulation scenarios will be matched with the current planning, and the possible energy-saving effect of the current energy conservation planning will be evaluated. (4) Model structure extension. In order to expand the application of the model, we will consider embedding an appropriate climate model in the subsequent study to achieve a more independent prediction of the overall energy consumption of buildings under future climate conditions.

Author Contributions

Conceptualization, S.S. and H.L.; data curation, S.S. and R.G.; formal analysis, S.S.; funding acquisition, H.L. and S.S.; investigation, S.S. and R.G.; methodology, S.S.; project administration, H.L.; resources, S.S.; software, S.S.; supervision, H.L.; validation, S.S. and R.G.; visualization, S.S.; writing—original draft, S.S.; writing—review & editing, S.S. All authors have read and agreed to the published version of the manuscript.

Funding

This research was funded by the National Natural Science Foundation of China, grant number 51678178, and by the Natural Science Foundation of Education Department of Shaanxi Provincial Government, grant number 22JK0431.

Data Availability Statement

Not applicable.

Acknowledgments

The authors would like to thank the anonymous referees and the editors for their helpful suggestions on the earlier draft of the paper.

Conflicts of Interest

The authors declare no conflict of interest. The funders had no role in the design of the study; in the collection, analyses, or interpretation of data; in the writing of the manuscript; or in the decision to publish the results.

References

  1. United Nations Department of Economic and Social Affairs. World Urbanization Prospects: The 2018 Revision (ST/ESA/SER.A/420); United Nations Department of Economic and Social Affairs: New York, NY, USA, 2019. [Google Scholar]
  2. International Energy Agency. Energy Technology Perspectives 2016; International Energy Agency: Paris, France, 2016. [Google Scholar]
  3. Yang, L.; Yan, H.; Lam, J.C. Thermal comfort and building energy consumption implications–A review. Appl. Energy 2014, 115, 164–173. [Google Scholar] [CrossRef]
  4. Oh, M.; Jang, K.M.; Kim, Y. Empirical analysis of building energy consumption and urban form in a large city: A case of Seoul, South Korea. Energy Build. 2021, 245, 111046. [Google Scholar] [CrossRef]
  5. Dibene-Arriola, L.M.; Carrillo-González, F.M.; Quijas, S.; Rodríguez-Uribe, M.C. Energy efficiency indicators for hotel buildings. Sustainability 2021, 13, 1754. [Google Scholar] [CrossRef]
  6. William, M.A.; Suárez-López, M.J.; Soutullo, S.; Hanafy, A.A. Building envelopes toward energy-efficient buildings: A balanced multi-approach decision making. Int. J. Energy Res. 2021, 15, 21096–21113. [Google Scholar] [CrossRef]
  7. Franco, A.; Miserocchi, L.; Testi, D. HVAC energy saving strategies for public buildings based on heat pumps and demand controlled ventilation. Energies 2021, 14, 5541. [Google Scholar] [CrossRef]
  8. De Rubeis, T.; Giacchetti, L.; Paoletti, D.; Ambrosini, D. Building energy performance analysis at urban scale: A supporting tool for energy strategies and urban building energy rating identification. Sustain. Cities Soc. 2021, 74, 103220. [Google Scholar] [CrossRef]
  9. Yang, Z.; Li, Z.; Augenbroe, G. Development of prototypical buildings for urban scale building energy modeling: A reduced order energy model approach. Sci. Technol. Built Environ. 2018, 24, 33–42. [Google Scholar] [CrossRef]
  10. Zheng, Z.; Chen, J.; Luo, X. Parallel computational building-chain model for rapid urban-scale energy simulation. Energy Build. 2019, 201, 37–52. [Google Scholar] [CrossRef]
  11. Deng, Z.; Chen, Y.; Yang, J.; Chen, Z. Archetype identification and urban building energy modeling for city-scale buildings based on GIS datasets. Build. Simul. 2022, 15, 1547–1559. [Google Scholar] [CrossRef]
  12. Delmastro, C.; Gargiulo, M. Capturing the long-term interdependencies between building thermal energy supply and demand in urban planning strategies. Appl. Energy 2020, 268, 114774. [Google Scholar] [CrossRef]
  13. Yu, H.; Wang, M.; Lin, X.; Guo, H.; Liu, H.; Zhao, Y.; Wang, H.; Li, C.; Jing, R. Prioritizing urban planning factors on community energy performance based on GIS-informed building energy modeling. Energy Build. 2021, 249, 111191. [Google Scholar] [CrossRef]
  14. Moghadam, S.T.; Delmastro, C.; Corgnati, S.P.; Lombardi, P. Urban energy planning procedure for sustainable development in the built environment: A review of available spatial approaches. J. Clean. Prod. 2017, 165, 811–827. [Google Scholar] [CrossRef]
  15. Zanon, B.; Verones, S. Climate change, urban energy and planning practices: Italian experiences of innovation in land management tools. Land Use Policy 2013, 32, 343–355. [Google Scholar] [CrossRef]
  16. Yeo, I.-A.; Yoon, S.-H.; Yee, J.-J. Development of an urban energy demand forecasting system to support environmentally friendly urban planning. Appl. Energy 2013, 110, 304–317. [Google Scholar] [CrossRef]
  17. Wang, M.; Kexin, L. Transportation model application for the planning of low carbon city–take Xining city in China as example. Procedia Comput. Sci. 2013, 19, 835–840. [Google Scholar] [CrossRef] [Green Version]
  18. Shareef, S. The impact of urban morphology and building’s height diversity on energy consumption at urban scale. The case study of Dubai. Build. Environ. 2021, 194, 107675. [Google Scholar] [CrossRef]
  19. Lee, G.; Jeong, Y. Impact of urban and building form and microclimate on the energy consumption of buildings-based on statistical analysis. J. Asian Archit. Build. Eng. 2017, 16, 565–572. [Google Scholar] [CrossRef] [Green Version]
  20. Zhang, J.; Xie, Y.; Luan, B.; Chen, X. Urban macro-level impact factors on Direct CO2 Emissions of urban residents in China. Energy Build. 2015, 107, 131–143. [Google Scholar] [CrossRef]
  21. Shen, P.; Wang, Z. How neighborhood form influences building energy use in winter design condition: Case study of Chicago using CFD coupled simulation. J. Clean. Prod. 2020, 261, 121094. [Google Scholar] [CrossRef]
  22. Ramponi, R.; Blocken, B.; Laura, B.; Janssen, W.D. CFD simulation of outdoor ventilation of generic urban configurations with different urban densities and equal and unequal street widths. Build. Environ. 2015, 92, 152–166. [Google Scholar] [CrossRef]
  23. Mouzourides, P.; Kyprianou, A.; Neophytou, M.K.-A.; Ching, J.; Choudhary, R. Linking the urban-scale building energy demands with city breathability and urban form characteristics. Sustain. Cities Soc. 2019, 49, 101460. [Google Scholar] [CrossRef]
  24. Liu, J.; Heidarinejad, M.; Gracik, S.; Srebric, J. The impact of exterior surface convective heat transfer coefficients on the building energy consumption in urban neighborhoods with different plan area densities. Energy Build. 2015, 86, 449–463. [Google Scholar] [CrossRef]
  25. Allen-Dumas, M.R.; Rose, A.N.; New, J.R.; Omitaomu, O.A.; Yuan, J.; Branstetter, M.L.; Sylvester, L.M.; Seals, M.B.; Carvalhaes, T.M.; Adams, M.B. Impacts of the morphology of new neighborhoods on microclimate and building energy. Renew. Sustain. Energy Rev. 2020, 133, 110030. [Google Scholar] [CrossRef]
  26. Steemers, K. Energy and the city: Density, buildings and transport. Energy Build. 2003, 35, 3–14. [Google Scholar] [CrossRef]
  27. Mirzaei, P.A.; Haghighat, F.; Nakhaie, A.A.; Yagouti, A.; Giguère, M.; Keusseyan, R.; Coman, A. Indoor thermal condition in urban heat Island–Development of a predictive tool. Build. Environ. 2012, 57, 7–17. [Google Scholar] [CrossRef]
  28. Mirzaei, P.A.; Olsthoorn, D.; Torjan, M.; Haghighat, F. Urban neighborhood characteristics influence on a building indoor environment. Sustain. Cities Soc. 2015, 19, 403–413. [Google Scholar] [CrossRef] [Green Version]
  29. Ahn, Y.; Sohn, D.-W. The effect of neighbourhood-level urban form on residential building energy use: A GIS-based model using building energy benchmarking data in Seattle. Energy Build. 2019, 196, 124–133. [Google Scholar] [CrossRef]
  30. De Lemos Martins, T.A.; Adolphe, L.; Bastos, L.E.G.; de Lemos Martins, M.A. Sensitivity analysis of urban morphology factors regarding solar energy potential of buildings in a Brazilian tropical context. Sol. Energy 2016, 137, 11–24. [Google Scholar] [CrossRef]
  31. Ashtiani, A.; Mirzaei, P.A.; Haghighat, F. Indoor thermal condition in urban heat island: Comparison of the artificial neural network and regression methods prediction. Energy Build. 2014, 76, 597–604. [Google Scholar] [CrossRef]
  32. Giridharan, R.; Lau, S.; Ganesan, S.; Givoni, B. Urban design factors influencing heat island intensity in high-rise high-density environments of Hong Kong. Build. Environ. 2007, 42, 3669–3684. [Google Scholar] [CrossRef]
  33. Song, S.; Leng, H.; Xu, H.; Guo, R.; Zhao, Y. Impact of urban morphology and climate on heating energy consumption of buildings in severe cold regions. Int. J. Environ. Res. Public Health 2020, 17, 8354. [Google Scholar] [CrossRef]
  34. Reinhart, C.F.; Davila, C.C. Urban building energy modeling—A review of a nascent field. Build. Environ. 2016, 97, 196–202. [Google Scholar] [CrossRef] [Green Version]
  35. Swan, L.G.; Ugursal, V.I. Modeling of end-use energy consumption in the residential sector: A review of modeling techniques. Renew. Sustain. Energy Rev. 2009, 13, 1819–1835. [Google Scholar] [CrossRef]
  36. Johari, F.; Peronato, G.; Sadeghian, P.; Zhao, X.; Widén, J. Urban building energy modeling: State of the art and future prospects. Renew. Sustain. Energy Rev. 2020, 128, 109902. [Google Scholar] [CrossRef]
  37. Johari, F.; Munkhammar, J.; Shadram, F.; Widén, J. Evaluation of simplified building energy models for urban-scale energy analysis of buildings. Build. Environ. 2022, 211, 108684. [Google Scholar] [CrossRef]
  38. Kämpf, J.H.; Robinson, D. A simplified thermal model to support analysis of urban resource flows. Energy Build. 2007, 39, 445–453. [Google Scholar] [CrossRef]
  39. Dogan, T.; Reinhart, C. Shoeboxer: An algorithm for abstracted rapid multi-zone urban building energy model generation and simulation. Energy Build. 2017, 140, 140–153. [Google Scholar] [CrossRef]
  40. Sola, A.; Corchero, C.; Salom, J.; Sanmarti, M. Simulation tools to build urban-scale energy models: A review. Energies 2018, 11, 3269. [Google Scholar] [CrossRef] [Green Version]
  41. Rasheed, A. Multiscale Modelling of Urban Climate; EPFL: Lausanne, Switzerland, 2009. [Google Scholar]
  42. Wei, Y.; Zhang, X.; Shi, Y.; Xia, L.; Pan, S.; Wu, J.; Han, M.; Zhao, X. A review of data-driven approaches for prediction and classification of building energy consumption. Renew. Sustain. Energy Rev. 2018, 82, 1027–1047. [Google Scholar] [CrossRef]
  43. Tardioli, G.; Kerrigan, R.; Oates, M.; James, O.D.; Finn, D. Data driven approaches for prediction of building energy consumption at urban level. Energy Procedia 2015, 78, 3378–3383. [Google Scholar] [CrossRef]
  44. Bourdeau, M.; Zhai, X.Q.; Nefzaoui, E.; Guo, X.; Chatellier, P. Modeling and forecasting building energy consumption: A review of data-driven techniques. Sustain. Cities Soc. 2019, 48, 101533. [Google Scholar] [CrossRef]
  45. Fumo, N. A review on the basics of building energy estimation. Renew. Sustain. Energy Rev. 2014, 31, 53–60. [Google Scholar] [CrossRef]
  46. Li, Z.; Han, Y.; Xu, P. Methods for benchmarking building energy consumption against its past or intended performance: An overview. Appl. Energy 2014, 124, 325–334. [Google Scholar] [CrossRef]
  47. Ashrae, A.H. Fundamentals; IP Edition; American Society of Heating, Refrigerating and Air-Conditioning Engineers, Inc.: Atlanta, GA, USA, 2009. [Google Scholar]
  48. Yildiz, B.; Bilbao, J.I.; Sproul, A.B. A review and analysis of regression and machine learning models on commercial building electricity load forecasting. Renew. Sustain. Energy Rev. 2017, 73, 1104–1122. [Google Scholar] [CrossRef]
  49. Daut, M.A.M.; Hassan, M.Y.; Abdullah, H.; Rahman, H.A.; Abdullah, M.P.; Hussin, F. Building electrical energy consumption forecasting analysis using conventional and artificial intelligence methods: A review. Renew. Sustain. Energy Rev. 2017, 70, 1108–1118. [Google Scholar] [CrossRef]
  50. Liu, Z.; Wu, D.; Liu, Y.; Han, Z.; Lun, L.; Gao, J.; Jin, G.; Cao, G. Accuracy analyses and model comparison of machine learning adopted in building energy consumption prediction. Energy Explor. Exploit. 2019, 37, 1426–1451. [Google Scholar] [CrossRef] [Green Version]
  51. Lee, K.-h.; Braun, J.E. Development of methods for determining demand-limiting setpoint trajectories in buildings using short-term measurements. Build. Environ. 2008, 43, 1755–1768. [Google Scholar] [CrossRef]
  52. Wang, S.; Xu, X. Simplified building model for transient thermal performance estimation using GA-based parameter identification. Int. J. Therm. Sci. 2006, 45, 419–432. [Google Scholar] [CrossRef]
  53. Bonabeau, E. Agent-based modeling: Methods and techniques for simulating human systems. Proc. Natl. Acad. Sci. USA 2002, 99, 7280–7287. [Google Scholar] [CrossRef] [Green Version]
  54. Macal, C.M.; North, M.J. Agent-based modeling and simulation: ABMS examples. In Proceedings of the 2008 Winter Simulation Conference, Miami, FL, USA, 7–10 December 2008; pp. 101–112. [Google Scholar]
  55. Berger, C.; Mahdavi, A. Review of current trends in agent-based modeling of building occupants for energy and indoor-environmental performance analysis. Build. Environ. 2020, 173, 106726. [Google Scholar] [CrossRef]
  56. Nägeli, C.; Jakob, M.; Catenazzi, G.; Ostermeyer, Y. Towards agent-based building stock modeling: Bottom-up modeling of long-term stock dynamics affecting the energy and climate impact of building stocks. Energy Build. 2020, 211, 109763. [Google Scholar] [CrossRef]
  57. Railsback, S.F.; Grimm, V. Agent-Based and Individual-Based Modeling: A Practical Introduction; Princeton University Press: Princeton, NJ, USA, 2019. [Google Scholar]
  58. Hurtado, L.; Nguyen, P.; Kling, W. Agent-based control for building energy management in the smart grid framework. In Proceedings of the IEEE PES Innovative Smart Grid Technologies, Europe, Istanbul, Turkey, 12–15 October 2014; pp. 1–6. [Google Scholar]
  59. De Durana, J.M.G.; Barambones, O.; Kremers, E.; Varga, L. Agent based modeling of energy networks. Energy Convers. Manag. 2014, 82, 308–319. [Google Scholar] [CrossRef] [Green Version]
  60. Uddin, M.N.; Chi, H.-L.; Wei, H.-H.; Lee, M.; Ni, M. Influence of interior layouts on occupant energy-saving behaviour in buildings: An integrated approach using agent-based modelling, system dynamics and building information modelling. Renew. Sustain. Energy Rev. 2022, 161, 112382. [Google Scholar] [CrossRef]
  61. Ding, Z.; Hu, T.; Li, M.; Xu, X.; Zou, P.X. Agent-based model for simulating building energy management in student residences. Energy Build. 2019, 198, 11–27. [Google Scholar] [CrossRef]
  62. Song, S.-Y.; Leng, H. Modeling the household electricity usage behavior and energy-saving management in severely cold regions. Energies 2020, 13, 5581. [Google Scholar] [CrossRef]
  63. Papadopoulos, S.; Azar, E. Integrating building performance simulation in agent-based modeling using regression surrogate models: A novel human-in-the-loop energy modeling approach. Energy Build. 2016, 128, 214–223. [Google Scholar] [CrossRef]
  64. Azar, E.; Menassa, C.C. Agent-based modeling of occupants and their impact on energy use in commercial buildings. J. Comput. Civ. Eng. 2012, 26, 506–518. [Google Scholar] [CrossRef]
  65. Walter, T.; Sohn, M.D. A regression-based approach to estimating retrofit savings using the building performance database. Appl. Energy 2016, 179, 996–1005. [Google Scholar] [CrossRef] [Green Version]
  66. Tellier, L.-N. Characterizing urban form by means of the urban metric system. Land Use Policy 2021, 111, 104672. [Google Scholar] [CrossRef]
  67. Equere, V.; Mirzaei, P.A.; Riffat, S. Definition of a new morphological parameter to improve prediction of urban heat island. Sustain. Cities Soc. 2020, 56, 102021. [Google Scholar] [CrossRef]
  68. Xu, X.; AzariJafari, H.; Gregory, J.; Norford, L.; Kirchain, R. An integrated model for quantifying the impacts of pavement albedo and urban morphology on building energy demand. Energy Build. 2020, 211, 109759. [Google Scholar] [CrossRef]
  69. Batty, M.; Torrens, P.M. Modelling and prediction in a complex world. Futures 2005, 37, 745–766. [Google Scholar] [CrossRef]
  70. Ciulla, G.; D’Amico, A. Building energy performance forecasting: A multiple linear regression approach. Appl. Energy 2019, 253, 113500. [Google Scholar] [CrossRef]
  71. Gao, S.; Zhang, H. Urban planning for low-carbon sustainable development. Sustain. Comput. Inform. Syst. 2020, 28, 100398. [Google Scholar] [CrossRef]
  72. Lu, M.; Sun, G.; He, Z. Analysis and evaluation of factors influencing the low-carbon effect of urban high-rise settlement planning schemes based on AHP-fuzzy comprehensive evaluation method. Math. Probl. Eng. 2022, 2022, 9529110. [Google Scholar] [CrossRef]
  73. Wang, G.; Han, Q.; de Vries, B. The multi-objective spatial optimization of urban land use based on low-carbon city planning. Ecol. Indic. 2021, 125, 107540. [Google Scholar] [CrossRef]
  74. Wang, X.; Wang, Y. Study of key factors influencing low carbon urban environmental planning strategy. J. Environ. Prot. Ecol. 2021, 22, 893–900. [Google Scholar]
  75. Penazzi, S.; Accorsi, R.; Manzinia, R. Planning low carbon urban-rural ecosystems: An integrated transport land-use model. J. Clean. Prod. 2019, 235, 96–111. [Google Scholar] [CrossRef]
  76. Yu, Y. Explore the theoretical basis and implementation strategy of low-carbon urban community planning. Front. Environ. Sci. 2022, 10, 989318. [Google Scholar] [CrossRef]
  77. Hukkalainen, M.; Virtanen, M.; Paiho, S.; Airaksinen, M. Energy planning of low carbon urban areas—Examples from Finland. Sustain. Cities Soc. 2017, 35, 715–728. [Google Scholar] [CrossRef]
  78. Llantoy, N.; Chafer, M.; Cabeza, L.F. A comparative life cycle assessment (LCA) of different insulation materials for buildings in the continental Mediterranean climate. Energy Build. 2020, 225, 110323. [Google Scholar] [CrossRef]
  79. Heravi, G.; Salehi, M.M.; Rostami, M. Identifying cost-optimal options for a typical residential nearly zero energy building’s design in developing countries. Clean Technol. Environ. Policy 2020, 22, 2107–2128. [Google Scholar] [CrossRef]
Figure 1. The setting of “Number of block”.
Land 11 01986 g001
Figure 2. The setting of urban morphology variables.
Land 11 01986 g002
Figure 3. The setting of the command for the assignment of urban morphology variables.
Land 11 01986 g003
Figure 4. Urban morphology parameter update.
Land 11 01986 g004
Figure 5. Personal characteristic options.
Land 11 01986 g005
Figure 6. Personal characteristic parameter assignment command.
Land 11 01986 g006
Figure 7. Calculation command under the urban morphology sub-model of the building agent.
Land 11 01986 g007
Figure 8. Calculation command under the climate sub-model of the building agent.
Land 11 01986 g008
Figure 9. Simulation output of the energy consumption under the climate sub-model on the main panel.
Land 11 01986 g009
Figure 10. Update settings of climate sub-model data.
Land 11 01986 g010
Figure 11. Electricity use intensity validation for a single agent [62].
Land 11 01986 g011
Figure 12. Annual energy conservation of different types of land. (a) Residential land; (b) commercial land; (c) office land; (d) medical land; (e) educational land.
Land 11 01986 g012
Figure 13. Change in average annual building energy consumption of the main urban area. (a) The average temperature increases by 1 °C; (b) the average wind speed increases by 1 m/s; (c) The relative humidity increases by 1%.
Land 11 01986 g013
Table 1. The value range of parameters of selected buildings.
TypeBuilding Height (m)Total Building Area (m2)Building Floor Area (m2)
Hotel5.92–108.73941.13–6036.59172.00–4018.23
Retail building6.00–97.001536.60–238437.16269.12–101453.12
Hospital3.29–57.42810.65–76286.13223.51–3632.20
Educational building3.49–57.00503.04–85500.63174.10–6276.32
Residential building11.39–111.84158.06-45679.20158.06–5279.00
Office building4.00–115.25941.61–106209.6550.30–5373.42
Table 2. The descriptive statistics of annual EUI.
Norma
Distribution Test
Minimum Value (kWh/m2)Maximum Value (kWh/m2)Average Value (kWh/m2)Standard
Deviation (kWh/m2)
Sig
0.06104.72622.93216.2577.44
Table 3. Parameter setting of urban morphology factors.
Building TypeBuilding Density (%)Building Height (m)Floor Area RatioAspect
Ratio
Shape
Factor
Hotel14.65–73.445.96–108.730.60–4.400.11–3.620.15–0.54
Retail building12.39–58.796.20–97.000.73–5.960.15–1.760.09–0.55
Hospital17.12–63.433.29–57.420.49–5.010.06–1.920.14–0.53
Educational Building1.61–64.683.49–121.010.03–4.060.10–2.200.09–0.54
Residential Building10.38–56.7411.39–111.840.45–4.060.22–3.610.14–0.47
Office building12.23–78.274.00–115.250.46–5.620.06–3.650.11–0.53
Table 4. Stepwise regression results of urban morphology factors and building electricity EUI.
Building TypeVariableDenormalization
Coefficient
Standardization
Coefficient
R2
Retail building(constant)21.0810.119
Shape factor357.3460.345
Hospital(constant)−17.890.146
Building density (%)2.5140.382
Educational building(constant)50.9640.103
Building height (m)−0.775−0.320
Residential building(constant)−18.7320.102
Shape factor266.6320.320
Office building(constant)51.5190.105
Building height (m)−0.279−0.223
Table 5. Stepwise regression results of urban morphology factors and building heating EUI.
Building TypeVariableDenormalization
Coefficient
Standardization
Coefficient
R2
Hotel(constant)192.0370.189
Building height (m)−0.601−0.435
Retail building(constant)105.5080.522
Aspect ratio51.450.376
Shape factor239.710.413
Educational building(constant)170.2110.176
Building height (m)−0.65−0.271
Residential building(constant)99.0130.190
Floor area ratio9.5160.247
Shape factor217.7620.350
Office building(constant)179.6420.126
Building height (m)−0.369−0.355
Table 6. Parameter setting of climate factors.
MonthTemperature (°C)Wind Speed (m/s)Relative Humidity (%)
12.57−16.5671.48
23−1167.9
32.6−1.762.2
43.849.1345.52
54.6816.6449.2
62.819.967.9
72.624.770
8322.176
92.81569.7
103.36.253.9
113.3−5.761.6
122.3−17.166.6
Table 7. Stepwise regression results of climate factors and building electricity EUI.
Building TypeVariableDenormalization
Coefficient
Standardization
Coefficient
R2
Hotel(constant)6.6690.151
Wind speed−1.264−0.244
Temperature0.0870.389
Residential building(constant)10.2310.117
Wind speed−0.598−0.111
Relative humidity−0.073−0.196
Office building(constant)42.6050.150
Wind speed−8.686−0.38
Temperature0.3820.386
Relative humidity−0.183−0.115
Table 8. Stepwise regression results of climate factors and building heating EUI.
Building TypeVariableDenormalization
Coefficient
Standardization
Coefficient
R2
Hotel(constant)−1.0740.394
Wind speed6.8560.296
Temperature−1.003−0.843
Retail building(constant)57.2330.127
Wind speed−10.281−0.357
Hospital(constant)23.4580.196
Temperature−0.639−0.442
Educational building(constant)43.9230.121
Wind speed−7.303−0.301
Residential building(constant)0.5530.134
Wind speed−7.187−0.280
Temperature0.6270.475
Relative humidity0.7920.515
Office building(constant)44.3020.558
Wind speed−2.342−0.099
Temperature−1.060−0.871
Relative humidity−0.315−0.222
Table 9. Validation results of urban morphology sub-model.
Building TypeStandardized ResidualMAEMAPEMSERMSE
Identification SetValidation Set
Hotel(−1.5, 1.9)(−1.6, 1)24.716.1937.330.6
Retail building(−2, 1.3)(−0.9, 1.5)32.719.61810.842.6
Hospital//////
Educational building(−1.3, 2)(−1.6, 1.6)25.015.91169.034.2
Residential building(−1.8, 1.8)(−1.6, 1.2)20.712.7692.826.3
Office building(−1.9, 2)(−1.7, 1.5)22.214.0793.728.0
Table 10. Validation results of climate sub-model.
Building TypeStandardized ResidualMAEMAPEMSERMSE
Identification SetValidation Set
Hotel(−1.6, 1.9)(−1.5, 1.7)7.415.980.79.0
Retail building(−1.8, 2)(−1.8, 1)10.621.7179.213.4
Hospital(−1.7, 2)(−1.6, 1.4)10.222.1158.112.6
Educational building(−1.9, 1.9)(−1.9, 1)8.921.0132.011.5
Residential building(−2,2)(−1.9, 1.2)9.219.2140.711.9
Office building(−2, 2)(−1.7, 1.8)6.616.361.27.8
Table 11. The results of independent sample test.
FSig.tdfSig.
Equal variances assumed0.2110.651−0.545220.591
Equal variances not assumed//−0.5521.8950.588
Table 12. Adjustment value of main parameters of urban morphology sub-model.
Building TypeBuilding Density (%)Building Height (m)Floor Area RatioAspect
Ratio
Shape
Factor
Hotel+1.00
Retail building−0.10−0.10
Hospital−1.00
Educational building+1.00
Residential building−0.10−0.10
Office building+1.00
Table 13. Simulation EUI of urban morphology sub-model.
Land Use TypeAverage Annual EUI of Electricity (kWh/m2)Average Annual EUI of Heating (kWh/m2)Average Annual EUI (kWh/m2)
Building Density (%)Building Height (m)Shape FactorBuilding Height (m)Shape FactorFloor Area RatioAspect RatioBuilding Density (%)Building Height (m)Shape FactorFloor Area RatioAspect Ratio
Residential24.3220.950.9745.270.97
Commercial36.4524.215.5660.665.56
Office0.280.370.65
Educational0.810.641.45
Medical2.522.52
Table 14. Simulation EUI of climate sub-model.
Land Use TypeAverage Annual EUI of Electricity (kWh/m2)Average Annual EUI of Heating (kWh/m2)Average Annual EUI (kWh/m2)
Average Temperature (°C)Average Wind Speed (m/s)Average Relative
Humidity (%)
Average Temperature (°C)Average Wind Speed (m/s)Average Relative
Humidity (%)
Average Temperature (°C)Average Wind Speed (m/s)Average Relative
Humidity (%)
Residential24.3220.950.9745.27
Commercial36.4524.2160.66
Office0.280.370.65
Educational0.810.641.45
Medical2.522.52
Publisher’s Note: MDPI stays neutral with regard to jurisdictional claims in published maps and institutional affiliations.

