Article

Study on Spatio-Temporal Changes of Land Use Sustainability in Southwestern Border Mountainous Provinces in Recent 20 Years Based on Remote Sensing Interpretation: A Case Study in Yunnan Province, China

1
School of Economics, Yunnan University of Finance and Economics, Kunming 650221, China
2
Institute of Targeted Poverty Alleviation and Development, Yunnan University of Finance and Economics, Kunming 650221, China
3
Institute of Land & Resources and Sustainable Development, Yunnan University of Finance and Economics, Kunming 650221, China
*
Author to whom correspondence should be addressed.
Land 2022, 11(11), 1957; https://doi.org/10.3390/land11111957
Submission received: 29 September 2022 / Revised: 27 October 2022 / Accepted: 31 October 2022 / Published: 2 November 2022
(This article belongs to the Special Issue Land Use and Rural Sustainability)

Abstract

:
The basic characteristics of mountain areas are that the innate ecological environment is relatively fragile, the acquired ecological environment is severely damaged and degraded, the whole economy and society are still relatively backward, and the degree of sustainable development is relatively low. At present, it has not been seen that land use sustainability evaluation (LUSE) research lasting for many years based on RS and GIS in mountainous provinces. It is urgent to build a suitable, feasible, operable and applicable LUSE system for mountainous regions so as to provide a basic foundation for strategic planning and management of sustainable land use in mountainous provinces. This study integrated “RS and GIS + multi-phase LUCC + LUSE theory and quantitative practical methods” based on mountain provinces, firmly grasped the basic characteristics of mountain areas—the vulnerability of ecological environment, and conducted the study on mountain LUSE. According to the outcomes of RS of land use in the study area in three phases (2000, 2010 and 2020), a comprehensive indicator system is established from the three dimensions of ecological friendliness of land use (EFLU), the economic viability of land use (EVLU) and social acceptability of land use (SALU). Using the Delphi method to determine weights and combining the AHP method and the comprehensive analysis method, this paper quantitatively measures the overall sustainability of land use (OSLU) of 129 counties in Yunnan province in 2000, 2010 and 2020, revealing the spatio-temporal characteristics of the OSLU of Yunnan province and all counties from 2000 to 2020, and aiming to provide a basic and foundation for strategic planning and management of sustainable land use (SLU) in mountainous provinces. The degree of ecological friendliness (DEF), degree of economic viability (DEV), degree of social acceptability (DSA) and degree of overall sustainability (DOS) in Yunnan province and all counties have been significantly improved. Accordingly, the OSLU has been improved to a certain extent, with a 0.66% annual growth rate. It indicates that the development and construction from 2000 to 2020 have significantly improved the OSLU. However, regional differences are large. At present, EFLU, EVLU, and SALU in Yunnan province are not high as a whole. The basic situation reflected that there are obvious deficiencies in EFLU, EVLU and SALU in Yunnan province. Land exploitation and use activities have caused certain influences and the destruction of the ecological environment.

1. Introduction

For quite some time, the land exploitation and use pattern in a lot of regions, which are aimed at rapid economic growth and sacrificed the natural ecological environment and excessive use of resources, has resulted in a number of increasingly serious global resource and environmental issues, bringing great crises to the livelihood and development of human beings and their descendants. Countless experiences and lessons in the exploitation and use of land resources have given us a number of warnings [1], and future land use must follow the path of sustainable land use (SLU) strategies. Sustainable land use has become the basic criterion and strategy for land resource development and protection in the whole world today and in the future. Since the Food and Agriculture Organization (FAO) published an evaluation framework [2] in 1993, experts and scholars in many countries have carried out a major number of theoretical, methodological and empirical studies on SLU in combination with the actual situation in various regions. Research results have still been emerging, and the research focus is on the Land Use Sustainability Evaluation (LUSE).
At present, the internationally accepted concept of “sustainable land use (SLU)” is the definition of sustainable land management in the framework of FAO [2]: Sustainable land management is the combination of technology, policy and behavior that can integrate social and economic principles with considerations of environment, so as to pursue and improve productivity, security and protection, viability and acceptability in terms of economic and social factors, respectively [2]. Experts and scholars in most countries basically carry out land use research according to the five goals (or principles, guidelines) in this definition [3,4]. It can be believed that since SLU is a new concept generated by the application of sustainable development ideas to land science in the 1990s, as with sustainable development, SLU is actually a new idea and new concept used to guide land use. In terms of specific definitions, it tends to adopt a generational ethical definition. That is: SLU refers to methods and measures that can meet various demands of people without damaging the next generations. It is consistent with the five principles or standards (i.e., productivity, safety, protection, feasibility and acceptability) of SLU and management proposed by FAO (1993). It should be noted that these five principles actually include three basic aspects of SLU, namely, ecological sustainability, economic sustainability and social sustainability [5]. Therefore, we can simplify the basic principles of SLU into three aspects. That is, the EFLU, the EVLU, and the SALU.
According to the content and data means of LUSE, the existing research literature can be roughly divided into four types. The first is “existing survey and statistical data + current status or quantitative LUSE in a certain year”, which is a common practice of many researchers, such as Yang Zisheng and Liu Yansui’s LUSE (2007) in Yunnan province [1], Sun Yan and Liu Youzhao (2010) carried out the LUSE in Fenyi County, Jiangxi Province [6], Han Bo (2021) carried out the LUSE in Yangtze River Delta from 2000 to 2015 [7], and Hu Manli (2022) carried out the LUSE in Xuzhou City [8]. The second is “existing survey and statistical data + quantitative measurement of changes in the sustainable level of land use in several years”, such as the LUSE in Jiangxi Province from 2002 to 2006 carried out by Yu Dun and Chen Wenbo (2009) [9], the LUSE in 31 provinces in China from 1998 to 2008 carried out by Zhao Xingguo (2014) [10]. In addition, Xie Hualin et al. (2015) evaluated the SLU in Poyang Lake Ecological Economic Zone in 2006, and 2010 [11], Wang Ying and Guo Chenxing (2018) carried out the LUSE in Shaanxi Province from 2006 to 2016 [12], and Zhao Shu (2022) carried out the research on spatial-temporal changes of LUSE during the struggle against poverty in Luquan County, Yunnan province [13]. The third is “remote sensing image interpretation (RS and GIS) + quantitative LUSE in a certain year”. For example, Zhou Yuan and Xing Lixin (2004) used RS to study the sustainable use of land resources in western Jilin Province [14]. The Fourth is “Remote sensing image interpretation (RS and GIS) + qualitative description and analysis of the impact of LUCC on SLU”. For example, Fu Bojie et al. analyzed the impact of LUCC on soil quality, regional ecological environment effect and SLU in the Bohai Rim region [15]. Zhang and Cheng et al. (2013) used GIS and RS techniques to research the land use change in the Ahemur River Basin from 1992 to 2010 [16]. Wu Qiuju, Yang Renyi and Yang Zisheng (2022) used RS and GIS to analyze the impact of LUCC on the rationality and SLU in the Dianchi Lake basin [17]. In terms of the index system of LUSE, experts and scholars have developed plenty of studies from different focuses and perspectives [18,19] and roughly constructed four types of indicator systems: “productivity—safety—maintainability—acceptability—viability” [20,21,22,23], “ecology—economy—society” [24,25,26,27] “economy—society—environment—resources” [28,29,30] and PSR or DPSIR [11,31,32,33,34,35]. From the perspective of evaluation methods, it mainly involves the comprehensive index method, AHP method [1,6,22], superposition analysis method [8], AHP—entropy weight method [35], principal component analysis method [36], improved grey relational analysis (GRA) [28], improved TOPSIS method [29], etc. Each of these methods has its own advantages. On the whole, AHP is the alternative method that combines qualitative and quantitative analysis. By classifying different elements in complicated issues into interconnected orderly levels, it is a convenient, flexible and applicable method for quantitative analysis of qualitative issues. In terms of research areas, there are national [10], provincial [1,9,12,25,28], municipal [8,23,26,34,35,36] and county-level regions [6,13,21]. There are both relatively developed ecological economic zones [11] and relatively backward ecological fragile zones [1,13,30,37,38].
From the perspective of sustainable development, the most important thing to pay attention to is the mountainous area where the “innate” ecology is relatively fragile, the “acquired” ecology is severely damaged and degraded, the economy and society are relatively backward, and the sustainability is low. The mountain area is a special natural human complex with a certain altitude and slope [39], and its most significant feature is the fragility of the ecological environment. The inherent vulnerability of the mountain environment often leads to the instability of the mountain ecosystem and the difficulty in improving biological productivity, determining the weak feedback mechanism of the mountain ecosystem and the quality of being easy to destroy and difficult recovery [40]. As far as most mountain areas are concerned, their prominent characteristics are poverty and lack of development. Many mountain areas (especially ecological degradation areas, alpine mountain areas, etc.) are still very poor. Their development approach is mainly to strengthen resource development, so they fall into the vicious circle of “poverty—environmental resource degradation—poverty”, which makes the entire mountain “ecological—economic—social” system show great vulnerability. In terms of the whole province, the mountainous area accounts for 94%, the ecology is very fragile [41,42], and its economy is still relatively backward. Among the 129 counties in the province, 88 counties belong to the national-level poverty-stricken counties, which is a typical mountainous province. Although they got rid of poverty at the end of 2020, they still have an important task to consolidate the achievements during the period of the 14th 5-year plan, and there is still a long way to go to realize the strategy of rural revitalization. In terms of research status, although some students have developed a study on the LUSE in some mountainous areas, such as the LUSE in Shaoguan City, a mountainous area in northern Guangdong Province, based on grid spatial data carried out by Li Jingliang and Hou Bin (2008) [43], the LUSE in the Yellow River basin carried out by Niu Wentao et al. (2021) [38], and the LUSE in Luquan County, a midstream area of the Jinsha River carried out by Zhao Shu (2022) [13], there are still many deficiencies and weak links in the research on the whole. At present, it has not been seen that the LUSE research based on RS and GIS for mountainous provinces has lasted for many years. Accordingly, a suitable, feasible, operable and applicable LUSE method for mountainous areas has not yet been established, which is not conducive to rational and effective SLU in these regions.
In view of this, the characteristic of this research is to integrate “RS and GIS + multi-phase LUCC + LUSE theory and quantitative practical method. This paper is based on the mountain area and takes Yunnan province, a typical mountain province in Southwest China, as the research region. Based on the interpretation results of RS images of land use in the province in three phases (2000, 2010 and 2020), starting from the three sustainability principles of ecology, economy and society, this study builds a county-level index system of LUSE, an SLU degree classification system and quantitative division standards, and promotes the combination of qualitative and quantitative methods of LUSE in mountainous areas. In addition, a specific evaluation practice is conducted. Taking 129 county administrative regions as a unit of LUSE, quantitative measurement of the OSLU at the county level in Yunnan province was carried out, and the SLU degree of 129 counties in the province from 2000 to 2020 was classified. Based on this, the spatio-temporal change of LUSE of the province and county from 2000 to 2020 is analyzed in depth, aiming to provide a foundation for the effective implementation of the SLU strategy in mountainous provinces. In theory, this study can provide basic ideas and methods for promoting SLU strategies, which is beneficial to further enrich and develop the theoretical system of LUSE. In reality, the method of qualitative judgment and quantitative analysis of the degree of SLU in mountainous areas and its dynamic change trend can be found for Yunnan Province and even similar mountainous areas.

2. Materials and Methods

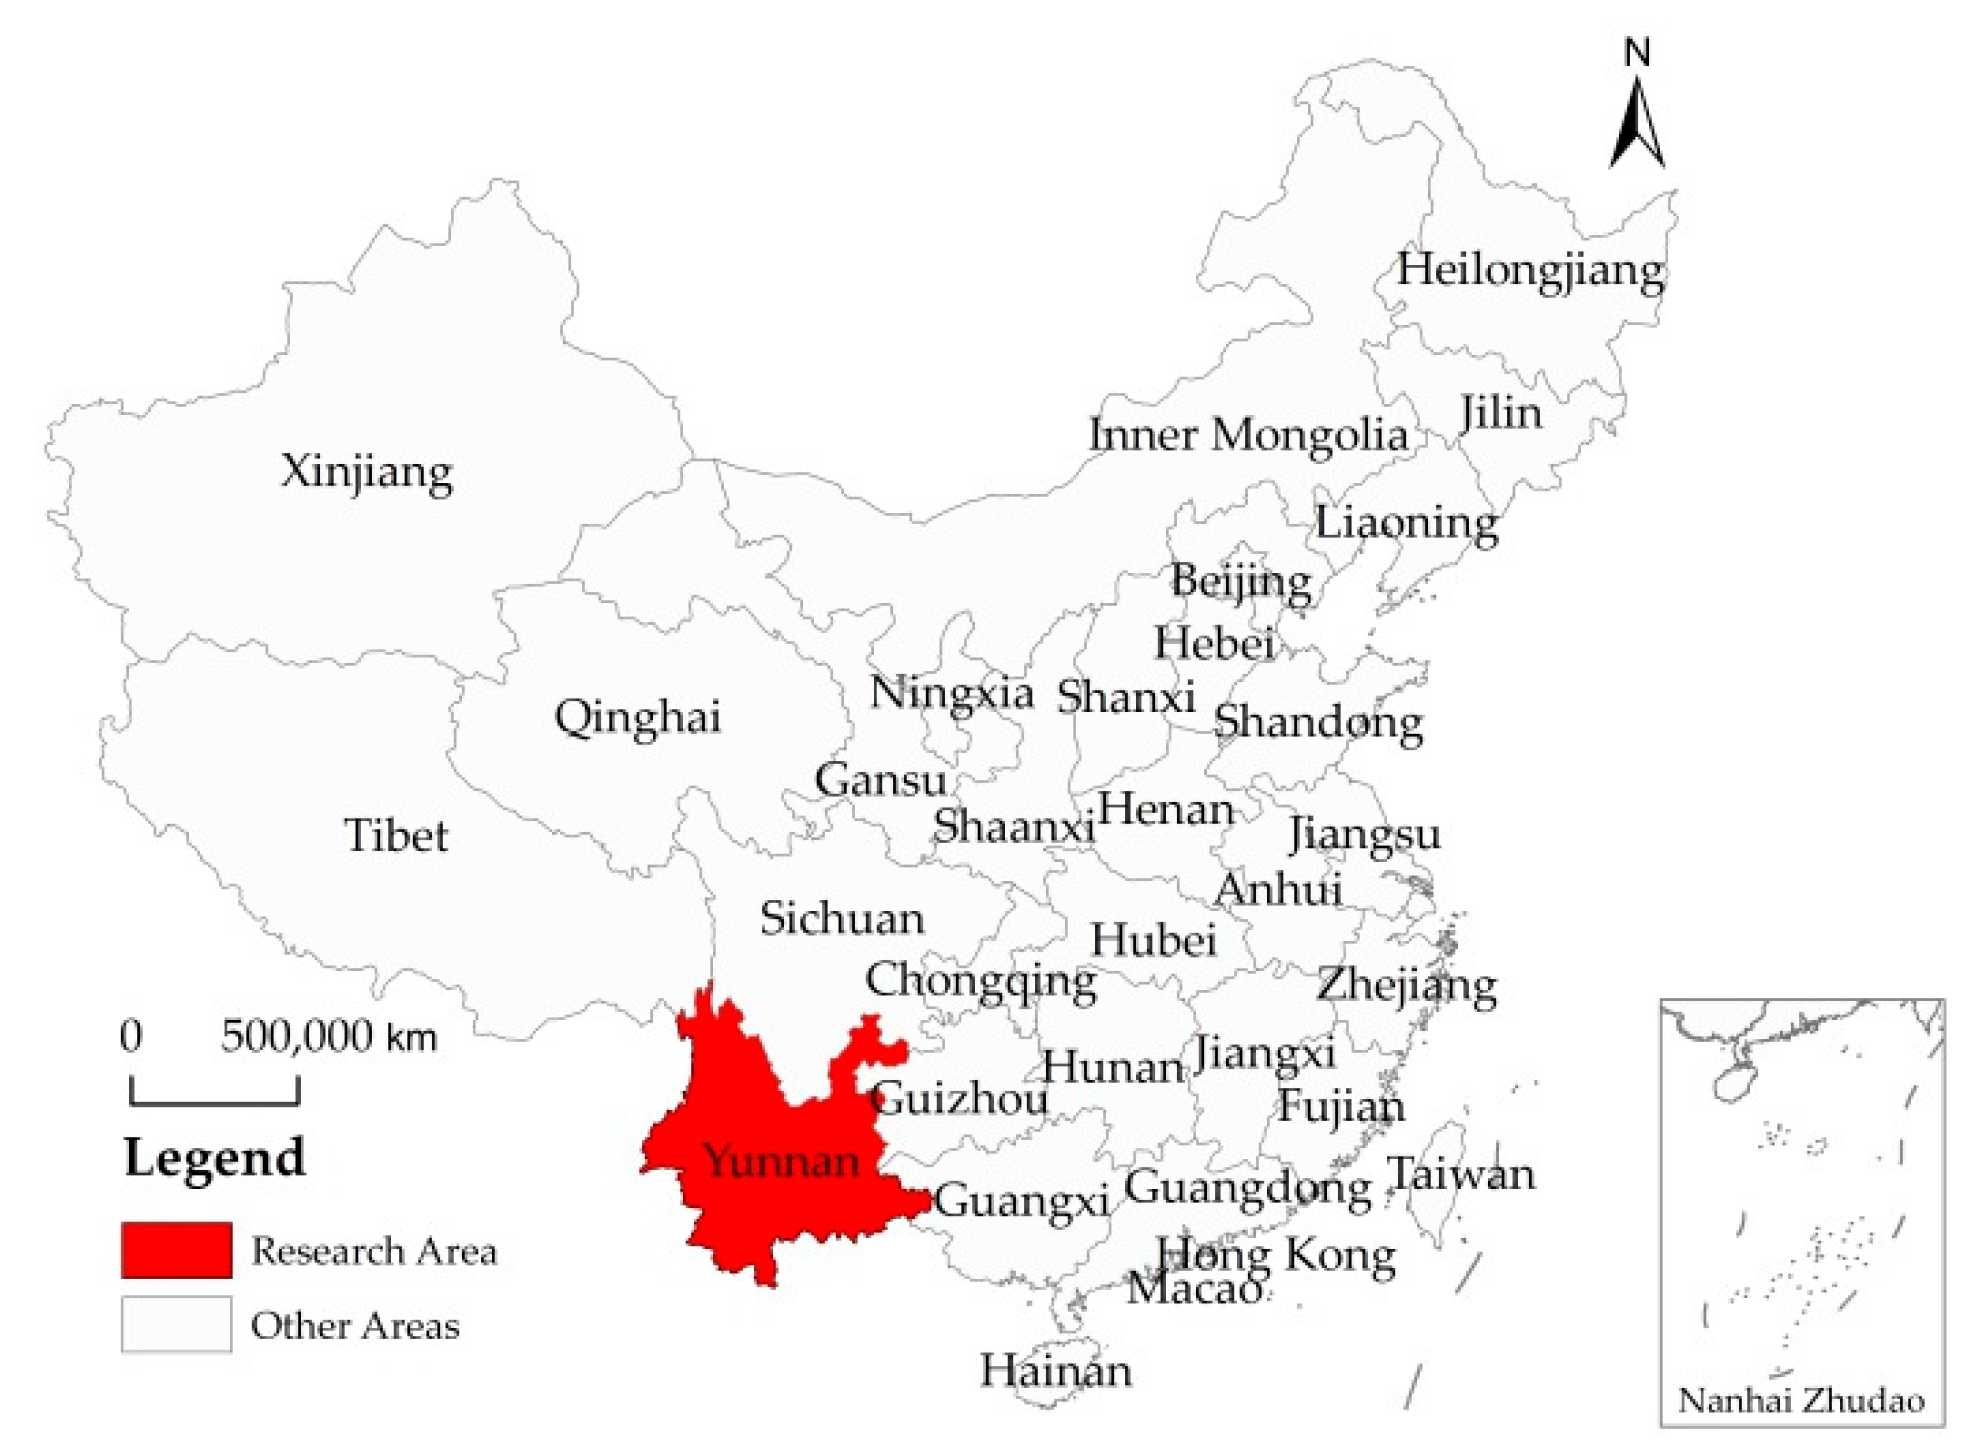
2.1. Overview of the Study Area

Yunnan Province is in the southwest of China, between latitudes 21°8′32″~29°15′8″ N and longitudes 97°31′39″~106°11′47″ E (Figure 1). It is basically a low-latitude inland province. In general, Yunnan is a mountainous and plateau province in southwest China with four basic characteristics of “being located in the border, mainly in mountainous areas, having many minorities and underdeveloped economy.” There are many ethnic minorities in Yunnan. Among the 55 ethnic minorities in China, there are 51 in Yunnan province and 25 in certain areas. At the end of 2020, the population of ethnic minorities totaled 15.6396 million, accounting for 33.12%. By the end of 2020, the province had jurisdiction over 16 prefectures and cities, including 8 provincial cities and 8 national autonomous prefectures. There are 129 counties, including 17 municipal districts, 17 county-level cities, 29 ethnic autonomous counties and 66 non-ethnic autonomous counties [44]. In 2020, the GDP of Yunnan province was 245.219 billion CNY. The per capita disposable income of rural residents was 12,842 CNY, ranking 4th from the bottom among 31 provinces in China [45].
The geological structure of Yunnan is relatively complex. In the regional geotectonic division of China, Yunnan province belongs to five primary tectonic units. The east and northeast of Yunnan province belong to the south-west end of the Yangtze paraplatform, the southeast of Yunnan is the Caledonian, and the part between the east of Jinshajiang fault and Chenghai fault belongs to the southward wedging part of Songpan Ganzi fold system (Indosinian). Between the west of the Jinshajiang Ailaoshan fault and the Nujiang fault is the Sanjiang fold system (Indosinian period). The west of the Nujiang fault belongs to the Gangdise Nianqing Tanggula fold system (Yanshanian period) [46]. Yunnan is a vast plateau with an average altitude of about 2000 m. However, the terrain in various parts of the province fluctuates greatly, and the overall terrain is generally high in the northwest and low in the southeast. The highest point in the province is 6740 m above sea level (Kawagbo Peak, the main peak of Prince Snow Mountain), and the lowest point is 76.4 m (the intersection of Yuanjiang River and its tributary Nanxi River in Hekou County), with a height difference of 6663.6 m. Yunnan province is dominated by mountains, which account for 94%, and dam area (flat land) with good conditions only accounts for 6% [46]. It is known as “there are high mountains and steep slopes with many rocks; you can climb when you go out.” About 77% (more than 3/4) of the land in the province has a slope of more than 15°, and nearly 40% (about 2/5) of the land has a slope of more than 25° [47]. From the county-level perspective, more than 56% of Yunnan’s counties have more than 30% of the land with steep slopes exceeding 25°, while more than 1/5 of the counties have more than 50% of the land with steep slopes exceeding 25°. Under the comprehensive influence of the geographical conditions of low latitude and high altitude, restricted by the monsoon climate, the original monsoon climate features of low latitude mountains in Yunnan, which are rich in light energy and significant vertical variation, have been formed. According to the second soil census in Yunnan province [48], there are 7 soil classes, 13 soil subclasses, 18 soil types, 34 soil subtypes, 145 soil genera and 288 soil species in total. The number of soil types accounts for about 1/3 of China. The land area of each soil class and soil type is different, and the area of the siallitic soil class is the largest, accounting for 55.32% of the province. The next is the eluvial soil class, accounting for 19.27% of the soil area of the province. The primary soil class is mainly rock soil, accounting for 18.17%. The anthropogenic soil class is mainly paddy soil, accounting for 3.9% of the soil area of the province. The alpine soil class and semi-leaching soil class also occupy a certain position. There are many types of vegetation in Yunnan, ranging from tropical rainforests to alpine tundra, from dry, sparse shrubs to moist moss forests to aquatic vegetation in lakes and marshes. Yunnan is rich in plant species, ranking first in China, and has always been known as the “plant kingdom.” According to preliminary statistics, there are 13,282 species, 2597 genera and 426 families of plants above liverworts in Yunnan province. The vegetation in Yunnan is divided into 12 vegetation types. Under the vegetation type, 34 subtypes and several formation groups are further divided, and 169 formations and 209 associations are finally divided [49].
Topographic features dominated by mountains determine that Yunnan’s “congenital” ecological environment is very fragile, and arable land resources are very limited. The irrational exploitation and use of land resources in mountainous regions for quite some time are likely to lead to disharmony in the relationship between people and land in mountainous areas, resulting in water and soil loss, ecological degradation, and even serious disasters. At present, major issues of ecology and environment, such as water and soil loss and rock desertification, are still serious, and geological disasters such as low-temperature freezing, landslides and mud rock flow are frequent, easy to occur and frequent [50]. According to the statistics, from 2007 to 2020, the affected area of crops in the province totaled 18.843 million hectares, with 20% of the total planting area of crops in the same period [45,51]. It has complex geological structures, frequent seismic activities, deep river valleys, broken rock and soil mass, fragile geological environmental conditions, landslides, and other geological disasters that tend to emerge. By the end of 2020, the province had 23,267 registered potential geological disasters [52]. At the same time, Yunnan is located at the source or upstream of 6 major river systems in China. Its special geographical location, diverse topography, complex climate and other natural environmental conditions have bred extremely rich biological resources, making Yunnan a “kingdom of animals and plants,” which is not only a natural gene pool of China and the world but is also an ecological security barrier in Southwest China and even Southeast Asia. The state attaches large significance to the protection of Yunnan’s ecology and the construction of an ecological civilization and clearly requires Yunnan to strive to become the leader of China’s ecological civilization construction and build a solid ecological security barrier in Southwest China.

2.2. Data Source and Description

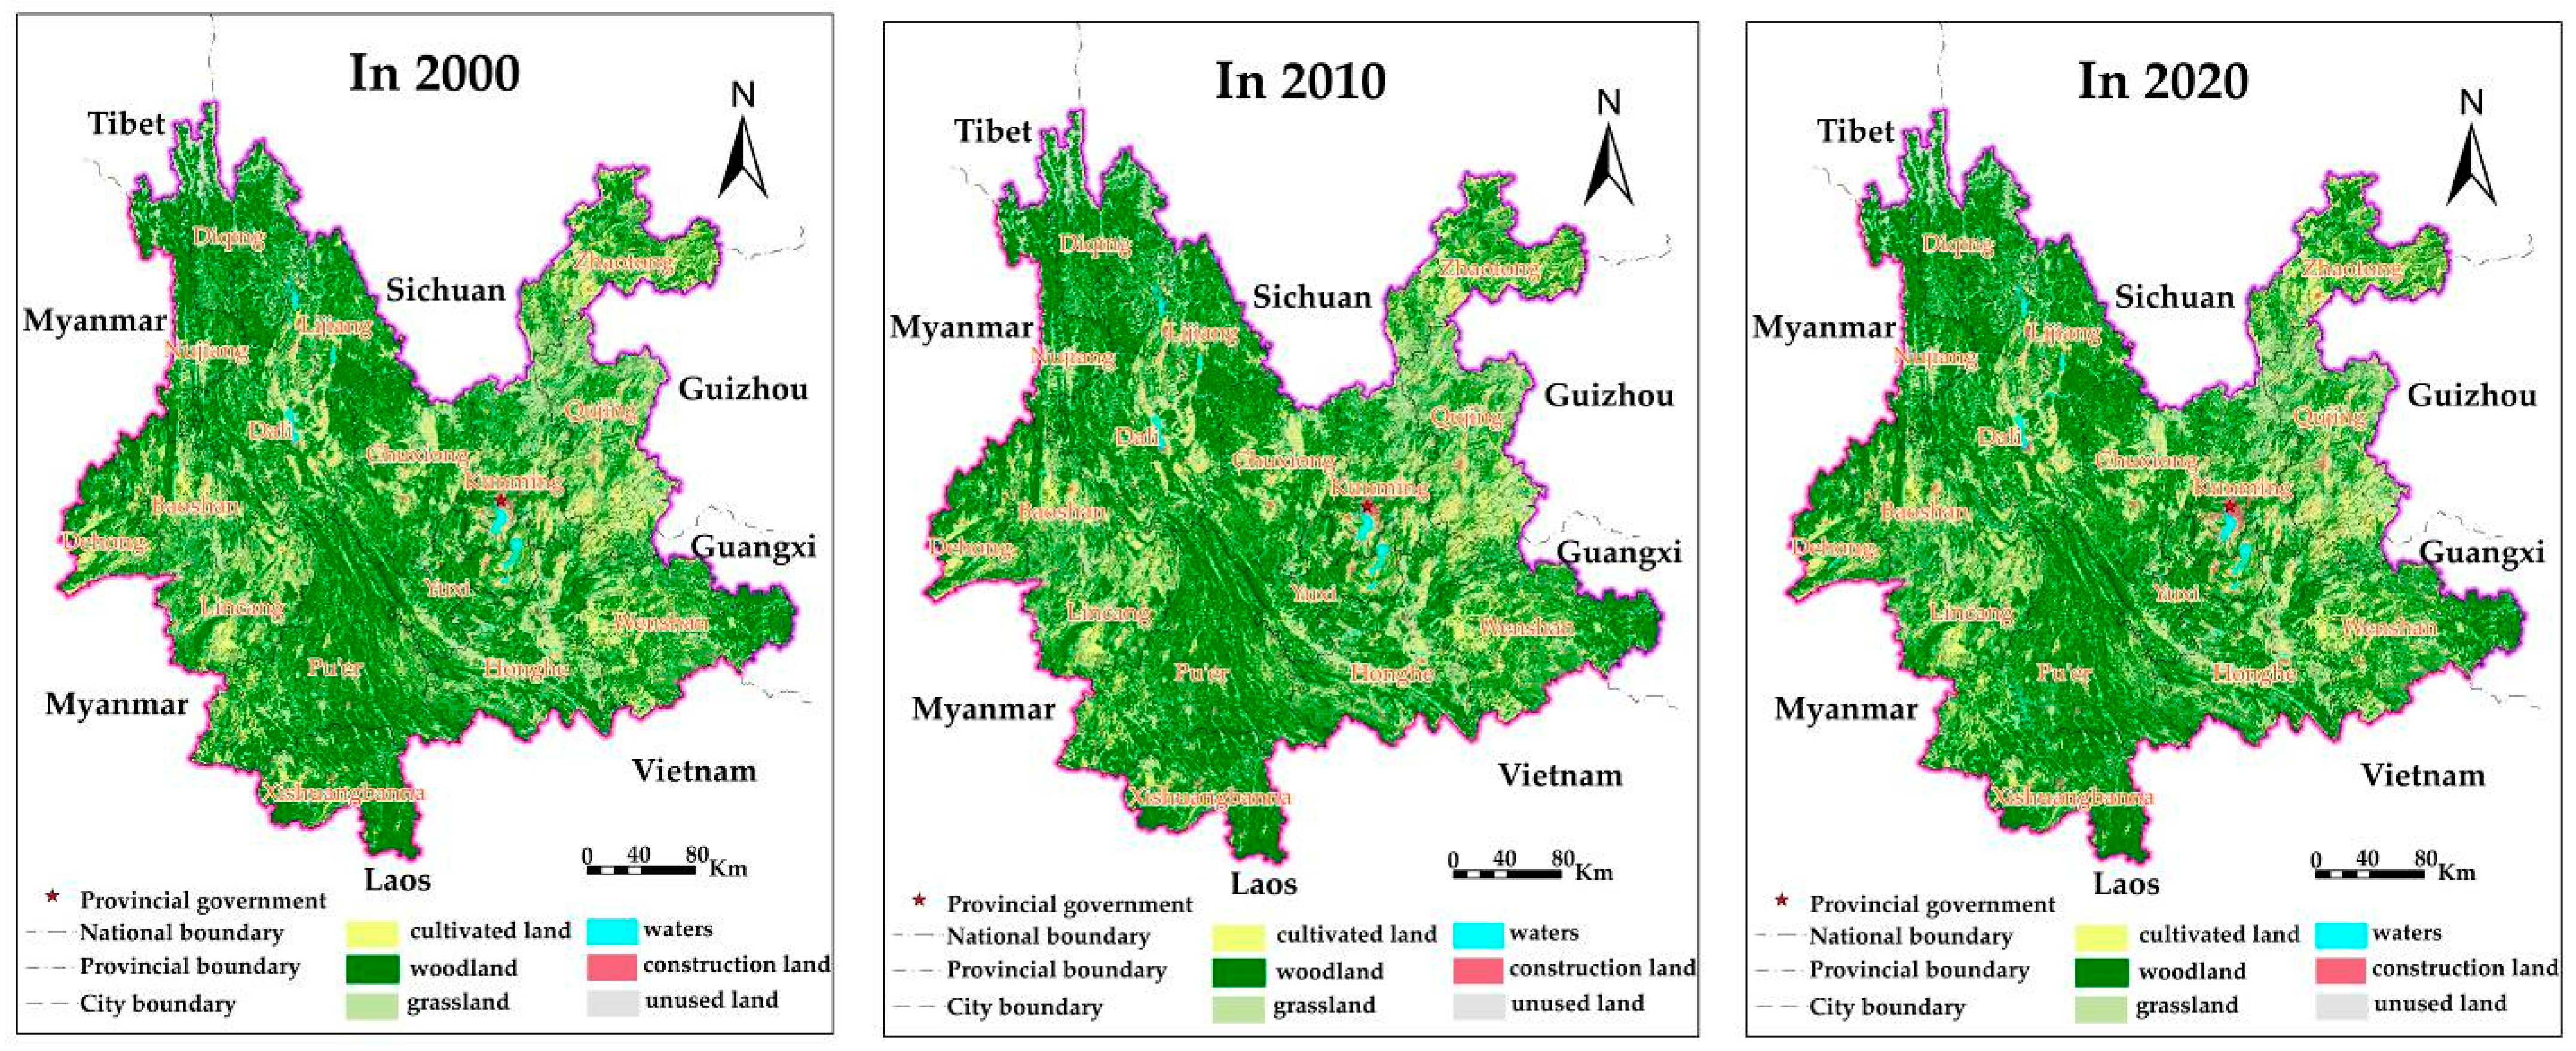
2.2.1. Source and Interpretation of Three Phases RS Image Data

The RS image data of the three phases (2000, 2010 and 2020) used in this research is obtained from the website of “https://www.resdc.cn/,” (accessed on 8 February 2022) with a spatial resolution of 30 m. On the basis of the national environmental database, the Chinese Academy of Sciences has issued a multi-period LUCC RS image database of China, using Landsat RS images of the United States as the main source, and using China Brazil Resources Satellite data or environmental small satellite data as a supplement for areas that cannot be covered due to poor time phase. In terms of time phase, the Landsat TM/ETM RS image from 1999 to 2000 is the main information source for the land use data in 2000, and the Landsat TM remote sensing image from 2009 to 2010 is the main information source for the LUCC data in 2010, and Landsat 8 remote sensing image data is mostly used for updating the LUCC RS image information in 2020. In terms of the seasonal phase, images with cloud content of less than 10% in winter are selected for interpretation according to the actual situation of Yunnan.
With reference to Xu Xinliang et al. [53] and the LUCC classification system issued by Liu Jiyuan’s research team et al. [54,55,56,57], and in combination with Yunnan’s actual situation and research needs, the land use classification system of the province in three phases is determined (Table 1).
The 3 phases land use vector database of Yunnan province is based on Table 1 and RS interpretation marks in the ArcGIS software to interpret the 3 phases of RS images of Yunnan province through human-computer interaction interpretation of land use/cover types. First of all, after obtaining the RS image, it can conduct image preprocessing operations such as false color synthesis, fine geometric correction, image splicing, and clipping, and then overlay the latest 2021 administrative division map of Yunnan province by county to obtain the RS image map by county. After that, on the basis of field investigation and comprehensive expert opinions, RS image interpretation marks applicable to Yunnan province will be established, and a digital elevation model map, vegetation map, land use map and other auxiliary materials will be obtained as much as possible, which are interpreted manually in the GIS software environment. In the process of interpretation, the county is taken as the unit to generate interpretation results by county. After the interpretation, use the “Arcinfo Workstation” command and the “SHAPEARC” command to generate the county “coverage” file. Finally, the “ARCEDIT” module of “ARC/INFO” is used for graphic editing, checking and modifying errors, sorting and summarizing. For example, it can check for errors in map spot attribute codes, missing codes and repeated codes. After correction, the data of adjacent counties are connected, and finally, the vector database of LUCC in Yunnan province is generated. Based on this, ArcGIS software is used to prepare three phases LUCC map of the province (Figure 2) and calculate the land use classification area (Table 1).
The total land area of Yunnan Province is 38.4242 million hectares. From the perspective of the land area of various types in 2020, the cultivated land area is 5.3956 million hectares, the woodland area is 24.1854 million hectares, the grassland area is 1.8112 million hectares, the water area is 0.5609 million hectares, the construction land area is 1.2969 million hectares, and the other land area is 5.1742 million hectares, respectively accounting for 14.04%, 62.94%, 4.71%, 1.46%, 3.38%, and 13.47% of the province. In terms of cultivated land, the paddy field area is 1.3339 million hectares, accounting for 24.35%, and the dry land area is 4.0817 million hectares, accounting for 75.65%. In terms of the woodland area, there are 18.8459 million hectares of closed forest land, accounting for 77.92% and other forest land covers 5.3395 million hectares, accounting for 22.08%. In terms of the grassland area, the area of pasture with high coverage is 1.0536 million hectares, accounting for 58.17%, and the area of pasture with medium and low coverage is 0.7576 million hectares, accounting for 41.83%. In terms of the water area, rivers and lakes cover 0.3118 million hectares, accounting for 55.58%, and the reservoir and pond area is 0.2491 million hectares, accounting for 44.42%. In terms of construction land, the urban and rural settlement areas and land for mining and industry are 1.0917 million hectares, accounting for 84.18%; other building land covers 0.2052 million hectares, accounting for 15.82%. In terms of unused land area, the bare land area is 0.8062 million hectares, accounting for 15.58%; the area of other land types is 4.3680 million hectares, accounting for 84.42%.
From the perspective of LUCC in the whole province from 2000 to 2020, it shows a change characteristic of “three increases and three decreases.” The so-called “3 increases” refer to the obvious increase of woodland area, waters area and construction land area in the recent 40 years, while the “three decreases” refer to the obvious decrease of the other 3 land types.
(1)
Three increases
The woodland area has increased from 1.9982 × 10⁷ ha in 2000 to 2.4185 × 10⁷ ha in 2020, with a net increase of 4.2035 × 10⁶ hectares, a net increase of 21.04% with a 1.05% average increase. From the perspective of woodland, it is characterized by an obvious rise of closed forest land and a drop in other forest lands. From 2000 to 2020, the closed forest land rose by 4.7014 × 10⁶ hectares, while other forest land decreased by 4.966 × 10⁵ hectares. The substantial increase of woodland (especially closed forest land) means that the green coverage rate of the surface has risen obviously, and the ecological environment has been improved significantly.
The waters area raised from 4.934 × 10⁵ ha in 2000 to 5.609 × 10⁵ ha in 2020, with a net increase of 6.75 × 10⁴ hectares, a net increase of 13.68% with 0.68% annual growth. The reason for its increase is mainly reflected in the increase in the reservoir area.
The construction land area has increased from 6.672 × 10⁵ ha in 2000 to 1.2969 × 10⁶ ha in 2020, with a net increase of 6.297 × 10⁵ hectares, a net increase of 94.38%, and an average annual increase of 4.72%, making it the largest extent of increase or decrease among the 6 1st-class land types. This is the result of the acceleration of provincial population growth, urbanization, industrialization and other economic construction from 2000 to 2020.
(2)
Three decreases
The cultivated land area decreased from 5.5108 × 10⁶ ha in 2000 to 5.3956 × 10⁶ ha in 2020, with a net drop of 1.152 × 10⁵ ha (2.09%) and with 0.10% annual decrease. In terms of cultivated land, the reductions of them are obvious, and the reduction of paddy fields is obviously greater than that of dry land. In the past 20 years, 4.52 × 10⁴ hectares of paddy fields in the province decreased, with a net decrease of 3.33%. Dry land decreased by 7.00 × 10⁴ hectares, with a net decrease of 1.68%. Their decreases are the result of various construction projects, conversion of cultivated land to forests, disaster damage and agricultural structural adjustment. With the substantial increase of construction land, cultivated land (especially high-quality paddy fields around cities and towns with good conditions and along the traffic line) is continuously occupied, which affects the total amount and the overall quality of it to a certain extent.
The grassland area decreased from 4.8125 × 10⁶ ha in 2000 to 1.8112 × 10⁶ ha in 2020, with a net drop of 3.0013 × 10⁶ hectares, a net decrease of 62.36% and an average annual decrease of 3.12%. In the grassland interior, the pasture with high coverage and the pasture with medium and low coverage showed a significant reduction, with a 3.28% and 2.83% annual decrease, respectively. The decrease in the grassland area is mainly because of the conversion of grassland to woodland; that is, many original grass hills, grass slopes and waste grassland can be afforested, which has promoted the substantial increase of woodland area.
The unused land area decreased from 6.9585 × 10⁶ ha in 2000 to 5.1742 × 10⁶ ha in 2020, with a net drop of 1.7843 × 10⁶ hectares, 25.64%, with a 1.28% annual reduction. The drop of it is mainly due to the exploitation and use of it and the conversion to agricultural land or construction land, which also means that the provincial land utilization rate has been continuously improved.

2.2.2. Other Data Sources and Descriptions

(1)
Socio economic data
The social and economic data at all levels are mainly from the statistical data of the yearbook over these years. Some are from relevant bulletins and websites of government functional departments.
What’s more, the GDP, the output value of primary, secondary and tertiary industries and other relevant economic data adopt actual values to better eliminate the impact of price changes and keep consistent with the evaluation indicators so that the results are more scientific and credible. In addition, logarithmic processing is adopted for relevant economic evaluation indicators, which can not only measure the value of economic indicators but also eliminate the impact of dimensions and make the data more stable.
(2)
Geospatial data
Geospatial data from 30 m × 30 m Yunnan grid DEM data, website: http://www.gscloud.cn (accessed on 8 February 2022).
(3)
Other basic data and materials
It is mostly obtained by consulting the data of natural resources, agriculture and rural areas, rural revitalization, ecological environment, water conservancy and other relevant industry departments of governments at all levels and conducting field surveys.
(4)
Source of Yunnan county boundary
The county boundaries of Yunnan province used to calculate the land use classification area data of 129 counties in Yunnan province in each period are based on the county map of Yunnan province provided by the website of MAP WORLD–Yunnan Provincial Platform for common Geo-Spatial Information Service. The website is https://yunnan.tianditu.gov.cn/MapResource (accessed on 8 February 2022).

2.3. Evaluation Method of Land Use Sustainability

2.3.1. Basic Connotation and Criteria of SLU

The connotation of SLU is very rich and fully expresses the concept of sustainable development in land use. This definition emphasizes that in the process of land use, any land resource development and utilization methods and measures should implement the idea of sustainable development, and requires that:
(1) In terms of ecology, resources and the environment should be protected to avoid resource degradation, ecological damage and environmental deterioration;
(2) Economically, it should be reasonable, able to bring benefits to land use or operators and ensure the sustainability of economic development;
(3) Society should be able to provide basic needs for human beings and meet their needs for survival and development;
(4) Ethically, it is necessary to fully reflect fairness, including intra- and inter-generational fairness, so that there can be fair and reasonable development among the present generation and between the present and future generations.
According to the previous analysis, the basic principles of LUSE are summarized into three aspects, namely: the ecological friendliness of land use (EFLU), economic viability of land use (EVLU) and social acceptability of land use (SALU), which is the basis for the subsequent LUSE.

2.3.2. Basic Ideas and Index System of LUSE

(1)
Basic ideas for evaluation
The LUSE in this study is mainly a comprehensive evaluation, which takes county districts as the evaluation unit, integrates EFLU, EVLU and SALU organically, and comprehensively evaluates the comprehensive status of SLU in county areas. Based on the development of similar evaluation research fields in recent years, this paper organically combines the AHP and the comprehensive analysis method. On the basis of building a series of indicator systems with three dimensions of EFLU, EVLU and SALU in 129 counties in the province, the degree of EFLU (DEF), the degree of EVLU (DEV) and the degree of SALU (DSA) in each county in 2000, 2010 and 2020 are calculated. Then, the three indexes are organically integrated to calculate the degree of OSLU (DOS) in counties of Yunnan province in 2000, 2010 and 2020 so as to obtain an overall evaluation and understanding of the SLU system in each county to comprehensively measure and compare the status of SLU in each county.
(2)
Evaluation index system
It will be established here and is mainly aimed at regional LUSE. Drawing on the representative structural framework built by Chen Baiming et al. [58], this research divides the system into three levels: indicator category, evaluation indicator and element indicator (Table 2). These indicators are comprehensively determined according to the needs of evaluation work and the availability of basic data in each county.
The ecological friendliness index is the basic index in the whole land sustainable use system, which directly determines whether the land use system can maintain the inherent role and function of land ecologically. Therefore, the factors and attributes that can reflect ecological friendliness and its degree should be selected as evaluation indicators from the perspectives of development, utilization, transformation (consolidation), protection and other aspects of land resources in Yunnan. Such as the overdevelopment and utilization of land, land transformation level, land protection level, etc., to quantitatively reveal the ecological friendliness of land use in Yunnan. According to the actual situation in Yunnan and the availability of basic data, indicators such as the index of over-reclaimed rate (IOR) and index of bare land area (IBLA) are mainly selected for land overdevelopment and utilization. The index of effective irrigated area (IEI) and other indicators are mainly selected for land transformation level. The land protection level mainly selects the index of forest coverage (IFC), index of biological richness (IBR), index of ecosystem services value (IESV) and other indicators. Where the IBR is one of the important indicators for the assessment of ecological environment status, which refers to the indirect reflection of the abundance and poverty of biological richness in the evaluated area through the differences in the number of biological species of different ecosystem types per unit area [59,60], and it is positively related to the land use ecological benefits. Ecosystem Services Value (VES) refers to various benefits that humans obtain from the ecosystem. The SLU and the optimization of land ecological value are the basic goals of the SLU strategy, so this study takes the VES as an important evaluation parameter.
The economic vitality index is the core index of LUSE. According to the local conditions of the province, and considering basic data and needs of evaluation, the main indicators here are the index of comprehensive land productivity (ICLP), the index of agricultural land productivity (IALP), the index of building land productivity (IBLP), the index of fiscal revenue per unit land area (IFRUA), the index of the yield of grain crops per hectare (IYGC) and index of land use rate (ILUR) to quantitatively reveal the EVLU in the province.
In the system of land usage, the social acceptability index reflects the social acceptability and social affordability of land resource utilization [58]. The purpose and destination of SLU are to satisfy the demands of human livelihood and progression. Hence, SALU and its degree are important contents of LUSE. Based on the livelihood and progression demands of people in mountain areas, and considering basic data and needs of evaluation, the index of population pressure (IPP), index of per capita GDP (IPGDP), index of per capita disposable income of rural residents (IDIR), index of per capita yield of grain crops (IPYG) and other leading indicators are mainly considered here. These indicators can roughly reveal the SALU in mountain areas.
It should be noted that in order to facilitate comparison and analysis, it is proposed here that each indicator value should be converted into a unified requirement that 100 is the highest sustainability and 0 is the lowest sustainability. Therefore, it is also necessary to convert the index through the system (Table 2).
(3)
Evaluation criteria of LUSE indexes
The evaluation criteria are also called the threshold of evaluation indicators. The establishment of evaluation criteria directly affects the practicability and operability of evaluation. It is very complicated work to formulate the evaluation criteria for each indicator, which usually requires a certain amount of space-time observation and a large number of targeted analyses and verification to objectively extract specific standard value data [33]. Therefore, up to now, there is no unified evaluation standard for LUSE, and it is being explored constantly. In view of this, in the current situation, the specific evaluation standard value data can be obtained generally by the following methods: First, some indicators (such as water and soil loss) that have been stipulated by the state can be used as the evaluation standard by the national, local or industrial standards. Second, for some restrictive indicators (such as population pressure index, over-grazing rate, crop productivity index and over-cultivation rate), the baseline value or warning value obtained through scientific research and scientific experiments should be used as the evaluation standard and basis. Third, some indicators, especially economic and social indicators (such as agricultural land output value index, land average financial income index, rural residents’ per capita disposable income index, etc.), can often use the average value of corresponding indicators in China (or the study region) or the regional planning target value as the evaluation criteria. In addition, some indicators can only be determined after comprehensive analysis based on the regional background, such as forest coverage, biological abundance, etc.
After repeated analysis and demonstration, this study has determined the evaluation criteria (relative optimal value) of the main indicators of LUSE (Table 2), which can be used as a reference for similar regions in LUSE.

2.3.3. Comprehensive Method of LUSE

In order to make an evaluation of the whole regional SLU, four quantitative comprehensive evaluation indicators are proposed, respectively, DEF, DEV, DSA, and DOS. The calculation method for these 4 comprehensive indicators is as follows:
(1)
Degrees of Ecological Friendliness (DEF)
Six single indicators reflecting the EFLU of the county are determined in this study, namely, the IOR, IBLA, IEI, IFC, IBRC and IESV. Therefore, based on computing all these index values separately, the DEF can be calculated quantitatively according to the following methods:
D E F = k 11 I O R + k 12 I B L A + k 13 I E I + k 14 I F C + k 15 I B R C + k 16 I E S V
where k11, k12, k13, k14, k15 and k16 are, respectively, the weight values of the IOR, IBLA, IEI, IFC, IBRC and IESV.
(2)
Degrees of Economic Viability (DEV)
The single indicators that indicate the EVLU include the ICLP, IALP, IBLP, IFRUA, IYGC and ILUR. Based on computing all these index values respectively, the DEV value of land use can be measured quantitatively according to the following methods:
D E V = k 21 I C L P + k 22 I A L P + k 23 I B L P + k 24 I F R U A + k 25 I Y G C + k 26 I L U R
where k21, k22, k23, k24, k25 and k26 are, respectively, the weight values of the ICLP, IALP, IBLP, IFRUA, IYGC and ILUR.
(3)
Degrees of Social Acceptability (DSA)
The single indicators of SALU are the IPP, IPGDP, INIR and IPYG. Based on computing all these index values respectively, the DSA can be measured and calculated quantitatively according to the following methods:
D S A = k 31 I P P + k 32 I P G D P + k 33 I N I R + k 34 I P Y G
where k31, k32, k33, and k34 are, respectively, the weight values of the IPP, IPGDP, INIR and IPYG.
(4)
Degrees of Overall Land Use Sustainability (DOS)
OSLU is the mutual combination of the DEF, DEV and DSA. Based on computing all values of these three comprehensive indicators respectively, the DOS can be measured quantitatively according to the following methods:
D O S = w 1 D E F + w 2 D E V + w 3 D S A
where w1, w2, and w3 are, respectively, the weight values of the DEF, DEV and DSA.
(5)
Determination method and result value of index weight
The determination methods of weights mainly include Principal Components Analysis, AHP Method, Delphi Method, etc. Among them, the Delphi method is a common method to identify the weight coefficient. It organizes experts to assign or score the weight of each factor, and after feedback on the probability estimation results, the experts score the weight of each factor in the 2nd and 3rd rounds so that the decentralized assignment gradually converges and finally obtains a more consistent weight value of each factor.
According to the Delphi method, in December 2021, we organized 18 experts to assign the weights of the indicators of the LUSE. After calculation, we determined the weight value of each level index (see Table 3).

2.3.4. Grading System and Standard of SLU

After calculating the values of DEF, DEV, DSA and DOS in the study area, it is also necessary to grade the EFLU, EVLU, SALU and OSLU on this basis so as to characterize the DEF, DEV, DSA and DOS of different levels, so that the research results can be qualitative and quantitative, and better provide decision foundation for the measures of eco–friendly SLU strategy in mountain regions.
(1)
Classification of EFLU
For quite some time, the classification system and standard of land use ecological friendliness have not been especially discussed and studied at home and abroad. Here, according to our understanding and experience formed in the long–term survey and research in Yunnan, considering the local conditions and referring to the grading system established by Yang Zisheng and Liu Yansui [1] (2007), Yang Renyi and Du Wanying [41] (2021), it is proposed to divide the DEF of mountain land use into five grades, namely, highly friendly, moderately friendly, low friendly, unfriendly and very unfriendly. At the same time, the classification criteria and basic meanings of each ecological friendliness level were determined (see Table 4).
(2)
Classification of EVLU and SALU
Similarly, with reference to the ecological friendliness level system and its classification criteria, in combination with our understanding and experience formed in the long–term survey and research in Yunnan, considering the local conditions of the index system in this study, and referring to the grading system constructed by Yang Zisheng and Liu Yansui [1] (2007), Yang Renyi and Du Wanying [41] (2021), it is proposed to divide the EVLU in mountainous areas into five levels. Similarly, referring to the grading system constructed by Yang Zisheng and Liu Yansui [1] (2007) and Yang Renyi and Du Wanying [41] (2021), the SALU in mountainous areas can be divided into 5 levels. The grading standards of EVLU and SALU are shown in Table 5.
(3)
Grading of OSLU
With reference to the above classification system and standards for the degree of EFLU, EVLU and SALU, taking into account the reality of the index system in this study, combining the understanding and experience formed in the long-term survey and research in Yunnan, and referring to the grading system constructed by Yang Zisheng and Liu Yansui [1] (2007), Yang Renyi and Du Wanying [41] (2021), it is proposed to divide the OSLU into five levels. The classification criteria and basic meaning of each overall sustainability level are also determined (see Table 6).

3. Results

According to the above comprehensive evaluation method of LUSE, the DEF, DEV, DSA and DOS of values 129 counties in Yunnan province in 2000, 2010 and 2020 were calculated quantitatively. EFLU evaluation (Figure 3), EVLU evaluation (Figure 4), SALU evaluation (Figure 5) and OSLU evaluation (Figure 6) are drawn in Yunnan province from 2000 to 2020. According to the measurement results, we can analyze the spatio-temporal changes of DEF, DEV, DSA and DOS values.

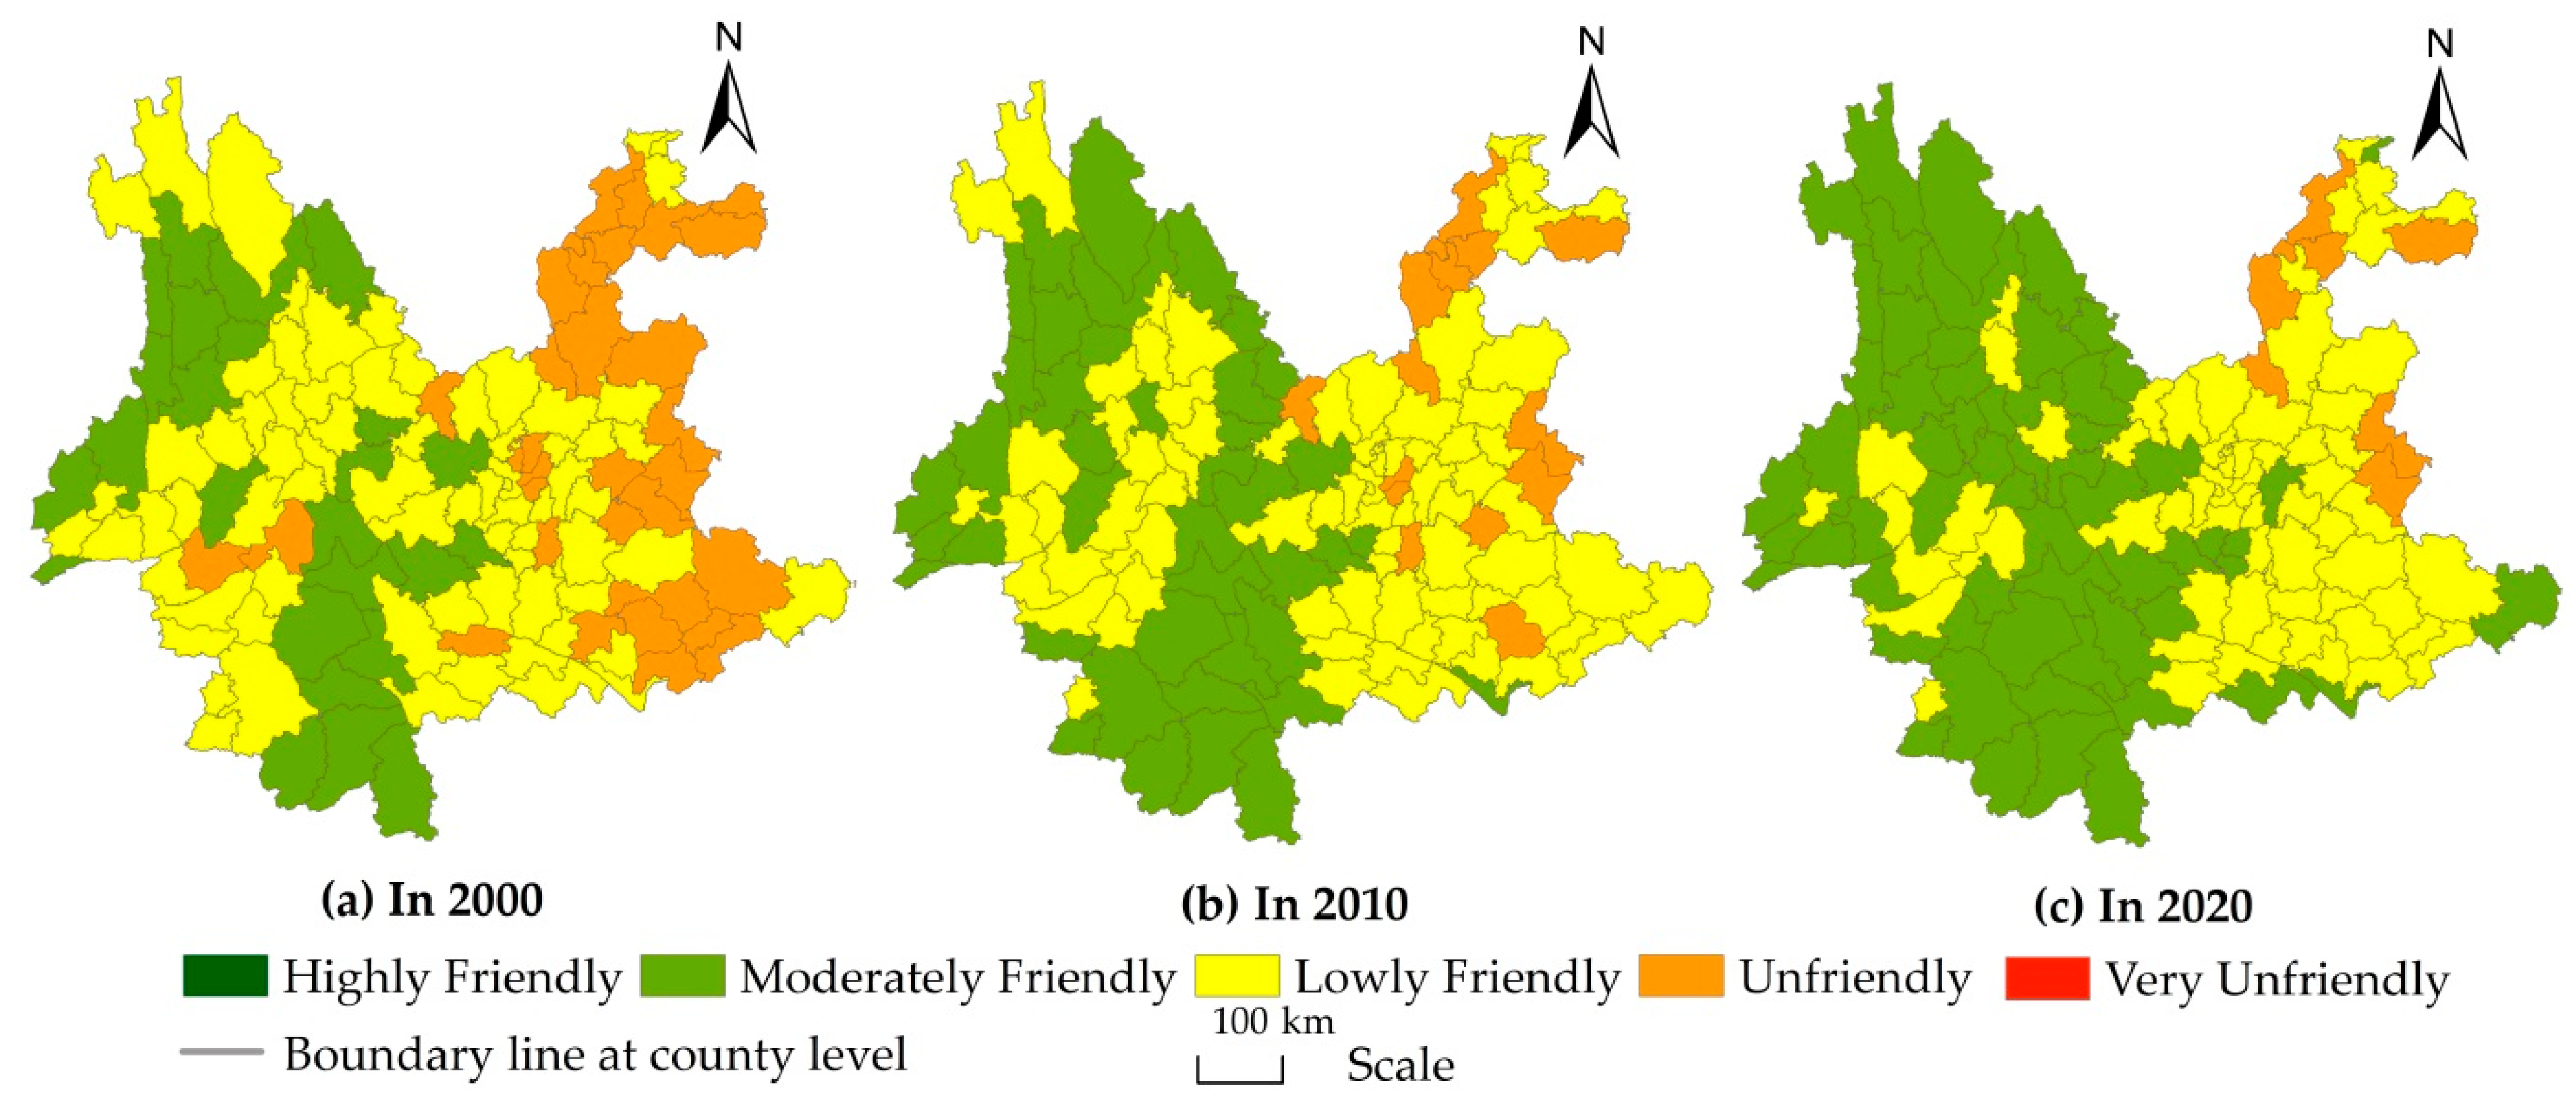
3.1. Spatio-Temporal Characteristics and Causes Analysis of EFLU

3.1.1. Change Characteristics of EFLU in Recent 20 Years

Figure 3 indicates the changes in EFLU and their level in Yunnan province and all counties from 2000 to 2020 are mainly characterized by the following two characteristics: first, the overall EFLU has gradually improved from 2000 to 2020, and the EFLU level has been upgraded from “low friendliness” to “medium friendliness.” The average DEF in the province was 68.55 in 2000, and it increased to 75.87 in 2020, with a net added value of 7.32 and 0.53% annual growth. This means that land construction and protection of the ecological environment in the province have achieved remarkable results from 2000 to 2020. Second, the evolution of DEF in the province from 2000 to 2020 is more complex. There are roughly 5 situations: (1) upgrading from “unfriendly” to “lowly friendly,” involving 25 counties, accounting for 19.38%; (2) upgrading from “lowly friendly” to “moderately friendly,” involves 36 counties, accounting for 27.91%; (3) maintaining the “unfriendly” level involves seven counties, accounting for 5.43%; (4) maintaining the “lowly friendly” level involves 36 counties, accounting for 27.91%; (5) maintaining the “moderately friendly” level involves 25 counties, accounting for 19.38%.

3.1.2. Characteristics of Spatial Differences of EFLU

According to estimation results in 2020, the DEF value of Yunnan province has reached 75.87, which means the EFLU level of the province has accessed the lower limit of “moderate friendliness;” that is, it has entered the range of “moderate friendliness.” However, the DEF values vary greatly from different regions. In general, the DEF in the province is higher in southern, southwestern, western and northwestern Yunnan, while it is lower in the karst areas of northeastern, eastern and southeastern Yunnan. From the county level, the DEF is not high, and more than half of the counties in the province are still at the “low friendly” and “unfriendly” levels.

3.1.3. Analysis of the Causes of Spatio-Temporal Evolution of EFLU

From 2000 to 2020, the overall land use ecological friendliness in Yunnan has gradually increased, mainly because it has focused on the significance of ecological construction and environmental protection, built the strategy of “establishing the province with ecology and giving priority to the environment,” vigorously promoted land greening, returning cultivated land to forests and grasslands, natural forest protection, public welfare forest construction, protection forest system construction, grassland ecological restoration, comprehensive management of rocky desertification, comprehensive management of soil erosion, wetland protection and restoration, biological diversity protection, mine ecological restoration and other key ecological projects. Extreme efforts have been made to preserve and manage the ecological environment, which has effectively promoted the sustainable improvement of the ecological environment, significantly improved the forest coverage and gradually enhanced the ecological service function.
However, the EFLU in Yunnan province is still low, which is a comprehensive reflection of the overdevelopment of land, the standard of land transformation (consolidation) and the standard of land protection. First, it is the result of overdevelopment and utilization of land, especially in excessive reclamation (including deforestation and cultivation on steep slopes) [1]. Some mountain areas even maintain coarse and backward development and utilization methods, which has caused Yunnan province to generally maintain steep slope cultivated land for a long time, with a considerable proportion [46]. According to the third national land survey data of Yunnan province [64], the steep slope cultivated land of 15°~25° (including 25°) in Yunnan province accounts for 27.22%, and steep slope cultivated land above 25° accounts for 18.64%. Based on the analysis and evaluation of the RS image interpretation results in 2020, the suitable cultivated land area in Yunnan province was 4,707,600 hectares, and the suitable reclamation rate was only 12.25%, while the actual reclamation rate in 2020 was 14.04%. At present, the over-reclaimed area in Yunnan province has reached 688,000 hectares, accounting for 14.62% of the area suitable for cultivation. All counties have different degrees of over-development and utilization. 68.22% of the counties in Yunnan province have an over 10% over-reclamation rate, and nearly 1/4 of the counties have an over 20% over-reclamation rate, which is one of the roots resulting in the overall poor ecological environment of land use in Yunnan. In addition, the corresponding land transformation (consolidation) measures and land protection measures have failed to catch up. For example, the IEI values are not high. According to the interpretation results of the RS image, the effective irrigation area of paddy field area in the province in 2020 was only 1.3139 million hectares, and the rate is only 24.35%. For another example, affected by long-term land development and utilization in different intensities and ways, most counties in the province have different scales of bare land distribution, and the percentage of land in the province was 2.10% in 2020.
The regional difference of the current DEF is relatively large, which is relevant to the LUCC status and ecological environment construction status of each region. Specifically, the above six single indicators reflecting the DEF values have significantly regional differences. Taking the forest coverage rate as an example, on the whole, the forest coverage in the mountain, plateau and canyon areas in northwest Yunnan, as the middle and low mountains and wide valleys and basins in the south and southwest of Yunnan is relatively high. Nujiang, Diqing, Lijiang, Pu’er and Xishuangbanna all reach 63~68%, and Dehong, Baoshan and Dali also reach 54~58%. Kunming in central Yunnan, Honghe and Wenshan in southeast Yunnan, Qujing in eastern Yunnan and Zhaotong in the highland region in northeast Yunnan are generally low in forest coverage, both below 36%, where Qujing and Zhaotong are below 29%. In terms of counties, there are 50 counties in the province with forest coverage below 40%, of which 9 counties have forest coverage below 20%. From the distribution of bare land, the karst areas in east and southeast Yunnan and the mountain canyon areas in northwest Yunnan are more significant. The proportion of bare land in Wenshan and Diqing is close to 8%. In terms of counties, the proportion of bare land area in 55 counties is more than 1%, of which 6 counties account for 5~10%, and five counties account for more than 10%. From the perspective of IEI, the effective irrigation rate of cultivated land in more than 95% of counties in the province is below 50%, of which the rate in 2/3 of counties is below 30%, and the rate in 25 counties is below 10%. In addition, the differences between the index of local biological richness (IBRC) and the index of ecosystem services value (IESV) are more prominent. Nearly 40% of the counties in the province have an IBRC below 120, of which 13 counties have an IBRC below 100. Nearly 40% of counties in the province have an average IESV of less than 1.2 million CNY/km2, while 20 counties have an average IESV of less than 1 million CNY/km2.

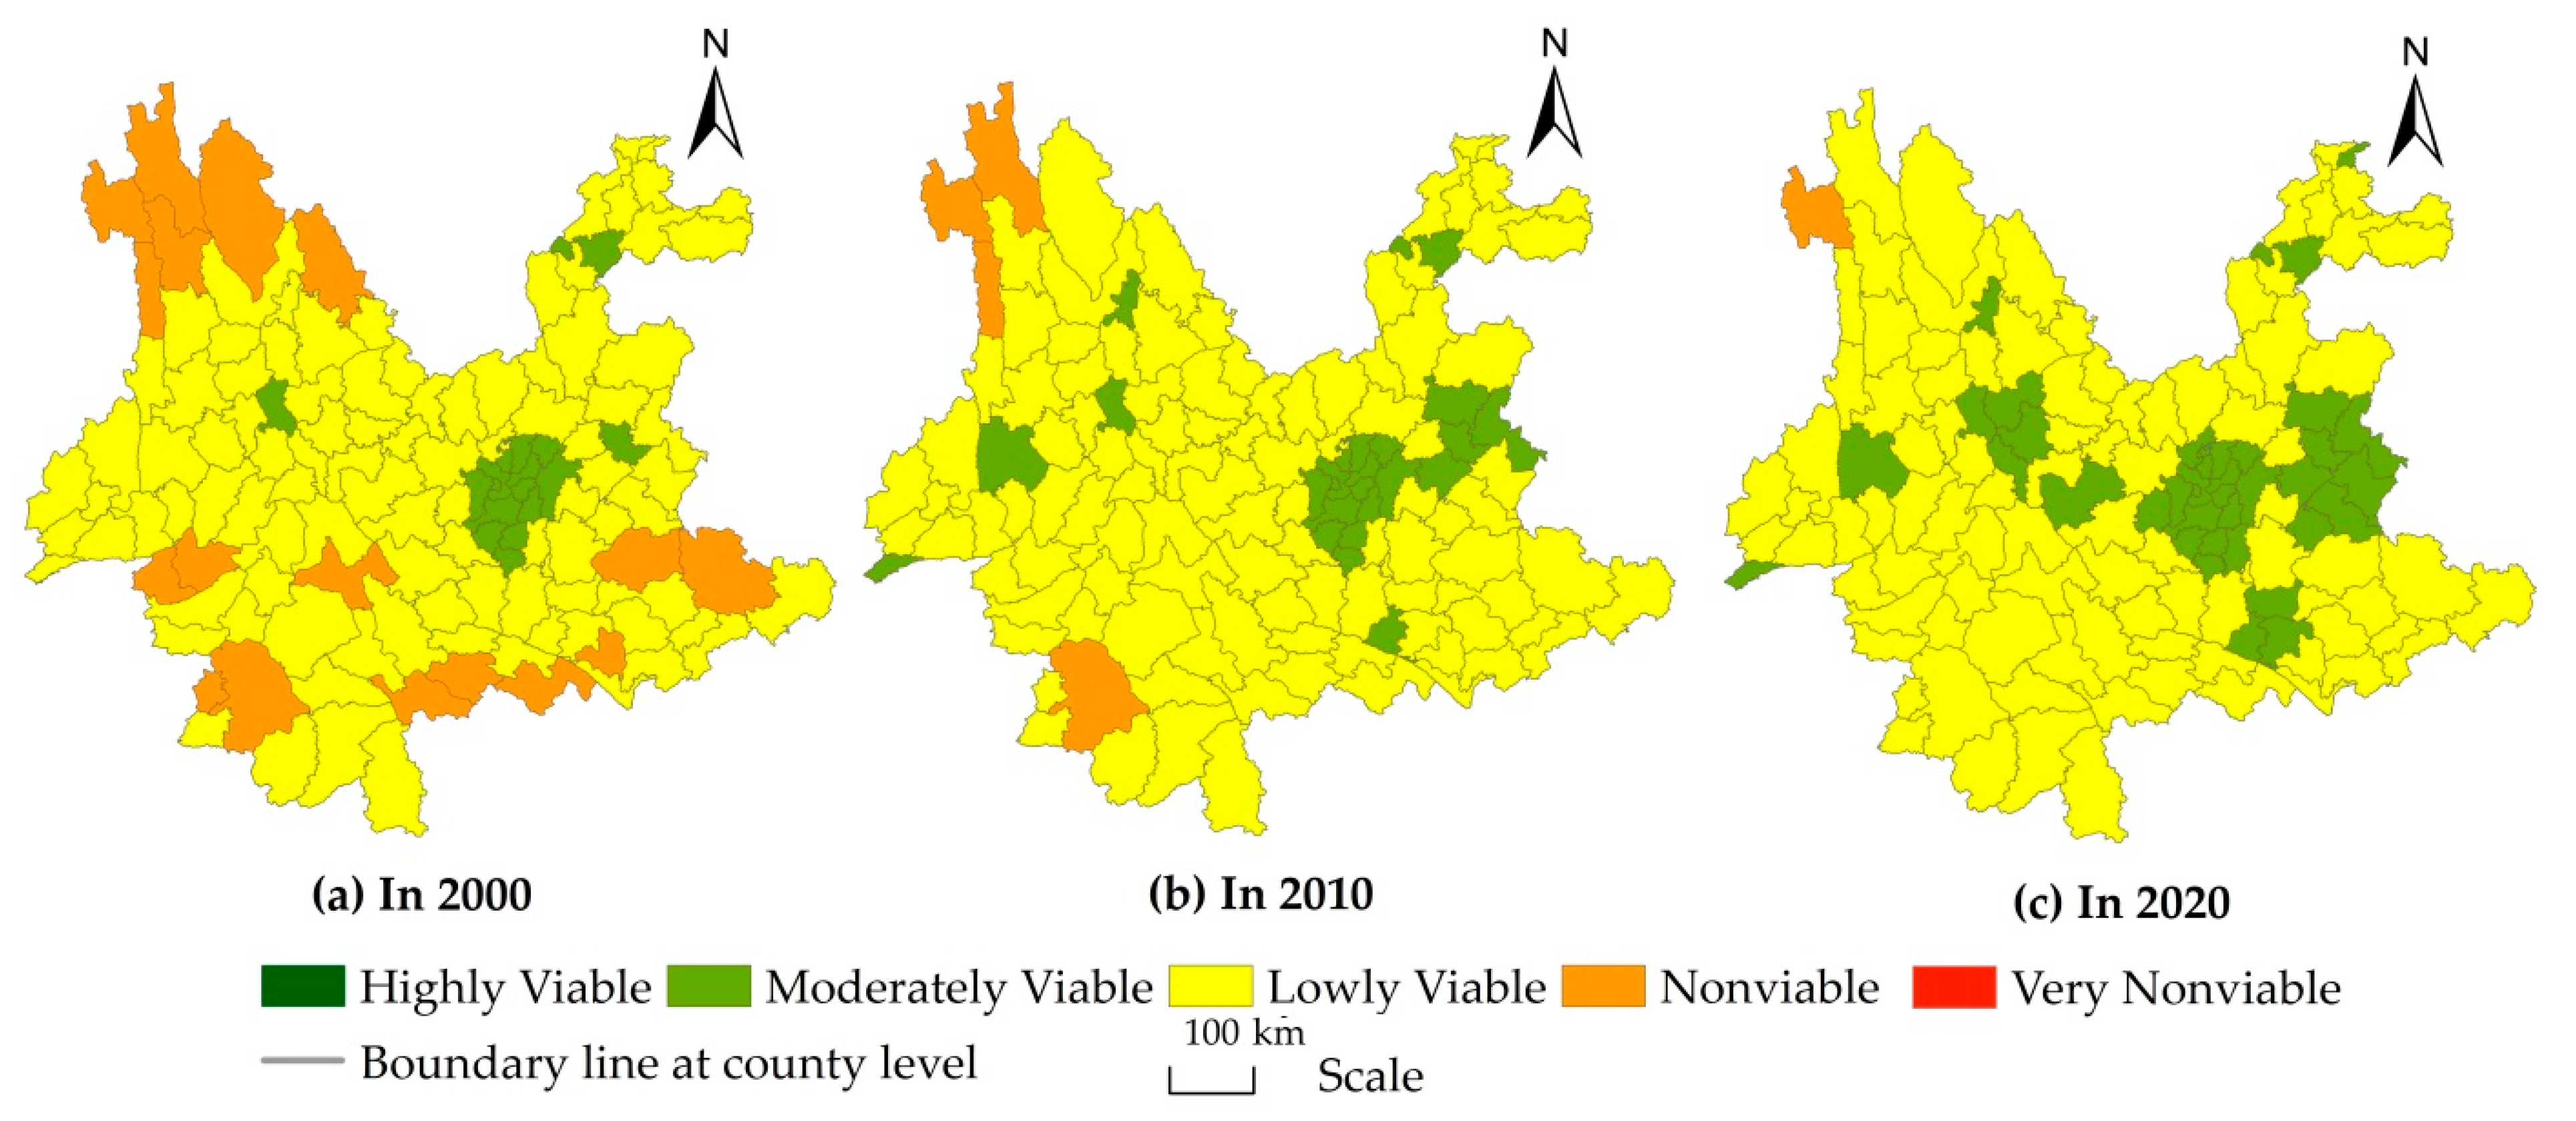
3.2. Spatio-Temporal Evolution Characteristics and Causes Analysis of EVLU

3.2.1. Change Characteristics of EVLU in Recent 20 Years

Figure 4 shows that from 2000 to 2020, the DEV values in Yunnan province and other regions have changed significantly, mainly with the following two characteristics: first, the DEV in Yunnan province has gradually increased with a relatively slow trend, and the DEV value has increased from 69.22 in 2000 to 74.05 in 2020, with 0.35% annual growth. EVLU level of Yunnan province remains at the “low feasible” level, but it is now close to the lower limit of the “medium feasible” level, which means that the economic construction of Yunnan province has made remarkable achievements in the past 20 years. Second, the regional differences in DEV are significant. According to the changes in 129 counties, there are roughly five situations: (1) upgrading from “nonviable” to “lowly viable” involves 16 counties, accounting for 12.40%; (2) upgrading from “lowly viable” to “moderately viable” involves 17 counties, accounting for 13.18%; (3) maintaining the “nonviable” level involves one county (Gongshan), accounting for 0.77%; (4) maintaining the “lowly viable” level involves 79 counties, accounting for 61.24%; (5) maintaining the “moderately viable” level involves 16 counties, accounting for 12.40%.

3.2.2. Characteristics of Spatial Differences of EVLU

The EVLU in the province in 2020 is not high. The average DEV value of the province is 74.05. Although it is close to the lower limit of the “moderately viable” level (DEV value is 75), the economic viability level of land use in Yunnan province is still “lowly viable” on the whole. Among 129 counties in the province, Guandu District has the highest DEV, with a value of 88.37, Gongshan County is the lowest, and its DEV value is 58.82. In other words, there is no “highly viable” or “very nonviable” status in the province. The EVLU in 36 counties reached the level of “moderately viable,” accounting for 27.91%; 92 counties are “lowly viable,” accounting for 71.32%; one county (Gongshan) is “nonviable,” accounting for 0.77%. This shows that 72% of the counties in the province are currently “lowly viable” or even “nonviable” in terms of EVLU.

3.2.3. Analysis of the Causes of Spatio-Temporal Evolution of EVLU

From 2000 to 2020, the DEV in Yunnan province gradually improved, mainly because the province attaches great importance to the production and economic construction of various industries, and GDP and various economic indicators have significantly improved. However, as a frontier multi-ethnic province dominated by mountains, restricted by the natural environment, economy, science and technology and other factors, the economic development speed is relatively slow, resulting in a small growth of DEV.
On the whole, the DEV in most counties in Yunnan province is relatively low. Besides the low level of grain production and the insufficient production potential to drop the IYGC, the main reason is that the ICLP, IALP, IBLP and IFRUA in most counties are low compared with the higher-level counties in the province. Therefore, the economic viability calculated on this basis is correspondingly low. For example, according to the Yunnan Statistical Yearbook [44], the comprehensive land productivity of the province in 2020 was only 60% of that in China, and 89 counties (68.99%) had a land productivity of less than 10,000 CNY/ha in 2020. Among them, most counties in the mountain canyon area in northwest Yunnan had a land productivity of less than 1800 CNY/ha, while Deqin County and Gongshan County had a land productivity of less than 600 CNY/ha. For another example, according to the Yunnan Statistical Yearbook [44], the agricultural land productivity in Yunnan province was less than 70% of the national average. In 2020, the agricultural land productivity in 90 counties (69.77%) was less than 5000 CNY/ha, of which most counties in the mountain canyon area in northwest Yunnan were less than 1000 CNY/ha, while Gongshan County, Shangri-La and Deqin County were less than 400 CNY/ha. It also shows that Yunnan is still an economically underdeveloped province.
Similarly, the DEV in the province shows significant regional differences at present, which is related to the regional differences of the six individual indicators mentioned above. On the whole, the economic development of central Yunnan is fast, with Kunming and Yuxi as the main cities. GDP and fiscal revenue have increased significantly from 2000 to 2020, so the DEV has risen significantly. Limited by natural conditions, the mountain canyon region in northwest Yunnan and the rocky desertification region in southeast Yunnan have a slow economic development, and the growth rate of GDP and fiscal revenue is far lower than that of central Yunnan, so the DEV values have a small increase. At present, the economic viability of land use in Diqing and Nujiang in northwest Yunnan is the lowest in the province.

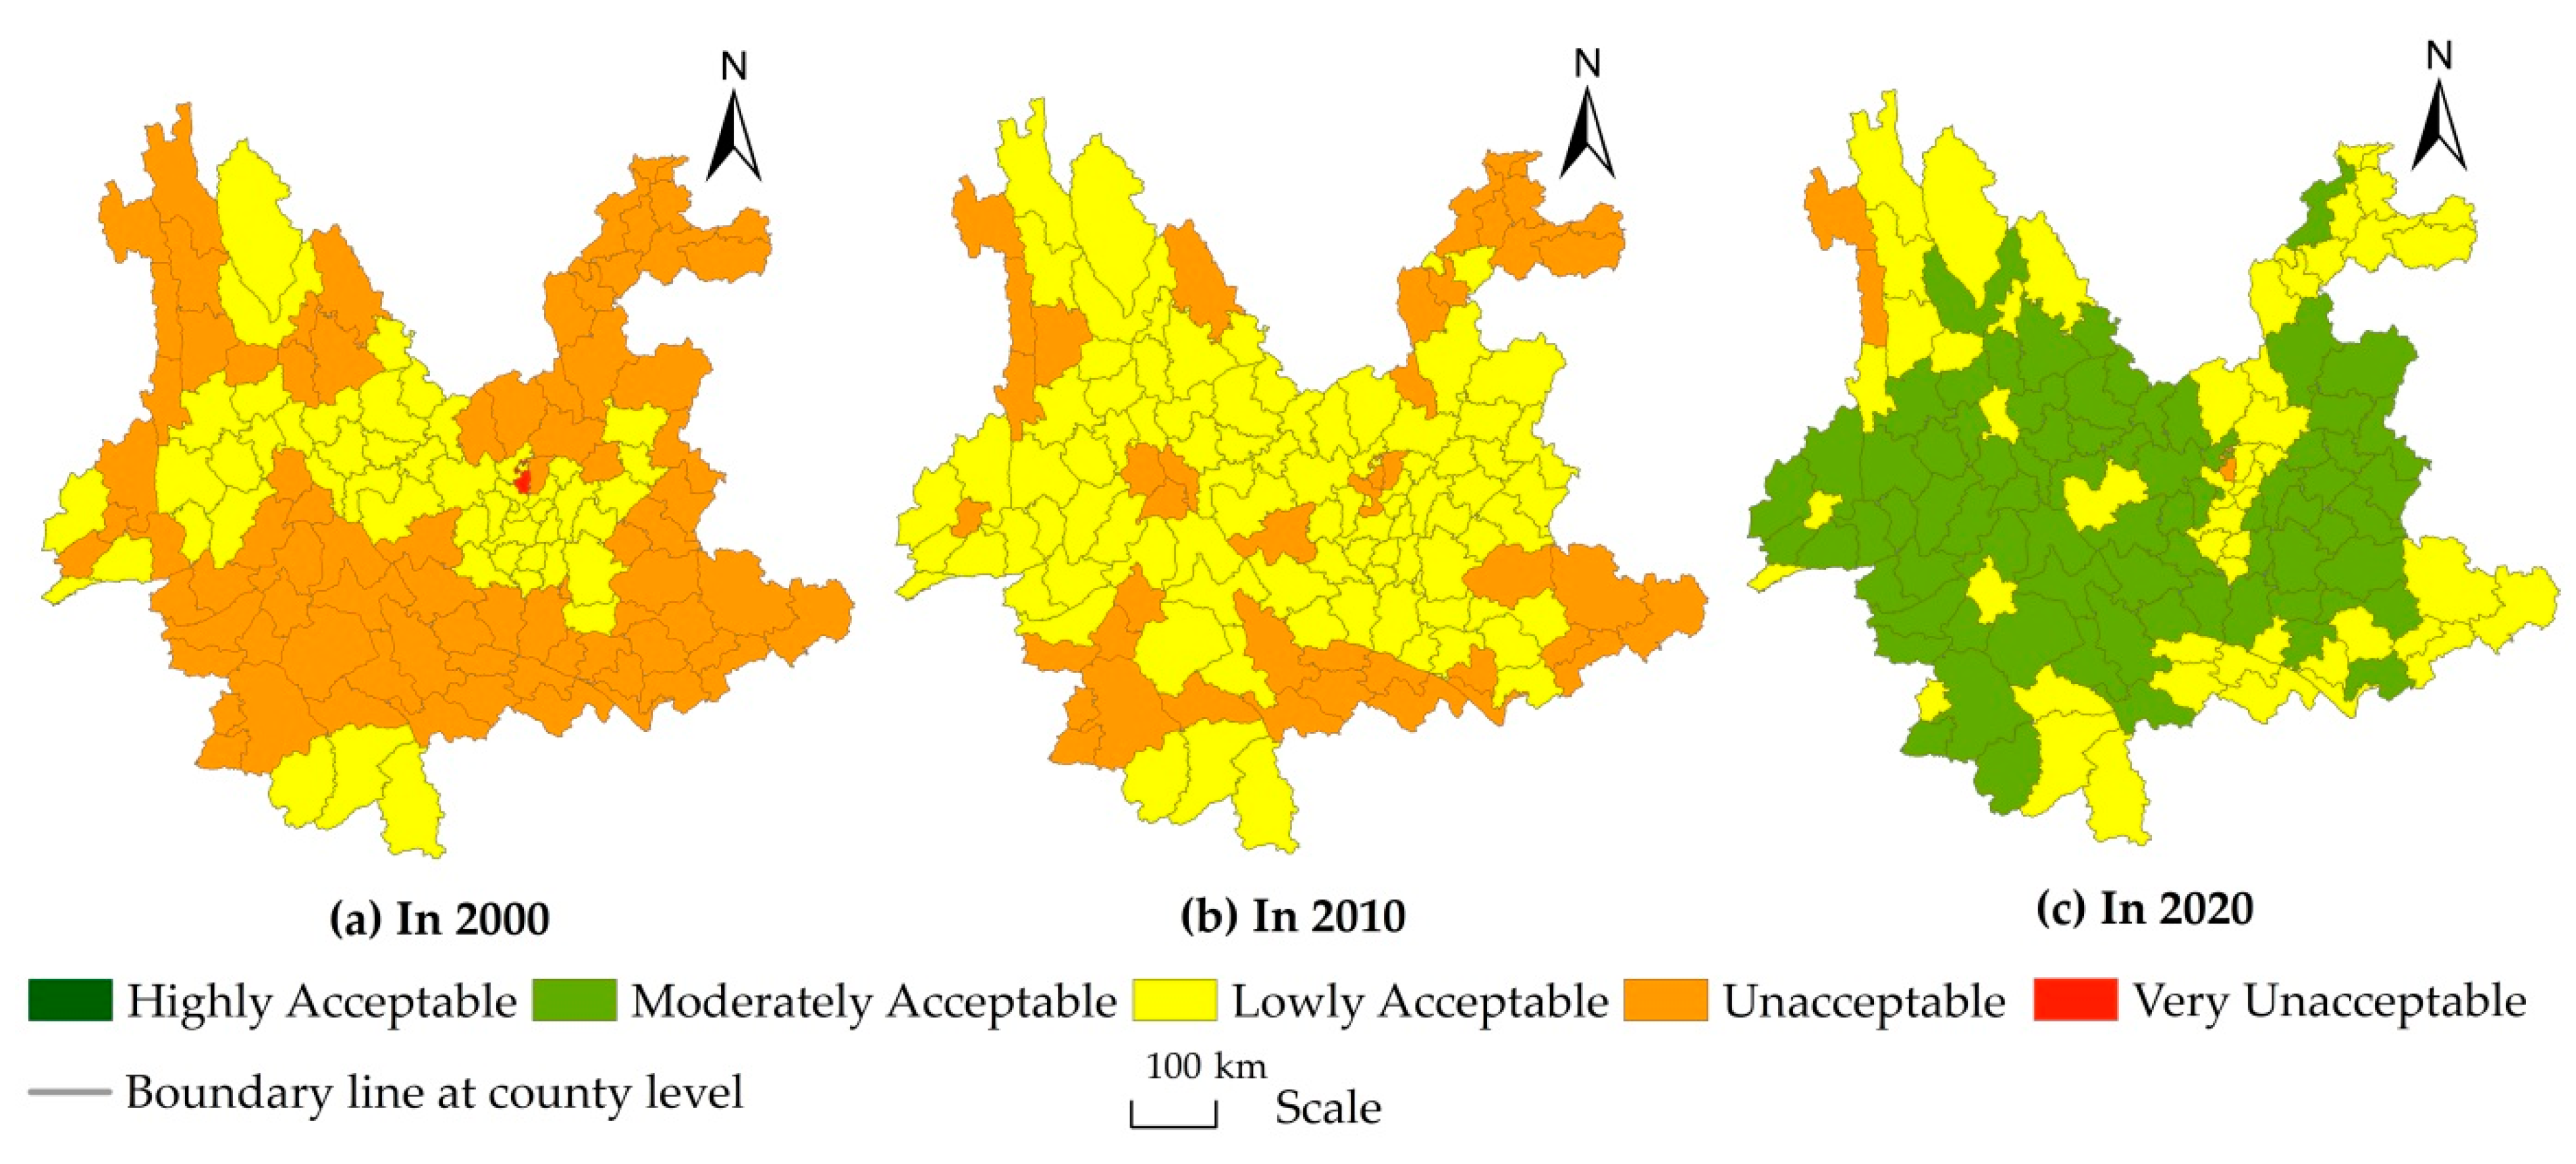
3.3. Spatio-Temporal Evolution Characteristics and Causes Analysis of SALU

3.3.1. Change Characteristics of SALU in Recent 20 Years

Figure 5 shows that from 2000 to 2020, the DSA in Yunnan province and other regions also changed significantly. The main characteristics of the change are as follows: first, the SALU in the province has improved significantly from 2000 to 2020. The DSA value of the province has increased from 60.12 in 2000 to 74.72 in 2020, with a 1.21% annual growth. Although the social acceptability level is still “lowly acceptable,” it is close to the lower limit of the “moderately acceptable” level, and the increase of DSA value is significantly greater than that of DEF and DEV. This indicates social benefits of land use in the province have been obviously raised in the past 20 years. Second, the changes of DSA are relatively complex, and there are roughly six situations (1) upgrading from “very unacceptable” to “unacceptable,” involving one county, accounting for 0.77%; (2) upgrading from “unacceptable” to “lowly acceptable” involves 38 counties, accounting for 29.46%; (3) upgrading from “unacceptable” to “moderately acceptable” involves 39 counties, accounting for 30.23%; (4) upgrading from “lowly acceptable” to “moderately acceptable” involves 35 counties, accounting for 27.13%; (5) maintaining the “unacceptable” level involves two counties, accounting for 1.55%; (6) maintain the “lowly acceptable” level involves 14 counties, accounting for 10.85%.

3.3.2. Characteristics of Spatial Differences of SALU

The average DSA value of Yunnan province in 2020 was 74.72. Although the DSA value is close to the lower limit of the “moderately acceptable” level (DSA value is 75), it is still a “lowly acceptable” level on the whole. In terms of the SALU in each county, there are obvious differences: 75 counties have reached the “moderately acceptable” level, accounting for 58.14%; 51 counties are “lowly acceptable,” accounting for 39.53%; three counties are “unacceptable,” accounting for 2.33%.

3.3.3. Analysis of the Causes of Spatio-Temporal Evolution of SALU

From 2000 to 2020, the DSA in Yunnan province has significantly improved, mainly because the land resource development and utilization activities in Yunnan province continued to meet the livelihood and development demands of all groups of humans to a large extent, and the IPGDP, IDIR and other indicators have been significantly improved. However, with the continuous growth of the population, the IPP has increased, and the IPYG has also fluctuated, making the growth of DSA small.
On the whole, at present, the DSA in counties of Yunnan province is not high, mainly because the index of population pressure (IPP), IPGDP, IDIR and IPYG of many counties are low, so the DSA value calculated according to this is also correspondingly low. The results of this paper show that, with the continuous growth of the total population, the actual population of Kunming in central Yunnan, Zhaotong in the northeastern mountainous area of Yunnan, and most counties in Wenshan in the karst area of southeast Yunnan has exceeded the land population carrying capacity, and the population pressure is gradually increasing. The IPGDP and IDIR in Yunnan province are obviously lower than the countrywide level. In 2020, IDIR in Yunnan province will be the fourth lowest among 31 provinces in China [45]. Also, The IDIR in most counties is obviously lower than the countrywide level. The urban-rural income gap is large, which is the primary reason why the total number of poverty-stricken counties in Yunnan province ranks first in China.
In the same way, the current DSA values in the province show obvious regional differences, which are also related to the regional differences of the above four single indicators. For example, although the population pressure in central Yunnan is large and the per capita area of farmland is small, IPGDP and IDIR are significantly higher than the provincial average due to the rapid economic development, so the social acceptability is relatively high. Zhaotong in the mountainous area of northeast Yunnan has not only a large population pressure but also its economic development is restricted by natural conditions. Its IPGDP and IDIR are low, and the DSA is low. Nujiang in the northwest of the province is restricted by mountain and canyon topography, with less per capita cultivated land area and slow economic development. Its IPGDP and IDIR rank at the bottom among the provinces, and its DSA value also ranks at the lowest level of the province.

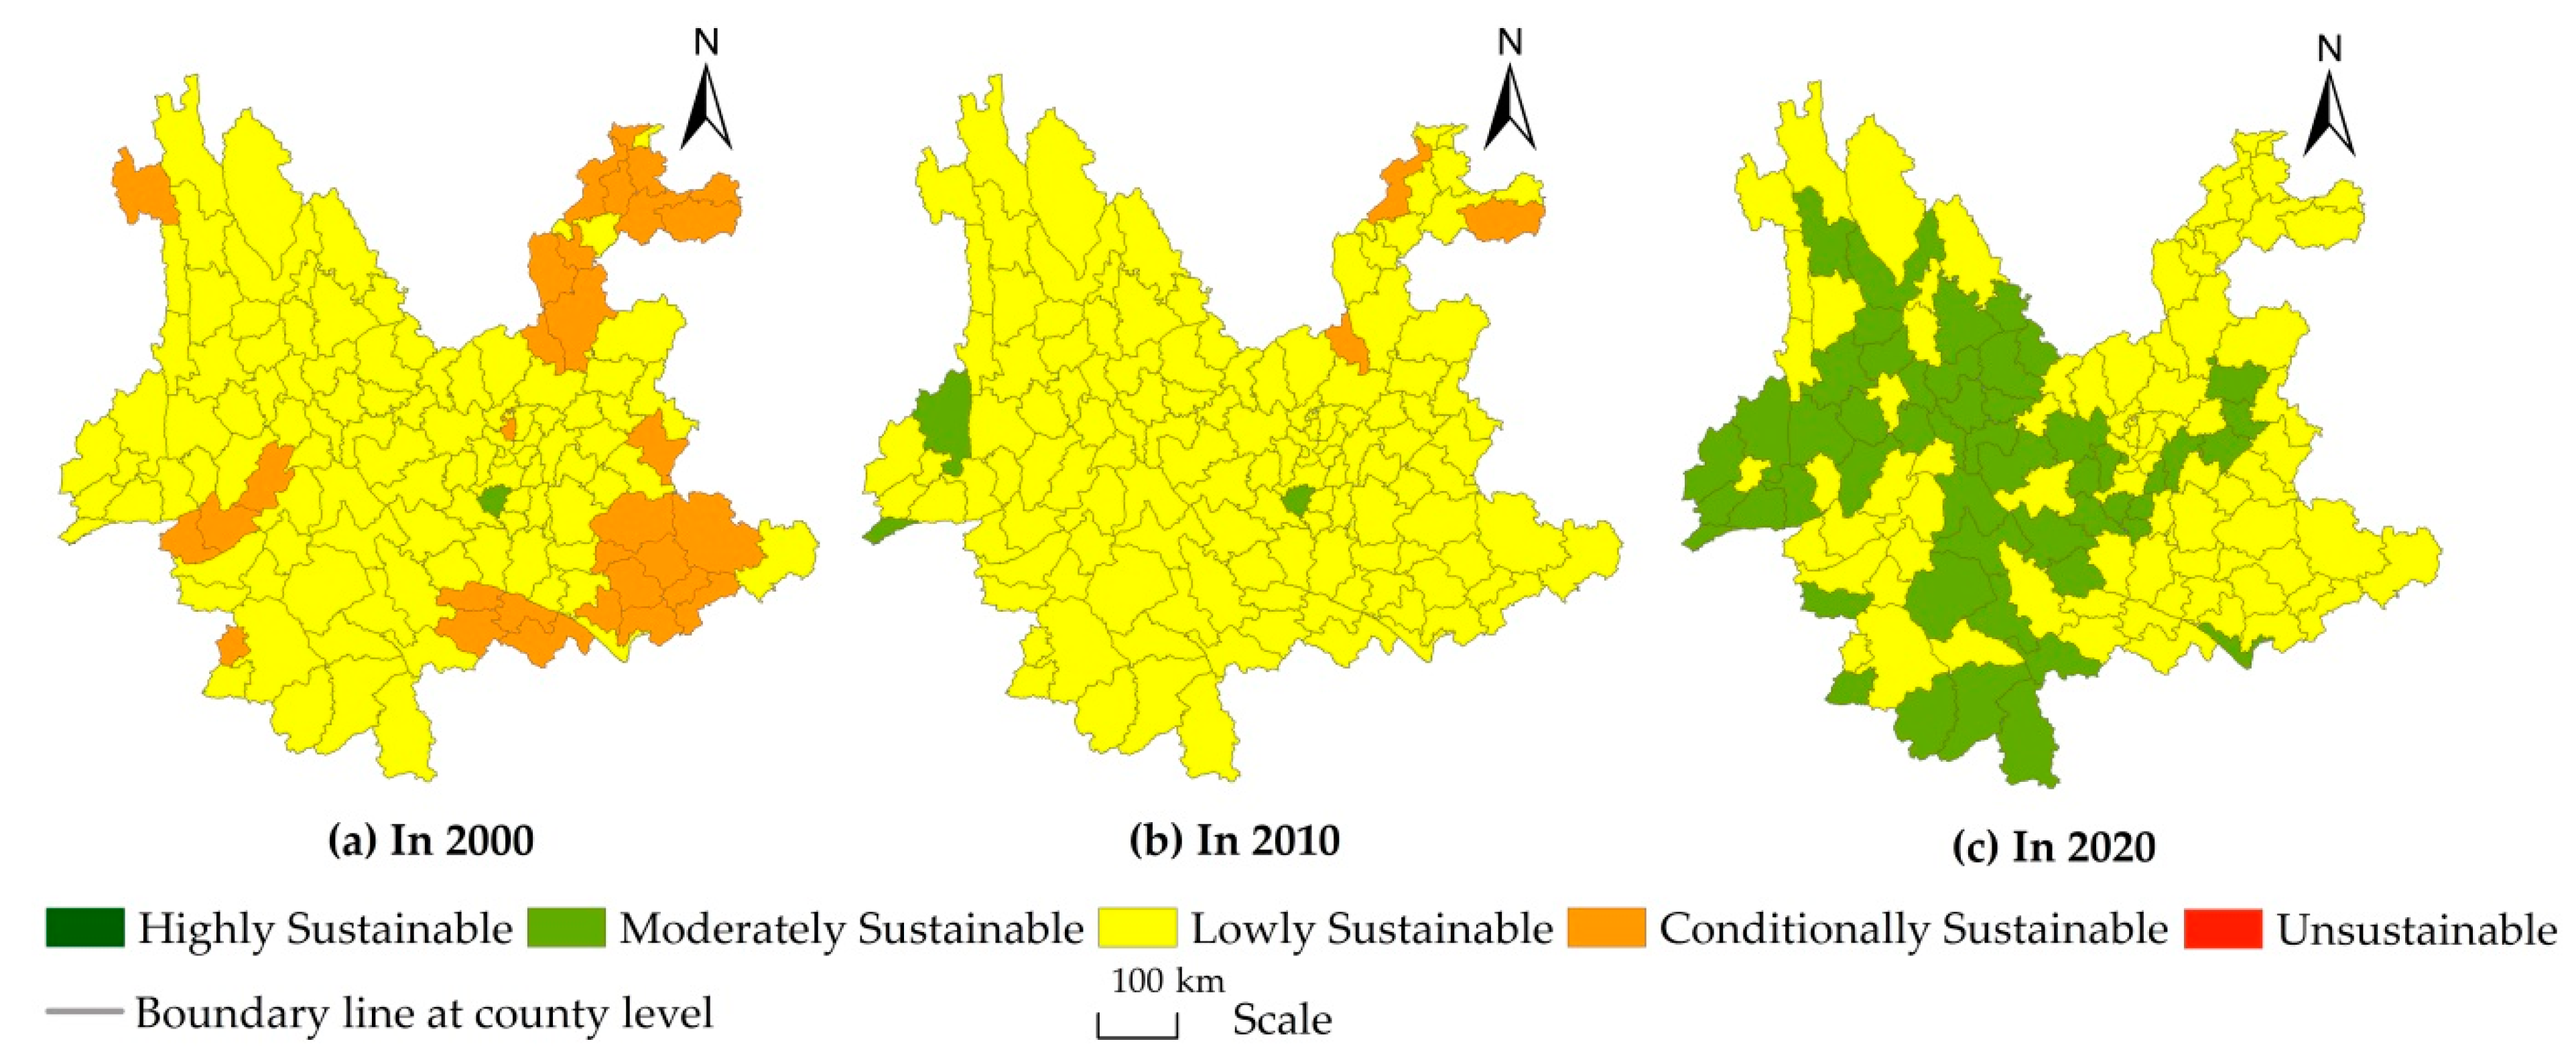
3.4. Spatio-Temporal Evolution Characteristics and Causes Analysis of OSLU

3.4.1. Change Characteristics of OSLU in Recent 20 Years

Figure 6 shows that from 2000 to 2020, the OSLU in Yunnan province and other regions has changed significantly, indicating the following basic characteristics:
First, the DOS in Yunnan province and other regions has been improved to a certain extent from 2000 to 2020. DOS of the province rose from 66.24 in 2000 to 74.94 in 2020, with an added value of 8.71. In terms of the added value of DOS in 129 counties in recent 20 years, 59 counties (45.74%) have reached more than 10, 57 counties (44.18%) have about 5~10, and only 13 counties (10.08%) have less than 5.
Second, the growth rate of the DOS is not large, with 0.66% annual growth. Furthermore, 18 counties (13.95%) had an annual growth rate of more than 1%, 96 counties (74.42%) had 0.5%~1% annual growth, and 15 counties (11.63%) had less than 0.5% annual growth in 129 counties in the past 20 years.
Third, due to the small growth of DOS, the level of OSLU in the province has not changed. In 2000, 2010 and 2020, it belonged to the “lowly sustainable” level. However, the OSLU in the province will approach the level of “moderately sustainable” in 2020, indicating that the development and construction in the past 20 years have effectively improved the DOS.
Fourth, the change of the DOS is relatively complex, and there are roughly four situations: (1) upgrading from “conditionally sustainable” to “lowly sustainable” occurred in 30 counties, accounting for 23.26%; (2) upgrading from “lowly sustainable” to “moderately sustainable” occurred in 50 counties, accounting for 38.76%; (3) maintaining the “lowly sustainable” level occurred in 48 counties, accounting for 37.21%; (4) maintaining the “moderately sustainable” level occurred in one county, accounting for 0.77%.

3.4.2. Characteristics of Spatial Differences of the OSLU

From the perspective of 2020, the DOS in Yunnan province is at a moderate level. The outcomes implied average value of the DOS of the province in 2020 was 74.94. Although it belongs to the “lowly sustainable” level, it is close to the lower limit of the “moderately sustainable” level (DOS value is 75). Its basic performance is that there are obvious deficiencies in EFLU, EVLU and SALU. Land exploitation and use activities have caused certain influences and destruction of the ecology. Also, economic and social benefits are not high. However, regional differences in the DOS are large. In general, the DOS of the highland region in northeast Yunnan and the karst middle and low mountain area in southeast Yunnan is low, especially the highland region in northeast Yunnan is the lowest, and its DOS values are mostly of the “lowly sustainable” level. The overall sustainability of south, southwest and central Yunnan is higher than that of the above regions, and their DOS values are mostly “moderately sustainable.” From the level of OSLU of each county, among 129 counties in the province, 51 counties have DOS values of more than 75, which is “moderately sustainable,” accounting for 39.53%. The DOS value of 78 counties is between 60 and 70, belonging to the “lowly sustainable” level, accounting for 60.47% of the total counties in the province. That is to say, the OSLU in more than 3/5 counties in the province is still low.

3.4.3. Analysis of the Causes of Spatio-Temporal Evolution of OSLU

The DOS value of mountainous areas is determined by the EFLU, EVLU and SALU and is a comprehensive reflection of the DEF, DEV and DSA [1,13,24]. Therefore, the characteristics of the spatio-temporal evolution of DOS are closely related to the DEF, DEV and DSA. From 2000 to 2020, with the stepwise promotion of DEF, DEV and DSA in Yunnan province, the DOS values have also been raised to a certain degree. However, because of small increases in DEF, DEV and DSA, the DOS values also have a small growth.
On the whole, the ecological environment problem in Yunnan is still relatively prominent [41,65,66], and it is urgent to implement major projects of ecological protection and restoration. Therefore, the DEF values in most counties of Yunnan province are still low. In addition, the DEV and DSA values of various regions are low, so the DOS value must be correspondingly low. We need to focus extremely on the dry and hot valley area dominated by the Jinsha River, rocky desertification areas in eastern and southeastern Yunnan and other particularly vulnerable ecological areas. The dry and hot valleys, Yuanjiang River and Lancang River Basins, are characterized by complex terrain, large river drop, dry and hot valley climate, high evaporation intensity, severe drought and lack of water, large population and little land, and most of them are slope cultivated land, a high index of land reclamation, frequent human activities, and low forest coverage. In addition, rocky land desertification is relatively serious, and economic development is restricted. Therefore, the DOS is low, and it is urgent to strengthen ecological protection. In addition, the contradiction between population, resources, environment and economy in karst rocky desertification area is very obvious, which largely influences the sustainable development of the area [67]. Especially in the rocky desertification areas in eastern and southeastern Yunnan, the problem of surface drought and water shortage is prominent, and the ecological vulnerability is extremely high. The area with water and soil loss accounts for about 30%, and the area of rocky desertification accounts for 43.70% in rocky desertification regions in the province [65]. Ecological reconstruction is extremely demanding, and economic development is significantly influenced. At present, DOS is low, so it is urgent to strengthen the comprehensive management of rocky karst desertification.

4. Conclusions and Discussion

4.1. Main Conclusions

Based on the data of three terms obtained from RS image interpretation and economic and social statistic data in Yunnan province (2000, 2010 and 2020), this study takes Yunnan province, a typical mountainous province in southwest China, as the research region, and takes the county administrative region as the evaluation unit, organically integrating the three dimensions of EFLU, EVLU and SALU of the county, using the method of combining the AHP method with the comprehensive analysis method, after building the evaluation index system of three dimensions of EFLU, EVLU and SALU in 129 counties, the DEF, DEV and DSA values in 129 counties in 2000, 2010 and 2020 were calculated. Then the three indexes are organically integrated to calculate the DOS values in 129 counties in 2000, 2010 and 2020, which is used to comprehensively analyze the comprehensive characteristics of OSLU in all counties in the province. The results show that:
(1) From the current situation (2020), the DEF, DEV and DSA values in Yunnan province are not high on the whole, so the DOS values are not high. In 2020, the average DEF value, DEV value and DSA value of the whole province were 75.87, 74.05 and 74.72, respectively, and the corresponding levels were “moderately friendly,” “lowly viability,” and “lowly acceptable.” The final measured DOS value is 74.94, which is also “lowly sustainable” in general, but close to the lower limit of “moderately sustainable” (DOS value is 75). The basic situation reflected by this feature is that there are obvious shortcomings in EFLU, EVLU and SALU in Yunnan province at present. Land development and utilization activities have caused certain influences and the destruction of the ecological environment. Also, the economic and social benefits are not high.
Another feature is that the DOS values have large regional differences. The overall sustainability of the highland region in the northeast and the karst middle and low mountain area in the southeast of Yunnan is relatively low, and the DOS values are mostly at the “lowly sustainable” level. The DOS values of the south of Yunnan, southwest of Yunnan, and central Yunnan is higher than that of the above regions, and their DOS values are mostly “moderately sustainable.” Among the 129 counties in the province, 60.47% of them are still at the level of “lowly sustainable.”
(2) From the changes in the overall Yunnan province and 129 counties from 2000 to 2020, the DEF, DEV and DSA values in Yunnan province and each county have been significantly improved. Accordingly, the DOS values have been raised to a certain level, but the growth rate is not large, with 0.66% annual growth in the province. In terms of the OSLU level, there is no change in the whole province. In 2000, 2010 and 2020, it belonged to the “lowly sustainable” level. However, in 2020, the overall DOS value of Yunnan province was close to the level of “moderately sustainable,” indicating that the development and construction from 2000 to 2020 have effectively improved the DOS.
The changes in DEF, DEV, DSA and DOS values are more complex. In terms of the change in ecological friendliness level, 61 counties (47.29%) have improved, while 68 counties (52.71%) have not changed their level. In terms of the change in economic viability level, 33 counties (25.58%) have improved, while 96 counties (74.42%) have not changed their level. In terms of the change in social acceptability level, 113 counties (87.60%) have improved, while 16 counties (12.40%) have not changed their level. In terms of the OSLU level, 80 counties (62.02%) have improved, while 49 counties (37.98%) have not changed their level.

4.2. Discussion

In this paper, DEF, DEV and DSA are organically integrated to conduct a comprehensive evaluation of DOS. Among them, ecological friendliness is the most significant basis for OSLU in mountain regions. The DEF values in mountainous areas are a comprehensive reflection of the level of overdevelopment of land, land transformation (consolidation) and land protection. The reason why the DEF value in Yunnan province is relatively low is the result of the overdevelopment and utilization of land, especially in excessive reclamation (including deforestation and cultivation on steep slopes) [1]. Some mountain areas even maintain coarse and backward development and utilization methods, which has caused Yunnan province to generally maintain steep slope cultivated land for a long time, with a considerable proportion. According to the third national land survey data of Yunnan province [64], the steep slope cultivated land of 15°~25° (including 25°) in Yunnan province accounts for 27.22%, and steep slope cultivated land above 25° accounts for 18.64%. Based on the analysis and evaluation of the RS image interpretation results in 2020, the suitable cultivated land area in Yunnan province was 4,707,600 hectares, and the suitable reclamation rate was only 12.25%, while the actual reclamation rate in 2020 was 14.04%. At present, the over-reclaimed area in Yunnan province has reached 688,000 hectares, accounting for 14.62% of the area suitable for cultivation. All counties have different degrees of overdevelopment and utilization. A total of 68.22% of the counties in Yunnan province have over 10% over-reclamation rates, and nearly 1/4 of the counties have over 20% over-reclamation rates, which is one of the roots resulting in the overall poor ecological land use in Yunnan. In addition, the corresponding land transformation (consolidation) measures and land protection measures have failed to catch up, as shown in the effective irrigation rates of cultivated land are not high and less than 30% in about 2/3 counties. Also, the regional difference in forest coverage is large, and the forest coverage in some counties is below 20% and most counties still have bare land with different scales. The index of biological richness and the ESV value per unit of land vary greatly.
The calculation results of this paper show that the DEV in Yunnan province has gradually improved from 2000 to 2020, mainly because it attached great importance to the production and economic construction of various industries so that GDP and various economic indicators have been significantly improved. However, due to the constraints of the natural environment, economy, science and technology and other factors, the economic development was comparatively lagged, and the growth of DEV was relatively small in the past 20 years. At present, the DEV in most counties is still low. Besides the low level of grain production, the insufficient production potential and the generally low grain yield in various regions, the major causes are that ICLP, IALP, IBLP and IFRUA in most counties are low compared with the higher level counties in the province. Therefore, the economic viability calculated on this basis is correspondingly low. According to the Yunnan Statistical Yearbook [44], in 2020, the comprehensive land productivity of the province was only 60% of that in China, and 68.99% was lower than 10,000 CNY/ha in 2020. Most counties in the mountain valley area in northwest Yunnan were lower than 1800 CNY/ha. The agricultural land productivity of Yunnan province was less than 70% of the national average level. The agricultural land productivity of 69.77% of counties in 2020 was less than 5000 CNY/ha. Most counties in the mountain valley area in northwest Yunnan were less than 1000 CNY/ha. At present, the DEV in the province shows significant regional differences, which are related to the regional differences of the six individual indicators mentioned above. For example, the economic development of central Yunnan was fast, with Kunming and Yuxi as the main cities. GDP and fiscal revenue have increased significantly from 2000 to 2020, so the DEV has raised significantly. Limited by natural conditions, the mountain canyon region in the northwest and the rocky desertification area in the southeast have slow economic development, and the growth rate of GDP and fiscal revenue is far lower than that of central Yunnan, so the DEV values have a small increase.
From 2000 to 2020, the exploitation and use of land resources continued to meet the survival and development needs of all groups of people to a large extent in the province, and the IPGDP, IDIR and other indicators have been significantly improved, making the DSA improve correspondingly. However, with the continuous growth of the population, the IPP has increased, and the IPYG has also fluctuated, making the growth of DSA small. At present, the DSA in counties of Yunnan province is not high, mainly because the index of population pressure (IPP), IPGDP, IDIR and IPYG of many counties are low, so the DSA value calculated according to this is also correspondingly low. The results of this paper show that, with the continuous growth of the total population, the actual population of Kunming in central Yunnan, Zhaotong in the northeastern mountainous area of Yunnan, and most counties in Wenshan in the karst area of southeast Yunnan has exceeded the land population carrying capacity, and the population pressure is gradually increasing. The IPGDP and IDIR in Yunnan province are obviously lower than the countrywide level. In 2020, IDIR in Yunnan province was the fourth lowest among 31 provinces in China [45]. Also, The IDIR in most counties was obviously lower than the countrywide level. The urban-rural income gap was large, which was the major reason why the total number of poverty-stricken counties in Yunnan province ranks first in China. On the other hand, the current DSA values in the province show obvious regional differences, which are also related to the regional differences of the above four single indicators. For example, although the population pressure in central Yunnan is large and the per capita farmland area is small, IPGDP and IDIR are significantly higher than the provincial level because of rapid economic development, so the social acceptability is relatively high. Zhaotong in the mountainous area of northeast Yunnan has not only a large population pressure but also its economic development is restricted by natural conditions. Its IPGDP and IDIR are low, and the DSA is low. Nujiang is restricted by mountain and canyon topography, with less per capita cultivated land area and slow economic development. Its IPGDP and IDIR rank at the bottom in the province, and its DSA value also ranks at the lowest level in the province.
The DOS in mountainous areas is determined by the EFLU, EVLU and SALU and is a comprehensive reflection of the DEF, DEV and DSA. From 2000 to 2020, due to the gradual improvement of DEF, DEV and DSA in Yunnan province, the DOS values have also been promoted to a certain degree. However, because of the small increase of DEF, DEV and DSA, the DOS values also had a small increase. On the whole, the ecological environment problem in Yunnan is still relatively prominent [65,66]. The DEF in most counties in Yunnan province is still low. In addition, the DEV and DSA of various regions are also low, so the DOS must be correspondingly low. Lots of rivers in the province, such as the Yuanjiang River, have complex terrain, large river drop, dry and hot valley climate, high evaporation intensity, severe drought and water shortage, more people and less cultivated land, and low forest coverage. In addition, rocky land desertification is also serious, which restricts economic development, so the DOS is low. Another example is the rocky desertification areas in eastern and southeastern Yunnan. Due to the prominent problem of surface drought and water shortage, the ecological vulnerability is extremely high. The area with water and soil loss accounts for about 30%, and the area of rocky desertification accounts for 43.70% of rocky desertification regions in the province [65]. To advance SLU, overall sustainability must be greatly improved. Therefore, it is urgent to take effective ecological and environmental, economic or comprehensive methods according to local conditions throughout the province, especially to exploit and use all kinds of land reasonably through the principle of ecological suitability of land, carry out the construction of beautiful mountains and rivers, ensure the ecological security of land in the province [67], pay attention to economic and social benefits, and steadily improve the DEF, DEV and DSA in the province, so as to correspondingly improve the DOS values. For counties with the evaluation result of “lowly sustainable,” it is essential to fundamentally reverse land use patterns and take major ecological and environmental, economic or comprehensive methods to significantly improve the OSLU.
Compared with existing literature, the research on LUSE carried out in this paper has obvious characteristics and innovation, mainly from the perspective of LUCC based on RS image interpretation, integrating “RS and GIS + multi-phase LUCC + LUSE theory and quantitative practical methods”. Compared with the previous four types of research (“existing survey and statistical data + current status or quantitative LUSE in a certain year,” “existing survey and statistical data + quantitative analysis of evolution in sustainable level of land use in several years”, “remote sensing image interpretation (RS and GIS) + quantitative LUSE in a certain year” and “remote sensing image interpretation (RS and GIS) + qualitative description and analysis of the impact of LUCC on SLU”), it has large research value to further strengthen and develop the theory and method system of LUSE. In addition, in terms of actual needs, the research outcomes can offer Yunnan province and even similar mountain areas qualitative judgment and quantitative analysis of the DOS in mountain areas with its dynamic change trend so as to provide a basic foundation and technical support for strategic planning and management of SLU in mountain regions.
What is more, from the perspective of LUCC based on RS image interpretation, studying the characteristics and laws of regional LUSE is also a further distillation and development of previous LUCC research. LUCC often has a great impact on ecosystems, biogeochemical cycles, climate change and biodiversity [68,69], which in turn affects the sustainable use of regional land. Therefore, LUCC has become a core content of worldwide environmental change studies [70,71], and research results have been emerging since the 1990s. In China, Prof. Liu Jiyuan’s team has continued to carry out research on national LUCC and achieved outstanding results [57,72], laying a foundation for national and regional research on SLU. In recent years, LUCC research has developed into an independent and interdisciplinary research field: Land Change Science (LCS) [73], and the Global Land Plan (GLP) has organized a land system science research group, forming Land System Science (LSS) [74,75,76]. Whether it is land change science or land system science, the ultimate goal is for SLU. Therefore, this study can promote the further development of LUCC and promote the development of LCS and LSS.

Author Contributions

Conceptualization, R.Y. and Z.Y.; methodology, Z.Y.; software, R.Y. and Q.W.; validation, R.Y., Z.Y. and S.Y.; formal analysis, Z.Y.; investigation, Z.Y.; resources, Z.Y.; data curation, R.Y. and Z.Y.; writing—original draft preparation, R.Y., Q.W. and Z.Y.; writing—review and editing, R.Y., Q.W. and Z.Y.; visualization, R.Y. and Q.W.; supervision, Z.Y.; project administration, Z.Y.; funding acquisition, Z.Y. All authors have read and agreed to the published version of the manuscript.

Funding

This research was funded by the National Natural Science Foundation of China, grant number 41261018.

Data Availability Statement

The RS image data of the three phases (2000, 2010 and 2020) used in this research is obtained from the website of “https://www.resdc.cn/,” (accessed on 8 February 2022). Geospatial data from 30 m × 30 m Yunnan grid DEM data is obtained from the website: http://www.gscloud.cn (accessed on 8 February 2022). The county boundaries of Yunnan province used to calculate the land use classification area data of 129 counties in Yunnan province in each period are based on the county map of Yunnan province provided by the website of MAP WORLD–Yunnan Provincial Platform for common Geo-Spatial Information Service. The website is https://yunnan.tianditu.gov.cn/MapResource (accessed on 8 February 2022). The economic and social statistical data come from the website of “http://www.stats.gov.cn/” and “http://stats.yn.gov.cn/” (accessed on 8 February 2022).

Conflicts of Interest

The authors declare no conflict of interest.

References

  1. Yang, Z.S.; Liu, Y.S. Study on Eco-Friendly Land Use in Mountainous Areas of China, 1st ed.; China Science and Technology Press: Beijing, China, 2007. [Google Scholar]
  2. FAO. FESLM: An International Framework for Evaluating Sustainable Land Management; World Soil Resources Report No. 73; Food and Agriculture Organization of the United Nations: Rome, Italy, 1993. [Google Scholar]
  3. Xie, H.L.; Li, Z.; Xu, Y. Study on the Coupling and Coordination Relationship between Gross Ecosystem Product (GEP) and Regional Economic System: A Case Study of Jiangxi Province. Land 2022, 11, 1540. [Google Scholar] [CrossRef]
  4. He, W.K.; Yang, J.; Li, X.S.; Sang, X.J.; Xie, X.T. Research on the interactive relationship and the optimal adaptation degree between land use benefit and industrial structure evolution: A practical analysis of Jiangsu province. J. Clean. Prod. 2021, 303, 127016. [Google Scholar] [CrossRef]
  5. Yang, Z.S.; Liang, L.H.; Li, X.S.; Sang, X.J.; Xie, X.T. Traditional Land Use for sustainable land use: The case of Yunnan Province, China. In Human Resource System Challenge VII: Human Settlement Development, in Encyclopedia of Life Support Systems (EOLSS); Sassen, S., Marcotullio, P., Eds.; Eolss Publishers: Oxford, UK, 2004. [Google Scholar]
  6. Sun, Y.; Liu, Y.Z. Evaluation of land use sustainability based on land fragmentation: A case on Fenyi County, Jiangxi Province. J. Nat. Resour. 2010, 25, 802–810. [Google Scholar]
  7. Han, B.; Jin, X.B.; Sun, R.; Li, H.B.; Liang, X.Y.; Zhou, Y.K. Land use sustainability evaluation based on conflict-adaptation perspective. Acta Geogra. Sinica 2021, 76, 1763. [Google Scholar]
  8. Hu, M.L. Evaluation of sustainable land use in Xuzhou city for SDGs. Nat. Resour. Inform. 2022, 22, 39–45. [Google Scholar]
  9. Yu, D.; Chen, W.B. Study on Land Use of Sustainability Appraisal and Spatiotemporal Features in Jiangxi Province. China Land Sci. 2009, 23, 43–47,69. [Google Scholar]
  10. Zhao, X.G.; Pan, Y.J.; Ding, S.; Liu, S.F.; Duan, R.T.; Wei, Q.; Su, H. Evaluation of regional land use sustainability and its spatial-temporal pattern among provinces in China. Trans. Chin. Soc. Agric. Eng. 2014, 30, 196–204. [Google Scholar]
  11. Xie, H.L.; Liu, Q.; Yao, G.R.; Tan, M.H. Measuring regional land use sustainability of the Poyang Lake Eco-economic Zone based on PSR modeling. Resour. Sci. 2015, 37, 449–457. [Google Scholar]
  12. Wang, Y.; Guo, C.X. Comprehensive Evaluatioon and Spatia-Temporal Analysis of Sustainable Land Use In Shaanxi Province. Chin. J. Agric. Resour. Region. Plan. 2018, 39, 113–122. [Google Scholar]
  13. Zhao, S. Research on the Temporal and Spatial Changes of Land Use Sustainability during the Period of Poverty Alleviation in the Middle Reaches of Jinsha River: A Case of Luquan Yi and Miao Autonomous County, Yunnan Province; Yunnan University of Finance and Economics: Kunming, China, 2022. [Google Scholar]
  14. Zhou, Y.; Xing, L.X. Study on Sustainable utilization of land resources based on remote sensing data. World Geol. 2004, 23, 175–178. [Google Scholar]
  15. Fu, B.J.; Chen, L.D.; Cai, Y.L.; Li, X.B. Study on Land Use Change and Sustainable Use in the Areas around Bo Hai, 1st ed.; Science Press: Beijing, China, 2004. [Google Scholar]
  16. Zhang, J.K.; Cheng, Y.P.; Dong, H.; Guo, Q.S.; Liu, K.; Zhang, F.W. Study on Ecological Environment and Sustainable Land Use Based on Satellite Remote Sensing. J. Groundw. Sci. Eng. 2013, 1, 89–96. [Google Scholar]
  17. Wu, Q.J.; Yang, R.Y.; Yang, Z.S. A Study on the Rationality of Land Use Change in the Dianchi Basin during the Last 40 Years under the Background of Lake Revolution. Sustainability 2022, 14, 11479. [Google Scholar] [CrossRef]
  18. Yan, J.M.; Shen, Y.; Xia, F.Z. Differentiated Optimization of Sustainable Land Use in Metropolitan Areas: A Demarcation of Functional Units for Land Consolidation. Sustainability 2017, 9, 1356. [Google Scholar] [CrossRef] [Green Version]
  19. Tan, R.; Hu, R.M.; Vatn, A. What does sustainability demand? An institutionalist analysis with applications to China. J. Chin. Gov. 2021, 6, 486–514. [Google Scholar] [CrossRef]
  20. Mumtas, M. Sustainability Indicators for Assessing and Monitoring the Sustainable Land Management in the Commercial Rice Zone of the Lower Pak Phanang River Basin, Thailand. Agric. Agric. Sci. Procedia 2016, 8, 77–83. [Google Scholar] [CrossRef]
  21. Zhou, G. Evaluation of Regional Land Sustainable Use—A case Study of Yanhe County of Guizhou Province, China. J. Guizhou Norm. Univ. (Nat. Sci.) 2006, 24, 31–34. [Google Scholar]
  22. Sun, Q.; Zhang, X.H. Evaluation of Land Sustainable Utilization Based on Analytic Hierarchy Process in Henan Province. Guizhou Agric. Sci. 2012, 40, 224–230. [Google Scholar]
  23. Zou, F.; Yan, X.G.; Liu, S.; Chen, Y.L. Comprehensive Evaluation on Sustainable Utilization of Land Resource in Zhangjiajie. J. Jishou Univ. (Nat. Sci. Edit.) 2015, 36, 64–70. [Google Scholar]
  24. Yang, Z.S.; Liu, Y.S.; He, Y.M.; Tao, W.X.; Xu, J.J. The Principles and Methods of Eco-friendliness Evaluation of Land Use in Mountainous Areas at County Level and Its Case Study. J. Nat. Resour. 2008, 23, 600–611. [Google Scholar]
  25. Wang, G. Evaluation of Sustainable Land Use—A Case Study of Tianjin City. China Real Estate 2016, 23, 21–31. [Google Scholar]
  26. Su, C.C.; Zhou, A.; Pan, Y.C.; Wang, A.L. Evaluation of Sustainable Land Use Based on Principal Component Analysis in Longkou City. Chin. J. Agric. Res. Region. Plan. 2018, 39, 96–103. [Google Scholar]
  27. Huang, P. Evaluation of sustainable land use in A-Ba prefecture based on comprehensive evaluation model. Chin. Contemp. Econ. 2018, 25, 89–91. [Google Scholar]
  28. Zhao, X.; Ye, J.P.; Xue, S. Evaluation of Urban Land Sustainable Use in Hu’nan Province based on Improved Grey Relational Analysis. Bull. Soil Water Conser. 2013, 33, 265–269+234. [Google Scholar]
  29. Han, J.H.; Zhao, W.J.; Yang, T.T.; Wang, S.B. Evaluation of Sustainable Land Use and Diagnosis of Obstacle Factors in Agro-Pastroral Zone of Northeast China Based on improved TOPSIS Meshod. Res. Soil Water Conser. 2018, 25, 279–284. [Google Scholar]
  30. Jiao, S.T.; Wang, P.; Chen, J.X. Sustainable Utilization of land Resources in the Ethnic Areas of Inter-Provincial Boundary of Yunnan, Guizhou and Guangxi: From the Perspectives of Regional Evaluation and Spatial Division. Econ. Geogr. 2019, 39, 175–184. [Google Scholar]
  31. Pieri, C.; Dumanski, J.; Hamblin, A.; Young, A. Land quality indicators. World Bank Discussion Paper 315. Gener. Infor. 1995, 3, 37–75. [Google Scholar]
  32. Dumanski, J.; Gameda, S.; Pieri, C. Indicators of Land Quality and Sustainable Land Management: An Annotated Bibliography, 1st ed.; World Bank: Washington, DC, USA, 1998. [Google Scholar]
  33. Dumanski, J.; Pieri, C. Land quality indicators: Research plan. Agric. Ecosyst. Environ. 2000, 81, 93–102. [Google Scholar] [CrossRef]
  34. He, R.H.; Zhao, M.; Yu, Y.J.; Tan, X.K. Evaluation of land sustainable use and diagnosis of obstacle factors—Taking Hefei as an example. J. Fujian Agric. Forest. Univ. (Philo. Soc. Sci.) 2020, 23, 47–54. [Google Scholar]
  35. Wang, Q.; He, R.Z. Health Evaluation of Sustainable Land use in Zhengzhou City. Forest. Inven. Plan. 2021, 46, 7–14. [Google Scholar]
  36. Wang, H.D.; Yang, X.H.; Wang, L.L.; Peng, M.L.; Li, W.Y. Application on Comparison between Entropy Evaluation Method and Principal Component Analysis in Evaluation of Sustainable Land Use in Guiyang. Guizhou Agric. Sci. 2015, 43, 251–255. [Google Scholar]
  37. Wang, Y.; Huang, Y.Z.; Guan, Y.L. Evaluation of sustainable land use in ecologically fragile ethnic areas: A case study of Lushui City, Yunnan Province. Jiangsu Agric. Sci. 2021, 49, 226–233. [Google Scholar]
  38. Niu, W.; Shi, J.; Xu, Z.; Wang, T.; Zhang, H.; Su, X. Evaluating the Sustainable Land Use in Ecologically Fragile Regions: A Case Study of the Yellow River Basin in China. Int. J. Environ. Res. Public Health 2022, 19, 3222. [Google Scholar] [CrossRef] [PubMed]
  39. Yu, D.F. A brief discussion on the object and content of mountain science. J. Mt. Sci. 1998, 16, 69–72. [Google Scholar]
  40. Zhong, X.H. Promote the construction of mountain science and push forward the sustainable development of mountain areas. J. Mountain Sci. 1999, 17, 1–2. [Google Scholar]
  41. Yang, R.Y.; Du, W.Y.; Yang, Z.S. Spatiotemporal Evolution and Influencing Factors of Urban Land Ecological Security in Yunnan Province. Sustainability 2021, 13, 2936. [Google Scholar] [CrossRef]
  42. Yang, R.Y.; Zhong, C.B.; Yang, Z.S.; Wu, Q.J. Analysis on the Effect of the Targeted Poverty Alleviation Policy on Narrowing the Urban-Rural Income Gap: An Empirical Test Based on 124 Counties in Yunnan Province. Sustainability 2022, 14, 12560. [Google Scholar] [CrossRef]
  43. Li, J.L.; Hou, B. Sustainable Land Use Evaluation of Mountain Area of North Guangdong Based on the Raster Spatial Data. Bull. Survey Map 2008, 54, 40–43. [Google Scholar]
  44. Yunnan Provincial Bureau of Statistics. Yunnan Statistical Yearbook 2021, 1st ed.; China Statistics Press: Beijing, China, 2021. [Google Scholar]
  45. National Bureau of Statistics. China Statistical Yearbook 2021, 1st ed.; China Statistics Press: Beijing, China, 2021.
  46. Yang, Z.S.; Zhao, Q.G.; Xin, L. Yunnan Land Resources, 1st ed.; Science and Technology of China Press: Beijing, China, 2014. [Google Scholar]
  47. Office of Yunnan Provincial Agricultural Zoning Commission. Land Area of Different Climatic Zones and Slopes in Yunnan Province, 1st ed.; Yunnan Science and Technology Press: Kunming, China, 1987. [Google Scholar]
  48. Wang, W.F. Yunnan Soil, 1st ed.; Yunnan Science and Technology Press: Yunnan, China, 1995. [Google Scholar]
  49. Yunnan Vegetation Compilation Group. Yunnan Vegetation, 1st ed.; Science Press: Beijing, China, 1987. [Google Scholar]
  50. General Office of the People’s Government of Yunnan Province. The 14th Five-Year Plan for Comprehensive Disaster Prevention, Reduction and Relief in Yunnan Province. Available online: http://www.yn.gov.cn/zwgk/zcwj/zxwj/202204/t20220406_240190.html (accessed on 6 April 2022).
  51. National Bureau of Statistics. China Statistical Yearbook (2008–2020), 1st ed.; China Statistics Press: Beijing, China, 2008–2020.
  52. Department of Natural Resources of Yunnan Province. The 14th Five-Year Plan for the Prevention and Control of Geological Disasters in Yunnan Province (2021–2025). Available online: http://dnr.yn.gov.cn/html/2022-8/102349_1.html (accessed on 30 August 2022).
  53. Xu, X.L.; Liu, J.Y.; Zhang, S.W.; Li, R.D.; Yan, C.Z.; Wu, S.X. Multi-period land use and land cover monitoring data set in China (CNLUCC). In Resource and Environment Science Registration and Publication System; Institute of Geographic Sciences and Natural Resources Research, Chinese Academy of Sciences: Beijing, China, 2018; Available online: http://www.resdc.cn/DOI (accessed on 8 February 2022).
  54. Liu, J.Y.; Liu, M.L.; Deng, X.Z.; Zhuang, D.F.; Zhang, Z.X.; Luo, D. The land use and land cover change database and its relative studies in China. J. Geograph. Sci. 2002, 12, 275–282. [Google Scholar]
  55. Liu, J.Y.; Liu, M.L.; Zhuang, D.F.; Zhang, Z.X.; Deng, X.Z. Study on spatial pattern of land-use change in China during 1995–2000. Sci. China (Ser. D) 2003, 46, 373–384. [Google Scholar]
  56. Liu, J.Y.; Kuang, W.H.; Zhuang, Z.X.; Xu, X.L.; Qin, Y.W.; Ning, J.; Zhou, W.C.; Zhang, S.W.; Li, R.D.; Yan, C.Z.; et al. Spatiaotemporal characteristics, patterns and causes of land-use changes in China since the late 1980s. J. Geograph. Sci. 2014, 24, 195–210. [Google Scholar] [CrossRef]
  57. Kuang, W.H.; Zhang, S.W.; Du, G.M.; Yan, C.Z.; Wu, S.X.; Li, R.D.; Lu, D.S.; Pan, T.; Ning, J.; Guo, C.Q.; et al. Remotely sensed mapping and analysis of spatio-temporal patterns of land use change across China in 2015–2020. Acta Geograph. Sin. 2022, 77, 1056–1071. [Google Scholar]
  58. Zhang, F.R.; Wang, J.; Chen, B.M. Evaluation Index System and Method of Sustainable Land Use, 1st ed.; China Agricultural Press: Beijing, China, 2003. [Google Scholar]
  59. Ministry of Environmental Protection of the People’s Republic of China. Industry Standards for Environment Protection HJ 192–2006, 1st ed.; China Environmental Science Press: Beijing, China, 2006. [Google Scholar]
  60. Department of Environmental Protection of the People’s Republic of China. National Environmental Protection Standard HJ 192–2015: Technical Criterion for Ecosystem Status Evaluation, 1st ed.; China Environmental Science Press: Beijing, China, 2015. [Google Scholar]
  61. Xie, G.D.; Lu, C.X.; Leng, Y.F.; Zheng, D.; Li, S.C. Ecological assets valuation of the Tibetan Plateau. J. Nat. Resour. 2003, 18, 189–196. [Google Scholar]
  62. Yang, Z.S. Study on Land Use Changes and Its Ecological Effects in Different Landform Areas in Yunnan Province Driven by China’s Project of Converting Farmland to Forest, 1st ed.; China Science and Technology Press: Beijing, China, 2011. [Google Scholar]
  63. Yang, Z.S.; Yang, R.Y.; Liu, F.L. Spatio-temporal evolution and influencing factors of urban-rural income gap in Yunnan Province based on poverty classification. Geograph. Res. 2021, 40, 2252–2271. [Google Scholar]
  64. Office of the Leading Group of the Third National Land Survey of Yunnan Province, Department of Natural Resources of Yunnan Province, Statistics Bureau of Yunnan Province. Main Data Bulletin of the Third National Land Survey of Yunnan Province. Yunnan Daily, 22 December 2021; 8.
  65. Master Plan of Major Projects for Protection and Restoration of Important Ecosystems in Yunnan Province (2021–2035). Available online: http://lcj.yn.gov.cn/html/2021/fazhanguihua_1202/64715.html (accessed on 2 December 2021).
  66. Xu, K.; Yang, Z.S. Research on the Value of Land Ecological Service in Yunnan Province Based on the Perspective of Spatial Pattern. Sustainability 2022, 14, 10805. [Google Scholar] [CrossRef]
  67. Yang, R.Y.; Zhong, C.B.; Yang, Z.S.; Liu, F.L.; Peng, H.Y. Analysis on poverty influencing factors in deep poverty county of Karst Rocky-desertified Area in Southwest China. World Reg. Stud. 2022, 31, 1298–1309. [Google Scholar]
  68. Jonathan, A.F.; Ruth, D.; Gregory, P.A.; Carol, A.; Gordon, B.; Stephen, R.C.; Stuart, F.H.; Michael, T.C.; Gretchen, C.D.; Holly, K.G.; et al. Global consequences of land use. Science 2005, 309, 570–574. [Google Scholar]
  69. Meyfroidt, P.; de Bremond, A.; Ryan, C.M.; Archer, E.; Aspinall, R.; Chhabra, A.; Camara, G.; Corbera, E.; DeFries, R.; Díaz, S.; et al. Ten facts about land systems for sustainability. Proc. Natl. Acad. Sci. USA 2022, 119, e2109217118. [Google Scholar] [CrossRef]
  70. Lambin, E.F.; Baulies, X.; Bockstael, N. Land-Use and Land-Cover Change: Implementation Strategy, 1st ed.; Scientific Steering Committee and International Project Office of LUCC: Stockhdm, Sweden; Bonn, Germany, 1999. [Google Scholar]
  71. IGBP. Science Plan and Implementation Strategy, 1st ed.; IGBP Secretariat: Stockholm, Sweden, 2005. [Google Scholar]
  72. Liu, J.Y.; Zhang, Z.X.; Zhang, S.W.; Yan, C.Z.; Wu, S.X.; Li, R.D.; Kuang, W.H.; Shi, W.J.; Huang, L.; Ning, J.; et al. Innovation and development of remote sensing- based land use change studies based on Shupeng Chen’s academic thoughts. J. Geo-Inform. Sci. 2020, 22, 680–687. [Google Scholar]
  73. Lu, Y.G.; Cai, Y.L.; Xu, Y.Q. Towards land change science: The progress of LUCC. China Land Sci. 2006, 20, 55–61. [Google Scholar]
  74. TurnerII, B.L.; Munroe, D.K. Land change science/land system science. In International Encyclopedia of Human Geography, 2nd ed.; Kobayashi, A., Ed.; Elsevier: Amsterdam, The Netherlands, 2020; pp. 87–92. [Google Scholar]
  75. Verburg, P.H.; Crossman, N.; Ellis, E.C.; Heinimann, A.; Hostert, P.; Mertz, O.; Nagendra, H.; Sikor, T.; Erb, K.; Golubiewski, N.; et al. Land system science and sustainable development of the earth system: A global land project perspective. Anthropocene 2015, 12, 29–41. [Google Scholar] [CrossRef] [Green Version]
  76. Nielsen, J.O.; de Bremond, A.; Chowdhury, R.R.; Friis, C.; Metternicht, G.; Meyfroidt, P.; Munroe, D.; Pascual, U.; Thomson, A. Toward a normative land systems science. Curr. Opin. Environ. Sustain. 2019, 38, 1–6. [Google Scholar] [CrossRef]
Figure 1. Geographic Position of Research Area.
Land 11 01957 g001
Figure 2. LUCC in 2000, 2010 and 2020.
Land 11 01957 g002
Figure 3. Ecological friendliness evaluation of land use from 2000 to 2020.
Land 11 01957 g003
Figure 4. Economic viability evaluation of land use from 2000 to 2020.
Land 11 01957 g004
Figure 5. Social acceptability evaluation of land use from 2000 to 2020.
Land 11 01957 g005
Figure 6. Overall sustainability evaluation of land use from 2000 to 2020.
Land 11 01957 g006
Table 1. The classified area of land use in 2000, 2010 and 2020.
First Class Land Use TypeSecond Class Land Use TypeLand Use Classified Area
(Unit: 10,000 hectares)
NumberNameNumberNameIn 2000In 2010In 2020
1Cultivated Land 551.08545.96539.56
11Paddy Field135.91134.53131.39
12Dryland415.17411.43408.17
2Woodland 1998.192224.102418.67
21Closed Forest Land1414.581724.811884.72
22Other Forest Land583.61499.29533.95
3Grassland 481.25325.65181.12
31Pasture with High Coverage307.02195.20105.36
32Pasture with Medium and Low Coverage174.23130.4675.76
4Waters 49.3453.2856.09
41Rivers and Lakes31.7831.4731.18
42Reservoir and Pond17.5621.8124.91
5Construction land 66.7286.73129.69
51Urban Construction Land, Rural Settlement Area and Land for Mining and Industry54.8474.86109.17
52Other Building Land11.8811.8720.52
6Unused land 695.85606.71517.30
61Bare land96.1392.9580.62
62Other Land Types599.72513.76436.68
Table 2. Evaluation index system, calculation method, data acquisition method and evaluation standard of LUSE in Yunnan.
Indicator CategoryEvaluation
Indicators
Element IndicatorCalculation Method and
Illustrate
The Main Method of Data AcquisitionControl Objective (Relative Optimal Value)
1. Ecological friendliness evaluation index1.1 IORLand suitable reclamation rateIOR = 100 − [(Actual land reclamation rate − Land suitable reclamation rate)/Land suitable reclamation rate × 100]Land Survey and Evaluation [1]Actual reclamation rate ≤ suitable reclamation rate (Over–reclaimed Rate = 0)
Actual land reclamation rateLand survey, remote sensing monitoring
1.2 IBLABare land areaIBLA = 100 −(Bare land area/Total land area × 100)Land survey, remote sensing monitoring0
Total land areaLand survey
1.3 IEIEffective irrigated area of cultivated landIEI = Effective irrigated area of cultivated land/Cultivated area × 100Land survey, remote sensing monitoring100%
Cultivated areaLand survey, remote sensing monitoring
1.4 IFCClosed Forest areaIFC = RFC/Highest RFC in the region × 100
Where, RFC (Forest-coverage Rate) = Closed Forest area/Total land area × 100%
Land Remote Sensing Survey (or Forest Census)≥67% (Yunnan province’s 2035 Forest Coverage Planning Target)
Total land areaLand survey
1.5 IBRCIndex of Biological Richness (IBR)IBRC = IBR/Highest IBR in the region × 100
Where, IBR = Abio × (Woodland area × 0.35 + Grassland area × 0.21 + Waters area × 0.28 + Cultivated land area × 0.11 + Construction land area × 0.04 + Unused land area × 0.01)/Total land area; reference value of Abio is 511.2642 [59,60]
Thematic investigations and calculationsConsider the regional context. The relative optimum value was taken as the relative optimum value of the counties with the best ecological protection in the province.
1.6 IESVEcological service value per unit land area (VES)IESV = VES/Highest VES in the region × 100
Where VES is calculated according to Xie Gaodi et al. [61] (2003) and the corresponding estimation method [62]
Thematic investigations and calculationsConsider the regional context. The relative best value of ecological service per unit land area in the county is taken as the relative optimal value.
2. Economic viability evaluation index2.1 ICLPRegional GDP per unit land areaICLP = ln (CLP)/ ln (Highest CLP in the region)
Where CLP (Comprehensive land productivity) = GDP/Total land area. Because the index data of some years and counties are not stable, the calculation formula is treated as a natural logarithm. IALP, IBLP, IFRUA, and IPGDP are also the same, aiming to make each index more stable [63]. When the calculated ICLP value is greater than 100, it takes 100
Socioeconomic StatisticsRegional unit land GDP ≥ national average unit land GDP
National average GDP per unit land areaSocioeconomic Statistics
2.2 IALPOutput value of primary industry per unit of agricultural land in the regionIALP = ln (ALP)/ln (Highest ALP in the region)
Where ALP (Agricultural Land Productivity) = Output value of primary industry/Agricultural land area
Socioeconomic Statistics, Land Remote Sensing SurveyRegional unit agricultural real estate value ≥ national average unit agricultural real estate value
National average output value of primary industry per unit of agricultural landSocioeconomic Statistics, Land Remote Sensing Survey
2.3 IBLPOutput value of secondary and tertiary industries of building land in regional unitsIBLP = ln (BLP)/ln (Highest BLP in the region)
Where BLP (Building Land Productivity) = Output value of secondary and tertiary industries/Building land area
Socioeconomic Statistics, Land Remote Sensing SurveyRegional unit construction real estate value ≥ national average unit construction real estate value
National average unit building land output value of secondary and tertiary industriesSocioeconomic Statistics, Land Remote Sensing Survey
2.4 IFRUAFiscal revenue per unit land areaIFRUA = ln (FRUA)/ln (Highest FRUA in the region)
Where FRUA (Fiscal Revenue per unit Land Area) = Total local financial revenue/Total land area
Socioeconomic StatisticsRegional fiscal revenue per unit land area ≥ national average fiscal revenue per unit land area
National average fiscal revenue per unit land areaSocioeconomic Statistics
2.5 IYGCActual unit yield of grain cropsIYGC = Average annual grain yield per unit area/Crop Potential ProductivityRural Economic StatisticsActual productivity = Potential productivity
Crop Potential ProductivitySpecial Research [1]
2.6 ILURProportion of used land areaILUR = LUR/Highest LUR in the region
Where LUR (Land Use Rate) = Total area of used land/Total land area
Land survey, remote sensing monitoringConsider the regional context. Take the county with the highest degree of land use as the relative optimal value.
3. Social acceptability evaluation index3.1 IPPActual populationIPP = (10-PP)/(10-1) × 100
Where PP (Population Pressure) = Actual population/
PSCL; PSCL = Suitable cultivated area × Proportion of grain sowing × Possible grain yield per unit area/Per capita grain consumption
Socioeconomic StatisticsActual population ≤ land population carrying capacity
Population-Supporting Capacity of Land Resources (PSCL)Special Research [1]
3.2 IPGDPRegional GDP per capitaIPGDP = ln (GDP per capita)/ln (Highest GDP per capita in the region)Socioeconomic StatisticsRegional per capita GDP ≥ national per capita GDP
National GDP per capitaSocioeconomic Statistics
3.3 IDIRPer capita disposable income of regional rural residentsIDIR = Per Capita Disposable Income of Rural Residents/Highest Per Capita Disposable Income of Rural Residents in the regionRural Socioeconomic StatisticsRegional farmers’ per capita net income ≥ national farmers’ per capita net income
National average per capita disposable income of rural residentsRural Socioeconomic Statistics
3.4 IPYGPer capita food productionIPYG = Per capita grain output (kg/person)/500 kg/person × 100Socioeconomic StatisticsPer capita grain output ≥ 400 kg
Per capita food production targetEconomic and Social Planning
Table 3. Weights of indicators at all levels of regional LUSE.
First–LevelWeightSecond–Level IndicatorsWeight
1. DEF0.381.1 IOR0.18
1.2 IBLA0.15
1.3 IEI0.13
1.4 IFC0.20
1.5 IBRC0.18
1.6 IESV0.16
2. DEV0.322.1 ICLP0.22
2.2 IALP0.18
2.3 IBLP0.16
2.4 IFRUA0.15
2.5 IYGC0.12
2.6 ILUR0.17
3. DOS0.303.1 IPP0.18
3.2 IPGDP0.32
3.3 IDIR0.34
3.4 IPYG0.16
Table 4. Grading Standard and Basic Meaning of EFLU.
Level of EFLUDEFMeaning
1. Highly Friendly≥90The DEF is very high. The land development and utilization activities do not cause obvious influence and destruction of the ecological environment, and they can ensure the EFLU.
2. Moderately Friendly75~90The DEF is moderate. Land development and utilization activities have caused a certain degree of influence and destruction of the ecology. By taking general ecological construction and environmental protection measures, the EFLU can be ensured.
3. Lowly Friendly60~75The DEF is low. Land development and utilization activities have caused significant influence and destruction of the ecological environment. Effective ecological construction and environmental protection projects should be made to promote the EFLU.
4. Unfriendly45~60The DEF is low. Land development and utilization activities have caused great influence and destruction of the ecological environment. Strong ecological construction and environmental protection measures are needed to ensure the EFLU.
5. Very Unfriendly<45The DEF is very low, and the unfriendliness is particularly prominent. Land development and utilization activities have caused significant influence and destruction of the ecology. It is essential to fundamentally reverse the land use mode and take major ecological construction and environmental protection measures in order to ensure the EFLU.
Table 5. Grading system and standard for EVLU and SALU.
Economic Viability Grading System and CriteriaSocial Acceptability Grading System and Criteria
Level of EVLUDEVLevel of SALUDSA
1. Highly Viable≥901. Highly Acceptable≥90
2. Moderately Viable75~902. Moderately Acceptable75~90
3. Lowly Viable60~753. Lowly Acceptable60~75
4. Nonviable45~604. Unacceptable45~60
5. Very Nonviable<455. Very Unacceptable<45
Table 6. Grading standard and basic meaning of OSLU.
Level OSLUDOSMeaning
1. Highly sustainable≥90The EFLU, EVLU and SALU are all high, so the overall sustainability is high. The land development and utilization activities have not caused obvious influence and destruction of the ecology, and the economic and social benefits are great.
2. Moderately sustainable75~90The OSLU is medium, and the EFLU, EVLU and SALU have different degrees of deficiencies or defects. Land development and utilization activities have resulted in a certain grade of influence and destruction of the ecology, or economic benefits and social benefits are not high. By taking general measures of ecology and environment, economy or comprehensiveness, it is generally possible to ensure the land use system sustainability.
3. Lowly sustainable60~75The OSLU is low, and there are significant deficiencies or defects in EFLU, EVLU and SALU. Land development and utilization activities have caused significant influence and destruction of the ecology or economy and are of low social benefit. Measures of effective ecology and environment, economy or comprehensiveness are needed.
4. Conditionally sustainable45~60The OSLU is low, and the EFLU, EVLU and SALU are largely inadequate or flawed, or one or two aspects of the 3 aspects are largely flawed. Strong measures of ecology and environment, economy or comprehensiveness can improve the OSLU.
5. Unsustainable<45Low OSLU, major deficiencies in EFLU, EVLU and SALU, or major deficiencies in 1–2 of the 3. It is essential to fundamentally reverse the way of land use and take major measures of ecology and environment, economy or comprehensiveness to greatly improve the OSLU.
Publisher’s Note: MDPI stays neutral with regard to jurisdictional claims in published maps and institutional affiliations.

