
Spatiotemporal Dynamics of Landscape Transformation in Western Balkans’ Metropolitan Areas
 ,
,  , ,
, ,  ,
, 
Abstract
:1. Introduction
- What are the spatio-temporal transformation dynamics among Western Balkan metropolitan areas based on Urban Atlas (UA) evidence?
- What is the degree of LF in metropolitan Tirana, and how does it differ from other WB metropolitan regions, such as Sarajevo and Skopje?
- What are the degree and spatial extent of landscape fragmentation in Tirana today?
- What are the potential causes of why some regions are more or less fragmented than expected?
- What are the recommendations for the better management of landscape transformation and fragmentation to guide effective, sustainable management strategies in metropolitan areas of developing regions such as the WB?
2. Materials and Methods
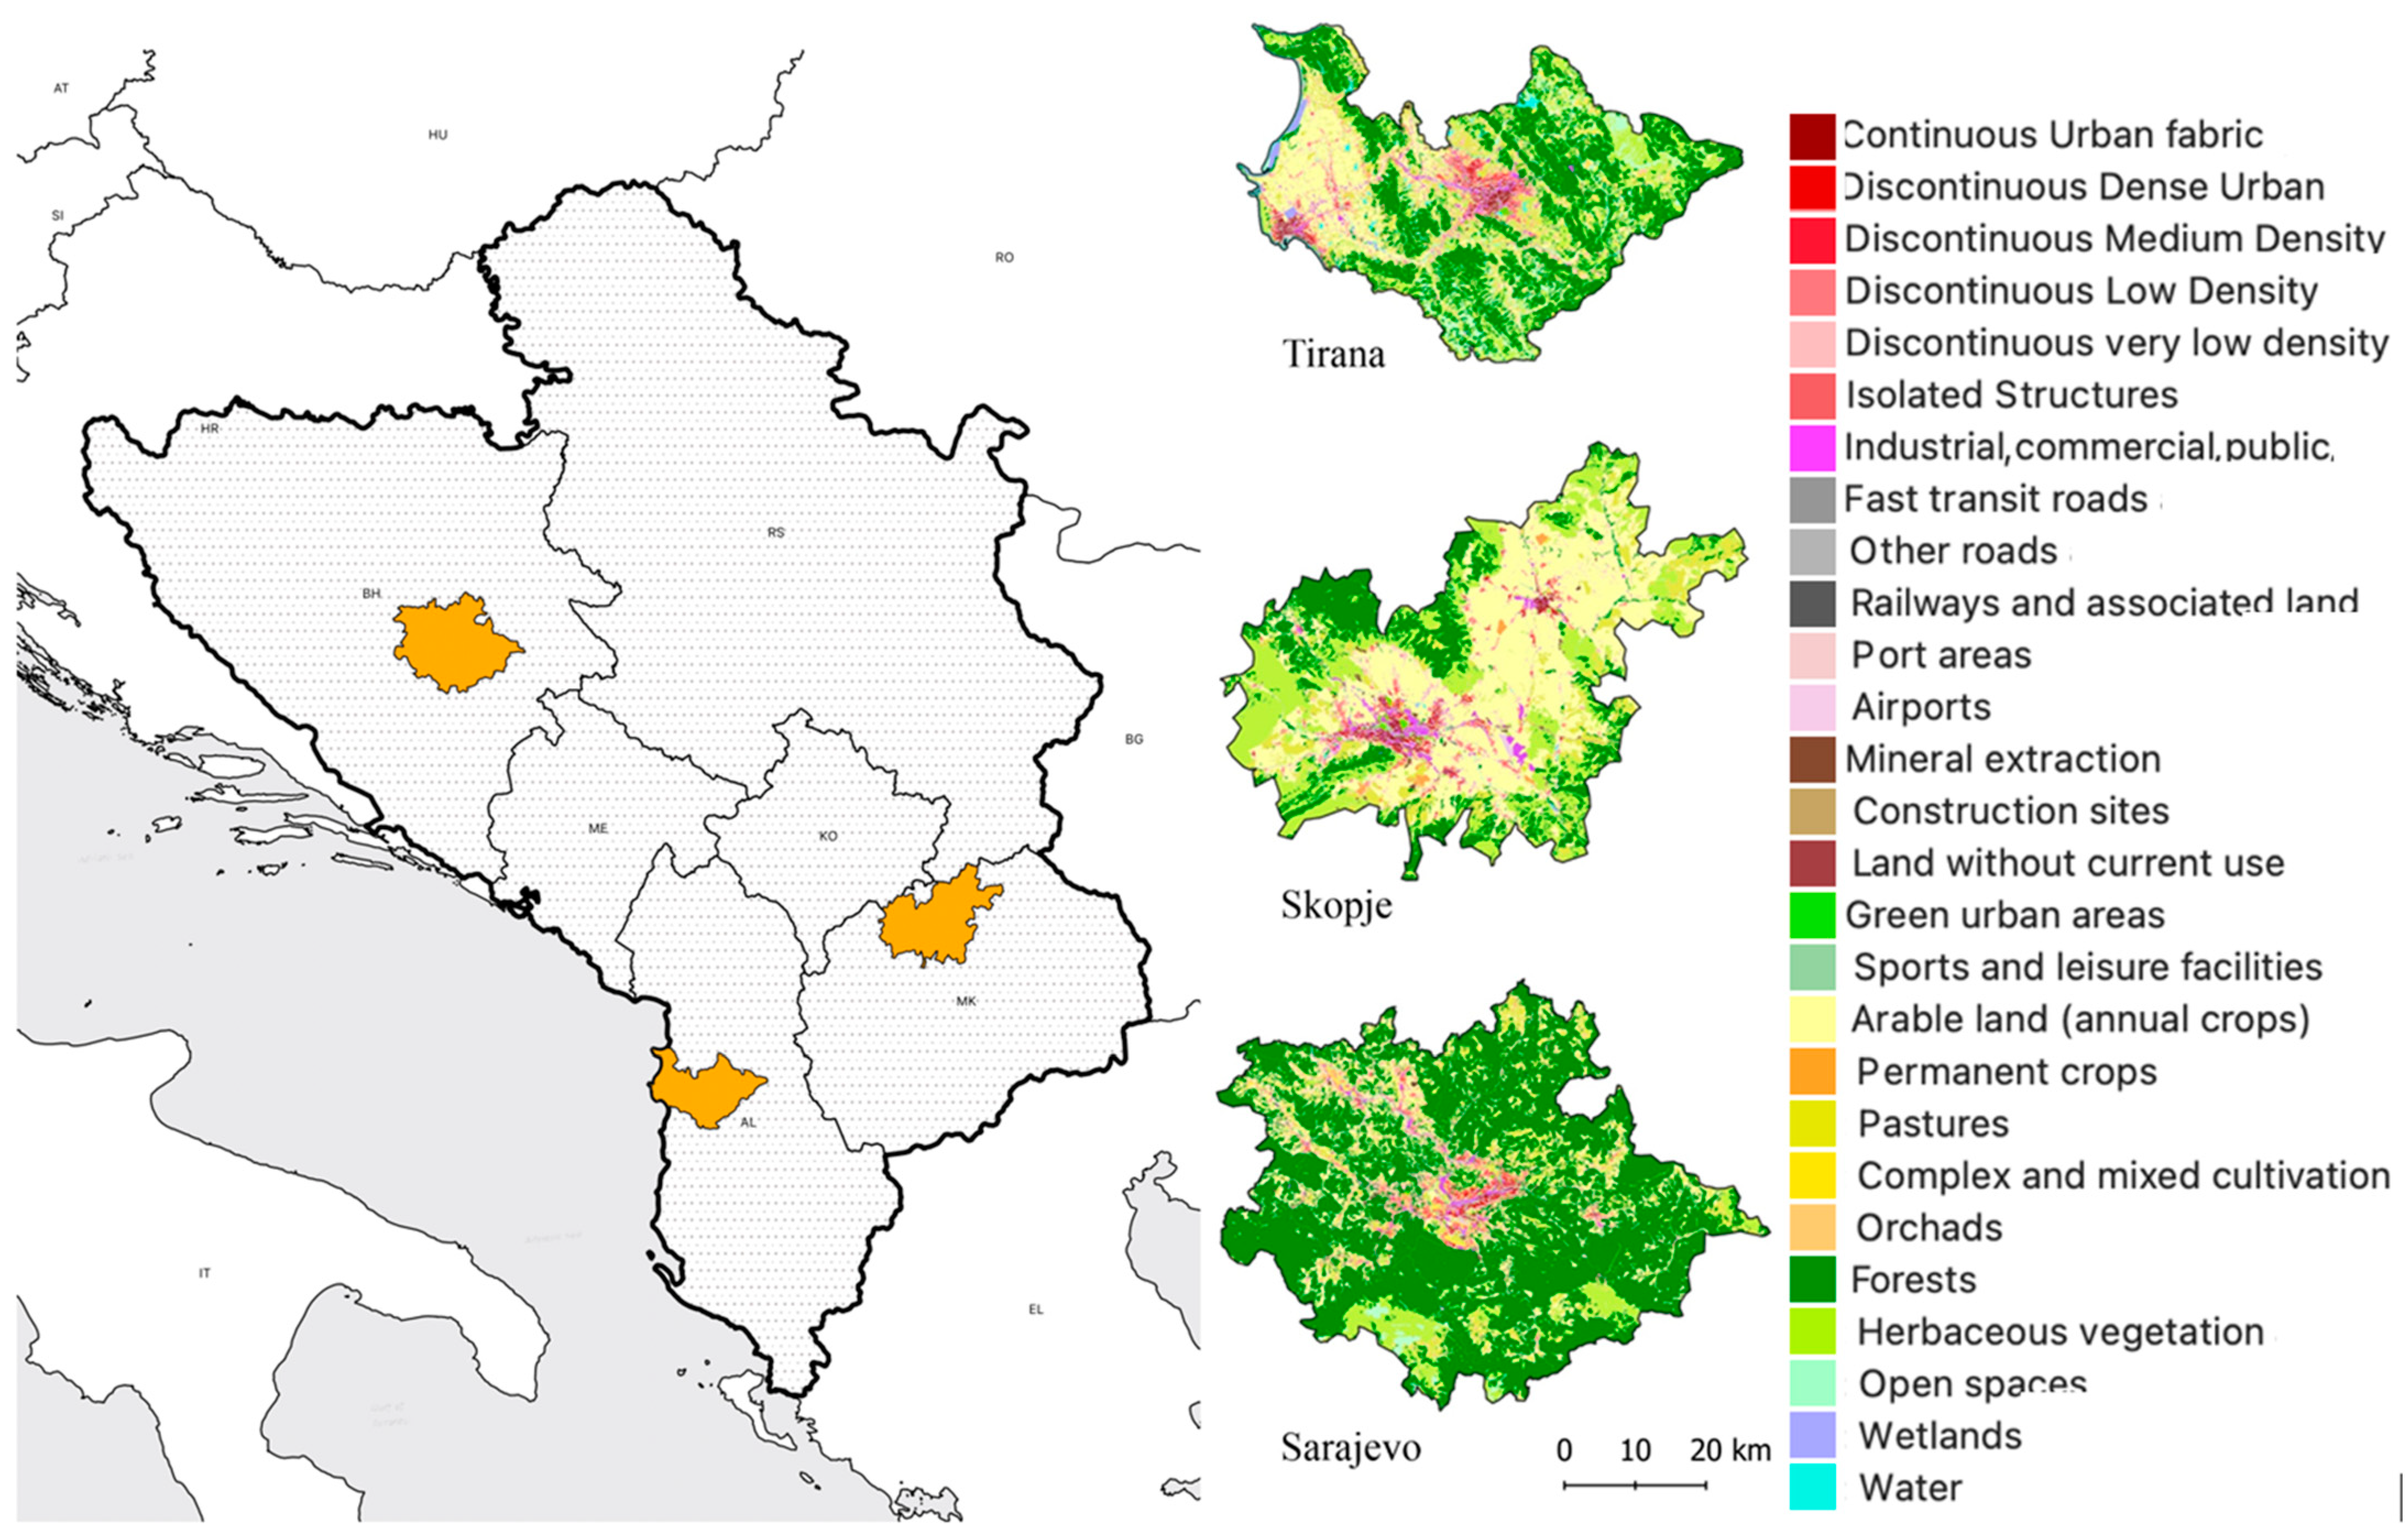
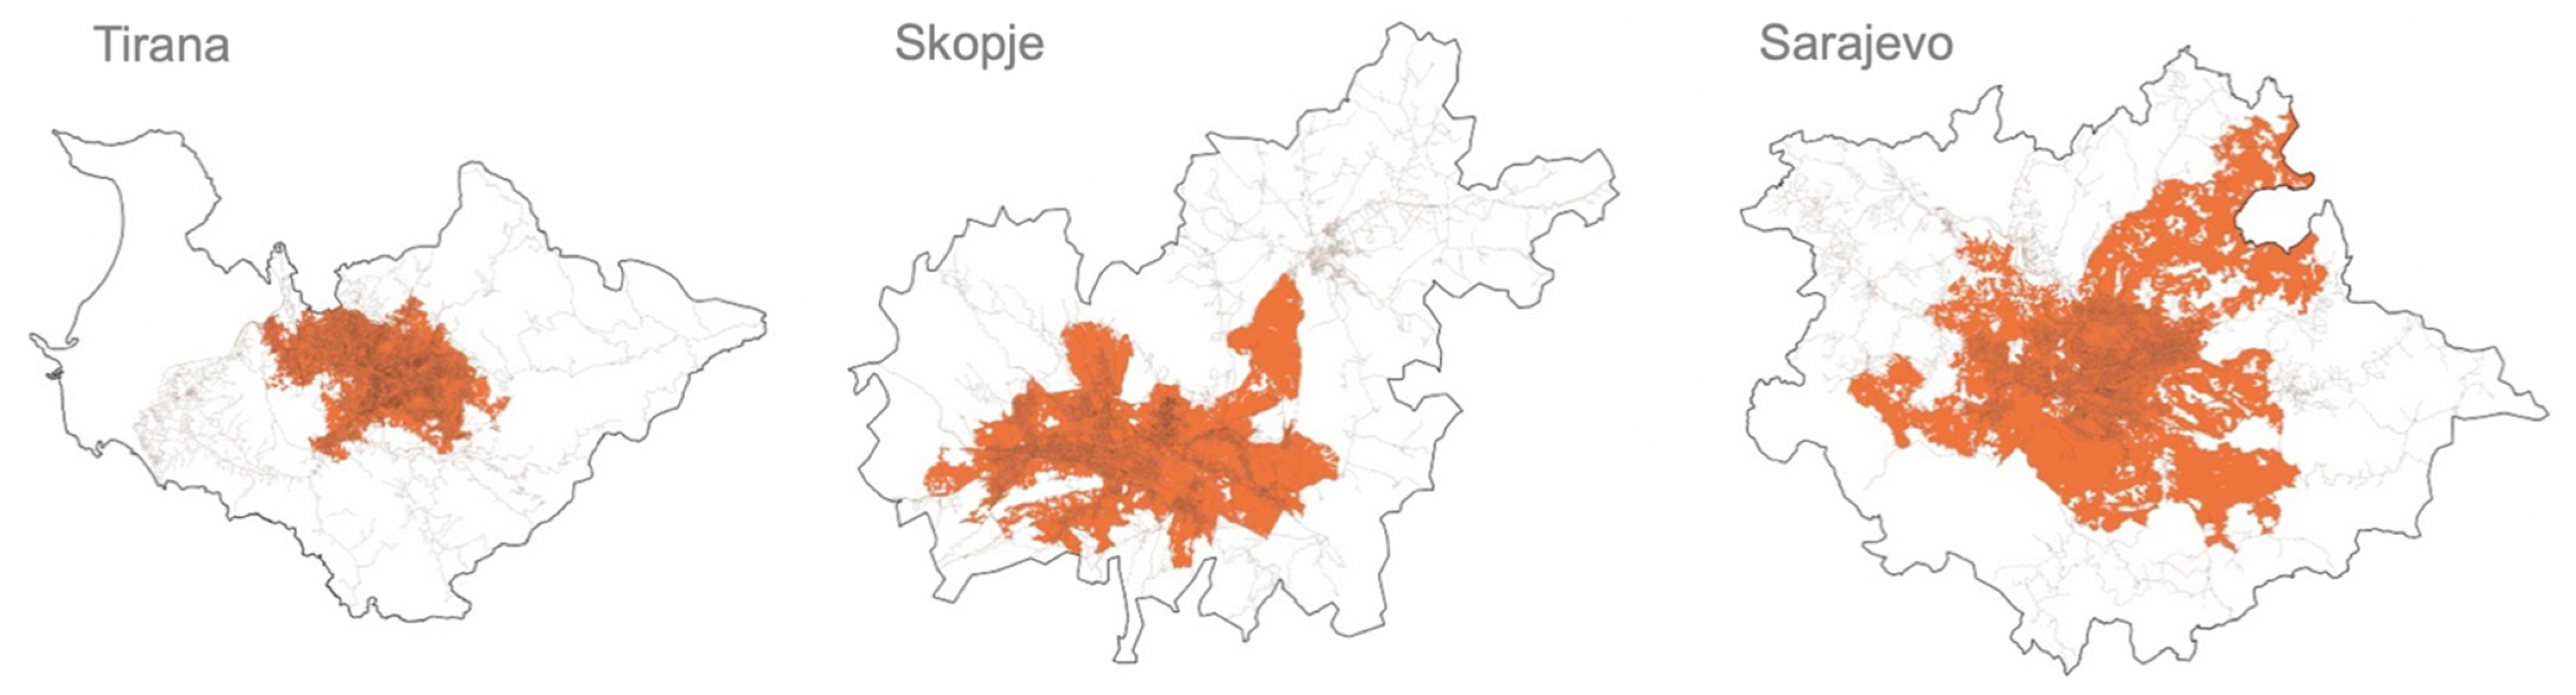
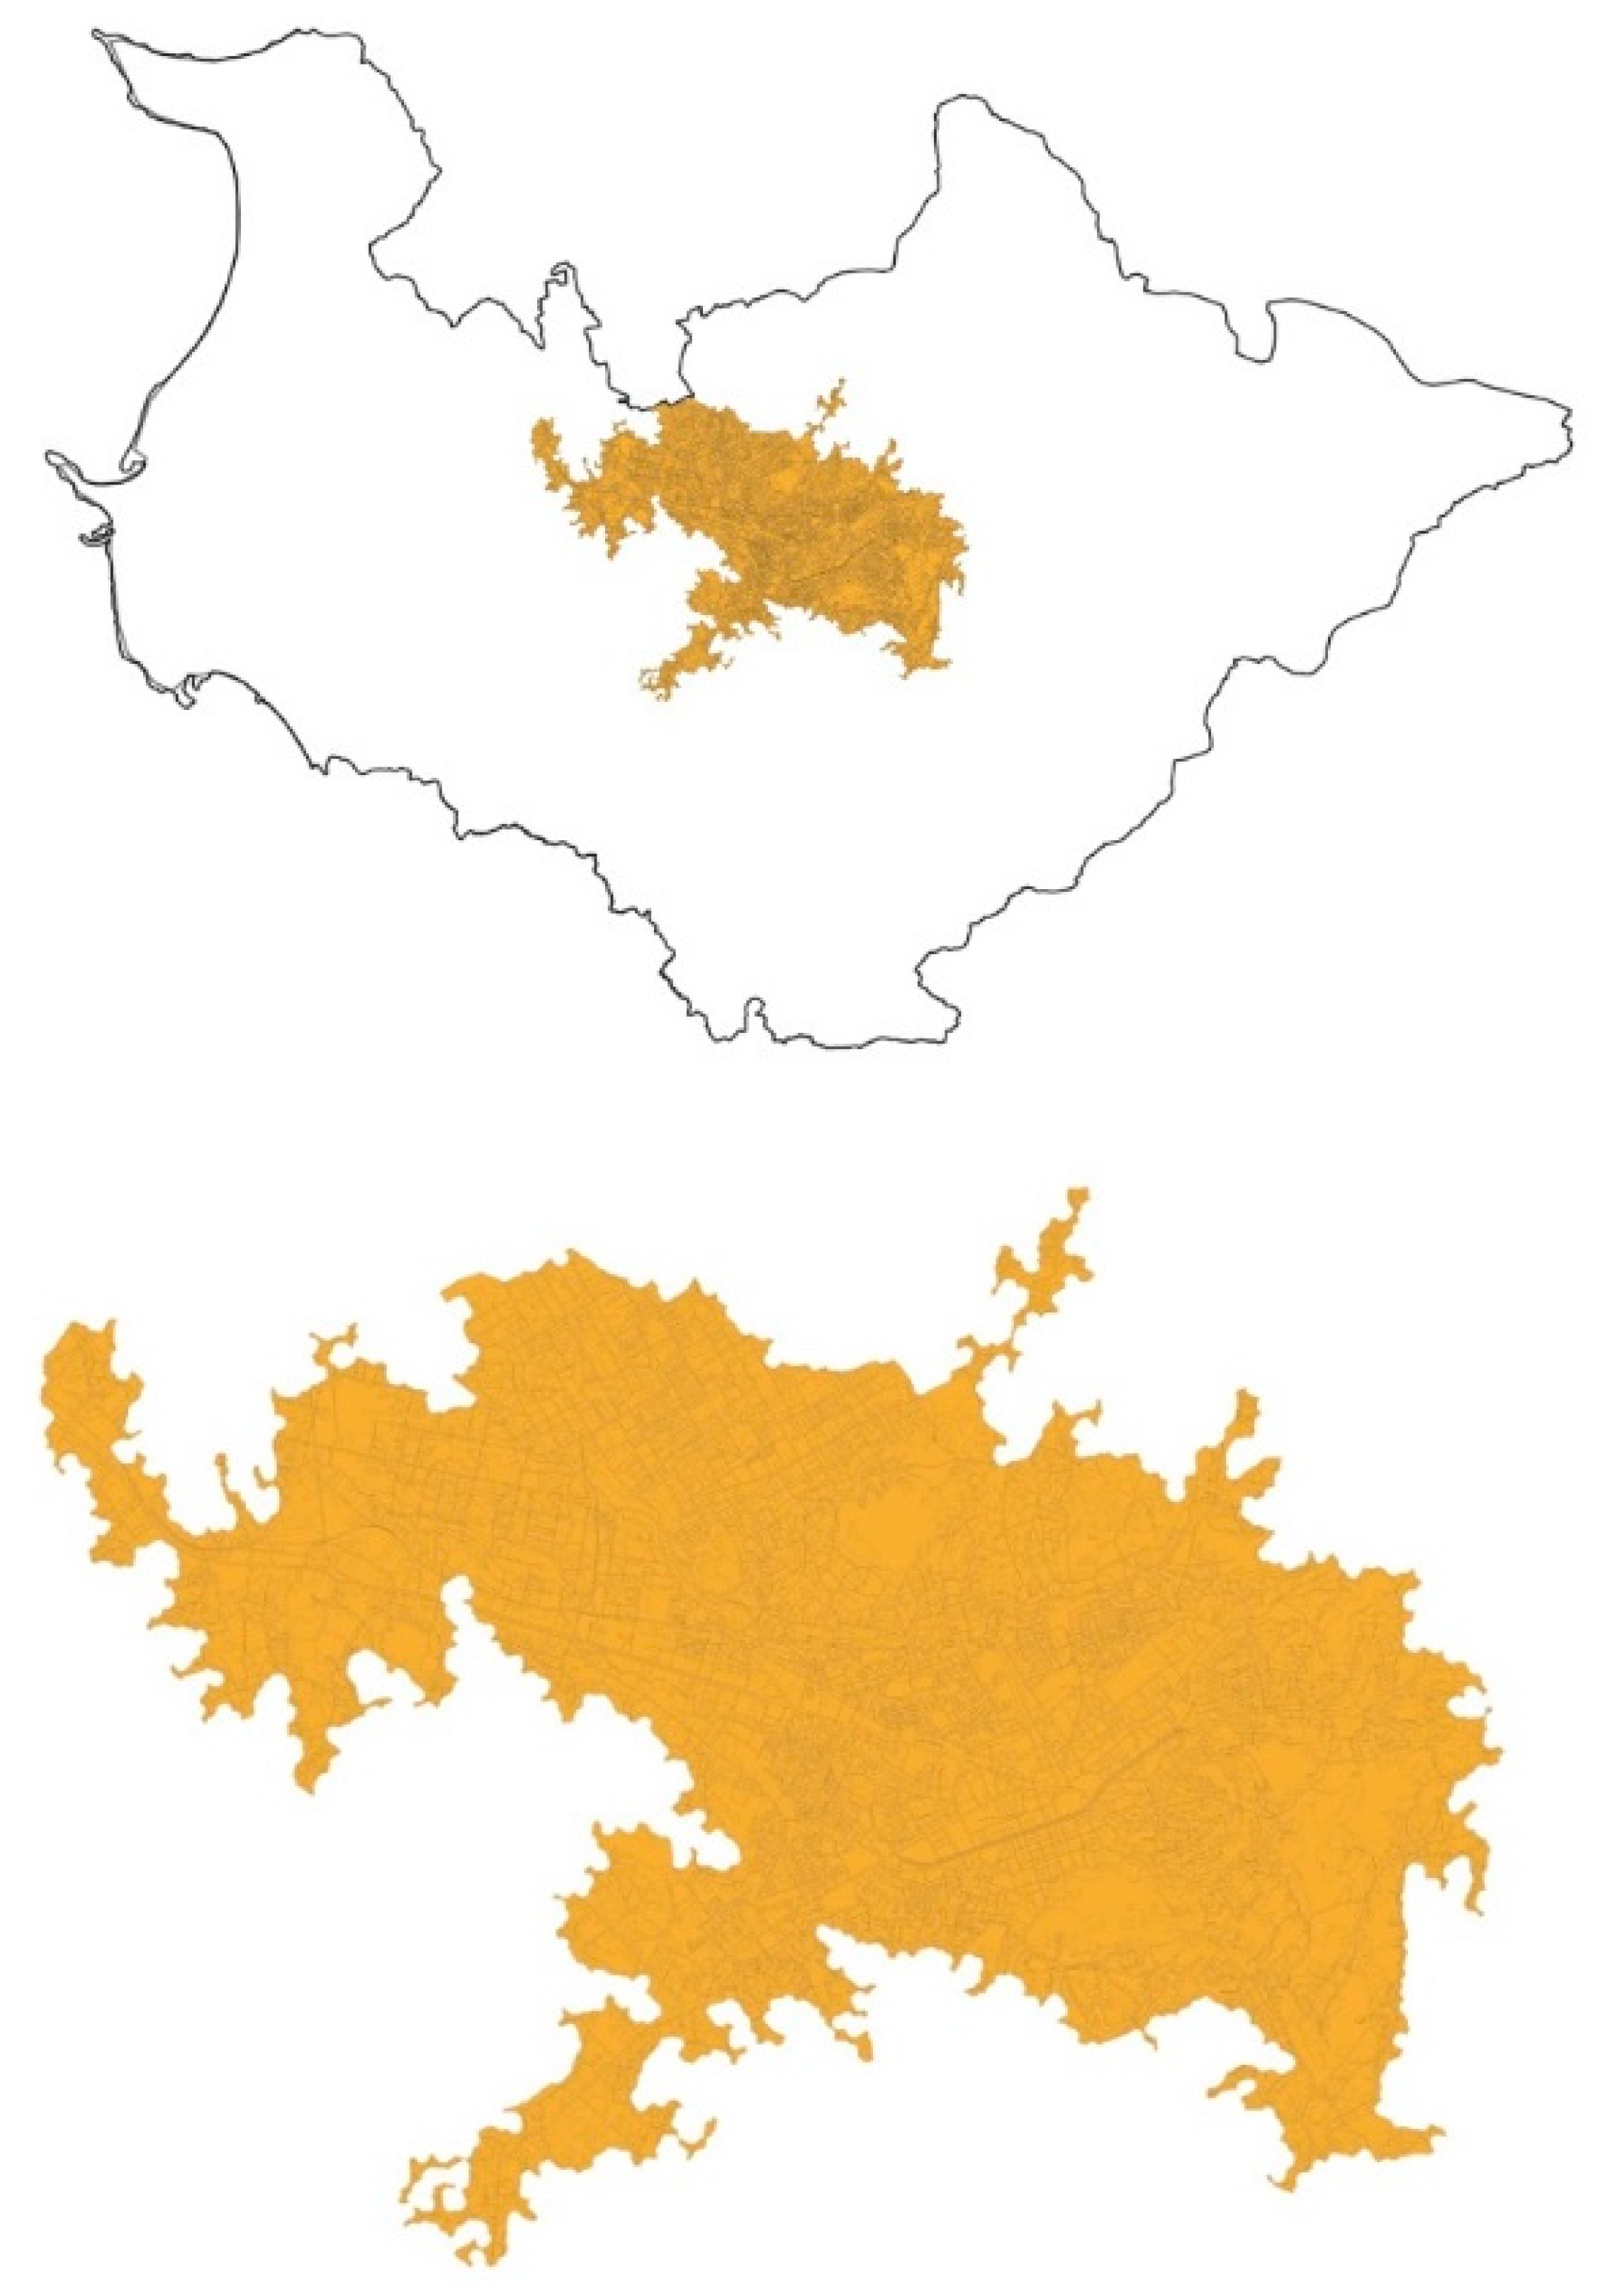
2.1. Study Area
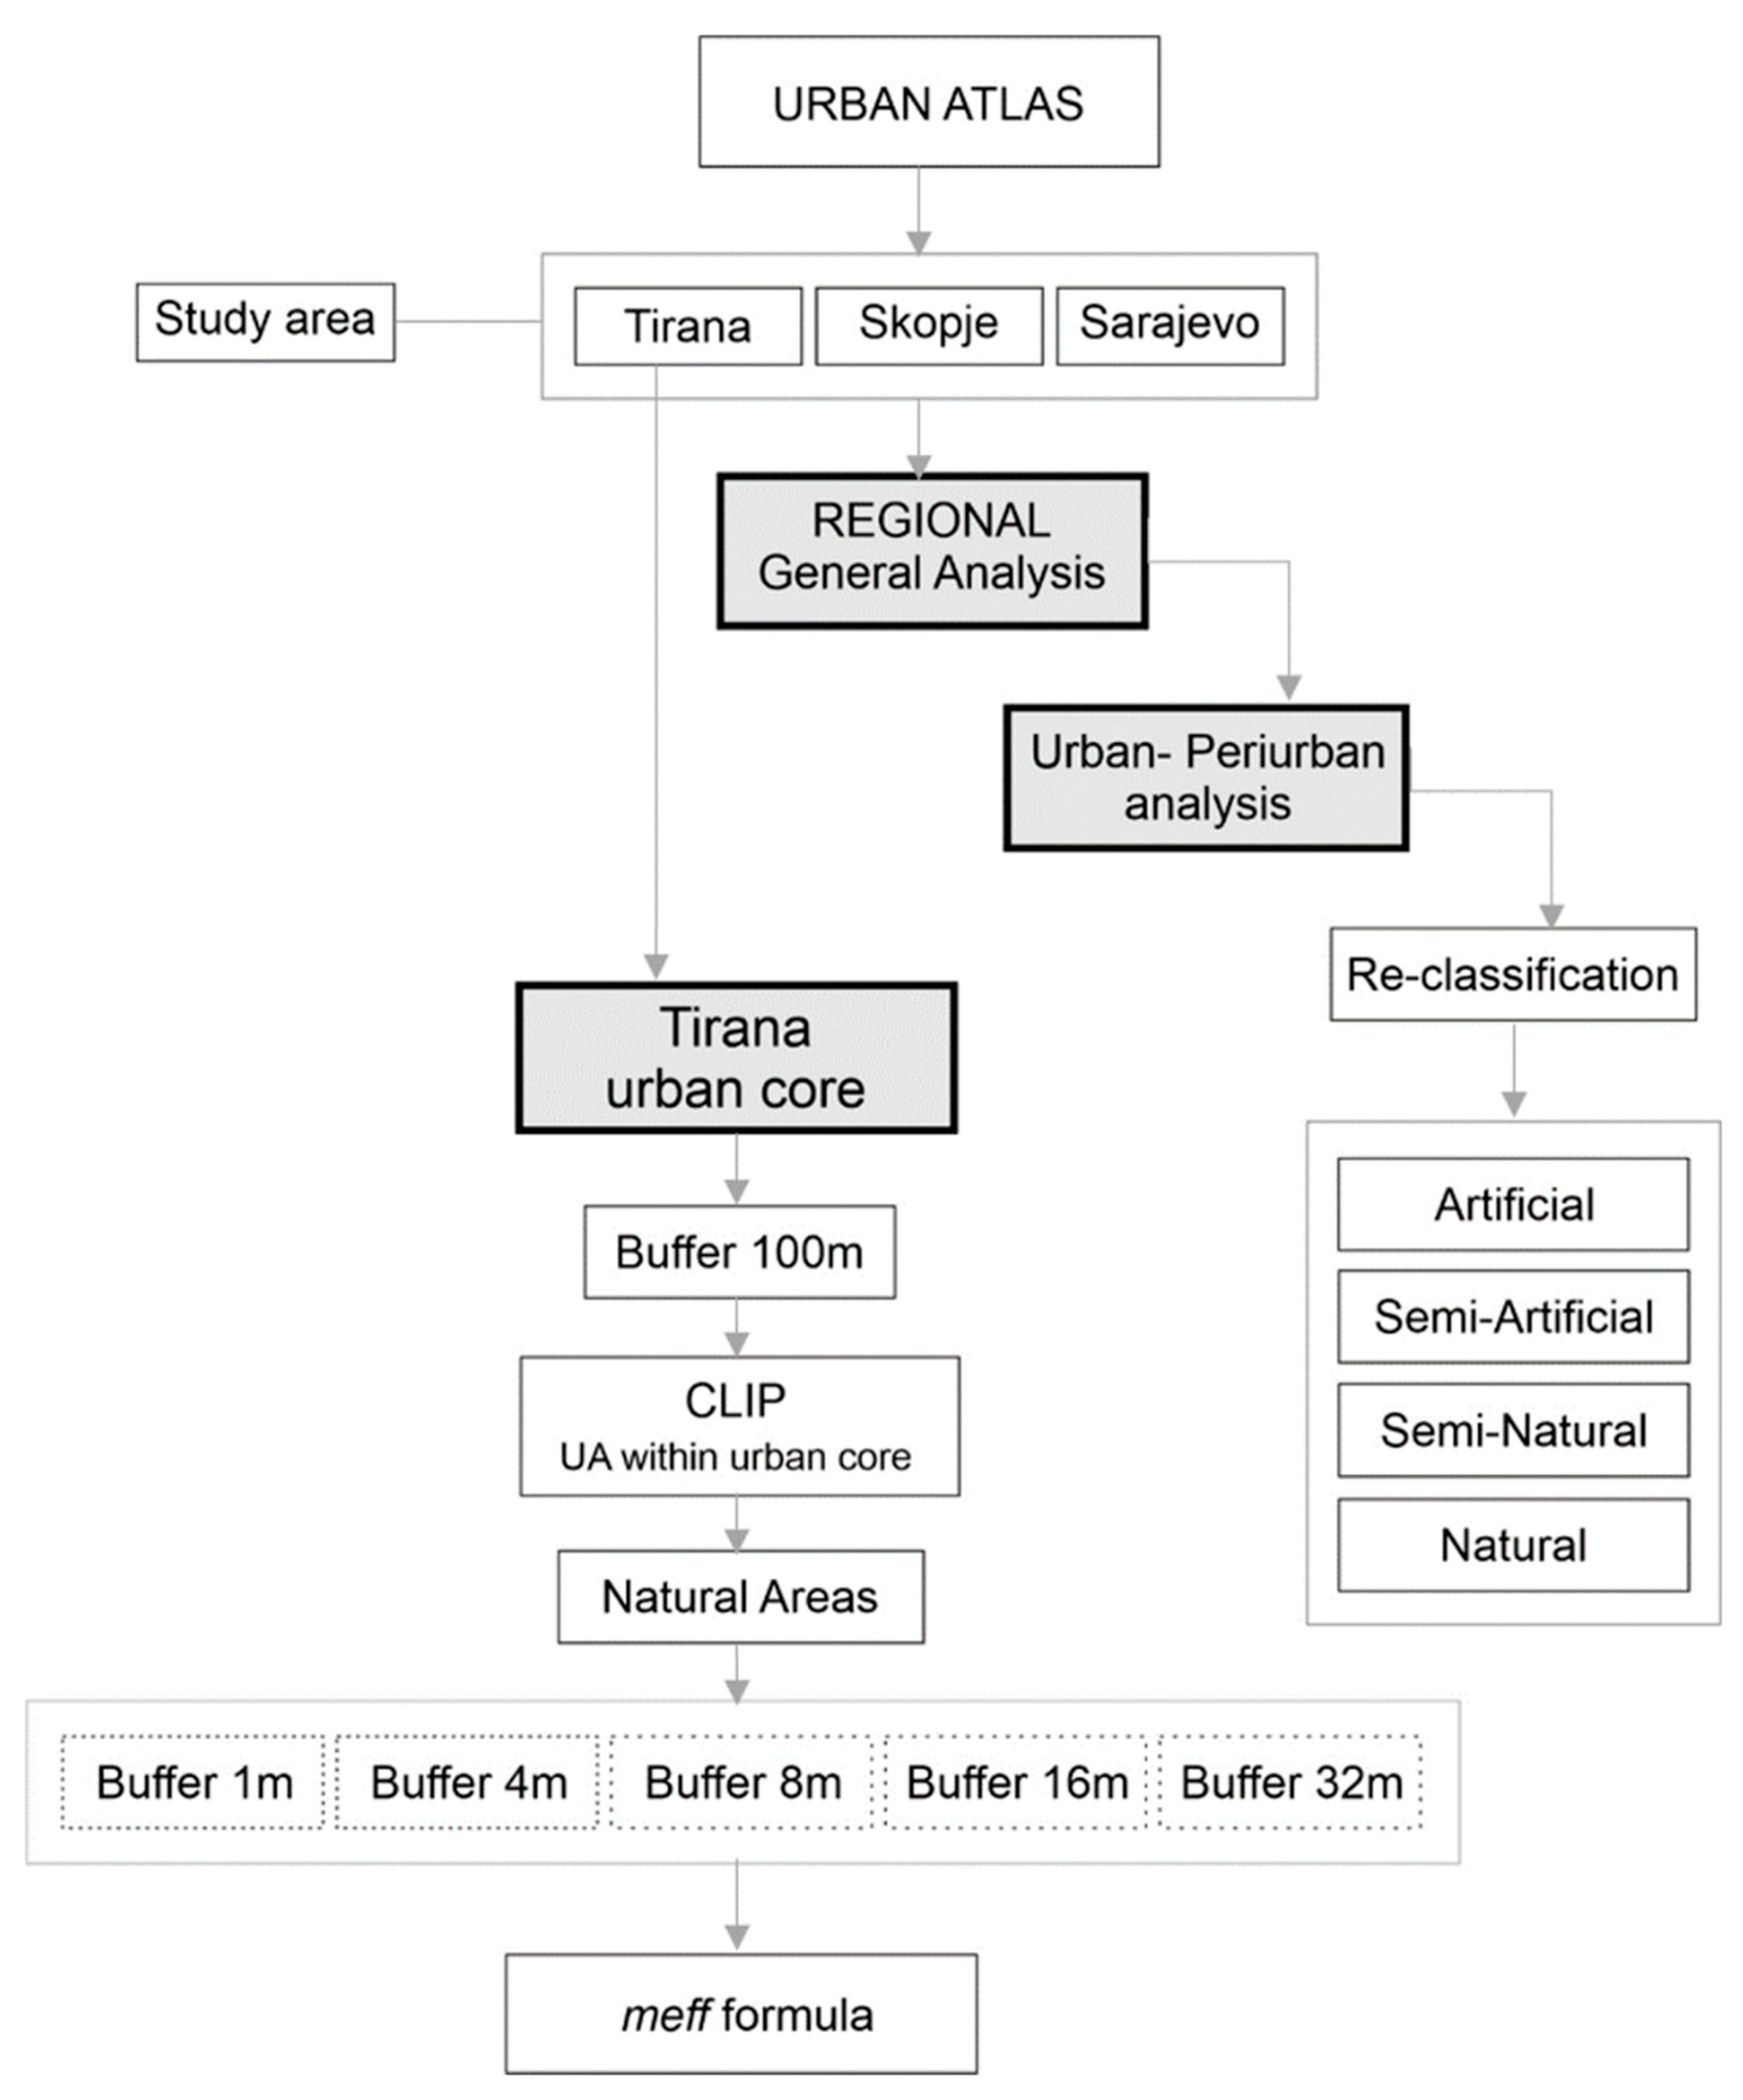
2.2. Method and Workflow of the Study
2.3. Materials of the Study: Urban Atlas
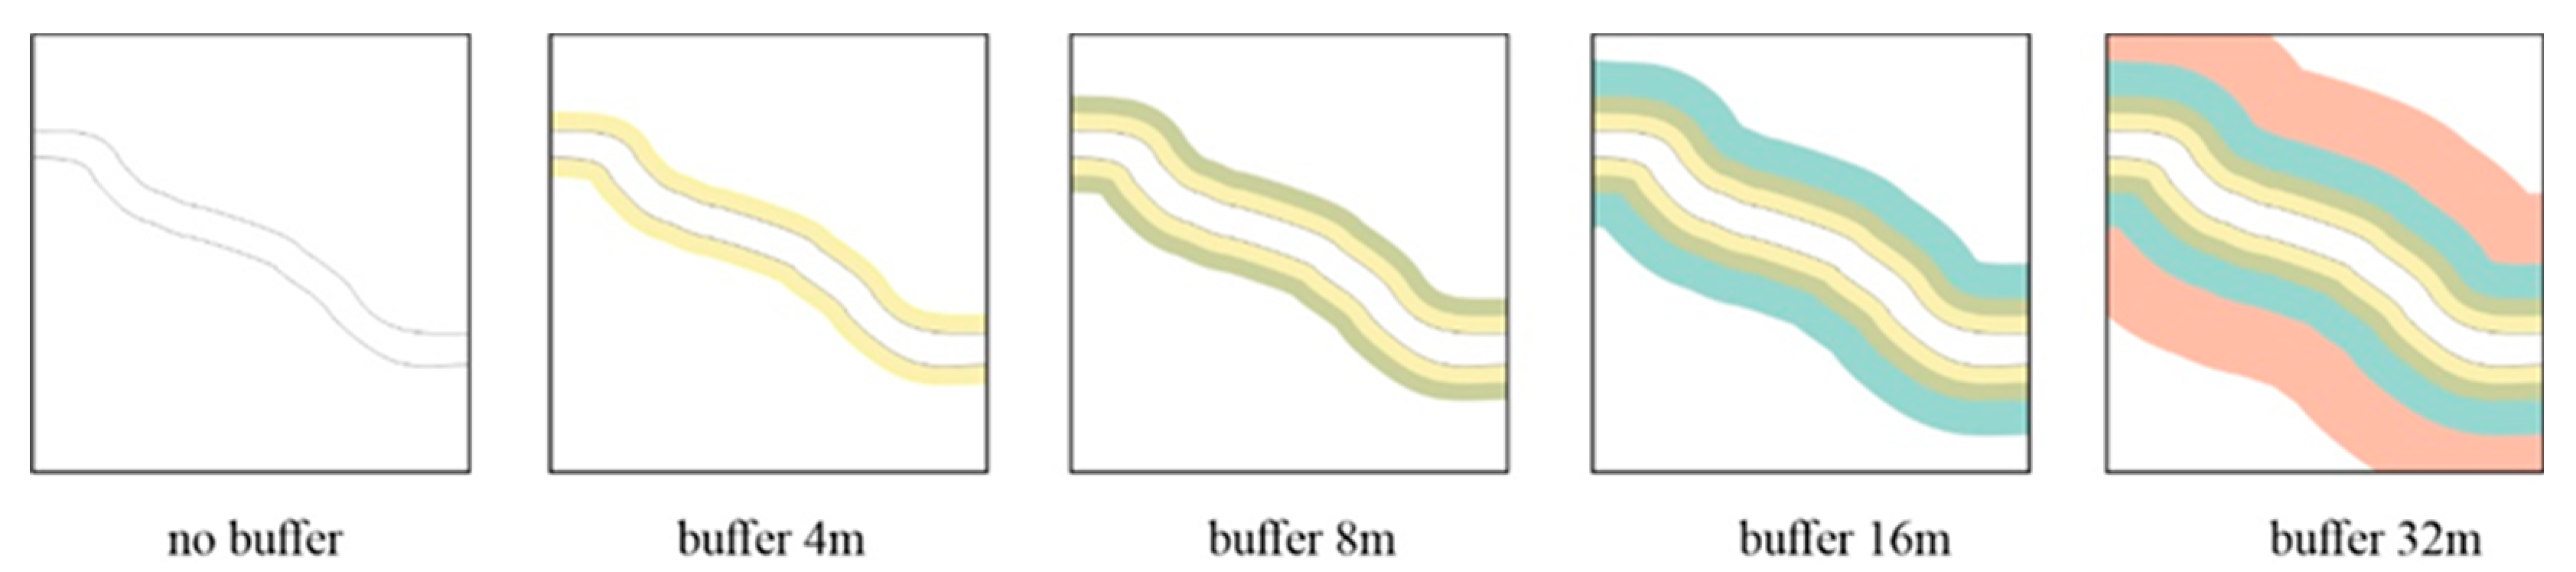
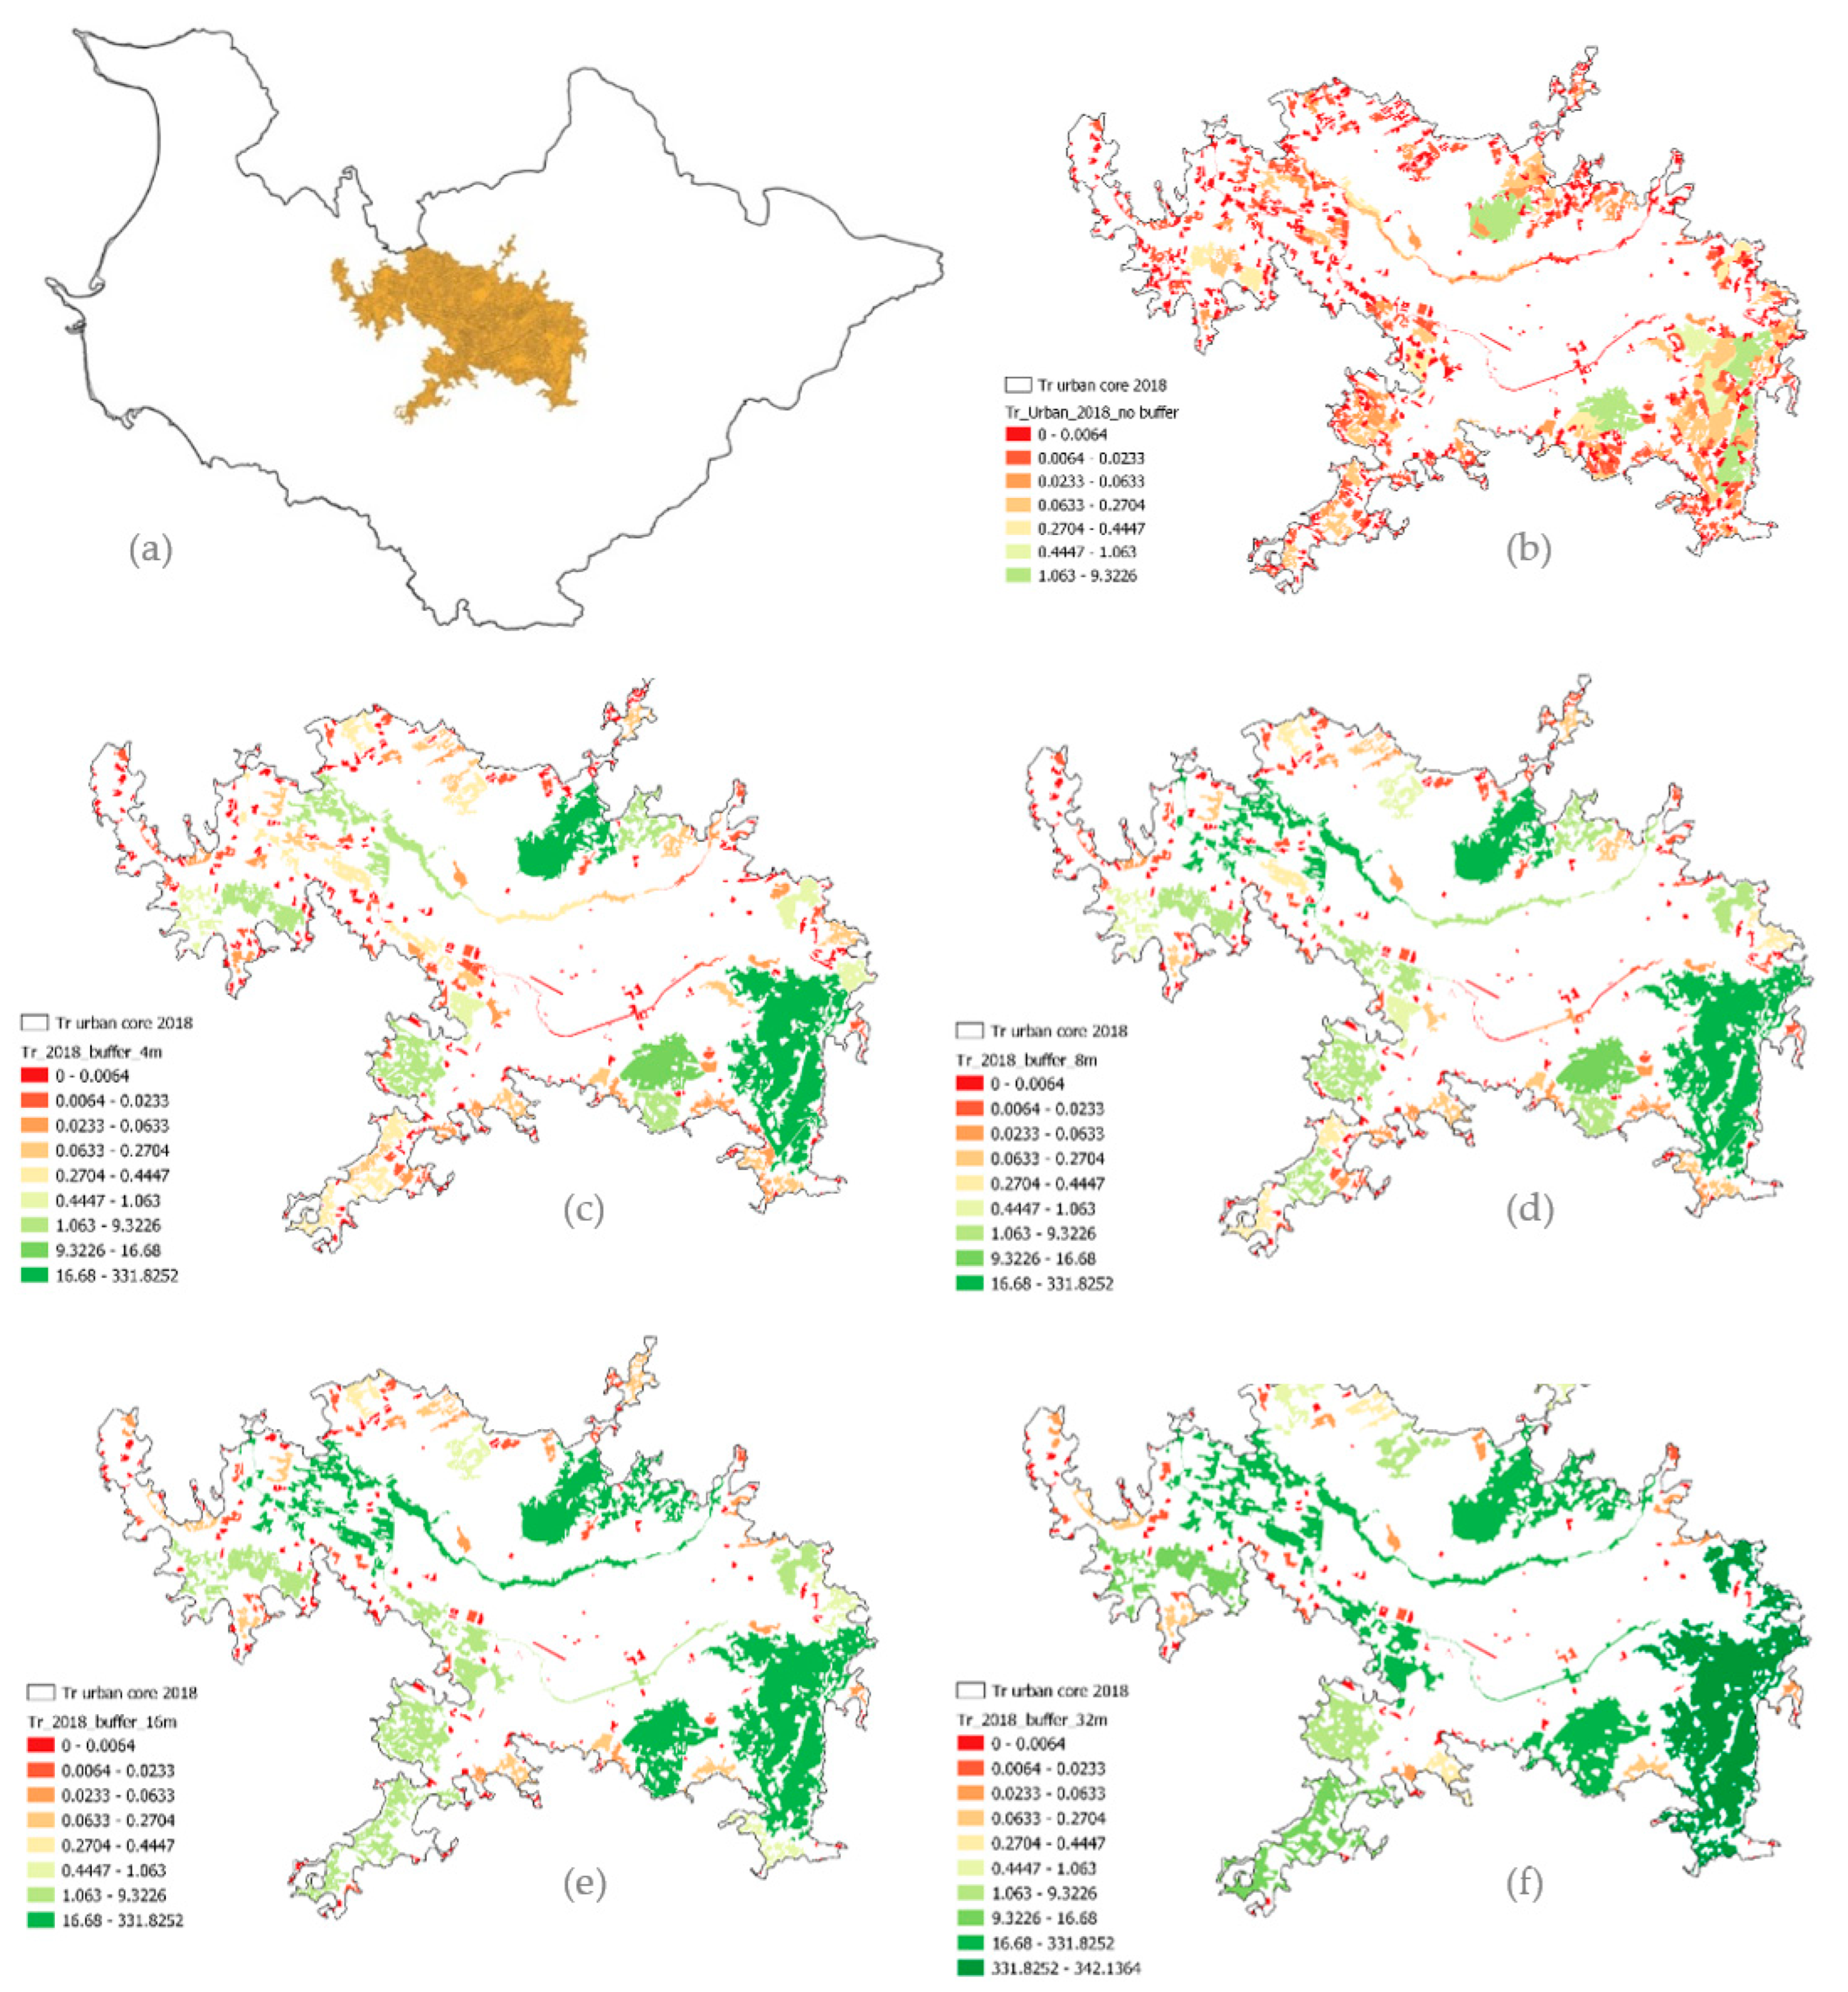
2.4. Effective Mesh Size as a Spatial Metric
3. Results
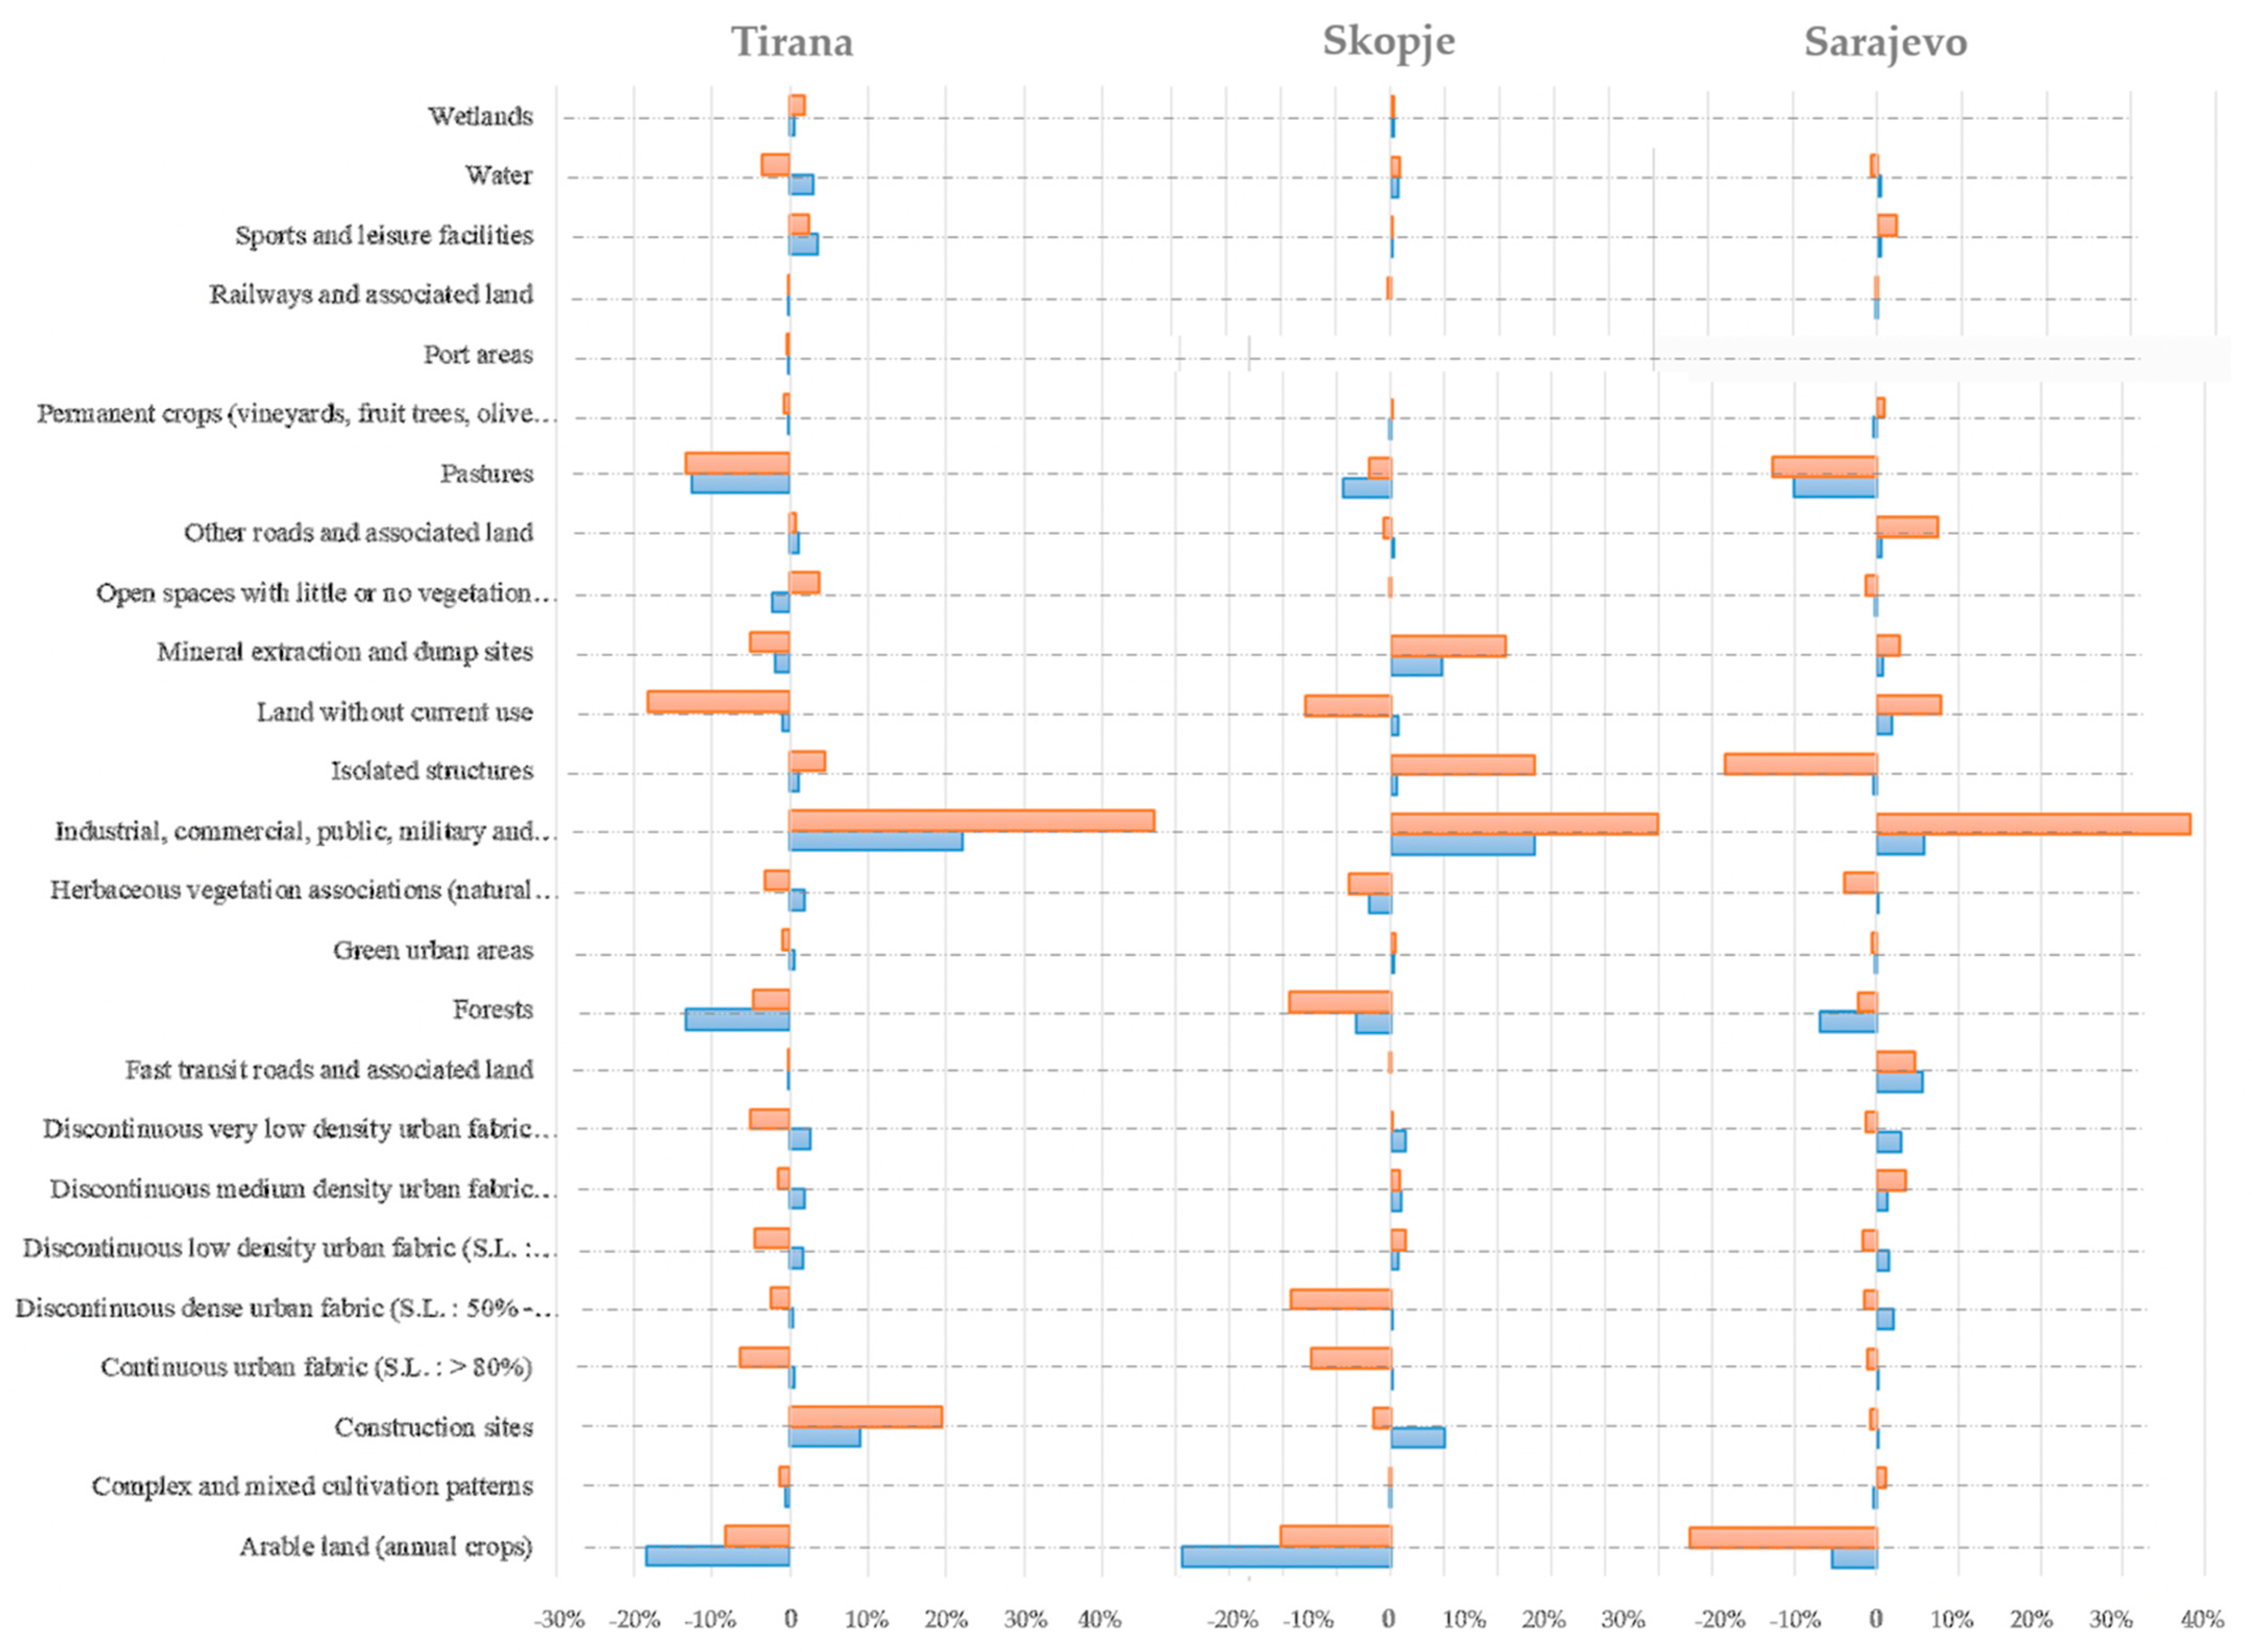
3.1. First Phase
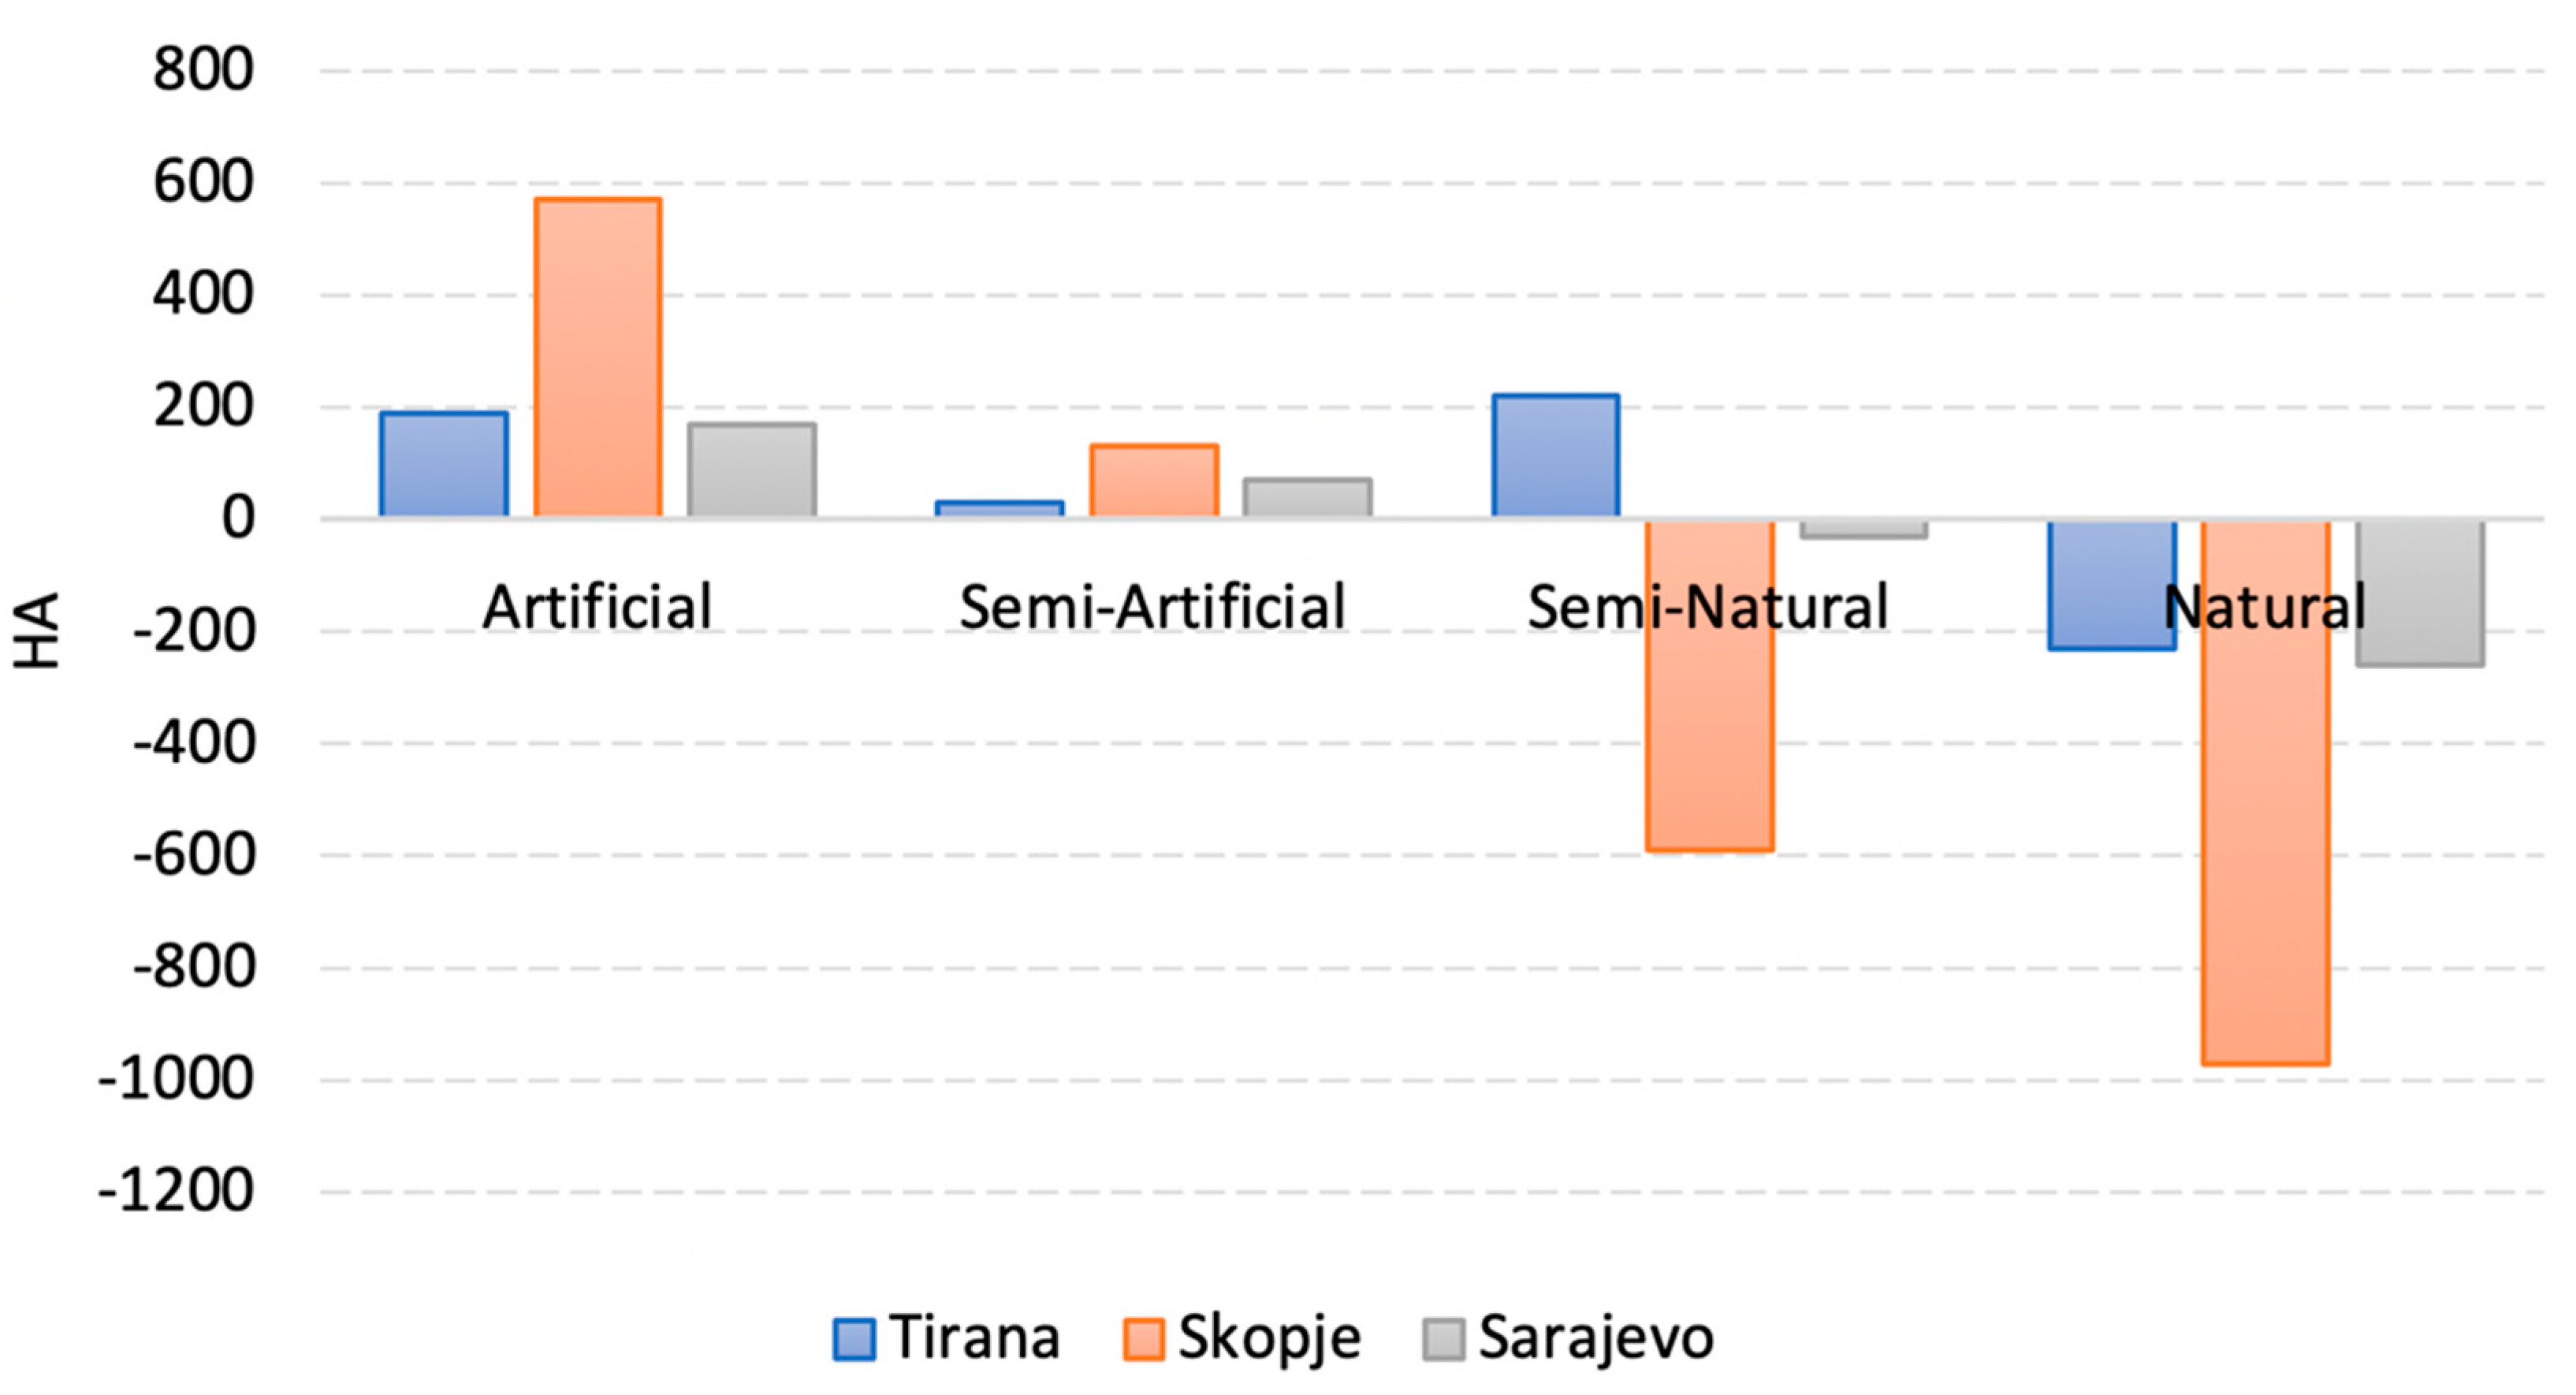
3.2. Second Phase
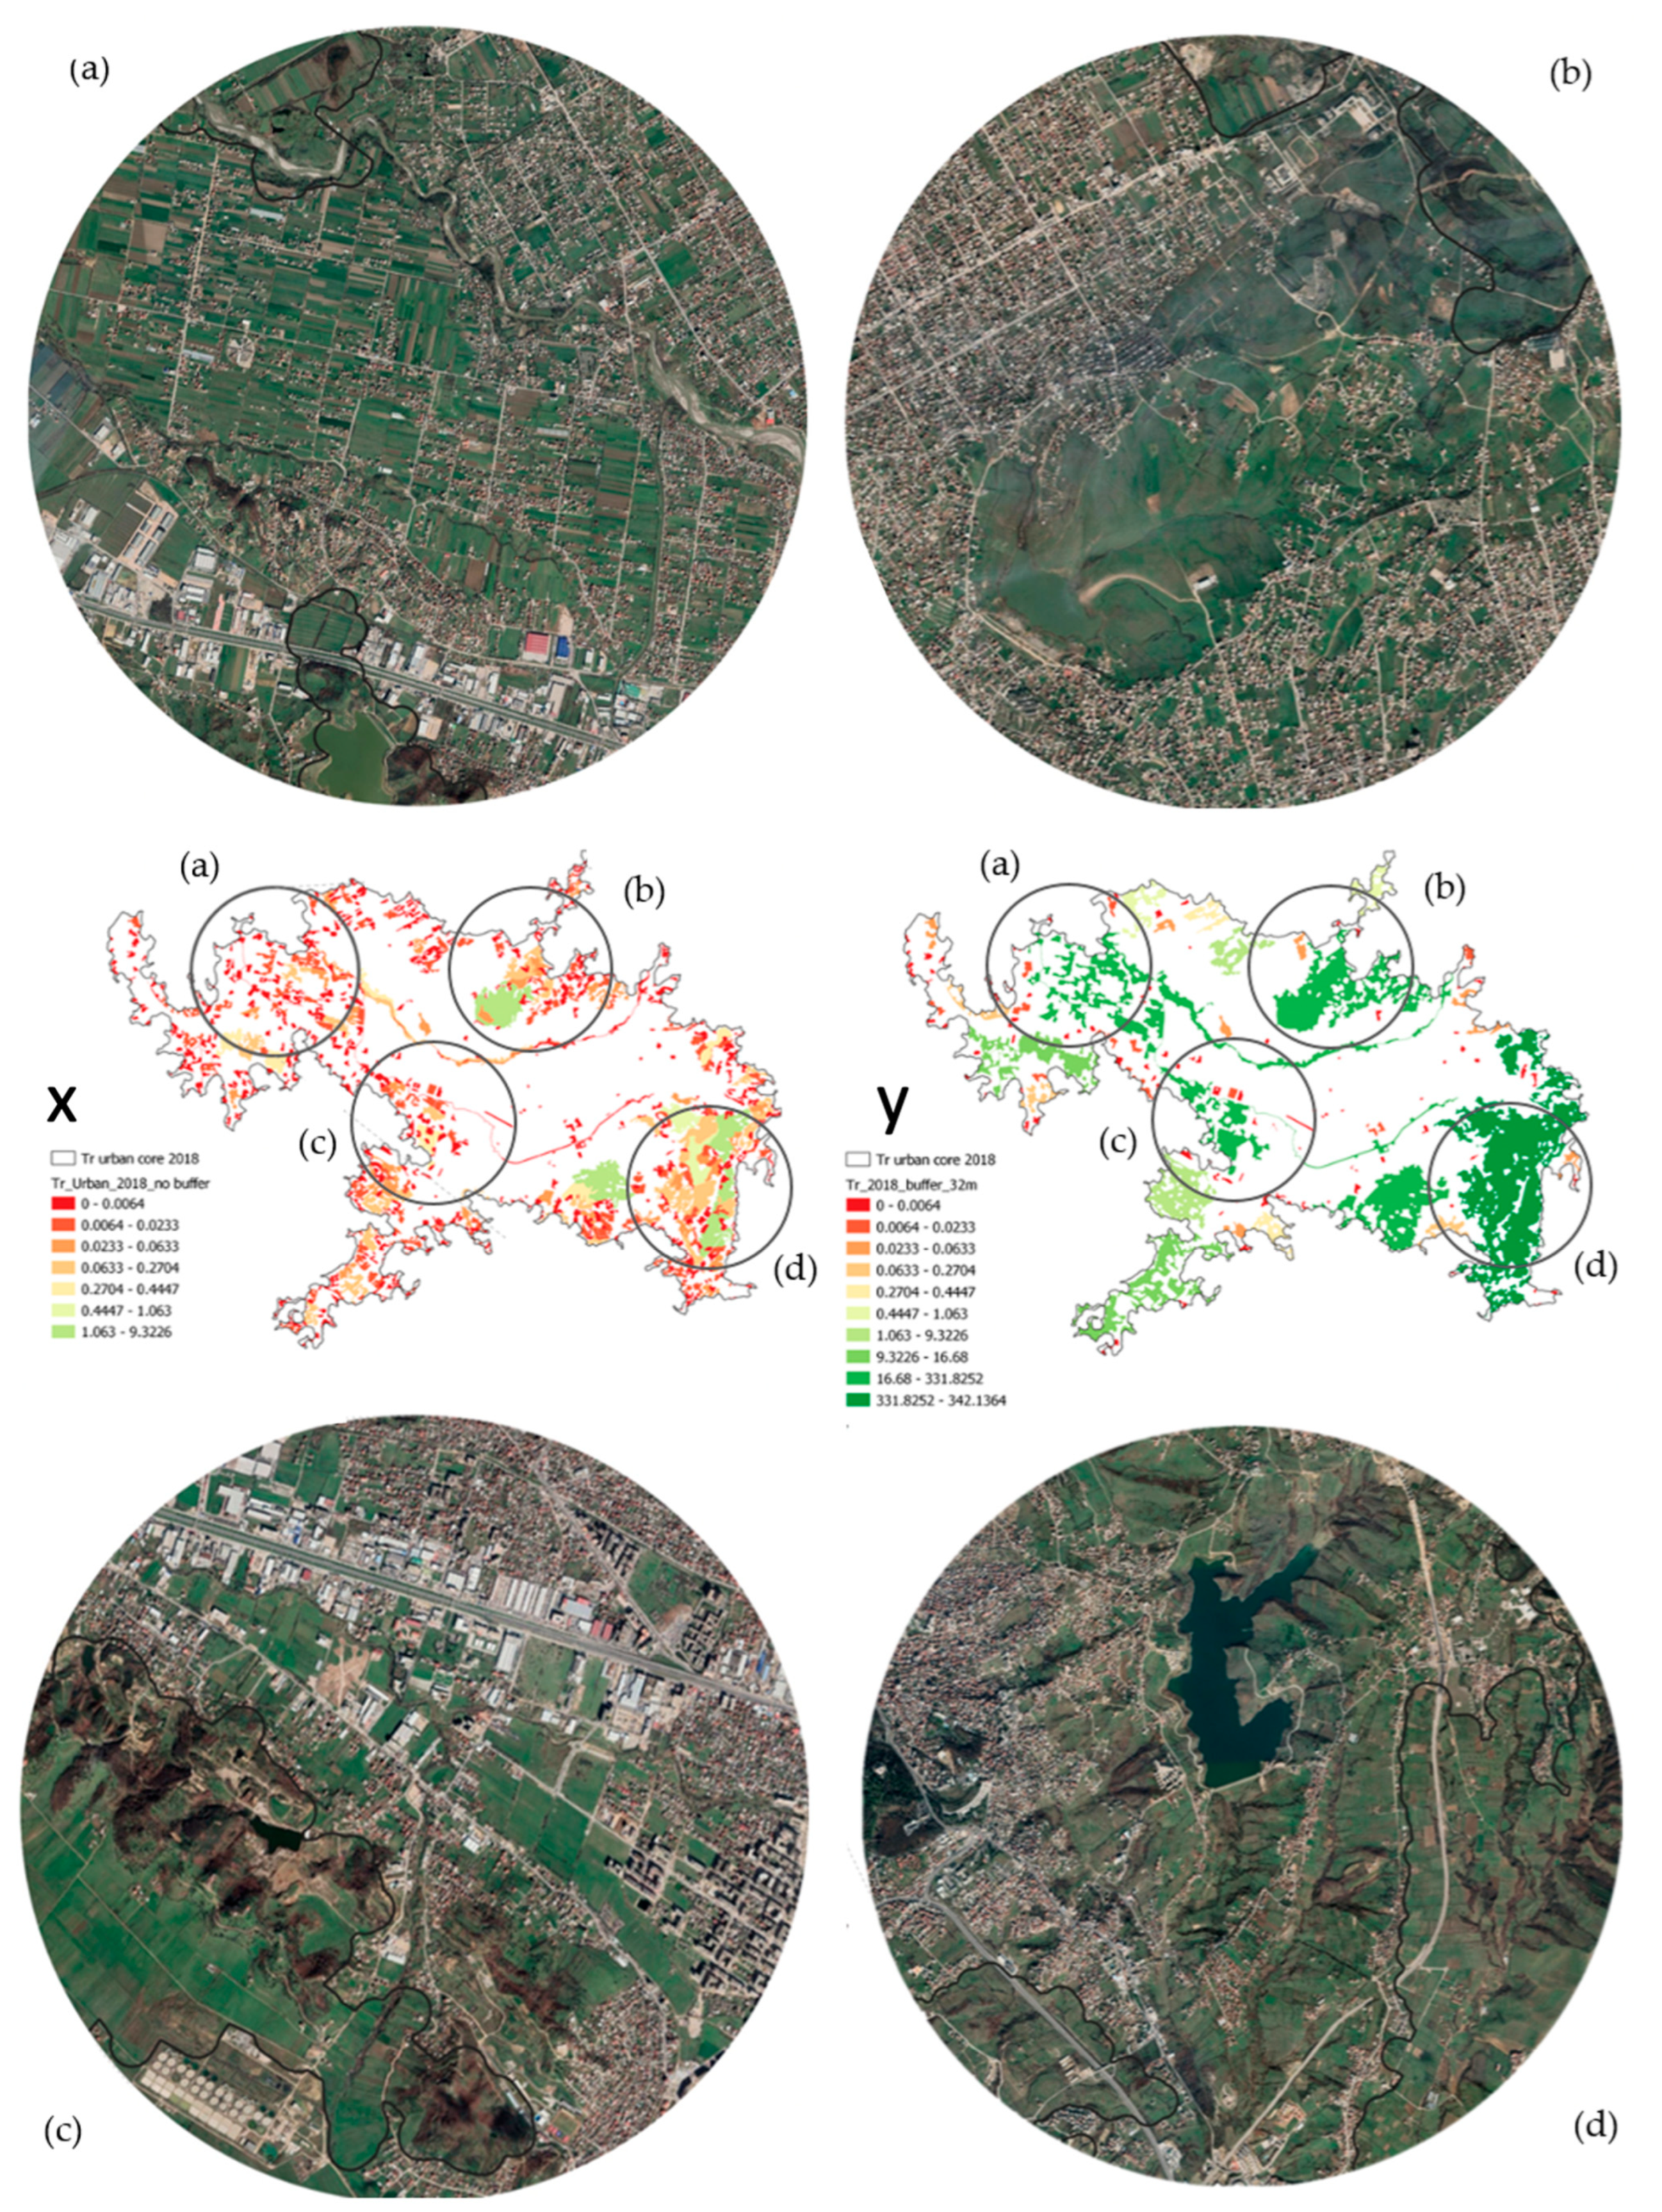
3.3. Third Phase
4. Discussion
4.1. Implications of the Results
4.2. Limitations and Further Improvement of the Method
5. Conclusions
Author Contributions
Funding
Institutional Review Board Statement
Informed Consent Statement
Data Availability Statement
Acknowledgments
Conflicts of Interest
Appendix A

References
- Cleland, J. World Population Growth; Past, Present and Future. Environ. Resour. Econ. 2013, 55, 543–554. [Google Scholar] [CrossRef]
- Canedoli, C.; Crocco, F.; Comolli, R.; Padoa-Schioppa, E. Landscape fragmentation and urban sprawl in the urban region of Milan. Landsc. Res. 2018, 43, 632–651. [Google Scholar] [CrossRef]
- Inostroza, L.; Baur, R.; Csaplovics, E. Urban sprawl and fragmentation in Latin America: A dynamic quantification and characterization of spatial patterns. J. Environ. Manag. 2013, 115, 87–97. [Google Scholar] [CrossRef] [PubMed]
- Seto, K.C.; Güneralp, B.; Hutyra, L.R. Global forecasts of urban expansion to 2030 and direct impacts on biodiversity and carbon pools. Proc. Natl. Acad. Sci. USA 2012, 109, 16083–16088. [Google Scholar] [CrossRef] [PubMed] [Green Version]
- Angel, S.; Parent, J.; Civco, D.L.; Blei, A.; Potere, D. The dimensions of global urban expansion: Estimates and projections for all countries, 2000–2050. Prog. Plann. 2011, 75, 53–107. [Google Scholar] [CrossRef]
- Seto, K.C.; Fragkias, M.; Güneralp, B.; Reilly, M.K. A Meta-Analysis of Global Urban Land Expansion. PLoS ONE 2011, 6, e23777. [Google Scholar] [CrossRef]
- Ramalho, C.E.; Laliberté, E.; Poot, P.; Hobbs, R.J. Complex effects of fragmentation on remnant woodland plant communities of a rapidly urbanizing biodiversity hotspot. Ecology 2014, 95, 2466–2478. [Google Scholar] [CrossRef] [Green Version]
- Di Giulio, M.; Holderegger, R.; Tobias, S. Effects of habitat and landscape fragmentation on humans and biodiversity in densely populated landscapes. J. Environ. Manag. 2009, 90, 2959–2968. [Google Scholar] [CrossRef]
- Kaplan, S. Meditation, Restoration, and the Management of Mental Fatigue. Environ. Behav. 2001, 33, 480–506. [Google Scholar] [CrossRef] [Green Version]
- Hysa, A. Introducing Transversal Connectivity Index (TCI) as a method to evaluate the effectiveness of the blue-green infrastructure at metropolitan scale. Ecol. Indic. 2021, 124, 107432. [Google Scholar] [CrossRef]
- Cugny-Seguin, M. Impacts of urban sprawl on landscapes. In Urban Expansion, Land Cover and Soil Ecosystem Services; Gardi, C., Ed.; Routledge: London, UK; Boston, MA, USA, 2017; pp. 204–214. ISBN 9781315715674. [Google Scholar]
- Feranec, J.; Soukup, T.; Hazeu, G.; Jaffrain, G. Landscape fragmentation in Europe. In European Landscape Dynamics: CORINE Land Cover Data; Jan, F., Tomas, S., Gerard, H., Gabriel, J., Eds.; CRC Press: Boca Raton, FL, USA; Taylor and Francis Group: Abingdon, UK, 2016; pp. 157–198. ISBN 1482244683. [Google Scholar]
- Saunders, D.A.; Hobbs, R.J.; Margules, C.R. Biological Consequences of Ecosystem Fragmentation: A Review. Conserv. Biol. 1991, 5, 18–32. [Google Scholar] [CrossRef]
- Forman, R.T.T.; Sperling, D.; Bissonette, J.A.; Clevenger, A.P.; Cutshall, C.D.; Dale, V.H.; Fahrig, L.; France, R.L.; Goldman, C.R.; Heanue, K. Road Ecology: Science and Solutions; Island Press: Washington, DC, USA, 2003; ISBN 1559639334. [Google Scholar]
- Jaeger, J.A.G.; Bowman, J.; Brennan, J.; Fahrig, L.; Bert, D.; Bouchard, J.; Charbonneau, N.; Frank, K.; Gruber, B.; von Toschanowitz, K.T. Predicting when animal populations are at risk from roads: An interactive model of road avoidance behavior. Ecol. Modell. 2005, 185, 329–348. [Google Scholar] [CrossRef]
- Schiemer, F.; Drescher, A.; Hauer, C.; Schwarz, U. The Vjosa River corridor: A riverine ecosystem of European significance. Acta ZooBot Austria 2018, 155, 1–40. [Google Scholar]
- Shumka, S.; Bego, F.; Beqiraj, S.; Paparisto, A.; Kashta, L.; Miho, A.; Nika, O.; Marka, J.; Shuka, L. The Vjosa catchment–a natural heritage. Acta ZooBot Austria 2018, 155, 349–376. [Google Scholar]
- Hysa, A.; Manahasa, O.D.; Naselli, F.; Manahasa, E.; Yunitsyna, A.; Dervishi, S. Introducing the Architectural, Urban, and Landscape Challenges of Albania. In Current Challenges in Architecture and Urbanism in Albania; Yunitsyna, A., Hysa, A., Manahasa, E., Naselli, F., Manahasa, O.D., Dervishi, S., Eds.; The Urban Book Series; Springer: Cham, Switzerland, 2021; pp. 1–15. ISBN 978-3-030-81919-4. [Google Scholar]
- Pilua, A.; Hysa, A.; Zeka, E.; Dervishi, S.; Stefanidis, S.; Spalevic, V. Transversal Relationship of Moraca River with the Urban Fabric of Podgorica. J. Environ. Prot. Ecol. 2022, 23, 2212–2222. [Google Scholar]
- Knez, S.; Štrbac, S.; Podbregar, I. Climate change in the Western Balkans and EU Green Deal: Status, mitigation and challenges. Energ. Sustain. Soc. 2022, 12, 1. [Google Scholar] [CrossRef]
- European Commission, Directorate-General for Environment, EU Biodiversity Action Plan: 2010 Assessment, Publications office. 2011. Available online: https://data.europa.eu/doi/10.2779/42306 (accessed on 14 October 2022).
- Synes, N.W.; Ponchon, A.; Palmer, S.C.F.; Osborne, P.E.; Bocedi, G.; Travis, J.M.J.; Watts, K. Prioritising conservation actions for biodiversity: Lessening the impact from habitat fragmentation and climate change. Biol. Conserv. 2020, 252, 108819. [Google Scholar] [CrossRef]
- Holyoak, M.; Heath, S.K. The integration of climate change, spatial dynamics, and habitat fragmentation: A conceptual overview. Integr. Zool. 2016, 11, 40–59. [Google Scholar] [CrossRef] [Green Version]
- Oliveira, S.; Moreira, F.; Boca, R.; San-Miguel-Ayanz, J.; Pereira, J.M.C. Assessment of fire selectivity in relation to land cover and topography: A comparison between Southern European countries. Int. J. Wildl. Fire 2014, 23, 620. [Google Scholar] [CrossRef]
- Hysa, A.; Spalevic, V. Testing NDVI, tree cover density and land cover type as fuel indicators in the wildfire spread capacity index (WSCI): Case of Montenegro. Not. Bot. Horti Agrobot. Cluj-Napoca 2020, 48, 2368–2384. [Google Scholar] [CrossRef]
- Jaeger, J.A.G. Landscape division, splitting index, and effective mesh size: New measures of landscape fragmentation. Landsc. Ecol. 2000, 15, 115–130. [Google Scholar] [CrossRef]
- Jaeger, J.A.G.; Schwarz-von Raumer, H.-G.; Esswein, H.; Müller, M.; Schmidt-Lüttmann, M. Time Series of Landscape Fragmentation Caused by Transportation Infrastructure and Urban Development. Ecol. Soc. 2007, 12. [Google Scholar] [CrossRef] [Green Version]
- Potsiou, C. Policies for formalization of informal development: Recent experience from southeastern Europe. Land Use Policy 2014, 36, 33–46. [Google Scholar] [CrossRef]
- Iban, M.C. Lessons from approaches to informal housing and non-compliant development in Turkey: An in-depth policy analysis with a historical framework. Land Use Policy 2020, 99, 105104. [Google Scholar] [CrossRef]
- Pojani, D. From squatter settlement to suburb: The transformation of Bathore, Albania. Hous. Stud. 2013, 28, 805–828. [Google Scholar] [CrossRef]
- Berisha, E.; Cotella, G. Territorial Development and Governance in the Western Balkans. In Governing Territorial Development in the Western Balkans; Berisha, E., Cotella, G., Solly, A., Eds.; Advances in Spatial Science; Springer: Cham, Switzerland, 2021. [Google Scholar] [CrossRef]
- Aliaj, B.; Lulo, K.; Myftiu, G. Tirana: The Challenge of Urban Development; Cetis: Tirana, Albania, 2003. [Google Scholar]
- Bouzarovski, S. Skopje. Cities 2011, 28, 265–277. [Google Scholar] [CrossRef]
- Kaplan, G.; Avdan, U.; Avdan, Z.Y. Urban Heat Island Analysis Using the Landsat 8 Satellite Data: A Case Study in Skopje, Macedonia. Proceedings 2018, 2, 358. [Google Scholar] [CrossRef] [Green Version]
- Martinez, G.S.; Spadaro, J.V.; Chapizanis, D.; Kendrovski, V.; Kochubovski, M.; Mudu, P. Health Impacts and Economic Costs of Air Pollution in the Metropolitan Area of Skopje. Int. J. Environ. Res. Public Health 2018, 15, 626. [Google Scholar] [CrossRef] [Green Version]
- Hysa, A. Indexing the vegetated surfaces within WUI by their wildfire ignition and spreading capacity, a comparative case from developing metropolitan areas. Int. J. Disaster Risk Reduct. 2021, 63, 102434. [Google Scholar] [CrossRef]
- Prastacos, P.; Chrysoulakis, N.; Kochilakis, G. Urban Atlas, land use modelling and spatial metric techniques. In Proceedings of the 51st Congress of the European Regional Science Association: “New Challenges for European Regions and Urban Areas in a Globalised World”, Barcelona, Spain, 30 August–3 September 2011; European Regional Science Association (ERSA): Louvain-la-Neuve, Belgium, 2011. [Google Scholar]
- Tsai, Y.; Wu, Y.; Ai, C.; Pitts, E. Critical assessment of measuring concrete joint faulting using 3D continuous pavement profile data. J. Transp. Eng. 2012, 138, 1291–1296. [Google Scholar] [CrossRef]
- European Commission. Urban Atlas 2012 Mapping Guide. v4.7. 2016. Available online: https://land.copernicus.eu/user-corner/technical-library/urban-atlas-mapping-guide (accessed on 17 October 2022).
- Copernicus Programme. Urban Atlas. Available online: https://land.copernicus.eu/local/urban-atlas (accessed on 17 October 2022).
- Montero, E.; Van Wolvelaer, J.; Garzón, A. The European Urban Atlas Land Use and Land Cover Mapping in Europe; Springer: Dordrecht, The Netherlands, 2014; pp. 115–124. [Google Scholar] [CrossRef]
- Prastacos, P.; Lagarias, A.; Chrysoulakis, N. Using the Urban Atlas dataset for estimating spatial metrics. Methodology and application in urban areas of Greece. Cybergeo 2017. [Google Scholar] [CrossRef]
- Cyriac, S.; Firoz, C.M. A Bibliometric Review of Publication Trends in the Application of Landscape Metrics in Urban and Regional Planning. Pap. Appl. Geogr. 2022, 3, 297–314. [Google Scholar] [CrossRef]
- Girvetz, E.H.; Thorne, J.H.; Berry, A.M.; Jaeger, J.A.G. Integration of landscape fragmentation analysis into regional planning: A statewide multi-scale case study from California, USA. Landsc. Urban Plan. 2008, 86, 205–218. [Google Scholar] [CrossRef]
- Hasa, E.; Hysa, A.; Teqja, Z. Quantifying Landscape Fragmentation via Effective Mesh Size Landscape Metric: Case of Albania. Agric. For. Sumar. 2021, 67, 215–230. [Google Scholar] [CrossRef]
- Hysa, A.; Türer Başkaya, F.A. Land cover data as environmentally sensitive decision-making mediator in territorial and administrative reform. Cogent Environ. Sci. 2018, 4, 1. [Google Scholar] [CrossRef]
- Jaeger, J.A.G. Effects of the Configuration of Road Networks on Landscape Connectivity. In Proceedings of the ICOET 2007 Proceedings, Little Rock, AR, USA, 20–25 May 2007; pp. 267–280. [Google Scholar]
- Jaeger, J.A.G.; Soukup, T.; Schwick, C.; Madriñán, L.F.; Kienast, F. Landscape fragmentation in Europe. European landscape dynamics–CORINE land cover data. In European Landscape Dynamics CORINE Land Cover Data Layers Current; Feranec, J., Soukup, T., Hazeu, G., Jaffrain, G., Eds.; CRC Press: Boca Raton, FL, USA, 2016; pp. 157–198. [Google Scholar] [CrossRef]
- Deslauriers, M.R.; Asgary, A.; Nazarnia, N.; Jaeger, J.A.G. Implementing the connectivity of natural areas in cities as an indicator in the City Biodiversity Index (CBI). Ecol. Indic. 2018, 94, 99–113. [Google Scholar] [CrossRef]
- Qi, Z.F.; Ye, X.Y.; Zhang, H.; Yu, L.Z. Land fragmentation and variation of ecosystem services in the context of rapid urbanization: The case of Taizhou city, China. Stoch. Environ. Res. Risk Assess. 2014, 28, 843–855. [Google Scholar] [CrossRef]
- Fenta, A.A.; Yasuda, H.; Haregeweyn, N.; Belay, A.S.; Hadush, Z.; Gebremedhin, M.A.; Mekonnen, G. The dynamics of urban expansion and land use/land cover changes using remote sensing and spatial metrics: The case of Mekelle City of northern Ethiopia. Int. J. Remote Sens. 2017, 38, 4107–4129. [Google Scholar] [CrossRef]
- Ishtiaque, A.; Shrestha, M.; Chhetri, N. Rapid Urban Growth in the Kathmandu Valley, Nepal: Monitoring Land Use Land Cover Dynamics of a Himalayan City with Landsat Imageries. Environments 2017, 4, 72. [Google Scholar] [CrossRef]
- Hysa, A.; Başkaya, T.F.A. Landscape Fragmentation Assessment Utilizing the Matrix Green Toolbox and CORINE Land Cover Data. JoDLA-J. Digit. Landsc. Archit. 2017, 2, 54–62. [Google Scholar] [CrossRef]
- Liao, J.; Bearup, D.; Blasius, B. Diverse responses of species to landscape fragmentation in a simple food chain. J. Anim. Ecol. 2017, 86, 1169–1178. [Google Scholar] [CrossRef] [PubMed] [Green Version]
- Xiong, S.; Du, S.; Zhang, X.; Ouyang, S.; Cui, W. Fusing Landsat-7, Landsat-8 and Sentinel-2 surface reflectance to generate dense time series images with 10m spatial resolution. Int. J. Remote Sens. 2022, 43, 1630–1654. [Google Scholar] [CrossRef]
- Natesan, S.; Armenakis, C.; Benari, G.; Lee, R. Use of UAV-Borne Spectrometer for Land Cover Classification. Drones 2018, 2, 16. [Google Scholar] [CrossRef] [Green Version]
- Al-Najjar, H.A.H.; Kalantar, B.; Pradhan, B.; Saeidi, V.; Halin, A.A.; Ueda, N.; Mansor, S. Land Cover Classification from fused DSM and UAV Images Using Convolutional Neural Networks. Remote Sens. 2019, 11, 1461. [Google Scholar] [CrossRef]


| Re-Classification | Urban Atlas (UA) Nomenclature |
|---|---|
| ARTIFICIAL | 11,100 Continuous urban fabric (>80%) |
| 11,210 Discontinuous dense urban fabric (50–80%) | |
| 12,100 Industrial, commercial, public, military, and private units | |
| 11,220 Discontinuous medium density urban fabric (30–50%) | |
| 13,300 Construction sites | |
| 12,210 Fast transit roads and associated land | |
| 12,220 Other roads and associated land | |
| 12,230 Railways and associated land | |
| 12,300 Port areas | |
| 12,400 Airports | |
| SEMI-ARTIFICIAL | 11,230 Discontinuous low-density urban fabric (10–30%) |
| 11,240 Discontinuous very-low-density urban fabric (<10%) | |
| 11,300 Isolated structures | |
| 13,100 Mineral extraction and dumpsites | |
| SEMI-NATURAL | 13,400 Land without current use |
| 14,200 Sports and leisure facilities | |
| 21,000 Arable land (annual crops) | |
| 22,000 Permanent crops (vineyards, fruit trees, and olive groves) | |
| 24,000 Complex and mixed cultivation patterns | |
| NATURAL | 14,100 Green urban areas |
| 23,000 Pastures | |
| 31,000 Forests | |
| 32,000 Herbaceous veg. associations (natural grassland) | |
| 33,000 Open spaces with little or no veg. (beaches, dunes, etc.) | |
| 40,000 Wetlands | |
| 50,000 Water |
| 2012 | |||||
| Buffers | 0 | 4 | 8 | 16 | 32 |
| Total area (ha) | 3715.937 | 3743.07 | 3764.385 | 3794.052 | 4186.495 |
| Total area (ha) | 25.86040535 | 251.4593764 | 311.4409077 | 405.798178 | 750.6417115 |
| No. of geometries | 1004 | 886 | 578 | 368 | 174 |
| 2018 | |||||
| Buffers | 0 | 4 | 8 | 16 | 32 |
| Total area (ha) | 3609.529 | 3634.373 | 3654.405 | 3689.241 | 4091.373 |
| Total area (ha) | 25.5546867 | 235.7869958 | 294.393295 | 375 | 745.4720198 |
| No. of geometries | 1016 | 928 | 605 | 385 | 179 |
Publisher’s Note: MDPI stays neutral with regard to jurisdictional claims in published maps and institutional affiliations. |
© 2022 by the authors. Licensee MDPI, Basel, Switzerland. This article is an open access article distributed under the terms and conditions of the Creative Commons Attribution (CC BY) license (https://creativecommons.org/licenses/by/4.0/).
Share and Cite
Hyka, I.; Hysa, A.; Dervishi, S.; Solomun, M.K.; Kuriqi, A.; Vishwakarma, D.K.; Sestras, P. Spatiotemporal Dynamics of Landscape Transformation in Western Balkans’ Metropolitan Areas. Land 2022, 11, 1892. https://doi.org/10.3390/land11111892
Hyka I, Hysa A, Dervishi S, Solomun MK, Kuriqi A, Vishwakarma DK, Sestras P. Spatiotemporal Dynamics of Landscape Transformation in Western Balkans’ Metropolitan Areas. Land. 2022; 11(11):1892. https://doi.org/10.3390/land11111892
Chicago/Turabian StyleHyka, Isra, Artan Hysa, Sokol Dervishi, Marijana Kapovic Solomun, Alban Kuriqi, Dinesh Kumar Vishwakarma, and Paul Sestras. 2022. "Spatiotemporal Dynamics of Landscape Transformation in Western Balkans’ Metropolitan Areas" Land 11, no. 11: 1892. https://doi.org/10.3390/land11111892
APA StyleHyka, I., Hysa, A., Dervishi, S., Solomun, M. K., Kuriqi, A., Vishwakarma, D. K., & Sestras, P. (2022). Spatiotemporal Dynamics of Landscape Transformation in Western Balkans’ Metropolitan Areas. Land, 11(11), 1892. https://doi.org/10.3390/land11111892