Article

Spatiotemporal Dynamics of Landscape Transformation in Western Balkans’ Metropolitan Areas

1
Department of Architecture, Epoka University, 1032 Tirana, Albania
2
Faculty of Forestry, University of Banja Luka, 78000 Banja Luka, Bosnia and Herzegovina
3
CERIS, Instituto Superior Técnico, University of Lisbon, 1649-004 Lisbon, Portugal
4
Civil Engineering Department, University for Business and Technology, 38220 Pristina, Kosovo
5
Department of Irrigation and Drainage Engineering, College of Technology, G.B. Pant University of Agriculture and Technology, Pantnagar 263145, Uttarakhand, India
6
Faculty of Civil Engineering, Technical University of Cluj-Napoca, 400020 Cluj-Napoca, Romania
*
Author to whom correspondence should be addressed.
Land 2022, 11(11), 1892; https://doi.org/10.3390/land11111892
Submission received: 18 September 2022 / Revised: 18 October 2022 / Accepted: 20 October 2022 / Published: 25 October 2022
(This article belongs to the Special Issue Land Cover and Land Use Mapping Using Satellite Image)

Abstract

:
Human-caused landscape transformation represents a danger to conserving the Earth’s natural habitats. Landscape fragmentation (LF) caused by transportation infrastructure and urban development poses a threat to human and environmental health by increasing traffic noise and pollution, reducing the size and viability of wildlife populations, facilitating the spread of invasive species, and reducing the recreational qualities of the landscape. It is especially noticeable in the metropolitan areas of developing countries due to rapid and unsupervised urban sprawl. In this context, this study aims to protect natural landscapes and biodiversity, promoting forms of sustainable development. To exemplify our aim, we bring a spatio-temporal analysis of landscape change comparing three metropolitan areas in the Western Balkans (WB). First, we compare the land use land cover (LULC) changes in Tirana (Albania), Skopje (North Macedonia), and Sarajevo (Bosnia and Herzegovina). The comparison was based on the Urban Atlas (UA) data of 2012 and 2018. The analysis was performed on two levels, at the metropolitan and urban spatial scales. Apart from descriptive statistics about the changes in surface area and patch counts, we used effective mesh size (meff) as a landscape metric to quantify the LF level. Our results show that each city has faced significant LULC change between 2012 and 2018, with a dominant increase in artificial surfaces. Furthermore, the cumulative natural surface area reduction is followed by increased landscape patch counts, indicating an increased LF at both levels. This study enhances public awareness about the landscape transformation trends in the developing metropolitan regions of WB. The respective administrative bodies at both local and central levels are invited to consider our results and adopt proper measurements to reduce the adverse consequences of subsequent spatial development decisions.

1. Introduction

Worldwide, urbanization is rapidly growing. In the next decades, the population living in cities is expected to increase [1]. Urban development is a necessity of human societies, but controlling and well supervising it has been a continuous challenge. Processes such as landscape transformation and habitat fragmentation are among the direct consequences of the urban sprawl of existing cities [2]. Many studies show that the spatial expansion of metropolitan areas is rising faster than the increase in the respective populations that occupy these lands [3,4,5,6], causing habitat fragmentation at different levels [7]. Consequently, uncontrolled urbanization processes destroy, alter, and dissect the existing natural and semi-natural ecosystems while concurrently creating smaller habitats at a finer spatial scale. With urbanization, the size of semi-natural patches shrinks, and heavily populated areas are distinguished by small patches divided by highways, towns, or intensively maintained agricultural land [8].
Indeed, even small semi-natural areas, such as green surfaces and natural elements, such as single trees, in heavily inhabited areas improve human well-being and contribute to residents’ health [9]. Adapting nature and urban surroundings in densely populated areas can support native species and enhance human health [10]. Landscape fragmentation is a significant cause of the disturbing reduction of many wildlife species in Europe due to transport networks and urban sprawl [11,12]. Wildlife ecosystems are adversely impacted by roads and railroads by reducing habitat and quality, increasing mortality due to car collisions, limiting or blocking access to services across transport networks with barrier effects, and separating and isolating animal populations into smaller and more vulnerable communities [13,14,15].
Many European countries have stressed the need to protect biodiversity and maintain connectivity between the remaining natural areas for the movement of species, including migration and dispersal, access to various habitat types and other resources, recolonization of empty environments, and genetic exchange between populations [12]. While developed regions in Europe are positively moving forward in this respect, developing regions, such as south-eastern Europe and especially the Western Balkans (WB), continue to face rapid and uncontrolled urban sprawl against the surrounding natural and semi-natural areas.
WB region is categorized by diverse geographies and unique habitats. For example, the recent literature reports that the rarest wild watercourses remaining in Europe are found in the WB [16,17]. The region is home to rich biodiversity, including plenty of endemic species of flora and fauna. Recently, urban sprawl, land abandonment, habitat loss, infrastructure projects, and other pressure have threatened this natural treasure [18]. Especially in the metropolitan areas of WB, the pressure of land use change along the urban watercourses is acknowledged by Pilua et al. [19]. Countries in the region have undertaken essential initiatives to protect biodiversity and nature areas: particularly in recent years, the size of protected areas in the region has risen gradually [20]. However, the EU goal of preventing biodiversity loss by 2010 has not yet been reached [21].
In addition to human activity’s impact on semi-natural and natural areas, recent studies highlight the consequences of global climate change as an amplificatory of landscape transformations [22,23]. Consequently, alterations in micro-climates of the region are expected to have a major effect on the region’s biodiversity. In addition to the general global biodiversity changes, degradation at a coarse scale could also influence the region’s rich local biodiversity. More specifically, according to previous studies, the area has undergone major land cover shifts regarding the usage of natural resources. In 2000, about 45% of the land was used for agriculture in the WB, and another 40% was covered by forests [24].
In addition to the expansions surrounding urban areas, a remarkable proliferation has also occurred regarding tourist developments in coastal areas. Furthermore, the reduction in habitat quality due to climate change, natural hazards, or human intervention in the WB may directly affect large-scale habitat networks’ biodiversity and ecological services to belong at a pan-European level [25]. Thus, the safeguarding of the unique natural and semi-natural areas in the WB is of vital importance.
In this context, this study aims to highlight the landscape transformation trends in developing countries (WB) based on available land use land cover (LULC) data. We hypothesize that, between 2012 and 2018, remarkable LULC changes have been dominated by the transformation of natural and semi-natural surfaces into artificial ones, especially around metropolitan areas.
In addition to the quantitative assessment based on surface area and patch counts, we expand our analysis by measuring landscape fragmentation (LF) during the same period. As a fragmentation measure, we use the effective mesh size (meff) originally proposed by Jaeger [26,27]. As roads and urban growth are associated with a variety of human behaviors, meff also serves as an indicator of other human disruptions causing landscape fragmentation. Thus, this study aims to raise the following questions:
  • What are the spatio-temporal transformation dynamics among Western Balkan metropolitan areas based on Urban Atlas (UA) evidence?
  • What is the degree of LF in metropolitan Tirana, and how does it differ from other WB metropolitan regions, such as Sarajevo and Skopje?
  • What are the degree and spatial extent of landscape fragmentation in Tirana today?
  • What are the potential causes of why some regions are more or less fragmented than expected?
  • What are the recommendations for the better management of landscape transformation and fragmentation to guide effective, sustainable management strategies in metropolitan areas of developing regions such as the WB?

2. Materials and Methods

2.1. Study Area

This study analyzed the landscape transformation dynamics of three metropolitan hubs in the WB, being Tirana, Skopje, and Sarajevo. The selected metropolitan areas (Figure 1) are home to the capital cities of Albania, Macedonia, and Bosnia Herzegovina, respectively. They share several similarities and differences, characterized by social, economic, and geophysical factors. Before delivering a brief information about each selected city, it is worth mentioning that all three cases have faced significant landscape transformations following the political changes of 1990s. During this transition period, there have been prolonged processes of formalizing the informalities not only in socio-economic aspects but also the urban development [28]. This allowed the informal urban development that surrounds the selected capital cities.
Most of these areas are occupied by informal housing, which is defined as a settlement that does not rely on the existing law and regulations of the respective administrative unit [29]. About 15 years after the political changes of 1990s, only in Albania, the surface area covered by informal settlements was officially measured as 3200 km2 (about 11% of the whole country), 36% of which was only in the urban areas [30]. Urban migration is an important trigger of this transformation. WB countries have faced remarkable increase in the urban population between 1990 and 2018. Albania faced the highest rates of urban population increase jumping from 36% in 1990 to more than 60% in 2018. While the urban population of Montenegro increased from 48% to 66.7%, Bosnia and Herzegovina experienced a relatively lower urban population growth, raising from 39% to 48% within the same timeframe [31].
Tirana is the capital and the largest city of the Republic of Albania both in terms of area and population. It occupies the central part of the country, between the Dajti Mountain in the east, the Krrabe, Sauk, and Vaqarr hills in the south, and a valley opening towards the northwest that faces the Adriatic Sea. The average altitude is 110 m above sea level, with a peak of 1828 m. Following the political transition of the 1990s, Tirana has exponentially expanded in size and population. The territorial transformation in the area has been characterized by accelerated growth, heavy traffic, and booming informal construction of stores, homes, and squatter communities. Demographic data indicate that Tirana’s population in 2021 was expected to exceed 502,734. Tirana is one of Europe’s most diverse cities. It is a region traversing normal and prolonged transformation, still the most challenging and dramatic problem in our time [32].
While Skopje is home to almost a third of the population of North Macedonia, the current population is about 600,000. Skopje is situated in the country’s northwestern corner, in the heart of the Balkan Peninsula, roughly midway between Belgrade and Athens, and in-between other key transport corridors connecting Central Europe with Asia Minor and the Eastern Mediterranean [33]. The city of Skopje spans more than 33 km inside its administrative boundaries, yet it is just 10 km wide. Skopje is around 245 m above sea level and covers 571.46 square kilometers. The urbanized area is just 337 km2, with a population density of 65 per hectare. In recent decades, Skopje has experienced tremendous land use change causing many social-ecological problems, such as air pollution, urban heat islands, and related health issues [34,35].
On the other hand, Sarajevo is the country’s capital and the most populous city. The population of the central city exceeds 275,000 inhabitants. However, the population of the entire metropolitan region extends beyond 555,000 inhabitants. The city is surrounded by dense forest hills and mountains, covering 142 km2 and 500 m above sea level. The Tirana and Sarajevo metropolitan areas have been compared before in terms of natural hazards, such as wildfires [36]. However, in this study, we included Skopje among the comparative cases due to the comparable scale and background of the three cities, including Tirana and Sarajevo, as shown in Figure 1.

2.2. Method and Workflow of the Study

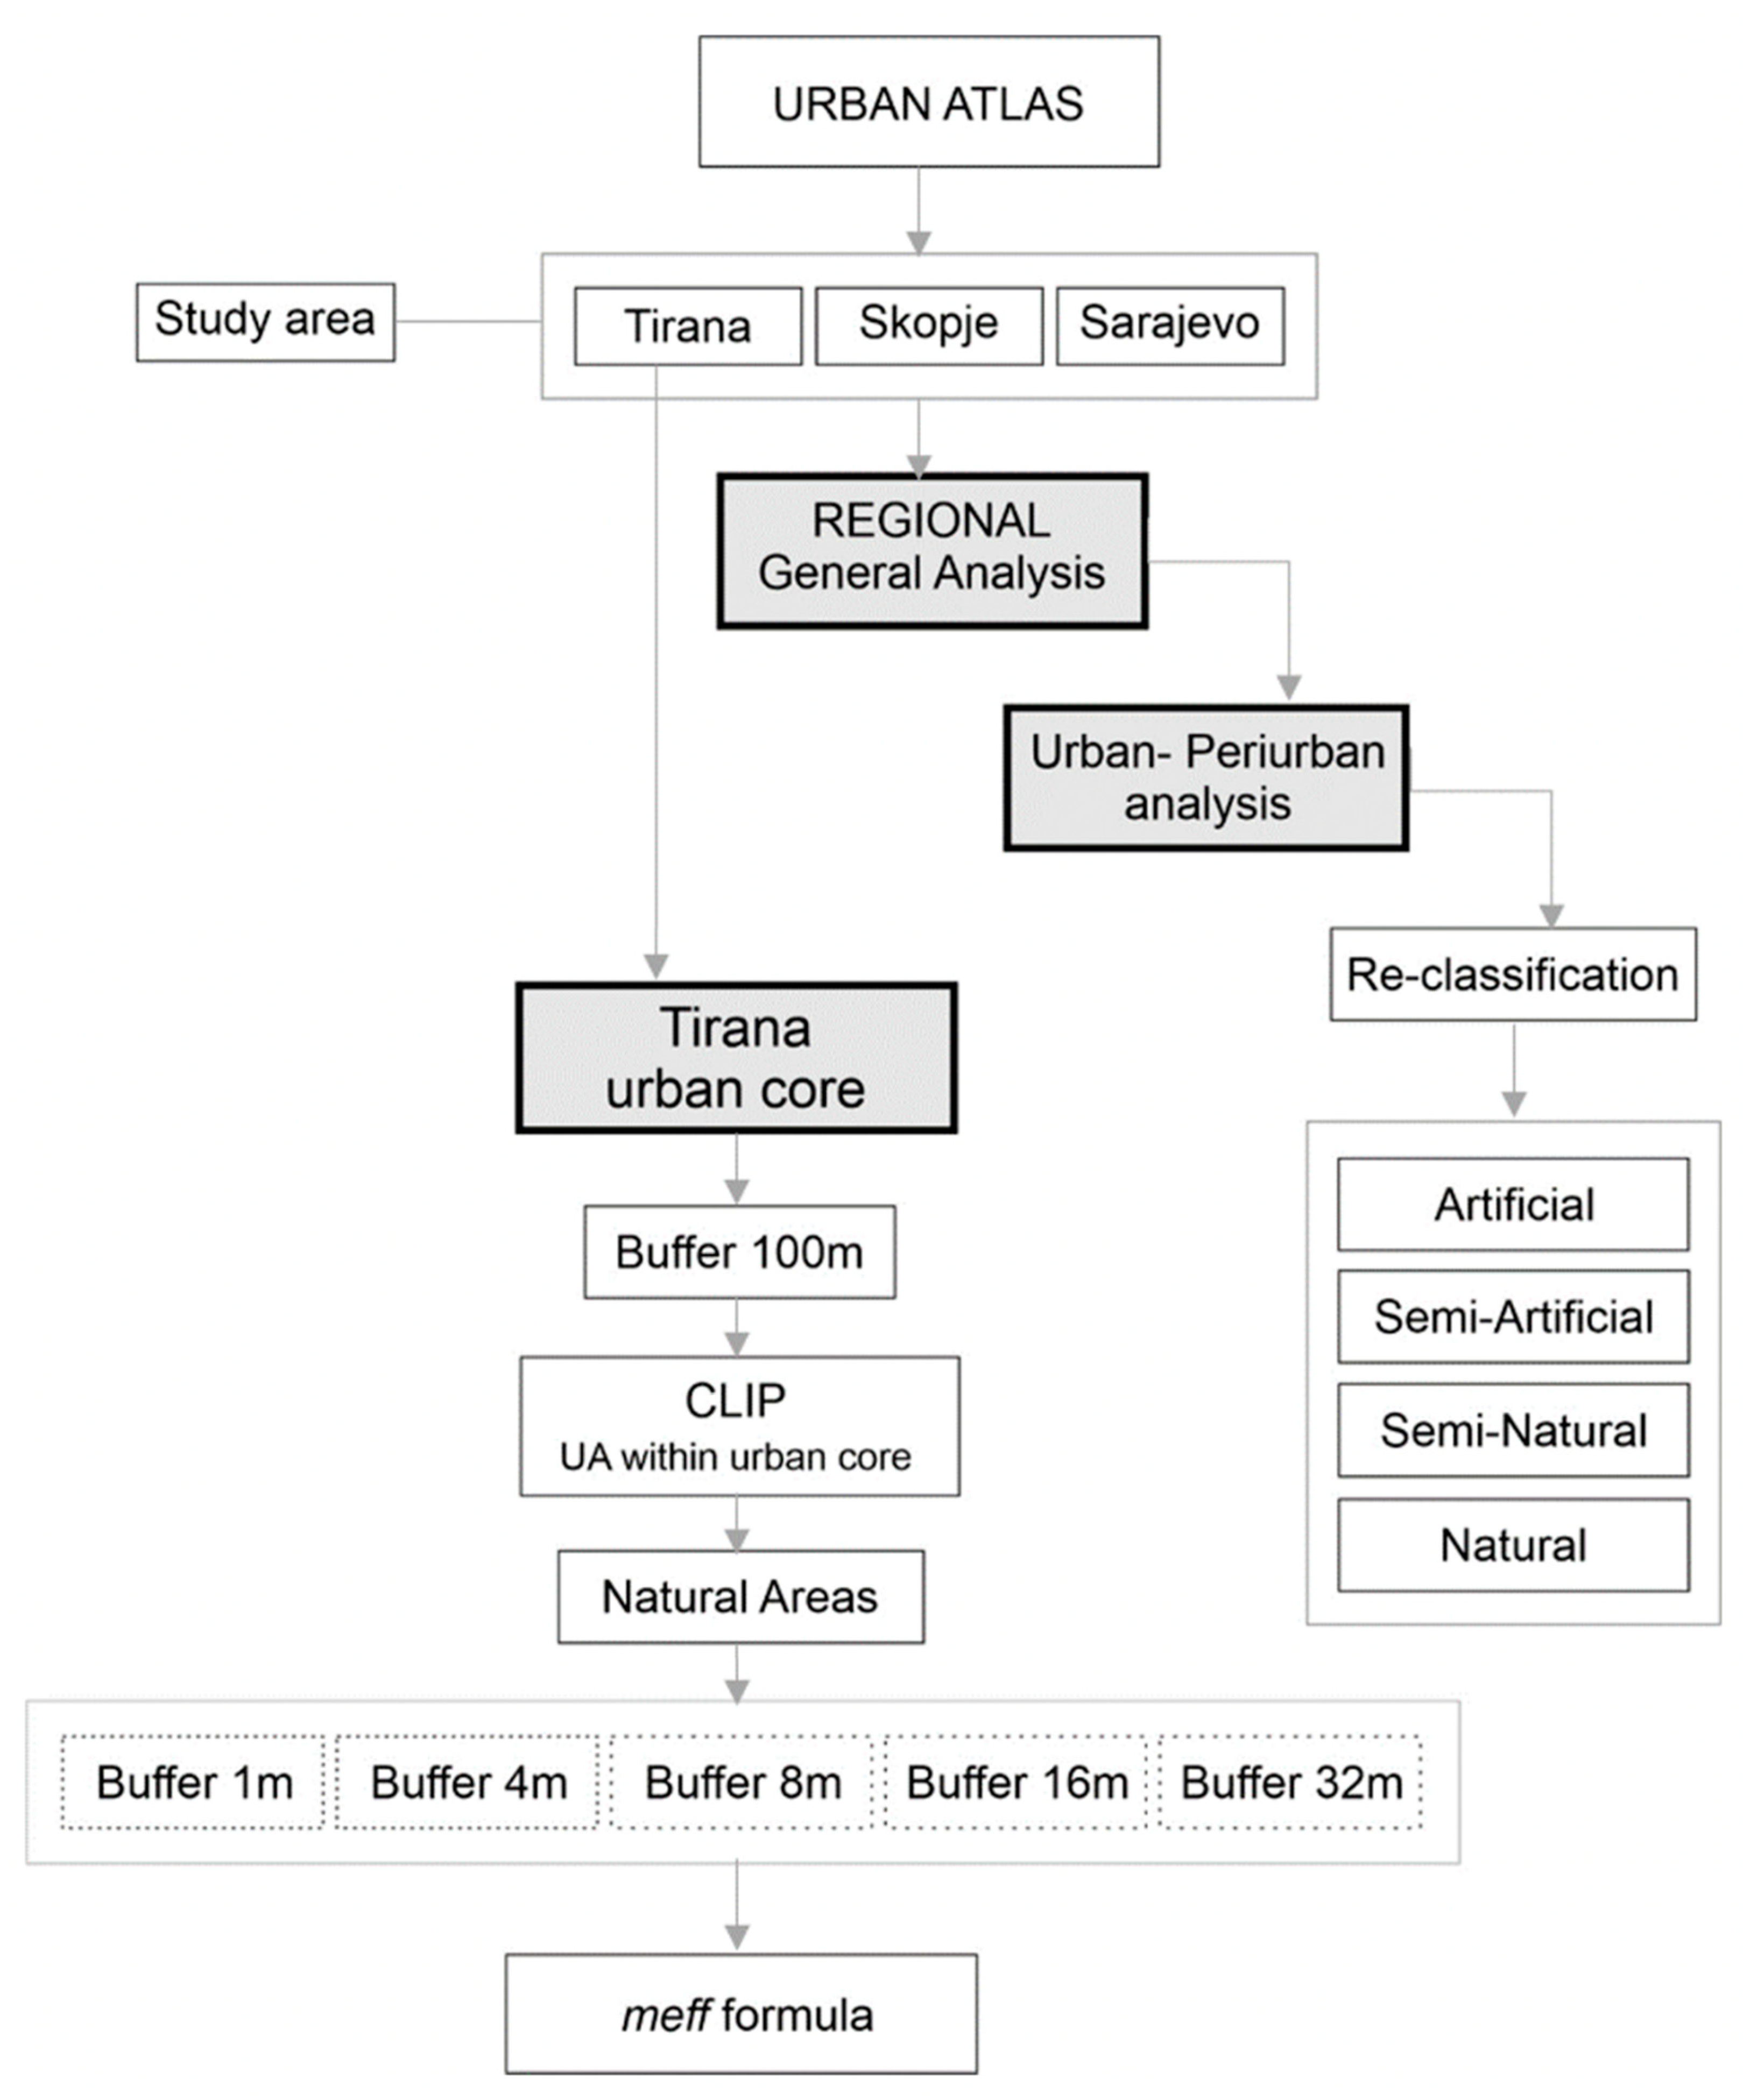
The workflow of the study consists of three main phases, as shown in Figure 2. In the first stage, we assessed the LULC differences for three metropolitan areas based on the UA records for 2012 and 2018. This phase includes a general statistical analysis of a regional metropolitan area of the three cities compared between years. In the second, we introduced a re-classification procedure of the UA classes into four main categories: artificial, semi-artificial, semi-natural, and natural. In this stage, the focus was on each city’s urban and peri-urban zones. The former refers to the urbanized core of each city, including denser and concentrated artificial surfaces, while the peri-urban zone refers to the scattered artificial surfaces that surround the vicinity of the urbanized core. Both are well-defined based on the UA classes, as explained in Section 2.3.
We decided to rely on the effective mesh size (meff) method to quantify/measure LF in the selected study areas. The calculation of meff is a practical indicator characterized by mathematical simplicity and intuitive understanding. It helps to determine both the inter-patch and intra-patch connectivity of the landscape. It indicates that the two randomly selected points in the landscape are connected and not isolated by barriers such as roads or urban areas. The possibility of the connectivity experience is translated to the size of an area, named the effective mesh size. The more the amount barriers in the landscape, the lower the chance of linking the two places and the lower the meff indicator. The lower the meff, the more the landscape becomes fragmented. With an unfragmented area, the maximal value of the effective mesh size is reached: meff is equal to the size of the whole area. If an area is composed of two separate equal-sized patches, meff is equal to the size of a single patch or half of the whole area [26].
We utilized QGIS 3.10 software and Urban Atlas (UA) dataset, which enabled us to compare the selected urban spatial patterns. UA is an open-source geospatial database prepared by the European Environment Agency (EEA) based on a combination of statistical image classification and the visual interpretation of very high-resolution satellite imagery with a minimum mapping unit of 0.25 ha at minimum width of 10 m. Vector format (every land use entity is a polygon) is used by the database. It has been developed from satellite images of 2006 ± 1 year with a map scale of 1:10,000. The UA collects thousands of European satellite imagery and offers an extensive and cost-effective mapping of large urban areas, including detailed statistics on land cover and use [37].
During the third phase, we focused on Tirana’s urbanized zone to assess the level of landscape fragmentation. First, we applied a buffer of 100 m to the artificial and semi-artificial surfaces as defined in the re-classification step of the workflow (Figure 2) based on UA data. Then, we dissolved these patches to a single one and performed a second reverse buffer (−100 m) to reduce the range of error. This enabled the identification of the study area boundary, which includes all types of surfaces within an urbanized core. In the next phase, we selected only the natural and semi-natural surfaces within the new boundary to be analyzed.
An important step in the following analysis refers to the application of different buffers, such as 4 m, 8 m, 16 m, and 32 m, which are illustrated in Figure 3. Considering that the standard width of a road lane is 3.65 m [38], we applied different buffer zones of 0 m, 4 m, 8 m, 16 m, and 32 m in five connectivity levels. These buffer distances may seem too small compared to the resolution of UA data regarding LULC surfaces (patches). However, the mapping guide by Copernicus states that, for the roads within the transportation network that are less than 10 m in width, the mapping procedure utilized other data, such as Open Street Map (OSM) navigation data [39]. Thus, the available UA data that we utilized in this study include the roads at width of 6 m, by justifying our smallest buffer (2 × 4 m).
The first level relies on the current situation of the road network with no buffer. The second level assumes all natural surfaces are 4 m wide (buffered by 4 m). Thus, roads narrower than 8 m are removed from being a fragmenting agent. The buffered patches were dissolved to unify the overlapping (connected) patches. Then, the dissolved layer was reversely buffered again with a minus value to reduce the range of error during meff calculation. A similar procedure was applied for the consecutive buffer levels. After this, the effective mesh size (meff) formula was applied to measure the LF only for Tirana City.

2.3. Materials of the Study: Urban Atlas

Urban Atlas provides a relatively high-resolution LULC map of urban regions, including 300 European cities with populations of over 50,000 people (data of 2012 and 2018) [40]. According to the Functional Urban Area (FUA), each UA product is created by covering the city and the related hinterland. There are 27 classes in total within the nomenclature of the UA, of which 17 are urban classes, and the remaining classes belong to rural land cover types [41]. The classification of the UA is more detailed (4 levels) compared with CORINE Land Cover (CLC) data. With the UA dataset, it is possible to study European cities in several different ways. One method is to quantify the percentage coverage of various forms of land use. By the study of spatial metrics, this may be revealed. Indicators estimated from a patch-based landscape representation are spatial metrics initially introduced in landscape ecology [42].
Six classes of artificial surfaces, the ‘urban fabric’, define built-up stages so they can be used instead of land-use classes as land cover. There are five different classes for transport (fast transit roads, other roads, railroads, ports, and airports) and six for other purposes (including industrial, commercial, public, mineral mines, building fields, property, vacant land, green urban areas, and recreational/sporting facilities) [42].
Within the scope of the second phase of the analysis workflow, we re-grouped the UA classes under four umbrella classes, as shown in Table 1: artificial, semi-artificial, semi-natural, and natural. This re-classification makes the spatiotemporal comparison easier and more understandable.

2.4. Effective Mesh Size as a Spatial Metric

Spatial metrics are used to describe landscape indices that can be used to compare the structures of different cities. The spatial and landscape metrics (LM) analysis of urban environments has become increasingly relevant in the last two decades [43] to investigate specific intra- and intercity systemic spatial elements and the dynamics of development [37]. Spatial metrics are factors that assess the patterns of LULC in the territory. They are classified as mathematical expressions of patch features, such as field, perimeter, geometries (form), and urban relativity. Patches in all land use classes are determined by analysis; thus, a feature of land use trends in the entire urban area is represented with a common indicator [37].
The utility of LM in understanding urban and natural systems is expanding beyond the assessment of the physical structure of the land. The recent literature reports that the usage of LM for further understanding phenomena related to the environment, LULC transformation, ecosystem services, spatiotemporal dynamics in land uses, and many others have expanded [43]. Thus, selecting the most suitable LM for the scope and objectives of a specific study remains a challenge.
In this study, we decided to use the LM of effective mesh size (meff) as it delivers meaningful information for assessing landscape fragmentation as a key phenomenon of local and regional planning [44]. The meff method has already been applied in various developed countries, such as USA, France, Germany, and Switzerland. However, similar studies are rare in developing regions such as the Western Balkans, where LULC transformations are at critical rates. To our knowledge, the study by Hasa et al. [45] is the only work that reports the application of meff to assess the LF in Albania, utilizing CLC data at a national level. CLC data have also been used for assessing the landscape fragmentation caused by the local administrative boundaries in Albania [46], while studies focusing on a metropolitan scale that utilizes high-resolution geospatial data, such as UA, are lacking.
Initially, meff is an LM developed and introduced by Jaeger [26]. It relies on the probability that two distinctive point locations are connectable and not separated by obstacles (such as human infrastructure or natural elements) [47]. In other words, it can be defined as the mean area within the landscape mosaic that is fully accessible by a species randomly located in the landscape. Furthermore, meff quantifies both inter- (among patches) and intra- (within a single patch) connectivity within a landscape mosaic [48] and is calculated according to Equation (1). A recent study has shown that meff is a reliable LM for urban studies, as shown in the case study comparing Lisbon and Montreal [49].
m = 1 A t i = 1 n A i 2
where m represents meff; n represents the patches quantity; A1 and An represent the sizes of each patch from 1st to nth patch, respectively; and At represents the total area of the studied landscape mosaic.

3. Results

Our results report the LF assessment and comparative spatiotemporal analysis of landscape dynamics using QGIS 3.10 software, performed in three phases: (i) general statistical analysis of regional metropolitan area by the distribution of each Urban Atlas class for the selected city; (ii) comparing them in the 2012–2018 years; and (iii) showing the differences of these years focusing on the peri-urban and urban areas of each city. In addition to the comparative part, we performed a more detailed LF assessment for the case of Tirana based on the meff metric. In this phase, a statistical comparison was calculated according to the number of patches and total area for each category.

3.1. First Phase

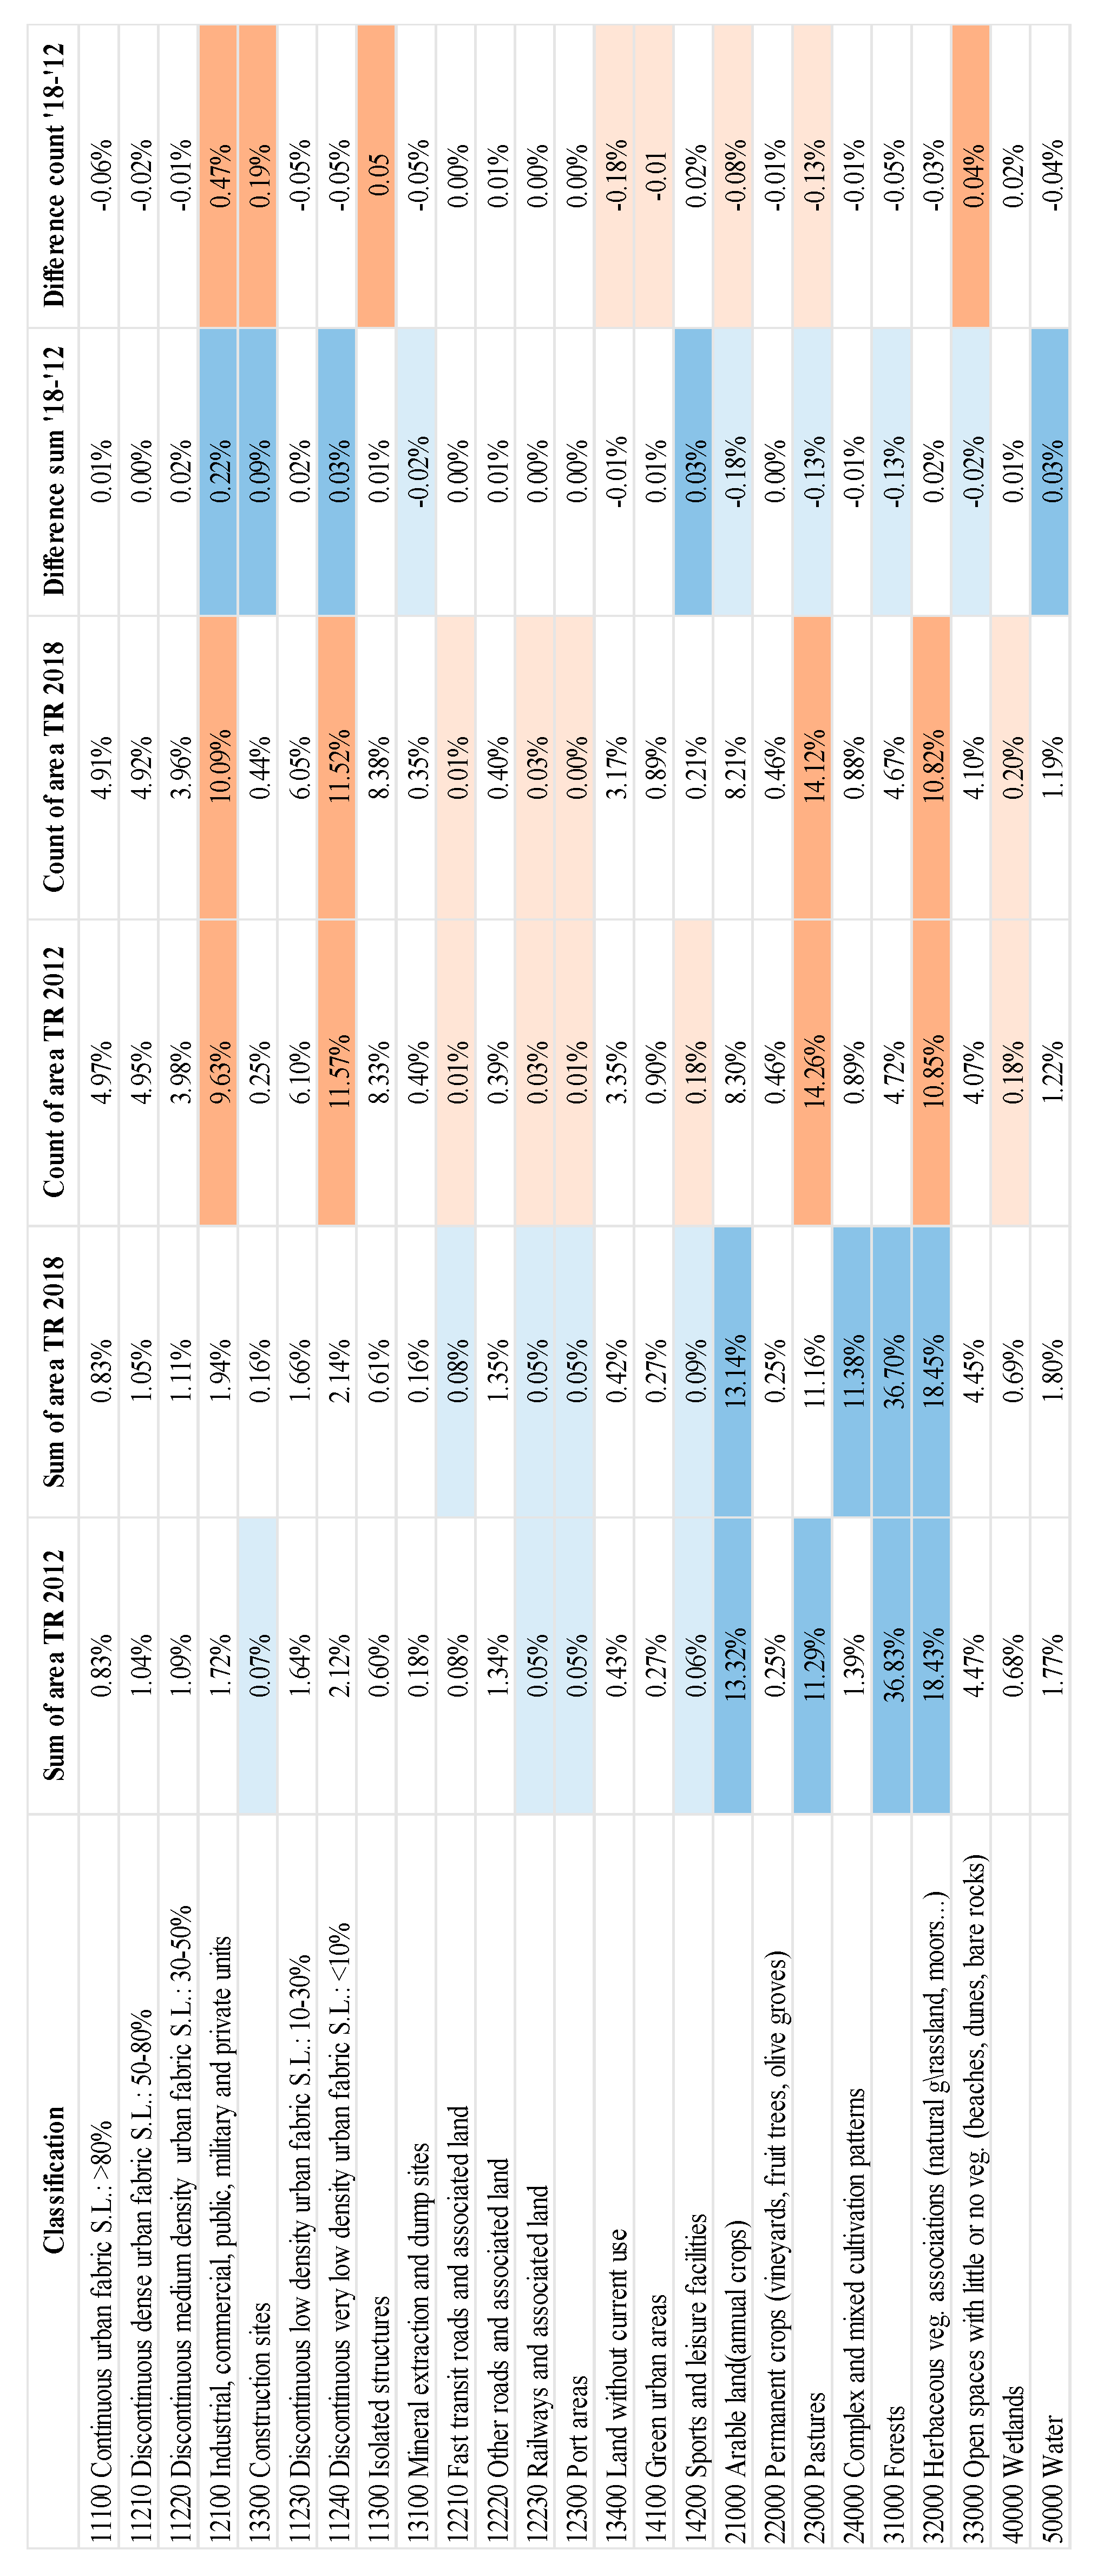
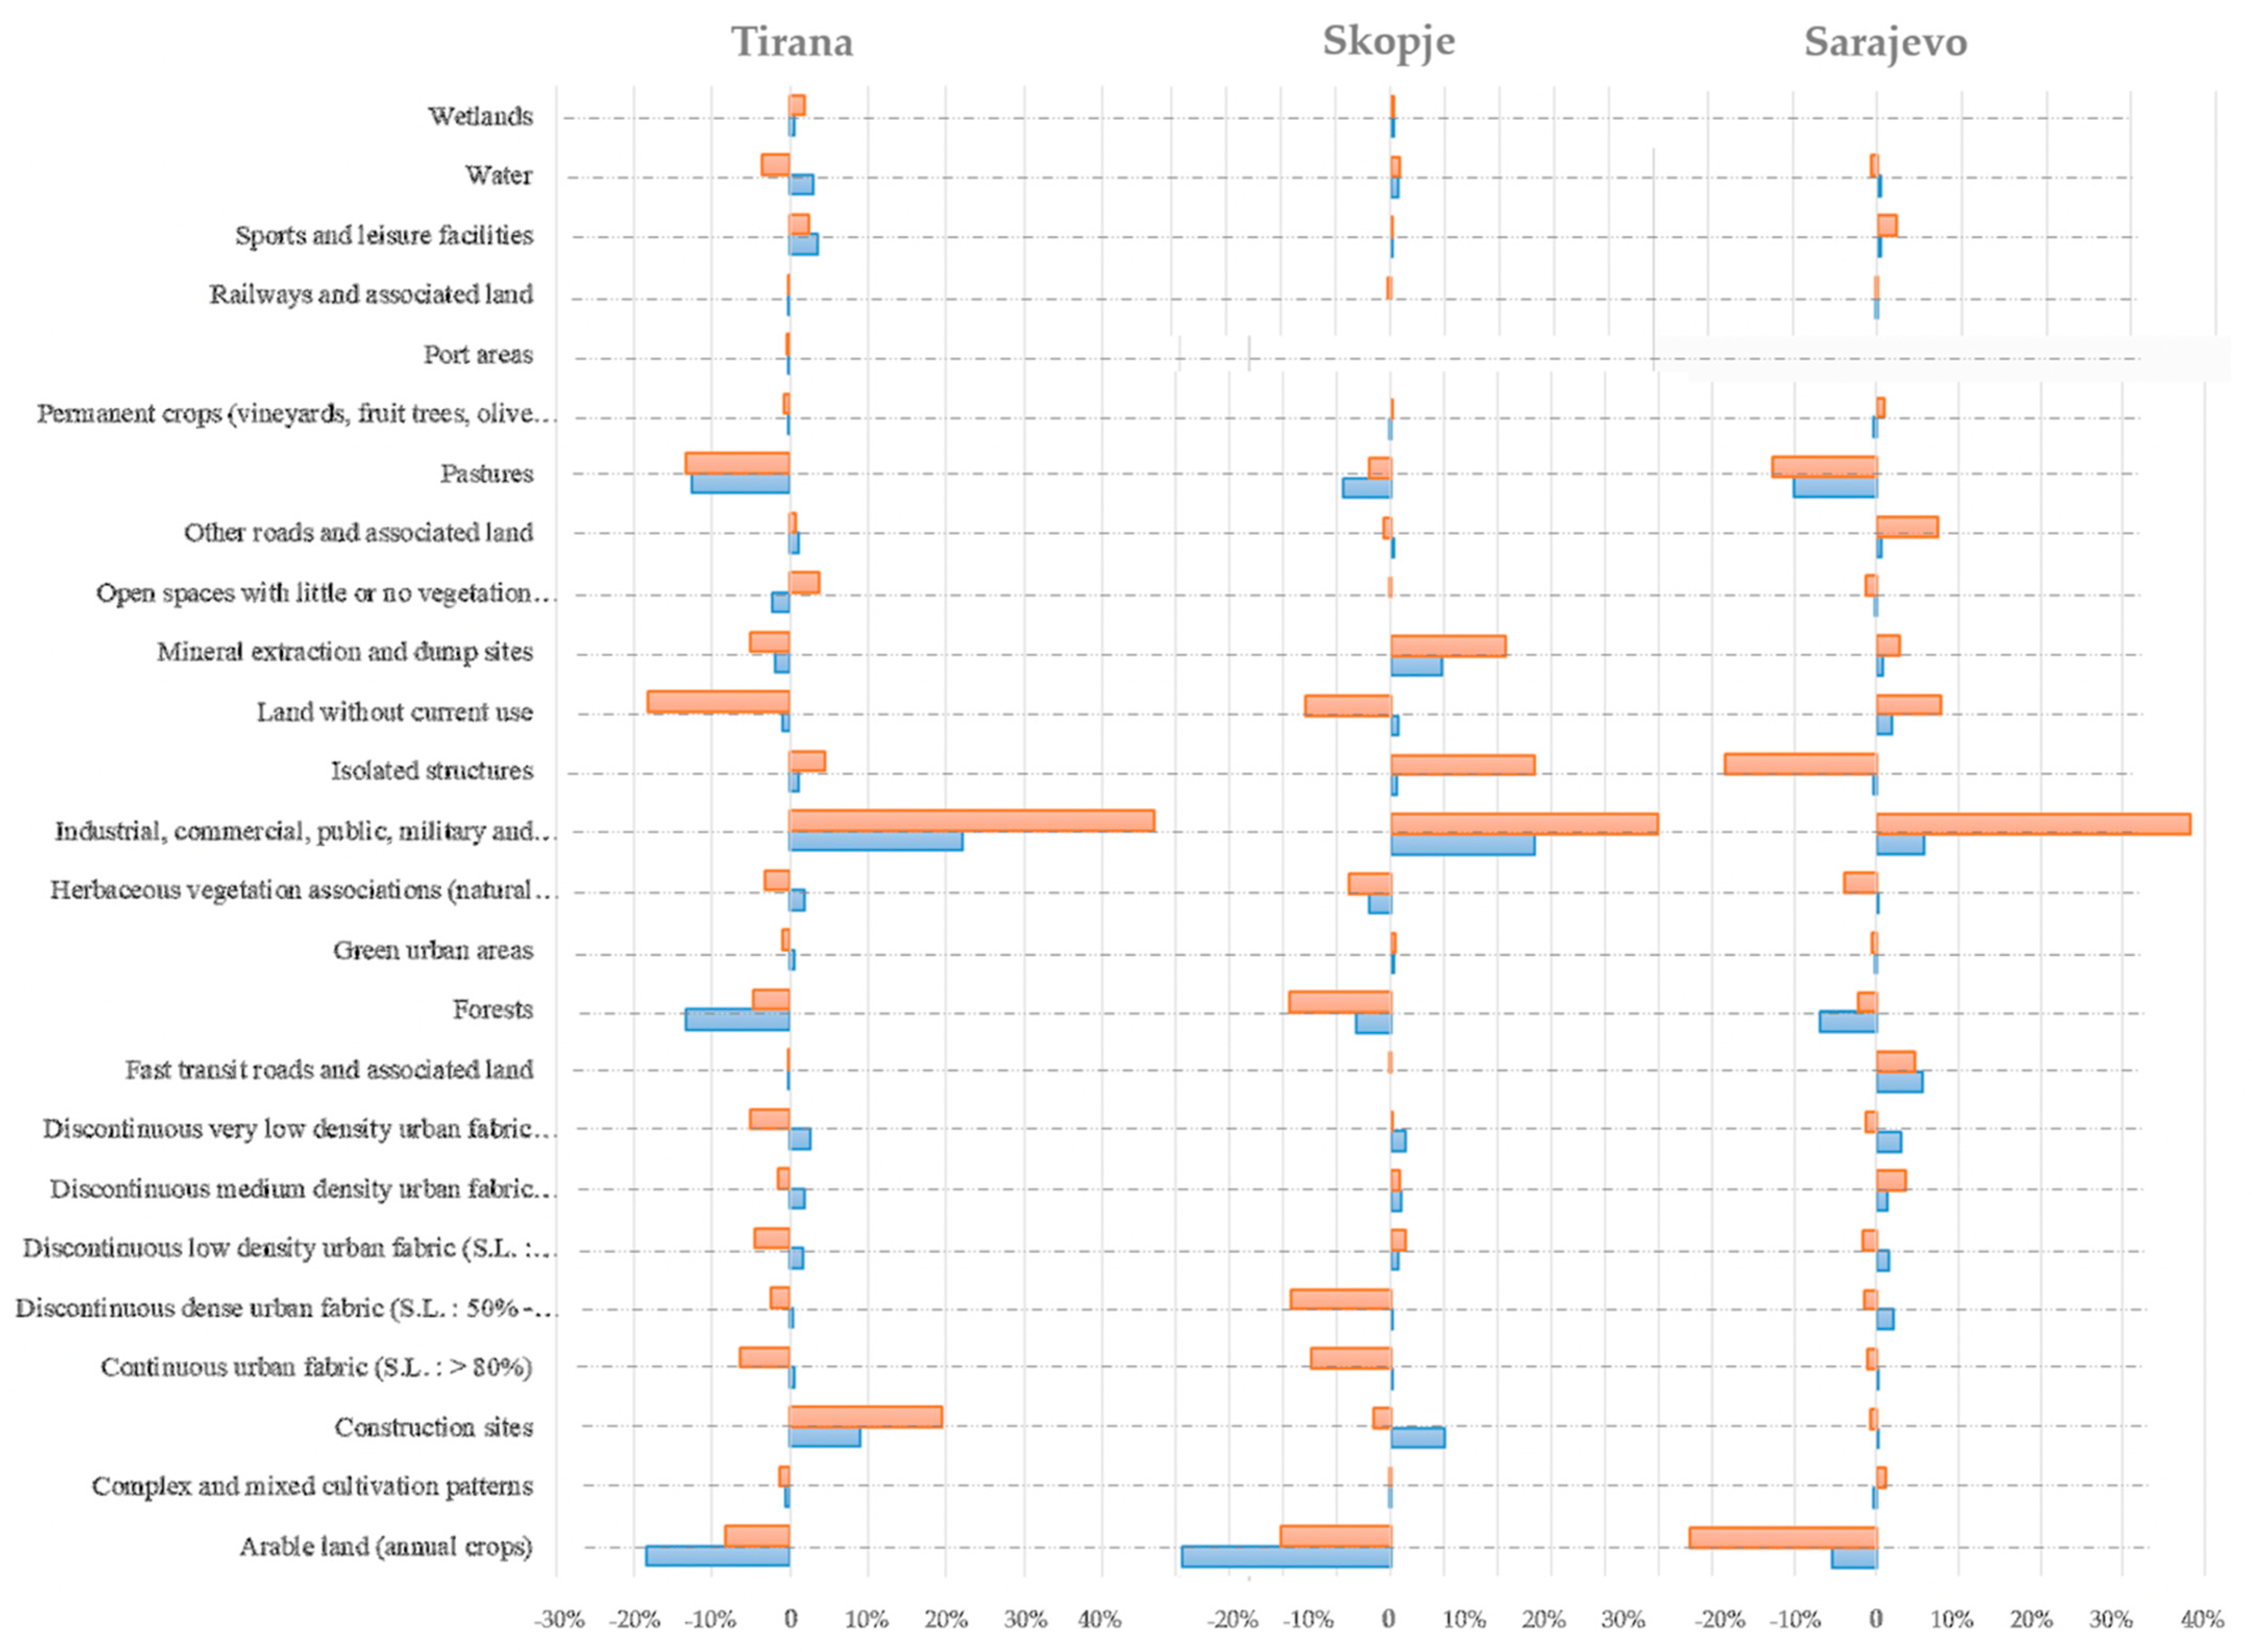
First, we assessed the LULC transformation dynamics by comparing UA data from 2012 and 2018. The chart shown in Figure 4 represents the change in percentage for each UA class in patch amount and surface area. In the case of Tirana, forests have the highest percentage value of 36.83% in 2012 and 36.7% in 2018 as total area. On the other hand, forest patches count for 4.72% in 2012 and 4.67% in 2018 of the total patches within the study area. Both above-mentioned records imply that forest areas have large geometries, and they are relatively better-connected. Railways and associated land have the lowest value of 5% of the total area in both 2012 and 2018, followed by sport and leisure facilities at 6% in 2012 and an increasing value of 9% in 2018, while also, in some geometries, they have the lowest values. We provide the full records of the total area and count of patches of Tirana for 2012–2018 in Figure A1. According to the comparison chart between 2012 and 2018 (Figure 4), industrial, commercial, public, military, and private units’ surface areas increased by 22%, while their patch amount increased by 47%.
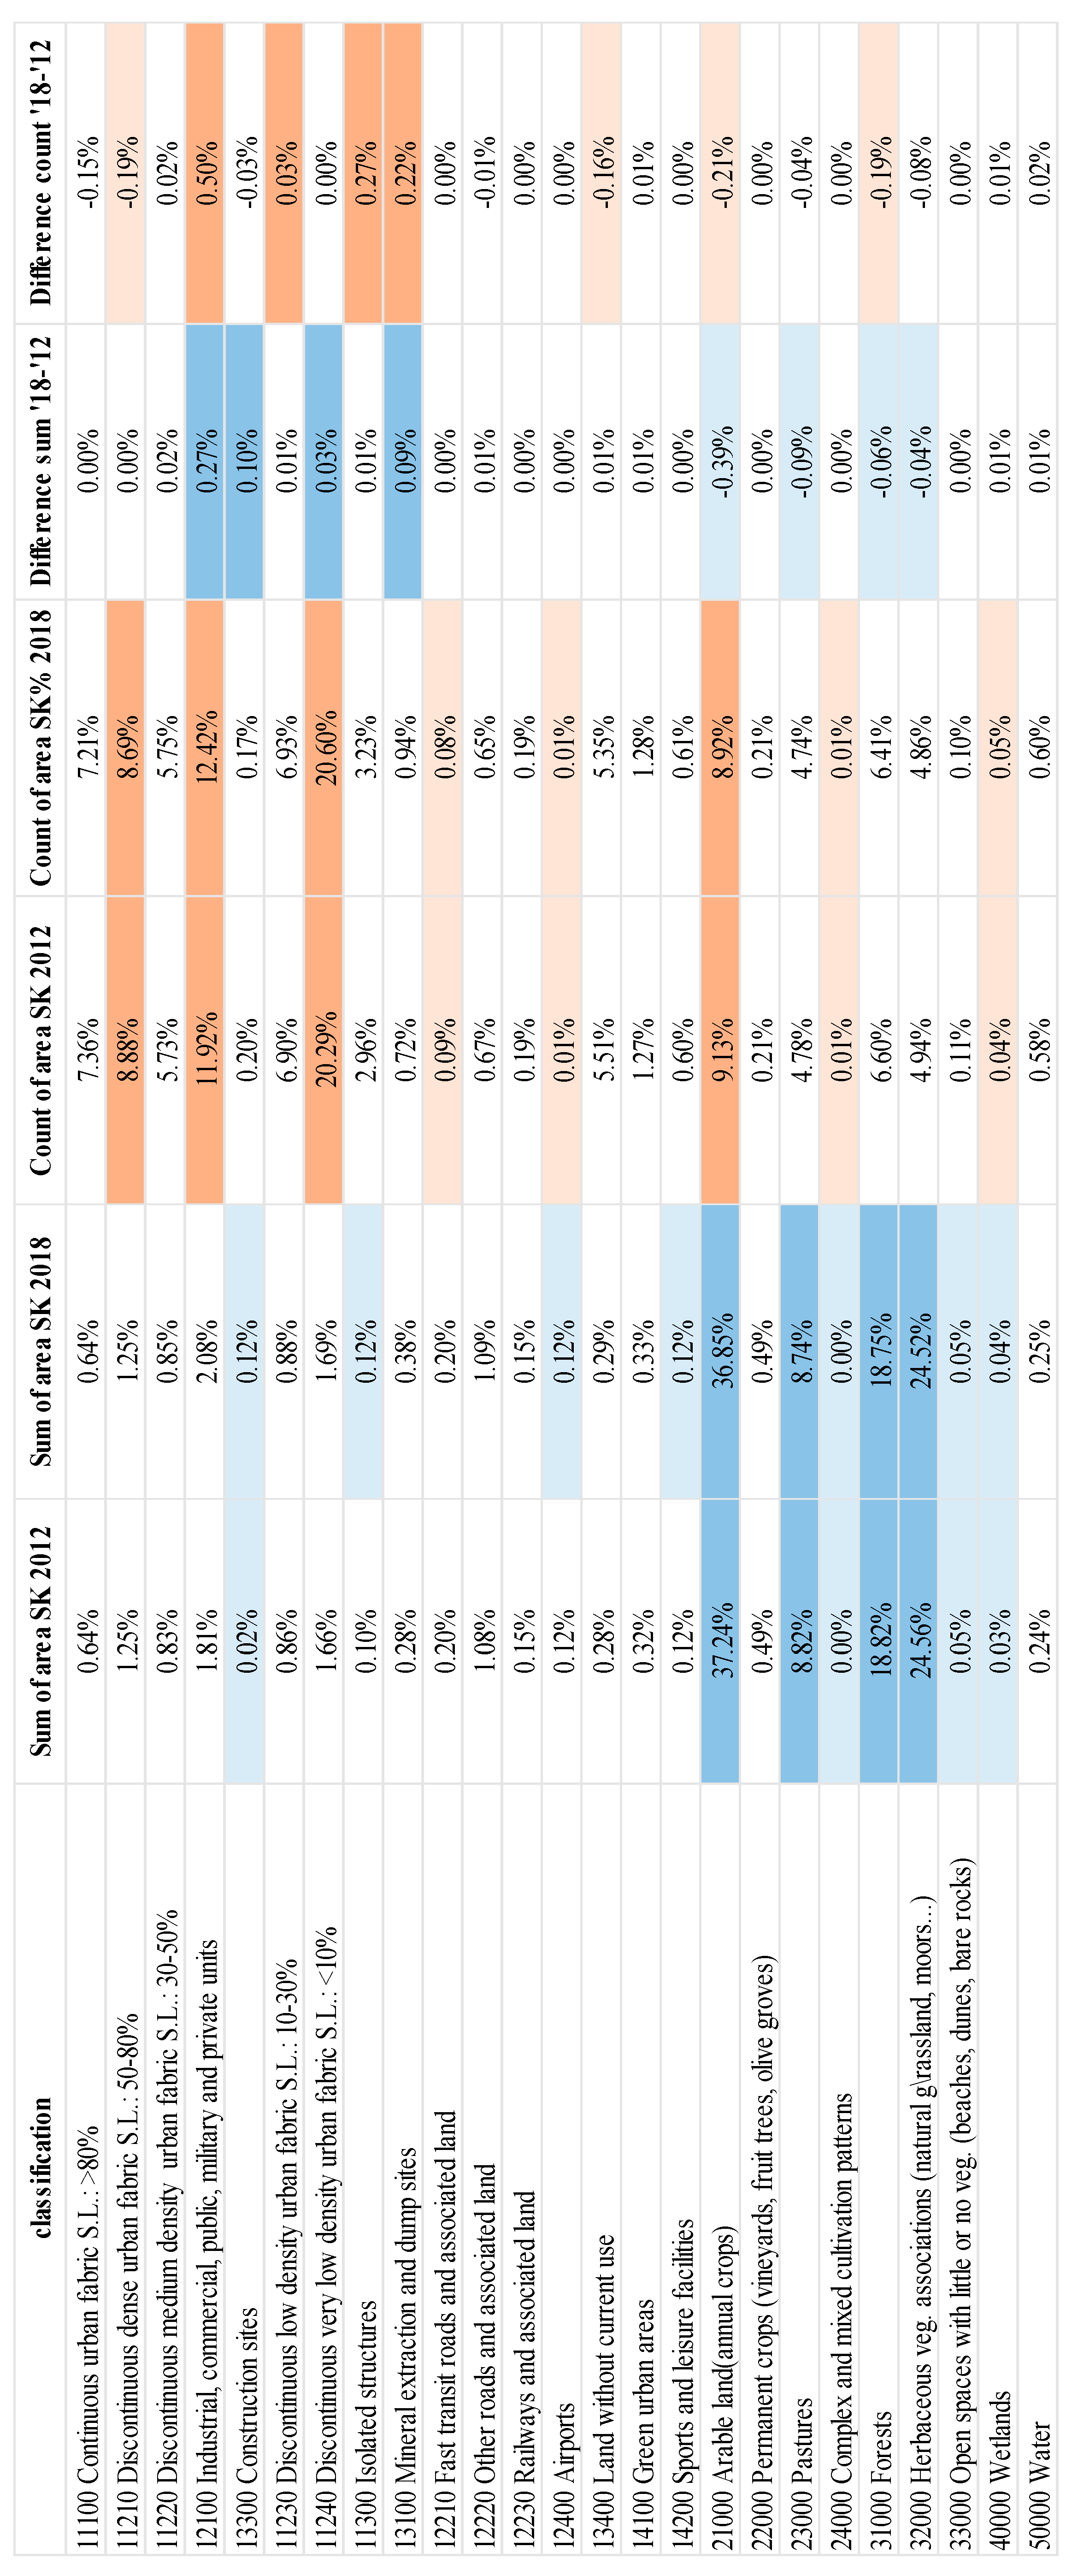
In the case of Skopje, the highest values of the total area belong to the agricultural areas. The highest is arable land scoring 37.24% in 2012 and 36.85% in 2018. Herbaceous vegetation associations and forests follow agricultural land. At the same time, the lowest values are for complex and mixed cultivation patterns and construction sites. On the other hand, the highest value of patch amount is recorded by discontinuous, very low-density urban fabric S.L.: <10%, with 20.29% in 2012 and 20.6% in 2018.
In comparison, the lowest number of patches belongs to complex and mixed cultivation patterns and wetlands. According to the comparison between 2012 and 2018 (Figure 4), we have an increase of 27% in surface area values of industrial, commercial, public, military, and private units. They are followed by construction sites, which score an increase in surface area by 10%. On the other hand, the surface area of land covers, such as arable land, pastures, and forests, decreased, similar to Tirana’s case. Figure A2 shows detailed information about the total area and count of patches of Skopje for both years and the comparison between them.
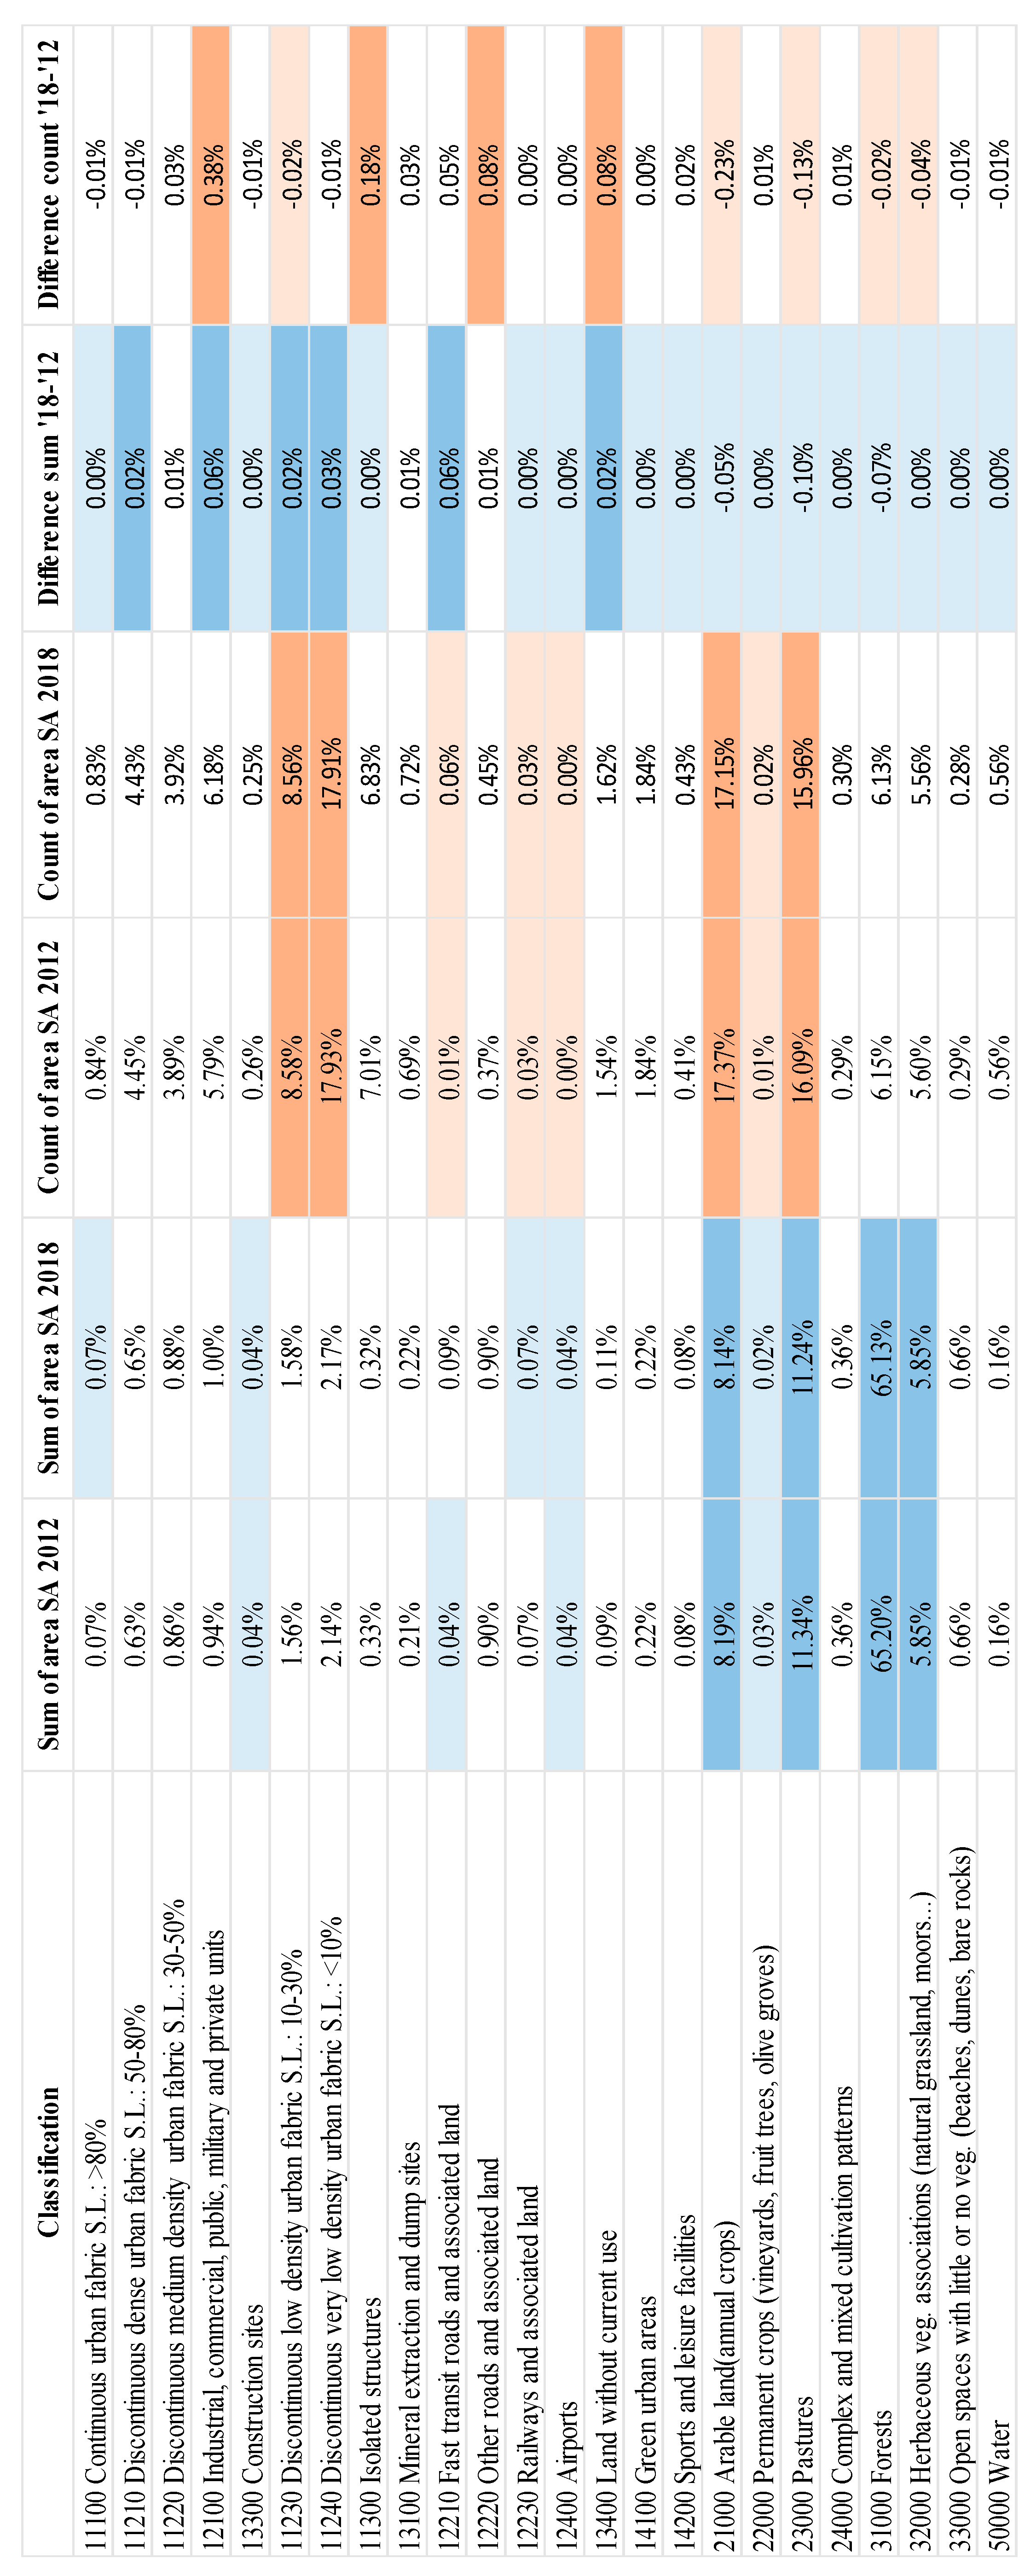
The lowest surface area values belong to construction sites, fast transit roads, and associated land and permanent crops in 2012, while for 2018, the lowest surface area belongs to permanent crops, followed by construction sites, continuous urban fabric S.L.: >80%, and railways. On the other hand, the records based on the patch count report that the highest value belongs to discontinuous, very low-density urban fabric S.L.: <10%, scoring 17.93% in 2012 and 17.91% in 2018, while permanent crops, fast transit roads, and railways have the lowest amount of patch geometries.
According to the comparison between 2012 and 2018 (Figure 4), we obtained similar results to Tirana and Skopje, as the land surface area of industrial, commercial, public, military, and private units face an increase of 27%. They are followed by fast transit roads (increasing by 6%), while pastures, forests and arable land face a decrease in surface area. Figure A3 shows the results of the total area and count of patches for Sarajevo regarding 2012 and 2018. Figure 4 reports all comparative results by total area and count of patches for each class for 2012 and 2018.

3.2. Second Phase

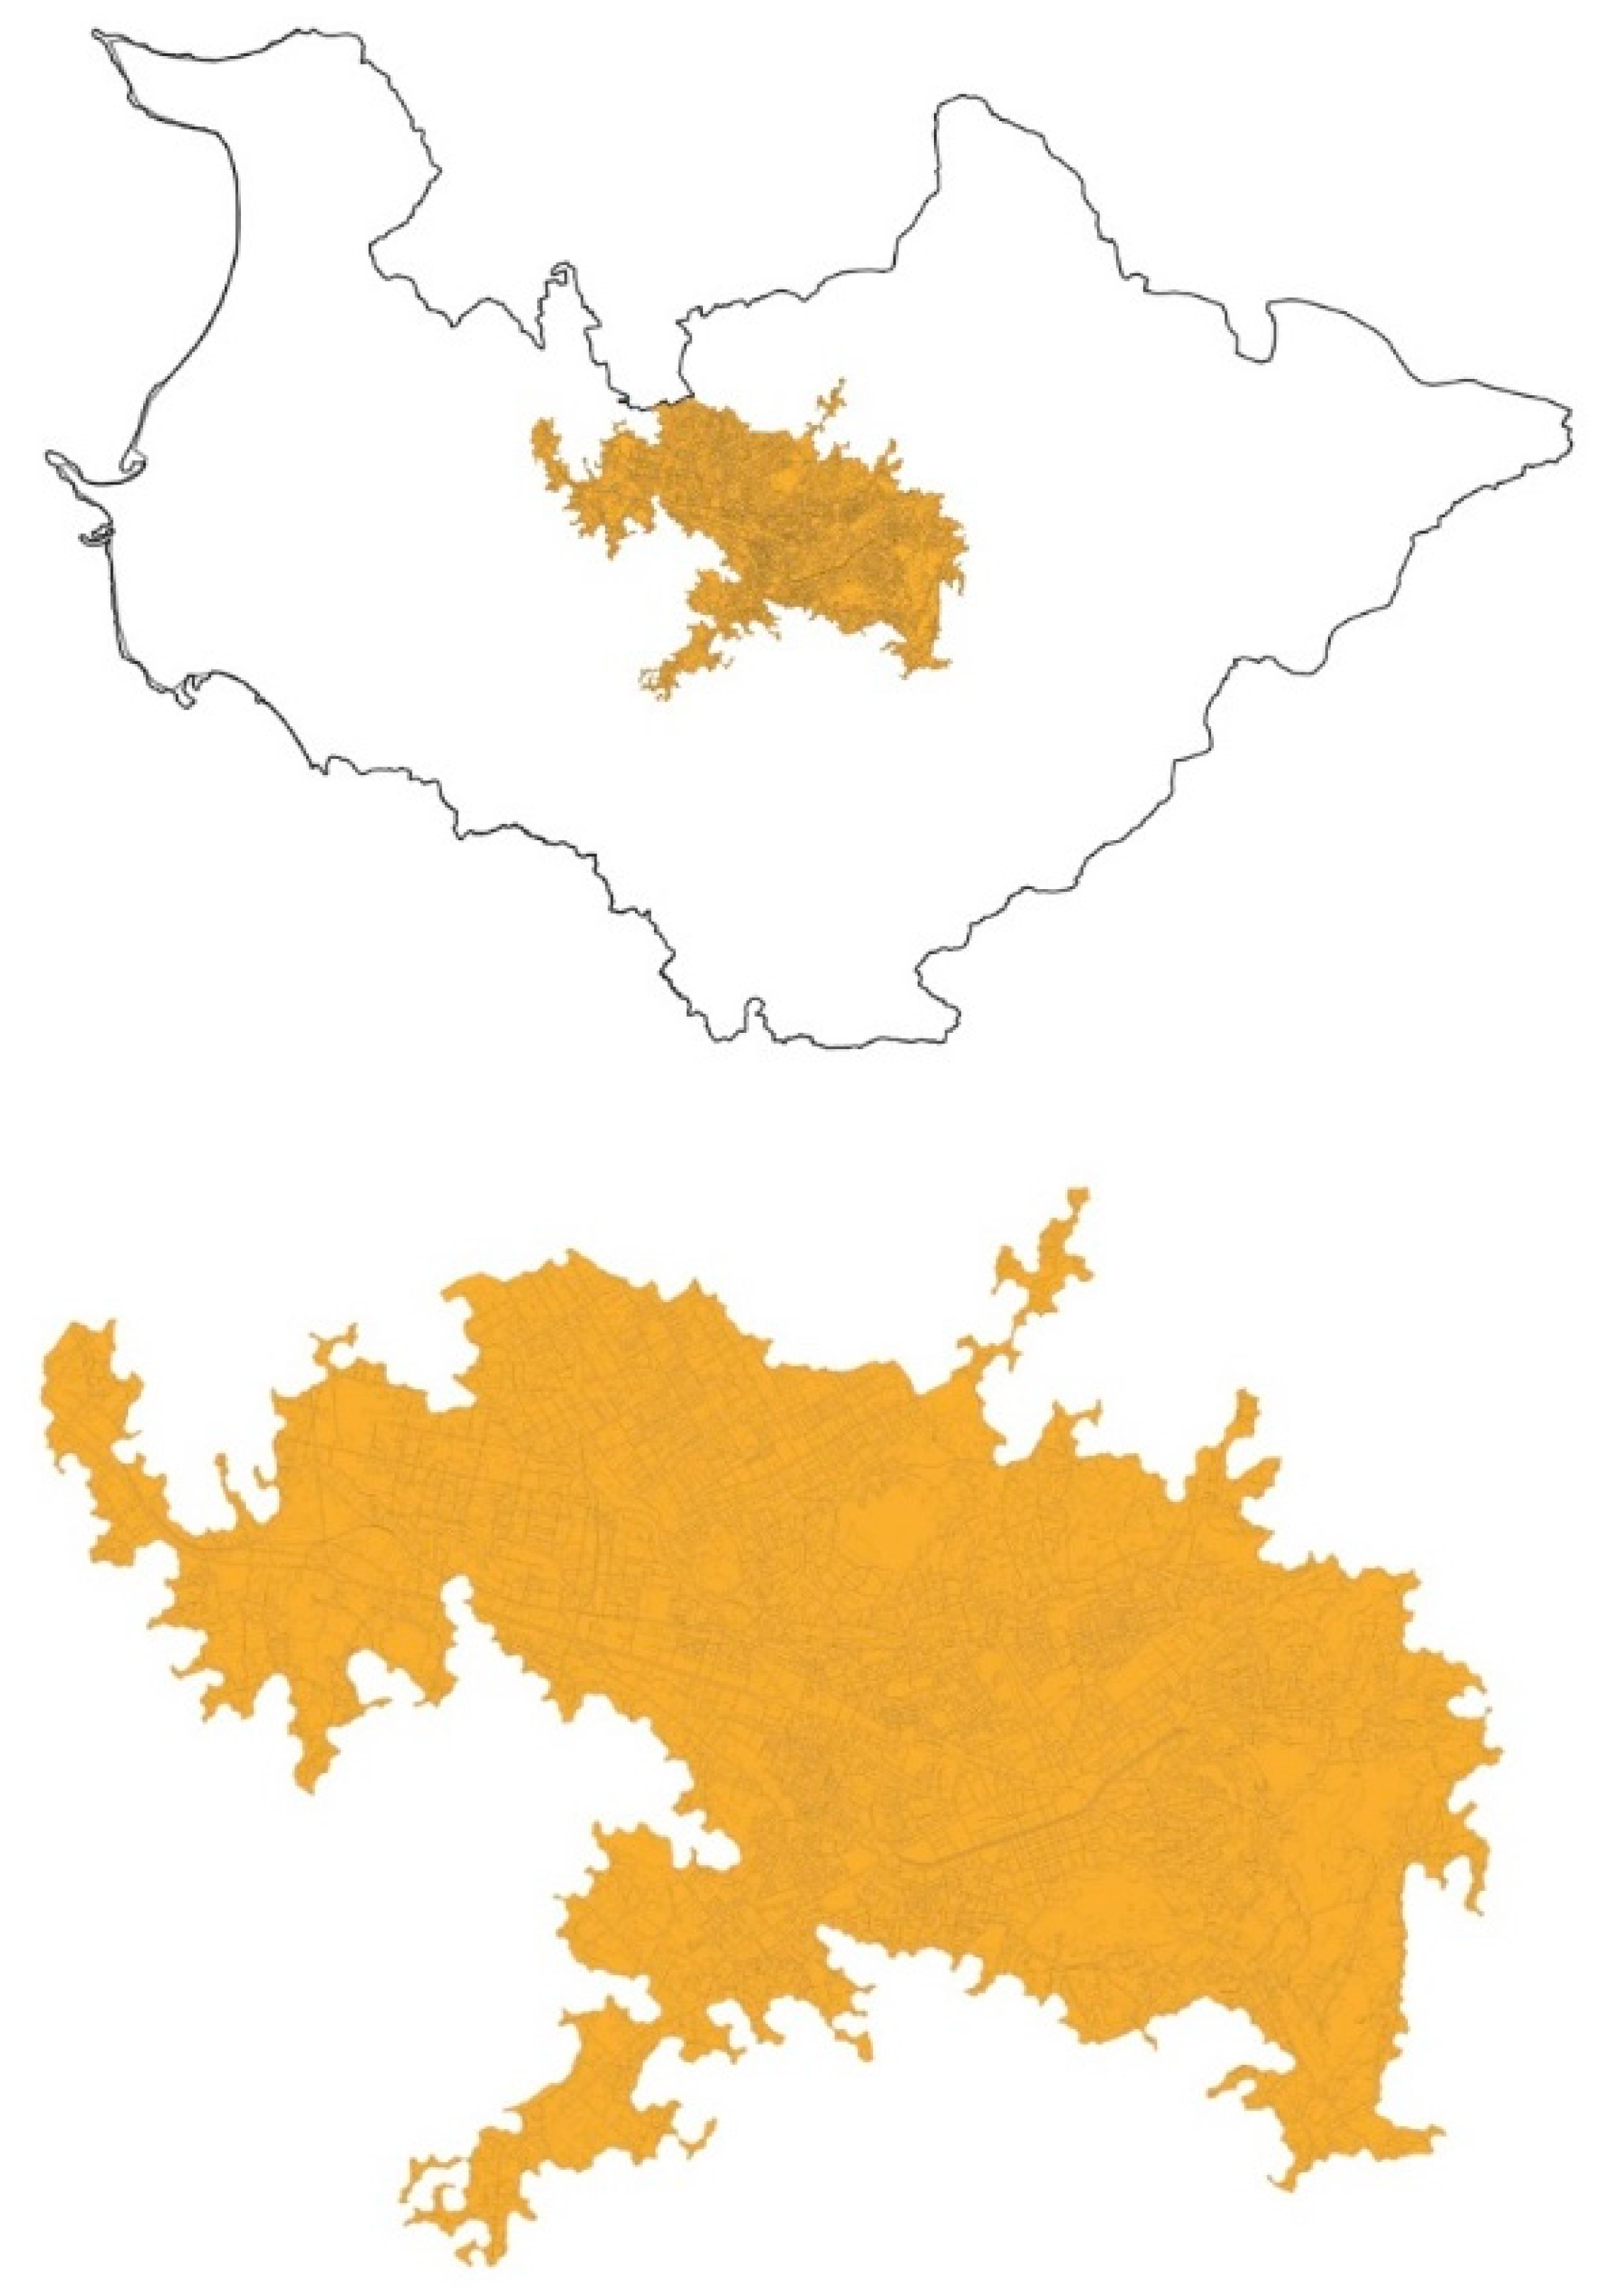
In the second phase, we focused on each city’s urban and peri-urban areas. First, we defined the urban core based on the UA database as explained in the Methods Section. We searched for the surrounding areas, which are in the closest vicinity (within 100 m distance). This procedure helped to define smaller study areas within the UA metropolitan boundary, as shown in Figure 5. Since all three cities are developing, present-day peri-urban zones have become intimately bound-up with notions of (more) sustainable urbanization and urban development.
Moreover, since each city has a different urban sprawl direction and intensity, the study areas are different in shape and area. The following comparative results rely on the re-classification into four categories: artificial, semi-artificial, semi-natural, and natural (see Table 1). According to Figure 6, all three cities experienced a significant increase in artificial surfaces between 2012 and 2018 (see Figure A4). Similarly, they all faced a remarkable decrease in natural surfaces. However, while the semi-natural surfaces of Skopje and Sarajevo decreased, they significantly increased in the case of Tirana.
The chart in Figure 6 shows the comparative results making the among between the three cities clearer. In Tirana, we have an increasing value of 218 ha in semi-natural areas, followed by 184 ha in artificial areas, 9 ha in semi-artificial areas, and a decreasing value of 220 ha for natural areas. Skopje also increased in artificial and semi-artificial areas by 566 ha and 120 ha, respectively. However, unlike Tirana, the semi-natural areas of Skopje decreased by 593 ha, and natural areas increased by 965 ha. On the other hand, Sarajevo has the highest decreasing value in natural areas at 250 ha, followed by semi-natural areas at 17 ha. Additionally, it has increasing values for the artificial and semi-artificial areas, at 168 ha and 57 ha, respectively. According to Figure 6, we can observe that Skopje has the highest increase in artificial areas and the highest decrease in semi-natural and natural areas.

3.3. Third Phase

After the analysis at the urban level, the third phase of the analysis focused only on Tirana’s urban area by calculating the meff metric. At this stage, we extracted only the natural areas of the urban core based on the previous phase. This stage aimed to perform a meff analysis and assess the fragmentation level among natural surfaces within Tirana’s urban area (Figure 7).
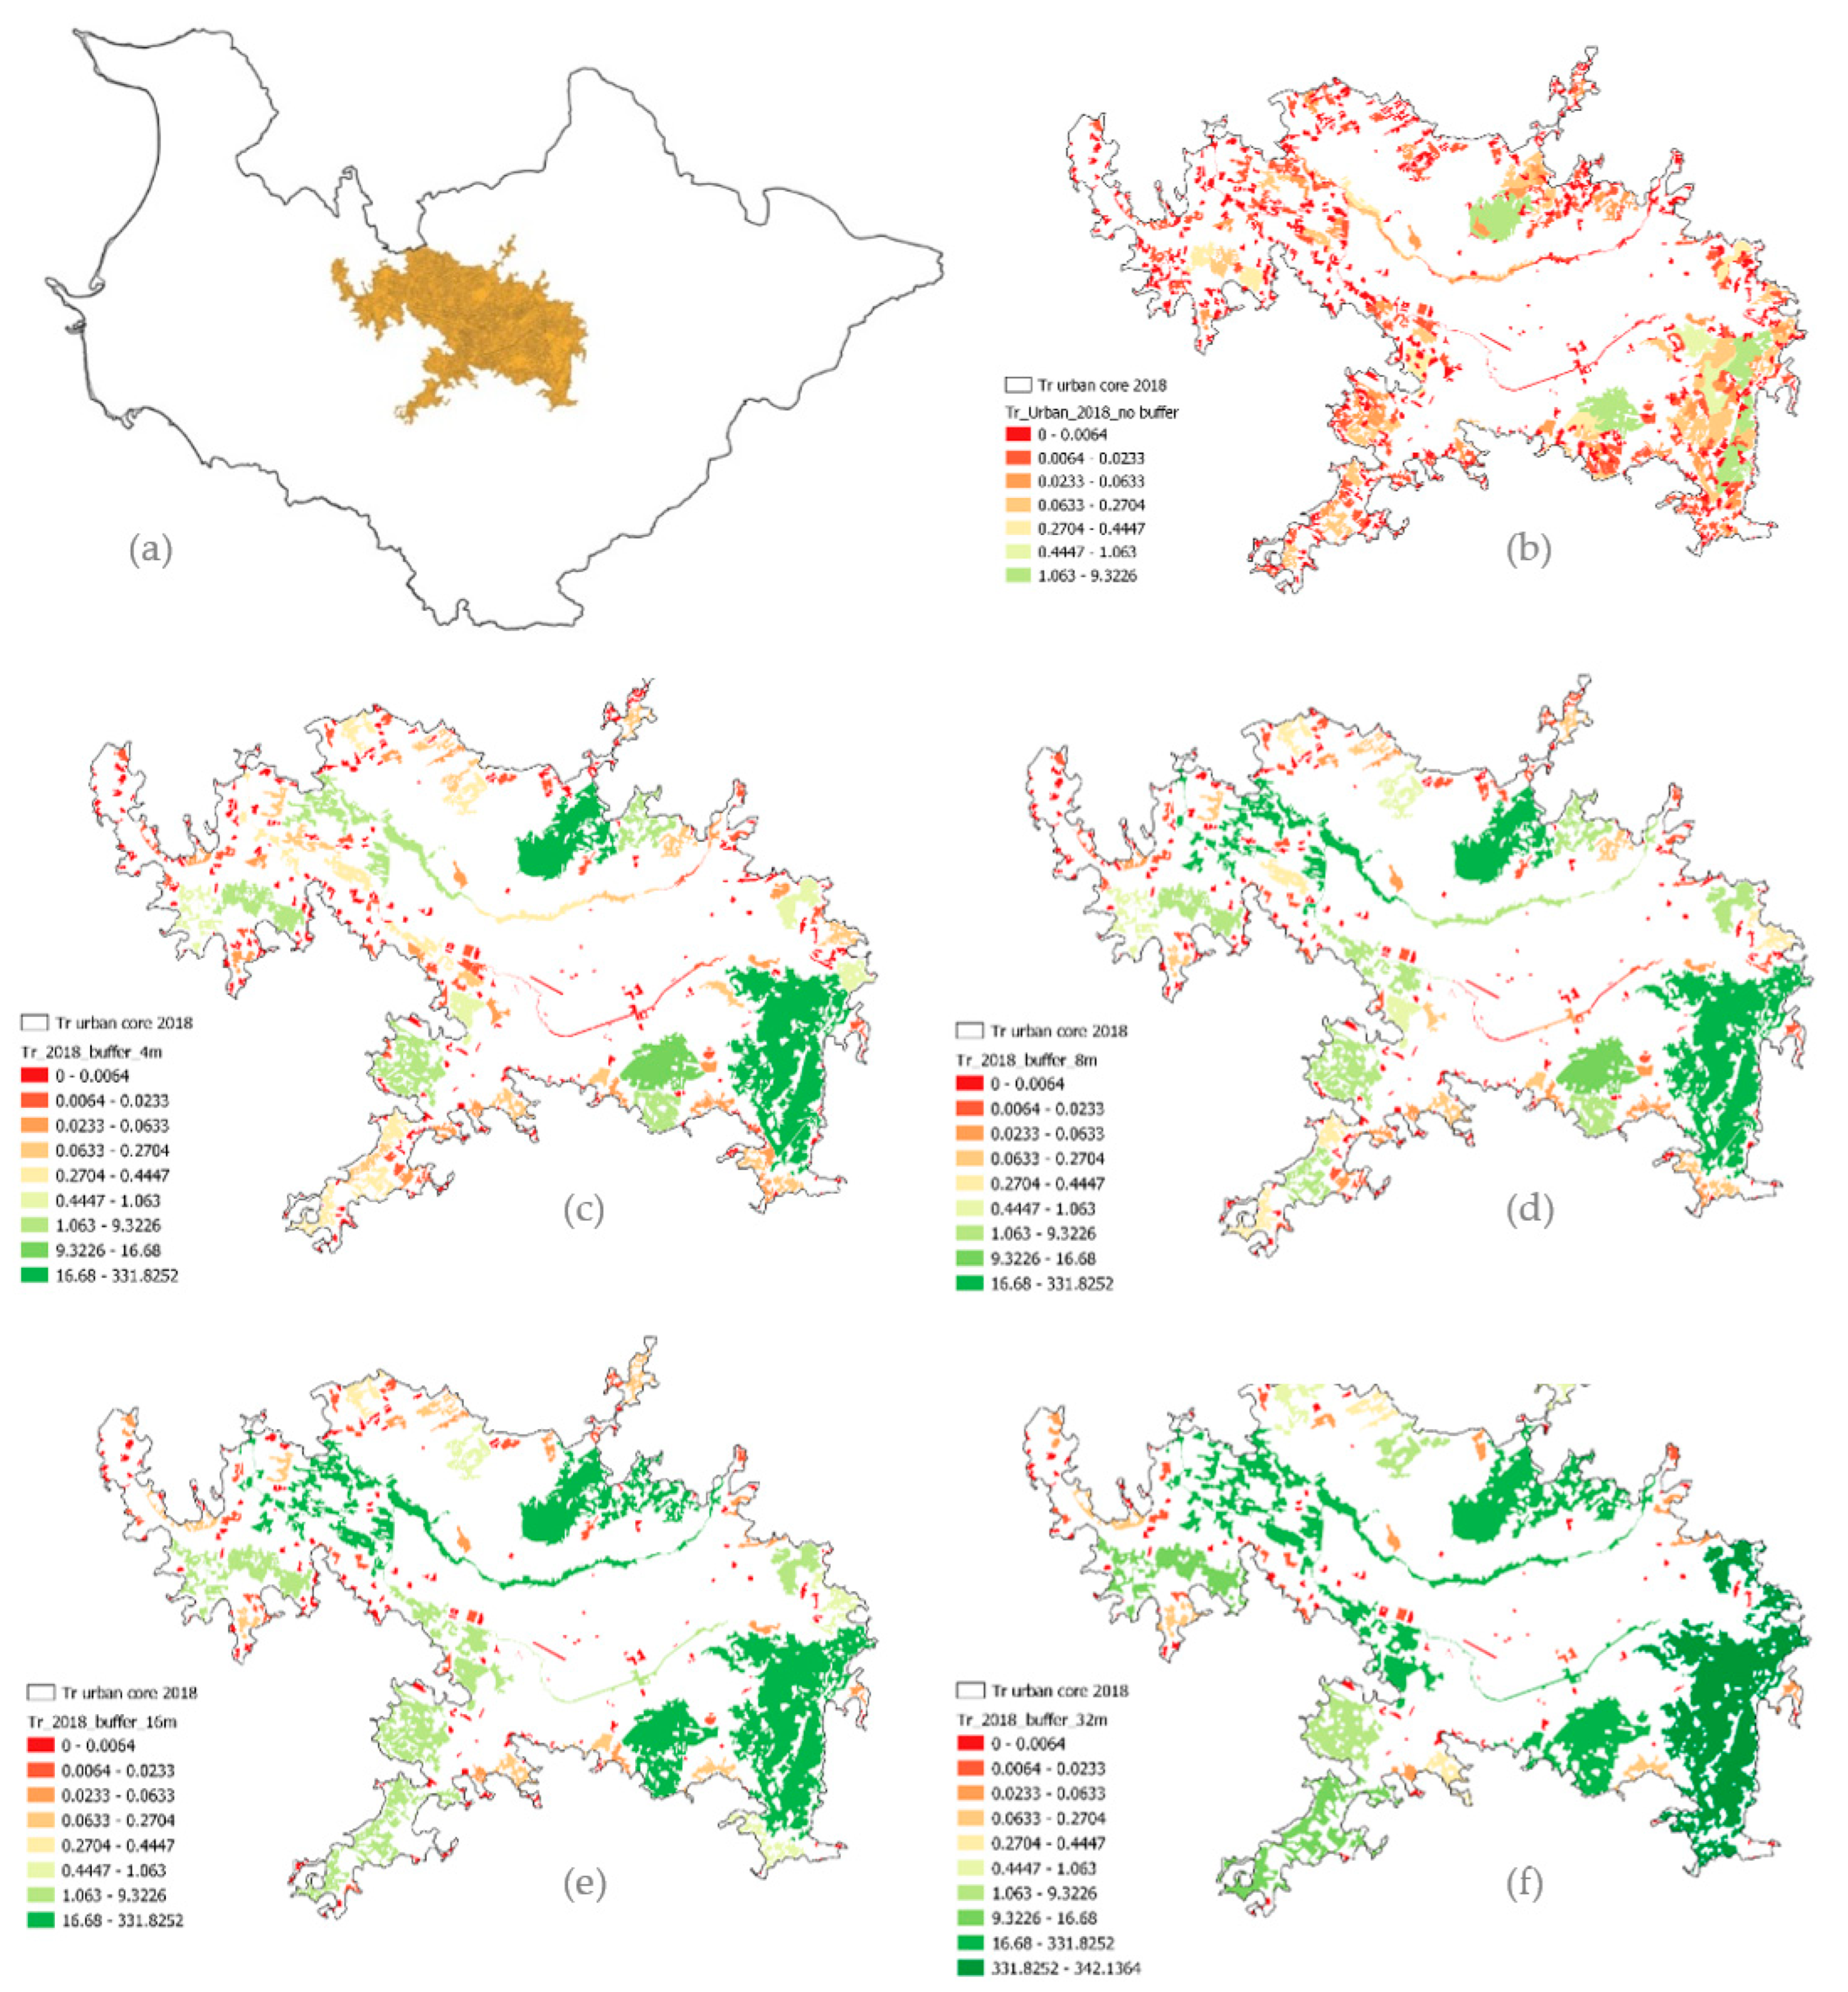
The meff procedure was performed in five connectivity levels (buffers), according to different road widths as briefly explained in Section 2.2. It relies on the fact that the transportation network is the main fragmenting agent in the urbanized landscapes. We applied the procedure for both 2012 and 2018 to understand the trend in landscape fragmentation among natural surfaces in the urbanized Tirana. Figure 8 shows the mapping results of the five-level meff calculation for 2018.
Table 2 reports numerical data about the meff results for 2012 and 2018. The visual results of Figure 8 are aligned with the numerical results shown in Table 2. For instance, there is a continuous increase in meff from level 1 to level 5. The highest increase occurs between level 1 and level 2. Consequently, we can determine that narrow roads (small-sized) are Tirana’s main natural-landscape-fragmenting agents. Following the same results, we conclude that the fragmentation among natural surfaces within urbanized Tirana increased in 2018 compared to 2012. This is evident when comparing all three parameters, the total area values, the total meff, and the total number of geometries. This may indicate an increase in the investments in transportation infrastructure and new building construction within the analyzed six-year period (2012–2018).
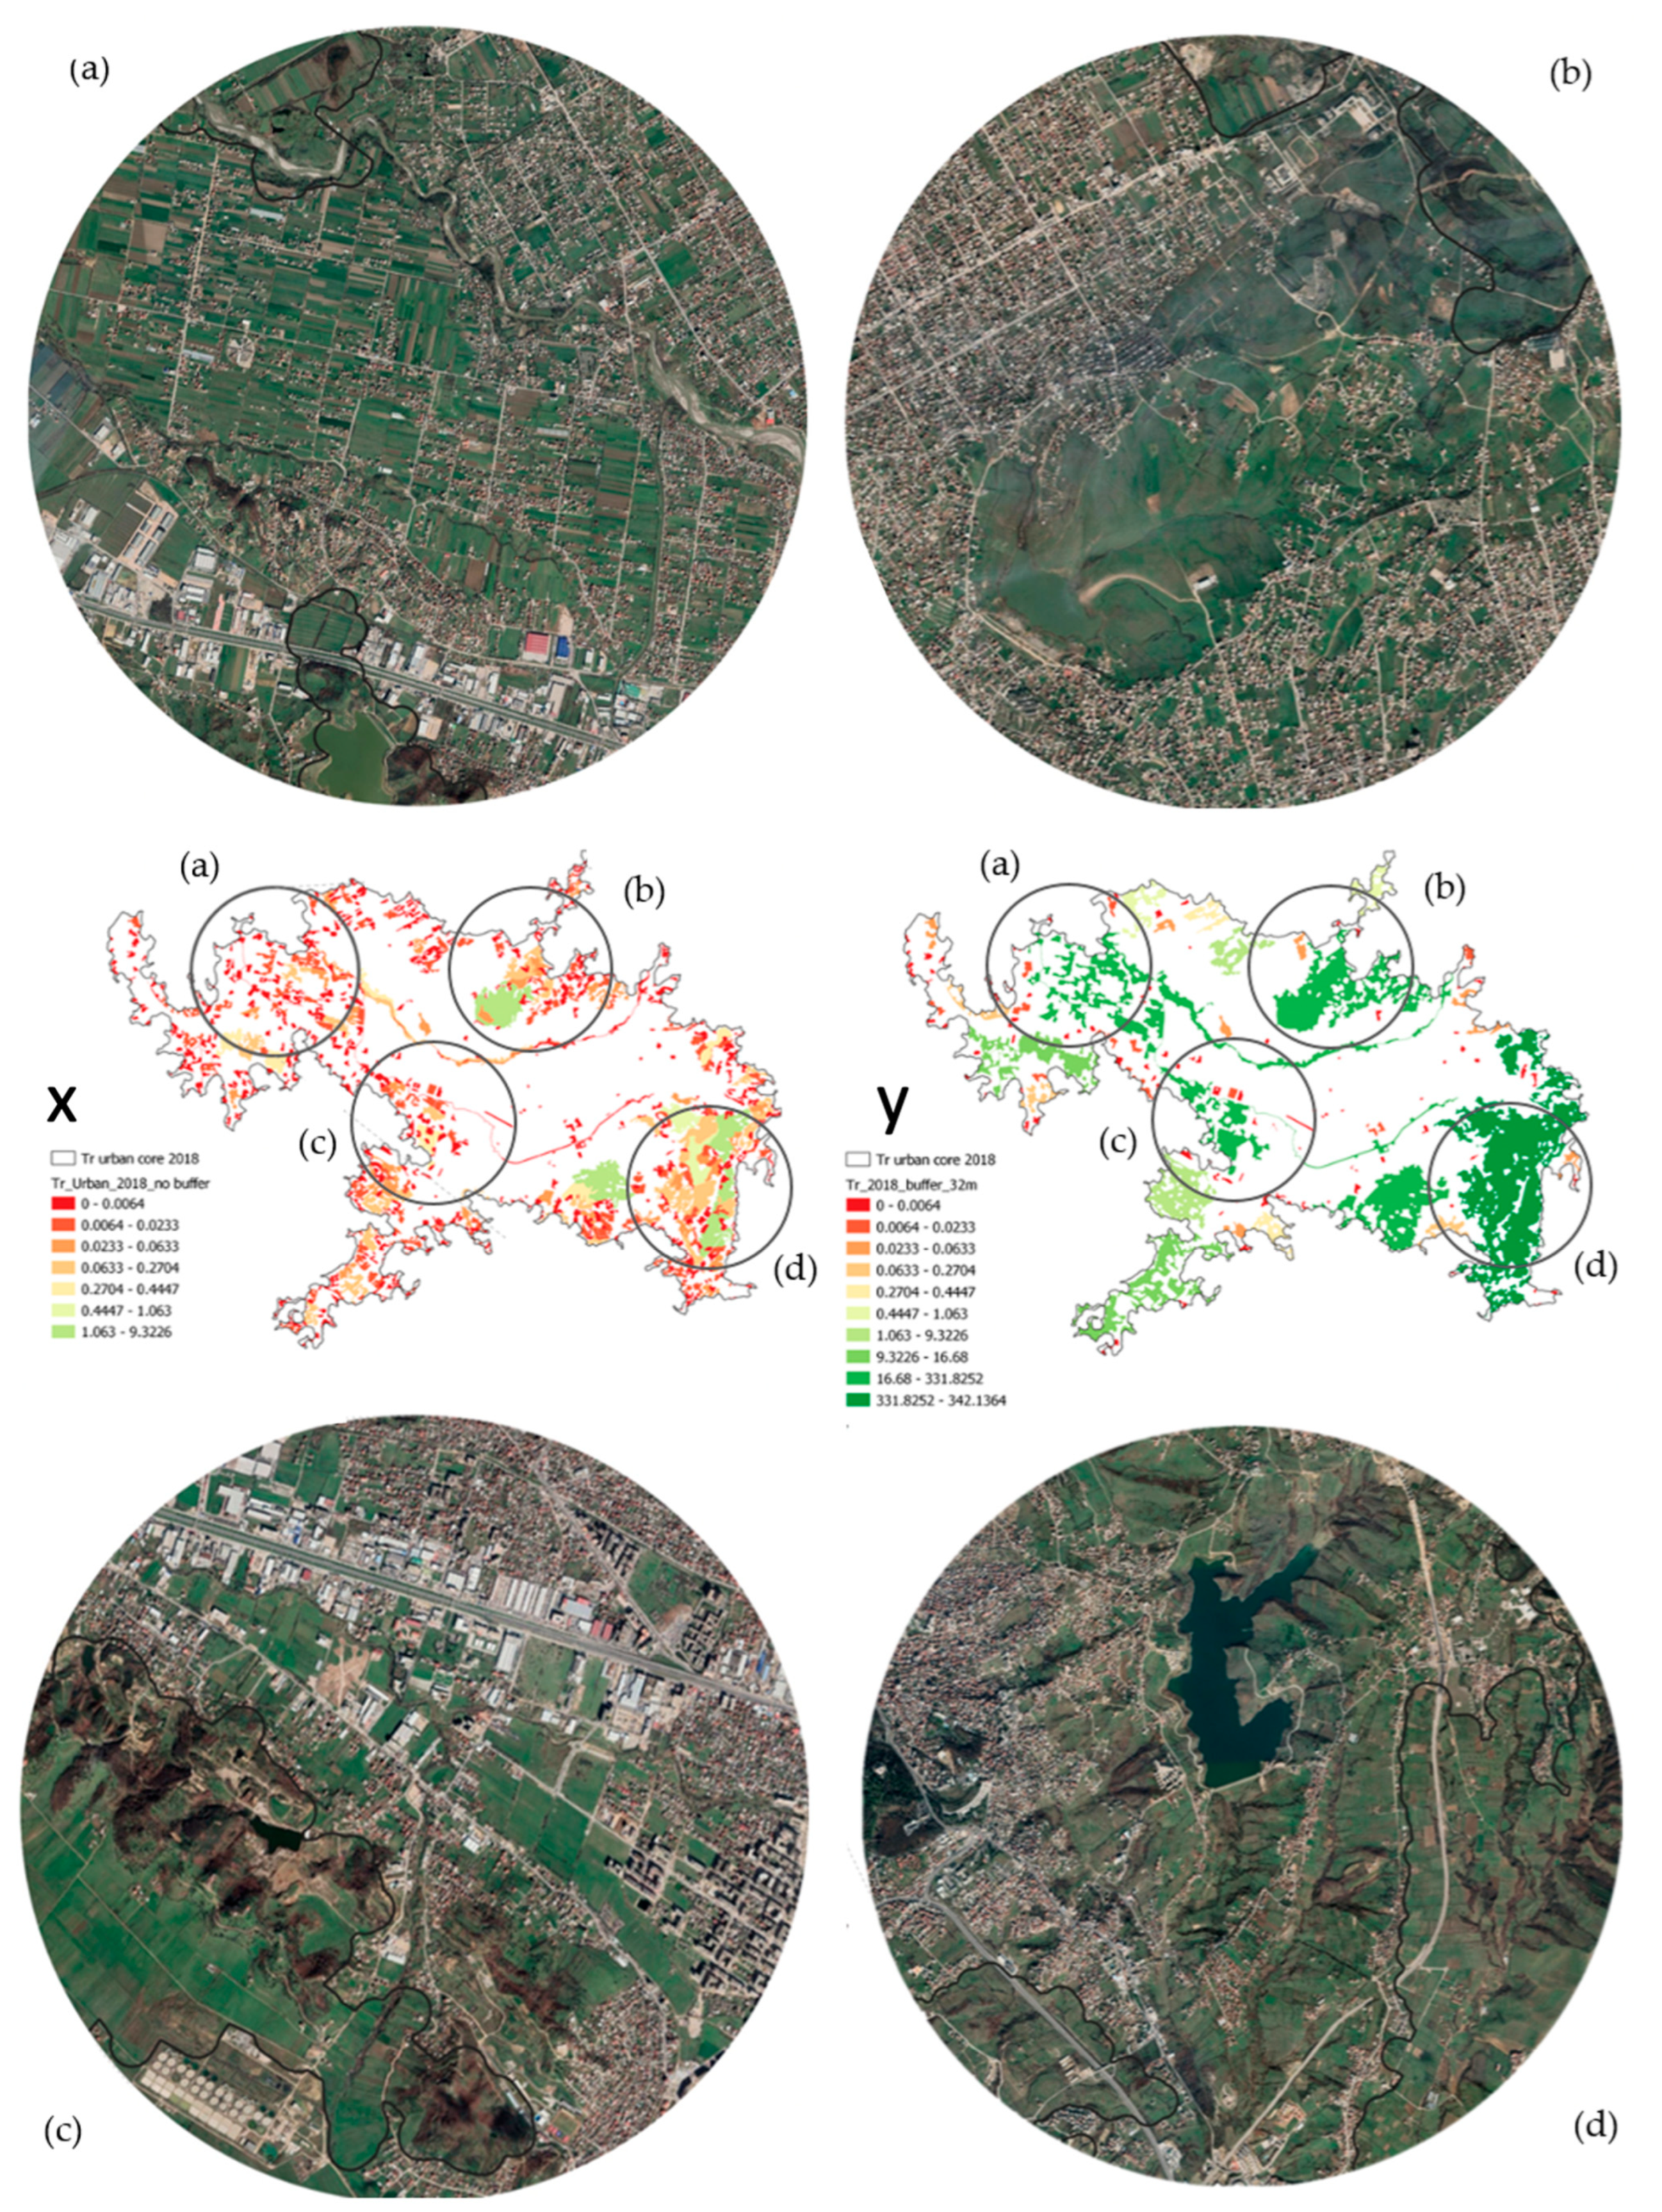
We analyzed the case of Tirana in detail. We identified four focal areas within the urban core (zoomed-in spots shown in Figure 9), which after the applied buffers, have the potential to reach connectivity through small interventions to reduce LF. The first area is in the Domje-Berxulle area (Figure 9a). The second zoomed-in area is found near the Paskuqan region, shown in Figure 9b. The third selected area is in Yzberisht-Mezez (Figure 9c), and the fourth and largest is Shkoze-Farke-Lunder (Figure 9d).
After applying the buffering procedure shown in Figure 3 and rerunning the process, we generated the hypothetical landscape connectivity map, shown in the second map in Figure 9 (indicated with “y”). The highlighted (circled) areas indicate zones with potential meff connectivity values, where landscape interventions (wildlife overpass, tunnels, among others) could significantly improve landscape connectivity. Consequently, we propose this method as a fast quantitative landscape evaluation methodology that provides accurate graphical and statistical findings to organizations in charge of spatial planning and management decision making in Albania, Bosnia and Herzegovina, North Macedonia, and other Western Balkan countries.

4. Discussion

4.1. Implications of the Results

The results of all three phases suggest that urbanization, transportation infrastructure, and industrial development are the main causes of LF in the selected metropolitan areas. Urban sprawl, new infrastructure projects, and agricultural activities are examples of LULC transformation that might occur in the future due to population increase, land consumption, and continuing migration. This has happened in Tirana in the last three decades, when uncontrolled migration towards Tirana resulted in informal urban sprawl, causing significant landscape fragmentation rates. Similarly, Sarajevo has faced unsupervised migration, especially during the civil war in Bosnia and Herzegovina, which have had similar informal urban sprawl, reducing sub-urban landscape connectivity.
Our results align with previous studies performed in different developing geographies. For example, Qi et al. reported significant findings from their study on land fragmentation in the context of rapid urbanization based on the example of Taizhou city in China. They assessed the remarkable increase in built-up areas against cropland, forest, and fallow land, which were reduced between 18% and 28% [50] during 1995–2010, a similar timeframe with our study. Similarly, Fenta et al. presented the increase in built-up area, which corresponded to an average of 9% in Mekelle City of northern Ethiopia [51]. They showed that, within the period of 1984–2014, about 88% of the built-up area expansion occupied agricultural lands. In another study from Nepal (the Kathmandu Valley on the foothills of Himalaya), Ishtiaque et al. reported the landscape transformation that took place in the last 40 years in the metropolitan area of the valley [52]. According to their results, urbanized surfaces enlarged by 412% in 30 years, again occupying mostly agricultural lands.
The results of the first two phases of our study deliver similar findings with the sources cited above. This is due to the social, economic, and political issues that developing counties share, regardless of their location. Despite their specific socio-cultural differences, as reported, they all have faced unprecedented growth in the expansion of urban areas. While the topic of landscape transformation via LULC change in developing countries is widely represented by the current literature, studies that assess landscape fragmentation within this transformation are rare. Therefore, our study contributes by expanding the scope of spatio-temporal landscape transformation studies to landscape fragmentation assessment.
For example, the results of the third phase of our study show that the landscape fragmentation caused by transportation network is significant. However, proper interventions such as wildlife over-passes or underground transportation tunnels may improve the situation of landscape fragmentation at the metropolitan scale. The results of this study can help responsible parties in their respective countries to evaluate the barrier impact of each type of urban intervention and promote connectivity-oriented initiatives to reduce natural LF and enhance the endemic fauna and flora communities’ minimum requirements.

4.2. Limitations and Further Improvement of the Method

At this stage, we applied buffers according to the standard road width, referring to the relevant literature [38]. The buffering procedure aims to present a hypothetical scenario where existing natural patches that are fragmented by road networks be connected (dissolved into each other) after being buffered by the width of the road separating them. The existing literature report that landscape fragmentation analysis is very sensitive to the grain size of the utilized data [53]. According to our study, UA resulted satisfactory to analyze the inter-patch landscape fragmentation caused by transportation networks, due to the fine scale of UA for linear elements such as roads.
However, while considering the grain size of UA data at the patch level, there is space for further improvement of our method. The available UA data have a minimum mapping unit of 0.25 ha at the patch level, which can be insufficient to retrieve intra-patch landscape connectivity at finer scales within larger patches. This is vital, especially when considering wildlife habitats within the metropolitan area, where the availability and connectivity relation in patches smaller than 2500 m2 is significant to be considered. The habitat connectivity of smaller patches that are home to small species is crucial to sustain their survival within areas that are facing increased pressures of urban development. The landscape connectivity of these habitats enables an expanded food web among wildlife species [54].
Indeed, the availability and accessibility of satellite imagery is very important for landscape transformation analysis, especially in developing countries that lack historical data, such as Western Balkans countries (Albania, Bosnia and Herzegovina, and North Macedonia). In this study, we relied on open-source LULC (UA) data provided via the Copernicus program by European Environment Agency. This limited the study to a specific timeframe (2012–2018), ignoring the latest landscape transformation that can be detected via the available satellite images. Yet, the available satellite images do not provide a finer resolution than 10 × 10 m [55]. However, the recent developments in UAV technologies enable much finer LULC classification [56,57], and eventually, they will facilitate a habitat fragmentation analysis at the small patch level. The usage of UAV technology is relatively affordable and must be employed to assess and monitor landscape fragmentation among Western Balkan metropolitan areas.

5. Conclusions

This study analyzed the spatio-temporal dynamics of landscape transformation in Western Balkan metropolitan areas. The study area consisted of Tirana’s metropolitan region (Albania) compared with two Balkan cities, Skopje (Northern Macedonia) and Sarajevo (Bosnia and Herzegovina). The raw data are based on Urban Atlas, a database of open-source geographic data sources that provide information on LULC. Landscape fragmentation analysis was based on the effective mesh size (meff) landscape metric. A hierarchical process with three phases was defined by the method used. The analysis started with macro-scale landscape transformation dynamics, comparing the three metropolitan areas. Then, the comparative LULC transformation dynamics within the urbanized zone were performed. Lastly, we assessed the landscape fragmentation using meff metric by focusing on Tirana at the urban scale.
According to the results of all phases, it can be observed that, in all three cases, there is a trend of decreasing values in natural areas, which are substituted with construction sites, industrial, commercial, public, military, and private units, and fast transit roads and associated land. Transportation networks are highlighted as the main driver of LF. Yet, the results show that landscape connectivity is improvable based on the buffering procedure presented in this paper. Since Tirana, Sarajevo, and Skopje are metropolitan areas in developing countries where significant transportation network investments are yet to be made, decision makers must address LF issues. When designing new transportation plans for developing areas, planners must consider the existing habitat mosaic and reduce the impact on landscape connectivity.

Author Contributions

Conceptualization, I.H. and A.H.; methodology, I.H. and A.H.; software, I.H. and A.H.; validation, A.H., A.K., and D.K.V.; formal analysis, I.H., A.H., S.D., M.K.S., A.K., D.K.V., and P.S.; investigation, I.H.; resources, I.H.; data curation, I.H.; writing—original draft preparation, I.H. and A.H.; writing—review and editing, I.H., A.H., S.D., M.K.S., A.K., D.K.V., and P.S.; visualization, I.H., A.H., M.K.S., A.K., and D.K.V.; supervision, A.H. and S.D.; project administration, A.H.; funding acquisition, A.K. All authors have read and agreed to the published version of the manuscript.

Funding

This research received no external funding.

Institutional Review Board Statement

Not applicable.

Informed Consent Statement

Not applicable.

Data Availability Statement

Not applicable.

Acknowledgments

This study relies on the research performed by the first author (I.H.) within the scope and objectives of her Master’s thesis during the academic year 2020–2021. The thesis was supervised by the second author (A.H.) in the Department of Architecture at Epoka University in Tirana, Albania.

Conflicts of Interest

The authors declare no conflict of interest.

Appendix A

Figure A1. Total area and count of patches of Tirana for 2012–2018 and differences, showing the four highest and four lowest values.
Land 11 01892 g0a1
Figure A2. Total area and count of patches of Skopje for 2012–2018 and differences, showing the four highest and four lowest values.
Land 11 01892 g0a2
Figure A3. Total area and count of patches of Sarajevo for 2012–2018 and differences, showing the four highest and four lowest values.
Land 11 01892 g0a3
Figure A4. Each city’s ha results for 2012–2018 and their difference values.
Land 11 01892 g0a4

References

  1. Cleland, J. World Population Growth; Past, Present and Future. Environ. Resour. Econ. 2013, 55, 543–554. [Google Scholar] [CrossRef]
  2. Canedoli, C.; Crocco, F.; Comolli, R.; Padoa-Schioppa, E. Landscape fragmentation and urban sprawl in the urban region of Milan. Landsc. Res. 2018, 43, 632–651. [Google Scholar] [CrossRef]
  3. Inostroza, L.; Baur, R.; Csaplovics, E. Urban sprawl and fragmentation in Latin America: A dynamic quantification and characterization of spatial patterns. J. Environ. Manag. 2013, 115, 87–97. [Google Scholar] [CrossRef] [PubMed]
  4. Seto, K.C.; Güneralp, B.; Hutyra, L.R. Global forecasts of urban expansion to 2030 and direct impacts on biodiversity and carbon pools. Proc. Natl. Acad. Sci. USA 2012, 109, 16083–16088. [Google Scholar] [CrossRef] [PubMed] [Green Version]
  5. Angel, S.; Parent, J.; Civco, D.L.; Blei, A.; Potere, D. The dimensions of global urban expansion: Estimates and projections for all countries, 2000–2050. Prog. Plann. 2011, 75, 53–107. [Google Scholar] [CrossRef]
  6. Seto, K.C.; Fragkias, M.; Güneralp, B.; Reilly, M.K. A Meta-Analysis of Global Urban Land Expansion. PLoS ONE 2011, 6, e23777. [Google Scholar] [CrossRef]
  7. Ramalho, C.E.; Laliberté, E.; Poot, P.; Hobbs, R.J. Complex effects of fragmentation on remnant woodland plant communities of a rapidly urbanizing biodiversity hotspot. Ecology 2014, 95, 2466–2478. [Google Scholar] [CrossRef] [Green Version]
  8. Di Giulio, M.; Holderegger, R.; Tobias, S. Effects of habitat and landscape fragmentation on humans and biodiversity in densely populated landscapes. J. Environ. Manag. 2009, 90, 2959–2968. [Google Scholar] [CrossRef]
  9. Kaplan, S. Meditation, Restoration, and the Management of Mental Fatigue. Environ. Behav. 2001, 33, 480–506. [Google Scholar] [CrossRef] [Green Version]
  10. Hysa, A. Introducing Transversal Connectivity Index (TCI) as a method to evaluate the effectiveness of the blue-green infrastructure at metropolitan scale. Ecol. Indic. 2021, 124, 107432. [Google Scholar] [CrossRef]
  11. Cugny-Seguin, M. Impacts of urban sprawl on landscapes. In Urban Expansion, Land Cover and Soil Ecosystem Services; Gardi, C., Ed.; Routledge: London, UK; Boston, MA, USA, 2017; pp. 204–214. ISBN 9781315715674. [Google Scholar]
  12. Feranec, J.; Soukup, T.; Hazeu, G.; Jaffrain, G. Landscape fragmentation in Europe. In European Landscape Dynamics: CORINE Land Cover Data; Jan, F., Tomas, S., Gerard, H., Gabriel, J., Eds.; CRC Press: Boca Raton, FL, USA; Taylor and Francis Group: Abingdon, UK, 2016; pp. 157–198. ISBN 1482244683. [Google Scholar]
  13. Saunders, D.A.; Hobbs, R.J.; Margules, C.R. Biological Consequences of Ecosystem Fragmentation: A Review. Conserv. Biol. 1991, 5, 18–32. [Google Scholar] [CrossRef]
  14. Forman, R.T.T.; Sperling, D.; Bissonette, J.A.; Clevenger, A.P.; Cutshall, C.D.; Dale, V.H.; Fahrig, L.; France, R.L.; Goldman, C.R.; Heanue, K. Road Ecology: Science and Solutions; Island Press: Washington, DC, USA, 2003; ISBN 1559639334. [Google Scholar]
  15. Jaeger, J.A.G.; Bowman, J.; Brennan, J.; Fahrig, L.; Bert, D.; Bouchard, J.; Charbonneau, N.; Frank, K.; Gruber, B.; von Toschanowitz, K.T. Predicting when animal populations are at risk from roads: An interactive model of road avoidance behavior. Ecol. Modell. 2005, 185, 329–348. [Google Scholar] [CrossRef]
  16. Schiemer, F.; Drescher, A.; Hauer, C.; Schwarz, U. The Vjosa River corridor: A riverine ecosystem of European significance. Acta ZooBot Austria 2018, 155, 1–40. [Google Scholar]
  17. Shumka, S.; Bego, F.; Beqiraj, S.; Paparisto, A.; Kashta, L.; Miho, A.; Nika, O.; Marka, J.; Shuka, L. The Vjosa catchment–a natural heritage. Acta ZooBot Austria 2018, 155, 349–376. [Google Scholar]
  18. Hysa, A.; Manahasa, O.D.; Naselli, F.; Manahasa, E.; Yunitsyna, A.; Dervishi, S. Introducing the Architectural, Urban, and Landscape Challenges of Albania. In Current Challenges in Architecture and Urbanism in Albania; Yunitsyna, A., Hysa, A., Manahasa, E., Naselli, F., Manahasa, O.D., Dervishi, S., Eds.; The Urban Book Series; Springer: Cham, Switzerland, 2021; pp. 1–15. ISBN 978-3-030-81919-4. [Google Scholar]
  19. Pilua, A.; Hysa, A.; Zeka, E.; Dervishi, S.; Stefanidis, S.; Spalevic, V. Transversal Relationship of Moraca River with the Urban Fabric of Podgorica. J. Environ. Prot. Ecol. 2022, 23, 2212–2222. [Google Scholar]
  20. Knez, S.; Štrbac, S.; Podbregar, I. Climate change in the Western Balkans and EU Green Deal: Status, mitigation and challenges. Energ. Sustain. Soc. 2022, 12, 1. [Google Scholar] [CrossRef]
  21. European Commission, Directorate-General for Environment, EU Biodiversity Action Plan: 2010 Assessment, Publications office. 2011. Available online: https://data.europa.eu/doi/10.2779/42306 (accessed on 14 October 2022).
  22. Synes, N.W.; Ponchon, A.; Palmer, S.C.F.; Osborne, P.E.; Bocedi, G.; Travis, J.M.J.; Watts, K. Prioritising conservation actions for biodiversity: Lessening the impact from habitat fragmentation and climate change. Biol. Conserv. 2020, 252, 108819. [Google Scholar] [CrossRef]
  23. Holyoak, M.; Heath, S.K. The integration of climate change, spatial dynamics, and habitat fragmentation: A conceptual overview. Integr. Zool. 2016, 11, 40–59. [Google Scholar] [CrossRef] [Green Version]
  24. Oliveira, S.; Moreira, F.; Boca, R.; San-Miguel-Ayanz, J.; Pereira, J.M.C. Assessment of fire selectivity in relation to land cover and topography: A comparison between Southern European countries. Int. J. Wildl. Fire 2014, 23, 620. [Google Scholar] [CrossRef]
  25. Hysa, A.; Spalevic, V. Testing NDVI, tree cover density and land cover type as fuel indicators in the wildfire spread capacity index (WSCI): Case of Montenegro. Not. Bot. Horti Agrobot. Cluj-Napoca 2020, 48, 2368–2384. [Google Scholar] [CrossRef]
  26. Jaeger, J.A.G. Landscape division, splitting index, and effective mesh size: New measures of landscape fragmentation. Landsc. Ecol. 2000, 15, 115–130. [Google Scholar] [CrossRef]
  27. Jaeger, J.A.G.; Schwarz-von Raumer, H.-G.; Esswein, H.; Müller, M.; Schmidt-Lüttmann, M. Time Series of Landscape Fragmentation Caused by Transportation Infrastructure and Urban Development. Ecol. Soc. 2007, 12. [Google Scholar] [CrossRef] [Green Version]
  28. Potsiou, C. Policies for formalization of informal development: Recent experience from southeastern Europe. Land Use Policy 2014, 36, 33–46. [Google Scholar] [CrossRef]
  29. Iban, M.C. Lessons from approaches to informal housing and non-compliant development in Turkey: An in-depth policy analysis with a historical framework. Land Use Policy 2020, 99, 105104. [Google Scholar] [CrossRef]
  30. Pojani, D. From squatter settlement to suburb: The transformation of Bathore, Albania. Hous. Stud. 2013, 28, 805–828. [Google Scholar] [CrossRef]
  31. Berisha, E.; Cotella, G. Territorial Development and Governance in the Western Balkans. In Governing Territorial Development in the Western Balkans; Berisha, E., Cotella, G., Solly, A., Eds.; Advances in Spatial Science; Springer: Cham, Switzerland, 2021. [Google Scholar] [CrossRef]
  32. Aliaj, B.; Lulo, K.; Myftiu, G. Tirana: The Challenge of Urban Development; Cetis: Tirana, Albania, 2003. [Google Scholar]
  33. Bouzarovski, S. Skopje. Cities 2011, 28, 265–277. [Google Scholar] [CrossRef]
  34. Kaplan, G.; Avdan, U.; Avdan, Z.Y. Urban Heat Island Analysis Using the Landsat 8 Satellite Data: A Case Study in Skopje, Macedonia. Proceedings 2018, 2, 358. [Google Scholar] [CrossRef] [Green Version]
  35. Martinez, G.S.; Spadaro, J.V.; Chapizanis, D.; Kendrovski, V.; Kochubovski, M.; Mudu, P. Health Impacts and Economic Costs of Air Pollution in the Metropolitan Area of Skopje. Int. J. Environ. Res. Public Health 2018, 15, 626. [Google Scholar] [CrossRef] [Green Version]
  36. Hysa, A. Indexing the vegetated surfaces within WUI by their wildfire ignition and spreading capacity, a comparative case from developing metropolitan areas. Int. J. Disaster Risk Reduct. 2021, 63, 102434. [Google Scholar] [CrossRef]
  37. Prastacos, P.; Chrysoulakis, N.; Kochilakis, G. Urban Atlas, land use modelling and spatial metric techniques. In Proceedings of the 51st Congress of the European Regional Science Association: “New Challenges for European Regions and Urban Areas in a Globalised World”, Barcelona, Spain, 30 August–3 September 2011; European Regional Science Association (ERSA): Louvain-la-Neuve, Belgium, 2011. [Google Scholar]
  38. Tsai, Y.; Wu, Y.; Ai, C.; Pitts, E. Critical assessment of measuring concrete joint faulting using 3D continuous pavement profile data. J. Transp. Eng. 2012, 138, 1291–1296. [Google Scholar] [CrossRef]
  39. European Commission. Urban Atlas 2012 Mapping Guide. v4.7. 2016. Available online: https://land.copernicus.eu/user-corner/technical-library/urban-atlas-mapping-guide (accessed on 17 October 2022).
  40. Copernicus Programme. Urban Atlas. Available online: https://land.copernicus.eu/local/urban-atlas (accessed on 17 October 2022).
  41. Montero, E.; Van Wolvelaer, J.; Garzón, A. The European Urban Atlas Land Use and Land Cover Mapping in Europe; Springer: Dordrecht, The Netherlands, 2014; pp. 115–124. [Google Scholar] [CrossRef]
  42. Prastacos, P.; Lagarias, A.; Chrysoulakis, N. Using the Urban Atlas dataset for estimating spatial metrics. Methodology and application in urban areas of Greece. Cybergeo 2017. [Google Scholar] [CrossRef]
  43. Cyriac, S.; Firoz, C.M. A Bibliometric Review of Publication Trends in the Application of Landscape Metrics in Urban and Regional Planning. Pap. Appl. Geogr. 2022, 3, 297–314. [Google Scholar] [CrossRef]
  44. Girvetz, E.H.; Thorne, J.H.; Berry, A.M.; Jaeger, J.A.G. Integration of landscape fragmentation analysis into regional planning: A statewide multi-scale case study from California, USA. Landsc. Urban Plan. 2008, 86, 205–218. [Google Scholar] [CrossRef]
  45. Hasa, E.; Hysa, A.; Teqja, Z. Quantifying Landscape Fragmentation via Effective Mesh Size Landscape Metric: Case of Albania. Agric. For. Sumar. 2021, 67, 215–230. [Google Scholar] [CrossRef]
  46. Hysa, A.; Türer Başkaya, F.A. Land cover data as environmentally sensitive decision-making mediator in territorial and administrative reform. Cogent Environ. Sci. 2018, 4, 1. [Google Scholar] [CrossRef]
  47. Jaeger, J.A.G. Effects of the Configuration of Road Networks on Landscape Connectivity. In Proceedings of the ICOET 2007 Proceedings, Little Rock, AR, USA, 20–25 May 2007; pp. 267–280. [Google Scholar]
  48. Jaeger, J.A.G.; Soukup, T.; Schwick, C.; Madriñán, L.F.; Kienast, F. Landscape fragmentation in Europe. European landscape dynamics–CORINE land cover data. In European Landscape Dynamics CORINE Land Cover Data Layers Current; Feranec, J., Soukup, T., Hazeu, G., Jaffrain, G., Eds.; CRC Press: Boca Raton, FL, USA, 2016; pp. 157–198. [Google Scholar] [CrossRef]
  49. Deslauriers, M.R.; Asgary, A.; Nazarnia, N.; Jaeger, J.A.G. Implementing the connectivity of natural areas in cities as an indicator in the City Biodiversity Index (CBI). Ecol. Indic. 2018, 94, 99–113. [Google Scholar] [CrossRef]
  50. Qi, Z.F.; Ye, X.Y.; Zhang, H.; Yu, L.Z. Land fragmentation and variation of ecosystem services in the context of rapid urbanization: The case of Taizhou city, China. Stoch. Environ. Res. Risk Assess. 2014, 28, 843–855. [Google Scholar] [CrossRef]
  51. Fenta, A.A.; Yasuda, H.; Haregeweyn, N.; Belay, A.S.; Hadush, Z.; Gebremedhin, M.A.; Mekonnen, G. The dynamics of urban expansion and land use/land cover changes using remote sensing and spatial metrics: The case of Mekelle City of northern Ethiopia. Int. J. Remote Sens. 2017, 38, 4107–4129. [Google Scholar] [CrossRef]
  52. Ishtiaque, A.; Shrestha, M.; Chhetri, N. Rapid Urban Growth in the Kathmandu Valley, Nepal: Monitoring Land Use Land Cover Dynamics of a Himalayan City with Landsat Imageries. Environments 2017, 4, 72. [Google Scholar] [CrossRef]
  53. Hysa, A.; Başkaya, T.F.A. Landscape Fragmentation Assessment Utilizing the Matrix Green Toolbox and CORINE Land Cover Data. JoDLA-J. Digit. Landsc. Archit. 2017, 2, 54–62. [Google Scholar] [CrossRef]
  54. Liao, J.; Bearup, D.; Blasius, B. Diverse responses of species to landscape fragmentation in a simple food chain. J. Anim. Ecol. 2017, 86, 1169–1178. [Google Scholar] [CrossRef] [PubMed] [Green Version]
  55. Xiong, S.; Du, S.; Zhang, X.; Ouyang, S.; Cui, W. Fusing Landsat-7, Landsat-8 and Sentinel-2 surface reflectance to generate dense time series images with 10m spatial resolution. Int. J. Remote Sens. 2022, 43, 1630–1654. [Google Scholar] [CrossRef]
  56. Natesan, S.; Armenakis, C.; Benari, G.; Lee, R. Use of UAV-Borne Spectrometer for Land Cover Classification. Drones 2018, 2, 16. [Google Scholar] [CrossRef] [Green Version]
  57. Al-Najjar, H.A.H.; Kalantar, B.; Pradhan, B.; Saeidi, V.; Halin, A.A.; Ueda, N.; Mansor, S. Land Cover Classification from fused DSM and UAV Images Using Convolutional Neural Networks. Remote Sens. 2019, 11, 1461. [Google Scholar] [CrossRef]
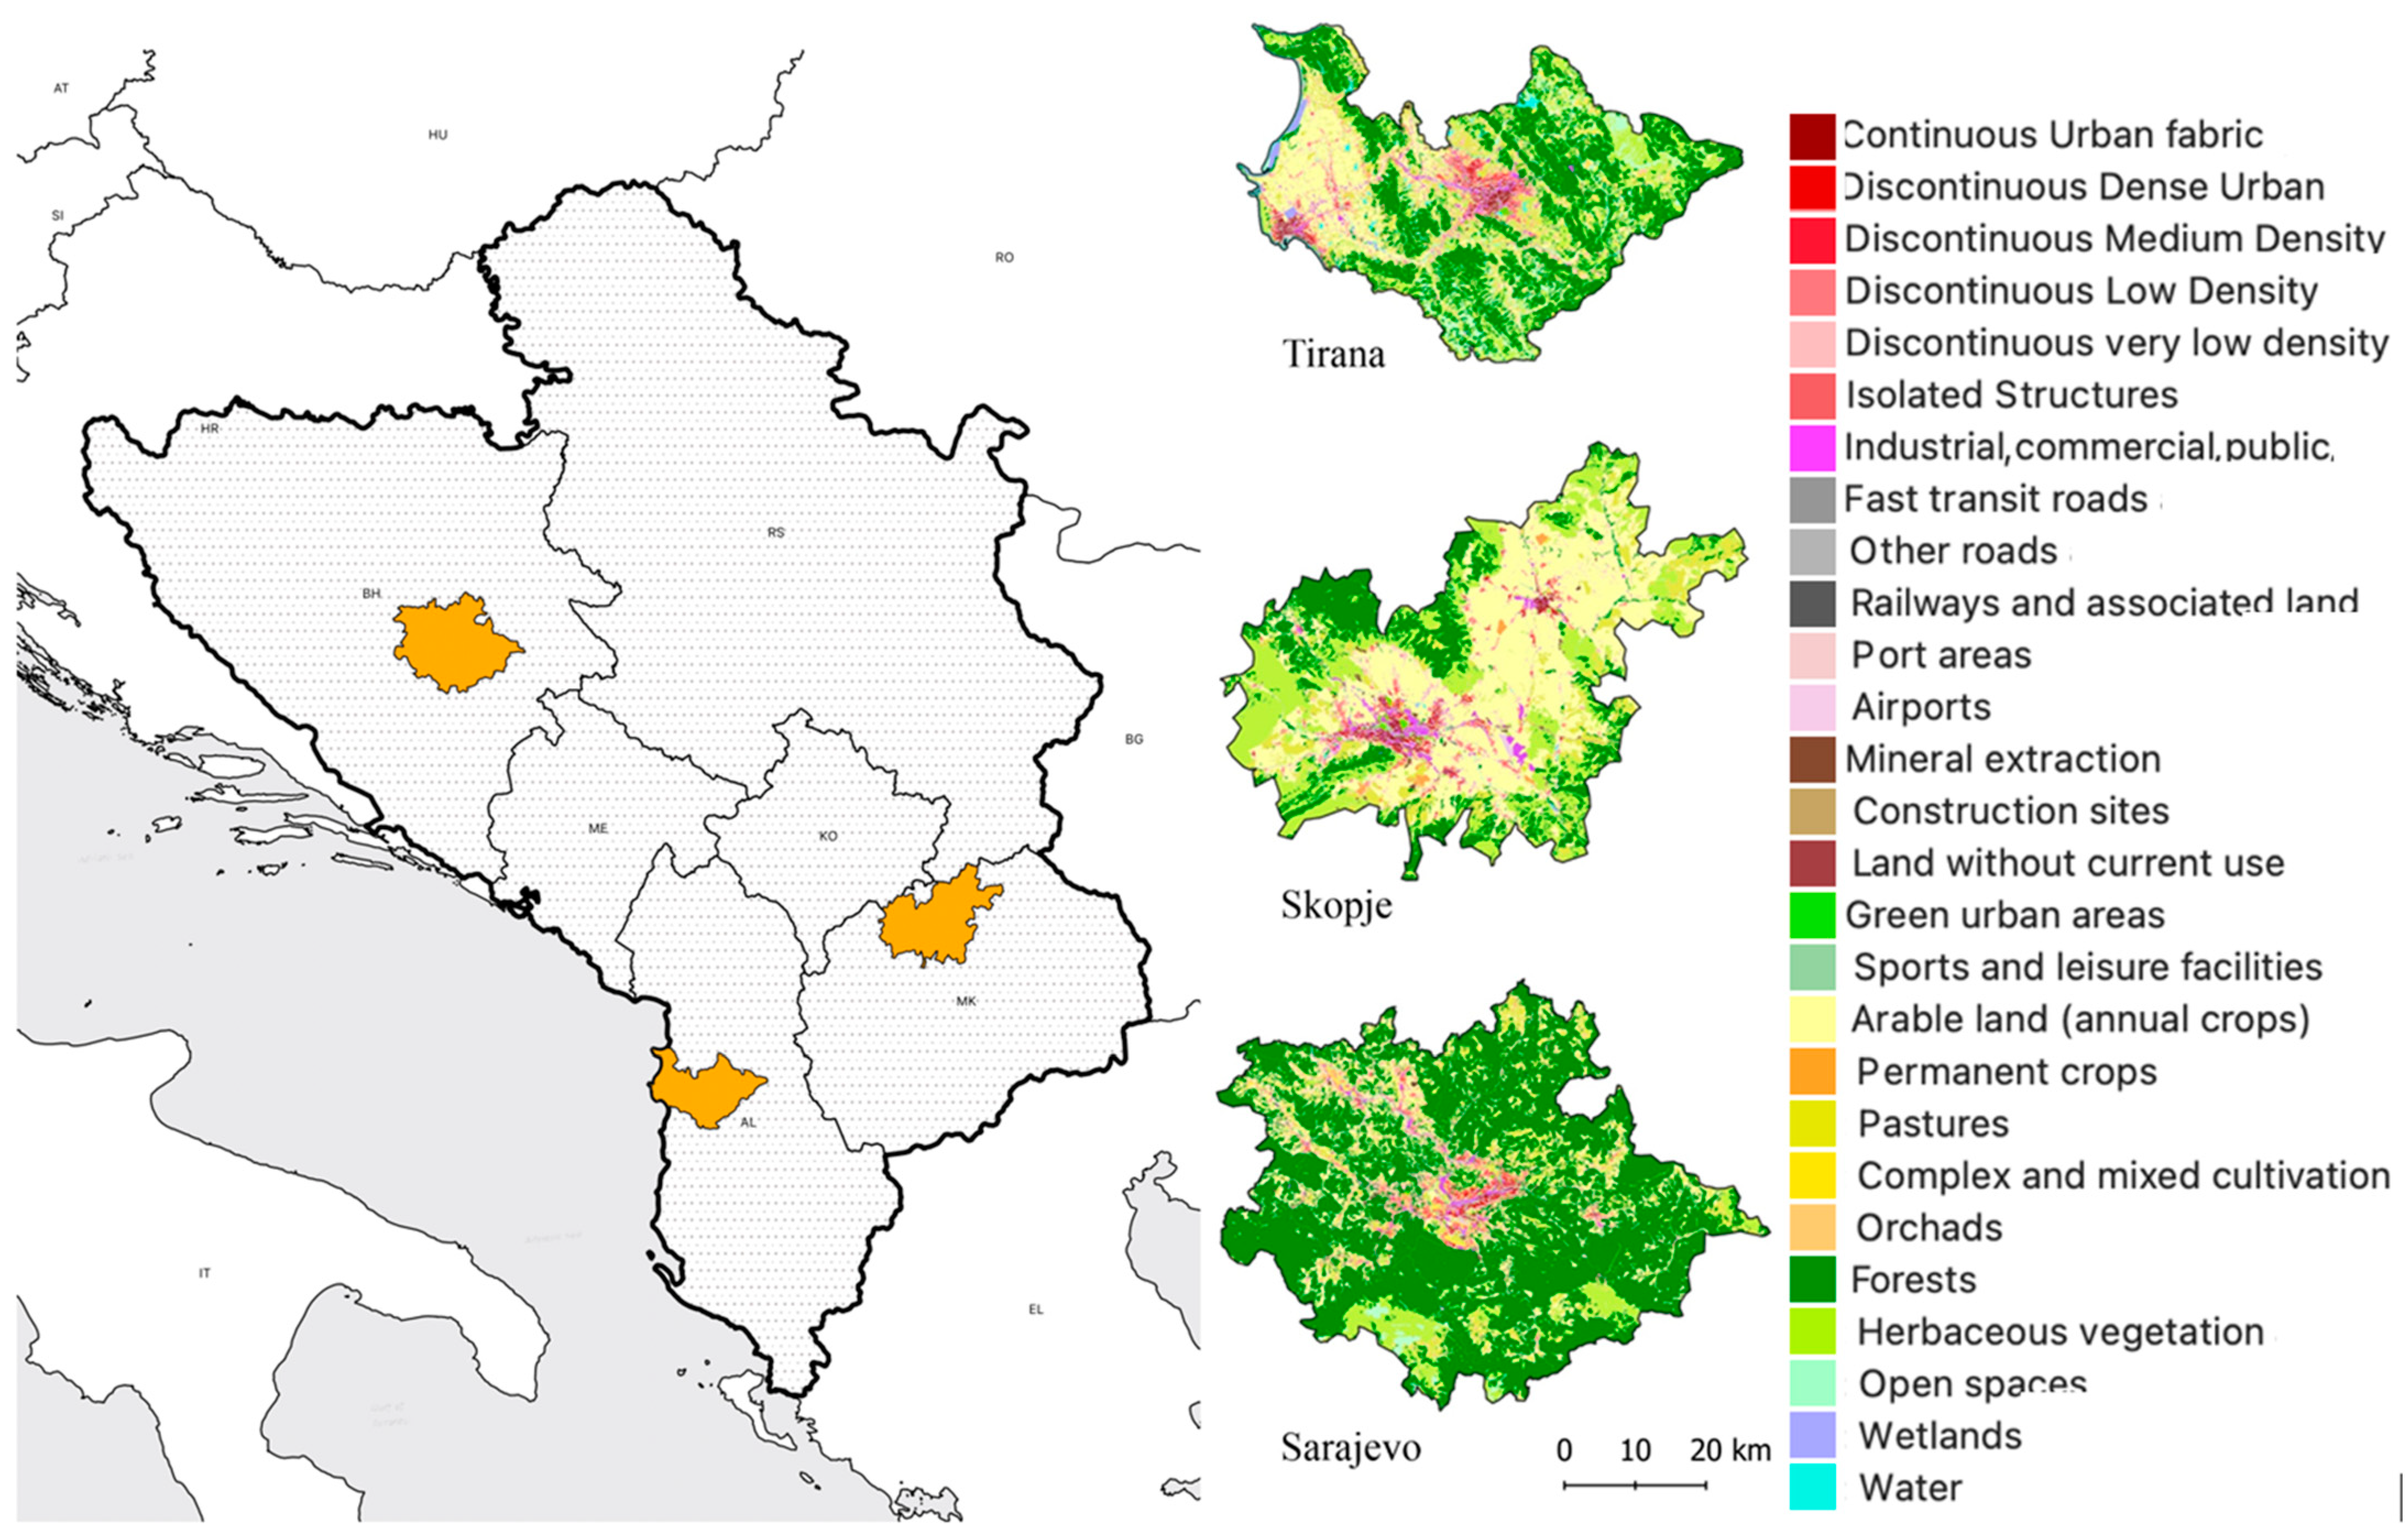
Figure 1. Metropolitan areas of Tirana, Skopje, and Sarajevo including the respective LULC (based on Urban Atlas data of 2018).
Land 11 01892 g001
Figure 2. The workflow of the method applied.
Land 11 01892 g002
Figure 3. Illustration of buffer zones, where the road width is 3.65 m.
Land 11 01892 g003
Figure 4. Statistical analysis of difference (2018–2012) count of patches (red) and total area (blue) for Tirana, Skopje, and Sarajevo.
Land 11 01892 g004
Figure 5. A map defines the urban and peri-urban boundaries for Tirana, Skopje, and Sarajevo.
Land 11 01892 g005
Figure 6. Statistical analysis, comparing each city’s urban and peri-urban differences (ha) in 2018–2012, according to the re-classification into four categories.
Land 11 01892 g006
Figure 7. Tirana’s urban area within Tirana’s entire region.
Land 11 01892 g007
Figure 8. meff analysis applied on (a) the Tirana case based on buffer distances of (b) 0 m, (c) 4 m, (d) 8 m, (e) 16 m, and (f) 32 m based on UA of 2018 records.
Land 11 01892 g008
Figure 9. Zoomed-in spots: (a) Domje-Bërxull, (b) Paskuqan, (c)Yzberisht-Mezez, and (d) Shkoze-Farke-Lunder.
Land 11 01892 g009
Table 1. The re-classification of the UA classes into four categories; artificial, semi-artificial, semi-natural, and natural.
Re-ClassificationUrban Atlas (UA) Nomenclature
ARTIFICIAL11,100  Continuous urban fabric (>80%)
11,210  Discontinuous dense urban fabric (50–80%)
12,100  Industrial, commercial, public, military, and private units
11,220  Discontinuous medium density urban fabric (30–50%)
13,300  Construction sites
12,210  Fast transit roads and associated land
12,220  Other roads and associated land
12,230  Railways and associated land
12,300  Port areas
12,400  Airports
SEMI-ARTIFICIAL11,230  Discontinuous low-density urban fabric (10–30%)
11,240  Discontinuous very-low-density urban fabric (<10%)
11,300  Isolated structures
13,100  Mineral extraction and dumpsites
SEMI-NATURAL13,400  Land without current use
14,200  Sports and leisure facilities
21,000  Arable land (annual crops)
22,000  Permanent crops (vineyards, fruit trees, and olive groves)
24,000  Complex and mixed cultivation patterns
NATURAL14,100  Green urban areas
23,000  Pastures
31,000  Forests
32,000  Herbaceous veg. associations (natural grassland)
33,000  Open spaces with little or no veg. (beaches, dunes, etc.)
40,000  Wetlands
50,000  Water
Table 2. Results of meff for 2012 and 2018.
2012
Buffers0481632
Total area (ha)3715.9373743.073764.3853794.0524186.495
Total area (ha)25.86040535251.4593764311.4409077405.798178750.6417115
No. of geometries1004886578368174
2018
Buffers0481632
Total area (ha)3609.5293634.3733654.4053689.2414091.373
Total area (ha)25.5546867235.7869958294.393295375745.4720198
No. of geometries1016928605385179
Publisher’s Note: MDPI stays neutral with regard to jurisdictional claims in published maps and institutional affiliations.