Article

Effects of Conventional Tillage and No-Tillage Systems on Maize (Zea mays L.) Growth and Yield, Soil Structure, and Water in Loess Plateau of China: Field Experiment and Modeling Studies

1
Shanxi Subalpine Grassland Ecosystem Field Observation and Research Station of the Ministry of Education, Institute of Loess Plateau, Shanxi University, Taiyuan 030006, China
2
College of Environment and Resources, Shanxi University, Taiyuan 030006, China
*
Author to whom correspondence should be addressed.
Land 2022, 11(11), 1881; https://doi.org/10.3390/land11111881
Submission received: 23 September 2022 / Revised: 18 October 2022 / Accepted: 20 October 2022 / Published: 23 October 2022
(This article belongs to the Special Issue Tillage Systems Impact Soil Structure and Cover Crop)

Abstract

:
Cropping system models can be useful tools for assessing tillage systems, which are both economically and environmentally viable. The objectives of this study were to evaluate the decision support system for agrotechnology transfer (DSSAT) CERES-Maize model’s ability to predict maize growth and yield, as well as soil water dynamics, and to apply the evaluated model to predict evapotranspiration processes under conventional tillage (CT) and no-tillage (NT) systems in a semi-arid loess plateau area of China from 2014 to 2016. The field experiment results showed that NT increased the surface soil bulk density and water-holding capacity but decreased the total porosity for the surface soil and the maize grain yield. Model calibration for maize cultivar was achieved using grain yield measurements from 2014 to 2016 for CT, and model evaluation was achieved using soil and crop measurements from both CT and NT for the same 3 yr period. Good agreement was reached for CT grain yields for model calibration (nRMSE = 4.02%; d = 0.87), indicating that the model was successfully calibrated. Overall, the results of model evaluation were acceptable, with good agreement for NT grain yields (nRMSE = 4.26%; d = 0.86); the agreement for LAI ranged from good to moderate (RMSE = 0.30‒0.31; d = 0.84‒0.85); the agreement for soil water content was good for NT (RMSE = 0.03‒0.08; d = 0.81‒0.95), but ranged from good to poor for CT (RMSE = 0.06‒0.09; d = 0.42‒0.88); the overall agreement between measured and simulated soil water varied from poor to good depending on soil depth and tillage. It was concluded that the DSSAT CERES-Maize model provided generally good-to-moderate simulations of continuous maize production (yield and LAI) for a short-term tillage experiment in the loess plateau, China, but generally good-to-poor simulations of soil water content.

1. Introduction

Maize (Zea mays L.) is a critically important crop, as it is grown worldwide in a broad range of agroecological environments, and all above-ground parts of the crop can be used for food, livestock feed, fuel, and industrial products [1,2,3]. In China, maize is primarily grown in the North China Plain, northeast and southwest regions, which have suitable climate and soil conditions [4,5]. However, for the loess plateau area, especially in northwest Shanxi, intensive and consistent tilling (deep moldboard plowing, ridging, etc.) for several decades has induced serious soil structural degradation and extensive wind–water soil erosion and has threatened agricultural security. Moreover, drought and strong winds frequently occur in spring, intensifying the wind erosion, and on land in semi-arid regions, where climatic conditions vary tremendously, encompassing variable and irregular rainfall, i.e., there is not enough rainfall or rainfall has high spatial and temporal variability during the crop-growing season. In addition, there is a broad range of air temperature [6]. Crop yields in this rain-fed agricultural area are subject to multiple constraints.
To mitigate these impeding factors, soil and crop management of conservation tillage, including effective tillage and mulching, are two effective management practices for soil and water conservation [7]. The effects of different tillage systems on soil characteristics and crop yield depend on climatic conditions, and soil and crop types [5]. In temperate climatic regions, maize yields under no-tillage (NT) were found to be either similar or lower compared to CT with a cool–humid climate or on poorly drained soils [8,9,10], but NT has been found to reduce wind–water erosion [11,12], increase the water infiltration rate and soil water content [11,13,14], and reduce labor and fuel inputs, making NT a more attractive commercial cropping practice compared with most conventional tillage systems [15,16]. Tillage research in the loess plateau areas reported that conventional tillage accelerated soil degradation, increased water shortage, and decreased crop water use efficiency [17,18,19]. Therefore, conservation tillage could be particularly popular for highly erodible soils and in semi-arid regions [20,21,22]. However, sufficient research should be conducted to better understand its suitability before conservation tillage management is widely applied in any particular region. Hence, research should be carried out to determine whether conservation tillage practices can be adapted to ensure that they do not reduce crop yields but enhance the soil properties of semi-arid soils [23].
Field tillage experiments are usually costly, tedious, and time- and labor-consuming and, therefore, always difficult to implement, especially for long-term maintenance [24,25]. Thus, physical-process-based soil and crop models, a potentially valuable tool, have rapidly been developed to approximate the crop growth, productivity, and environmental conditions, such as soil water, nutrient, and heat and their interactions, when affected by different tillage and cropping systems [26,27]. Some models (e.g., HYDRUS and SHAW) only focus on soil water and heat processes [28,29], while others (e.g., CoupModel and PILOTE) also include a single plant [30,31]. Models (e.g., RZWQM, EPIC, and DSSAT) that combine soil-water–heat–nutrient and crop growth processes may be more useful [32,33,34,35]. A useful feature of Decision Support Systems for Agro-technology Transfer (DSSAT) is the ability to simulate continuous crop and rotations combined with soil-water–heat–nutrient processes [35]. Therefore, in this study, the CSM-CERES-Maize crop module and CENTURY soil module [36,37] were combined in DSSAT to simulate a three-year maize experiment comparing conventional tillage (CT) and no-tillage (NT) in the loess plateau of China. Few reports calibrating and applying the CSM-CERES-Maize model have been found for this region, especially in conservational tillage systems. We propose that the DSSAT CERES-Maize model can be well-calibrated for tillage systems in the loess plateau and, after successful calibration and validation, the model can be further applied to study the water processes of soil and crops.
The aims of the present study were to: (1) calibrate the DSSAT v4.7 cropping systems model (CSM-CERES-Maize) to describe the maize yield of conventional tillage over three years, and evaluate the quality of the simulation results with the measured data for maize growth and yield, as well as variations in soil water content at different soil depths of conventional and no-tillage; (2) apply the DSSAT-CERES-Maize model to predict the evapotranspiration process, i.e., soil evaporation, crop transpiration, and the total evapotranspiration, at different maize growth stages for conventional and no-tillage, and provide insight into the understanding of the no-tillage impact on cover crop, soil structure, and soil water dynamics in semi-arid climate conditions, and on sandy loam soil in northwest China.

2. Materials and Methods

2.1. Site Description and Experimental Design

The field experiment was conducted in Shizhitou Village, Wuzhai County, north of Xinzhou City, Shanxi Province (111°28′‒113° E, 38°44′‒39°17′ N), which belongs to the semi-arid and loess hilly sandy region of the Loess Plateau in North China. The soils are predominantly light chestnut cinnamon soils, which are classified as Cambisols Arenosols according to the FAO/UNESCO soil classification system [38]. The field study site is located in a typical arid continental climate region; the average annual temperature in this region is about 4.9 °C, and the coldest and hottest temperatures occur in January (‒13 °C) and July (20 °C) (1980–2013), respectively. The effective accumulated temperature is 2452 °C. The average annual precipitation in this area is 478.5 mm (1980–2013), with great seasonal variations; over 70% falls between June and September [39]. The soil in this area has a loose texture, strong aeration, high porosity, good permeability, low wind erosion resistance, low organic matter content, and low soil fertility [40].

2.2. Field Experiment and Management

The field experiment was established in the autumn of 2013. The experiment included intensive conventional tillage (CT) and no-tillage with straw mulching (NT) treatments in a randomized complete block design, with three replicates for each treatment. For CT, the maize straw and stubble were cleared after harvest, and the maize was sown after ploughing and ridging in the second year (April‒May), with no additional plowing after harvest (October‒November). For NT, all the straw that was chopped to 5–10 cm in length (amount of about 1.0 × 10⁴ kg ha−1) was covered on the ground after harvest, and the soil was left undisturbed except for that associated with planting using a row planter. The area of each plot was 667 m2. Further detail and agronomic data pertinent to this study are summarized in Table S1.

2.3. Sampling, Measurements, and Analyses

In 2014, in the spring before tillage (April‒May), 5 cm diameter undisturbed soil cores were collected at 0‒10, 10‒20, 20‒30, 30‒40, 40‒50, 50‒70, 70‒90, and 90‒110 cm depths. Measurements on each depth segment included dry bulk density, calculated using the standard cutting-ring method [41]. The field capacity (−0.33 MPa), wilting point (−1.50 MPa), and saturation (0 MPa) are the measured soil water contents under 0.33 MPa, 1.5 MPa, and 0 MPa water suction values, measured using the pressure-membrane meter method (1500F2, Soilmoisture Equipment Corp, California, US); the silt and clay weight percentages were determined using the Laser particle size meter (MS 3000, Malvern Panalytical Ltd, Malvern, UK); the soil organic carbon content was measured using the potassium dichromate oxidation spectrophotometric method; soil pH was measured with a pH meter at a water/soil ratio of 1:2.5. All the above-mentioned soil properties are summarized in Table 1.
From 2014 to 2016, intact soil core samples were collected at the sowing and harvest stage at 0‒5 cm and 5‒15 cm depths along the ridge crests in both the CT and NT treatments to calculate the bulk density, total porosity, and water-holding capacity. The total porosity was calculated using undisturbed water-saturated samples of 100 cm3 under the assumption that air was not trapped in the soil pores; then, this was validated using dry bulk density and a particle density of 2.65 g cm−3. During the plant-growing period of 2014, 2015, and 2016, soil samples were taken every 10 cm at a depth of 100 cm and taken back to the laboratory; then, layer-weighted soil water contents for the 10 cm, 30 cm, 50 cm, 70 cm, and 90 cm depths were calculated using the oven-drying method. The maize leaf area index (LAI) was determined at four growth periods during the maize-growing season in 2014, 2015, and 2016 by measuring the maximum length and width of each green leaf for 10 plants. This was collected by randomly selecting a plant (as the first one) at the first row, at a fixed distance in front of the first plant; a second plant was selected in the second row, at a fixed distance from the second plant; a third plant was selected in the third row, and so on, until ten plants were collected. The maize was manually harvested from 40 randomly selected plants in each plot every year. Dry grain yields were obtained after threshing. The grain water content of 30 plants was determined by a Japanese PM-8188-A grain water meter and then converted into the yield per unit area (ha) of 14% standard water content. Statistically significant differences (p < 0.05) in soil bulk density, total porosity, and water-holding capacity were determined using the t-test between CT and NT; maize grain yield, LAI, and soil water contents between tillage treatments within each year were determined using the LSD procedure in SPSS software (SPSS 19.0).

2.4. Model Inputs

2.4.1. Weather and Soil Profile Data

The minimum weather data required for DSSAT include daily maximum and minimum air temperature (°C), daily solar radiation (MJ m−2), and daily precipitation (mm) [35]. The data in this study were collected from 2014 to 2016 from the Xinzhou weather station, located about 5 km from the experimental plots, and were formatted for model input using WeatherMan software [42] and plotted (Figure 1) using EasyGrapher v4.5 software [43]. The soil profile was divided into 8 soil layers in this study (0‒10, 10‒20, 20‒30, 30‒40, 40‒50, 50‒70, 70‒90, and 90‒110 cm). The required input for each soil layer included the soil volumetric water content at field capacity and saturation, soil texture, organic carbon content, and pH (Table 1).

2.4.2. Crop Growth and Cultivar Parameters

Crop cultivar parameters and genotypes, crop planting dates and depths, row spacing, fertilizer application types, rates, dates, tillage operations, and initial soil conditions including soil water content, soil nitrate, and ammonium contents are also required in DSSAT‒CMS [35]. Basic field management data for this study are summarized in Table S1. Crop cultivar coefficients including growth rates and stages, biomass generation, and grain yield need to be calibrated in local soil and weather conditions [35]. There are two approaches to calibrating the crop cultivar coefficients in studies with multiple treatments: one is using all treatments and some of the years for calibration, and the remaining years for evaluation; the other is using all years and some of the treatments for calibration, and the remaining treatments for evaluation [25]. The calibration should be conducted using the treatments with low water, heat, and nutrient stresses for each approach [44]. In this study, the measured maize yields were greater under CT; therefore, the cultivar was calibrated with CT treatment and in all years. The maize cultivars (XDH78) were calibrated with maize grain yields of CT in 2014, 2015, and 2016, and the grain yields of NT for all years were used for evaluation (Table 2). The cultivar coefficients were calibrated using simple trial and error to obtain the minimum root-mean-square error between the simulated and measured crop yields and growing periods. The cultivar parameter values resulting from this process were all plausible, close to the DSSAT “default” values, and within the established ranges for short-season maize varieties (Table 2).

2.5. Model Statistics Criteria

To evaluate the agreement between the simulated and measured data, we used root-mean-square error (RMSE), normalized root-mean-square error (nRMSE), mean error (E), index of agreement (d), and correlation coefficient (r). The RMSE was used to determine the accuracy of LAI and the water simulation degree. If RMSE > 0.3, this indicates that the difference between the simulated and measured value is large; if RMSE is in the range of <0.3, this indicates that the difference is small and the simulation degree is good. The coincidence degree between the simulated and the measured value is the d value: d close to 0 indicates no coincidence degree; d close to 1 indicates an excellent coincidence degree with less error. When the nRMSE is less than 10%, this indicates that the error between the simulated and the measured value is very low, and there is “excellent” agreement between the measured and the simulated value. When the nRMSE value is between 10% and 20%, the simulated value of the model is in “good” agreement with the measured value. In the range of 20%‒30%, the consistency reaches the “moderate” level; when this is above 30%, the consistency is poor [25].
R M S E = i = 1 n ( S i M i ) 2 n
n R M S E = R M S E M ¯ × 100
E = 1 n i = 1 n ( S i M i )
d = 1 i = 1 n S i M i 2 i = 1 n S i + M i 2
r = 1 i = 1 n S i M i 2 i = 1 n M i M ¯ 2
where Si and Mi are the ith simulated and measured value, respectively; n is the number of values; M ¯ is the average of the measured values, S i = S i M ¯ , and M i = M i M ¯ .

3. Results and Discussion

3.1. Field Experiment

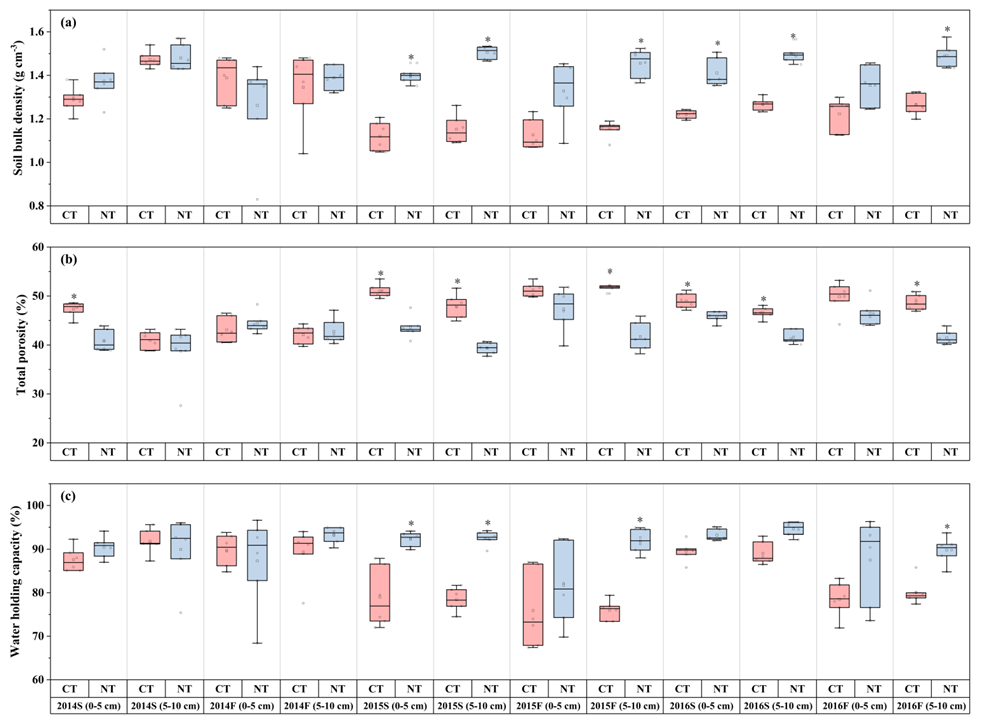
3.1.1. Soil Physical Properties

Soil physical properties, e.g., bulk density, total porosity, and water-holding capacity, can be used as soil quality indicators to evaluate the structure of soil that was influenced by tillage managements [45,46]. The difference was not significant for bulk density between conventional tillage (CT) and no-tillage (NT) in 2014 spring and fall at both soil depths (0‒5 cm and 5‒10 cm); however, significantly higher values were found for NT than those of CT in both spring and fall at the 0‒5 cm soil depth, and in fall at the 5‒10 cm soil depth in 2015 and 2016 (Figure 2a). Other researchers also reported that NT increased the surface soil bulk density [16,47,48,49]. In addition, the total porosities were higher for CT compared with the NT during 2014–2016 at both seasons and soil depths, especially in the springs of 2015 and 2016 at both soil depths and in falls of 2015 and 2016 at 5‒10 cm soil depth, where statistical differences were found (Figure 2b). The water-holding capacity in the NT ranged from 81.7% to 94.7%, which was higher than those of CT at both seasons and soil depths during 2014–2016, especially in the spring of 2015 at 0‒5 cm and 5‒10 cm, and in falls of 2015 and 2016 at 5–10 cm soil depths, where statistical differences were observed (Figure 2c). In general, three years of NT generally resulted in a higher bulk density and lower total porosity for the surface soil depths of 0–10 cm compared with CT, which, mainly due to the soil tillage, was conducted in CT treatment. Thus, compared with CT, the capacity of soil to hold water in the surface soil (i.e., 0–10 cm) was better than that for NT, as less soil was disturbed.

3.1.2. Maize Yields and Leaf Area Index

The experimental results from 2014 to 2016 showed that the maize grain yield of CT had a great inter-annual variation, ranging from 6570 to 7715 kg ha−1, and the three-year average grain yield was 6630 kg ha−1 (Figure 3a). The measured maize yield in NT ranged from 4448 kg ha−1 to 5250 kg ha−1, and the three-year average yield was 4890 kg ha−1 (Figure 3b). The measured maize grain yield of CT and NT in 2014 was significantly (p < 0.05) higher than those in 2015 and 2016, and there was no significant difference between 2015 and 2016; this is mainly due to the higher precipitation in 2014 (Figure 1). The inter-annual variation trend of maize yield under the two treatments was consistent, but the maize grain yield of NT was significantly (p < 0.05) lower than that of CT in all three years according to paired t-tests (Figure 3). Other studies also found similar results for sandy and clay soils [14,25]. Van de Putte et al. (2010) found that no-tillage reduced the maize yield, on average, by 8.5%, and no-tillage performed worse under drier climatic conditions [50]. The changes in leaf area index (LAI) measured in the field showed the expected shape of the “bell curve” from 2014 to 2016 for both CT and NT treatments (Figure 4). The mean values of the measured LAI from 2014 to 2016 for CT treatment were 1.02, 0.72, and 0.67, respectively, which were significantly (p < 0.05) higher than those under NT treatment (0.54, 0.60, and 0.34, respectively). Similar results were also reported by other authors [5]. There was a study report that NT with residue retention resulted in slow crop growth initially but compensated for this with an increased growth in the later stages [51]; however, this phenomenon was not observed in our study.

3.1.3. Soil Water Content Variations

The measured mean water contents during the growing season at soil depths ranging from 10 cm to 90 cm were similar between CT and NT and among the three years (Table S2, Figure 5 and Figure 6), while there were differences between the two treatments at various points during the growing seasons. Specifically, soil water contents were consistently higher for NT relative to CT at planting time (beginning of May) at a 10 cm soil depth during 2014–2016 (Figure 5 and Figure 6). However, the temporal and spatial variations in both measured and simulated soil water contents were consistently similar between CT and NT during the maize-growing season (Figure 5 and Figure 6). These results indicate that the soil water contents for NT were wetter than those of CT, especially at the surface soil. This is not uncommon [52,53]. Thus, the variations in soil water were impacted by both the tillage managements and the weather conditions (i.e., precipitation).

3.2. Model Calibration and Evaluation

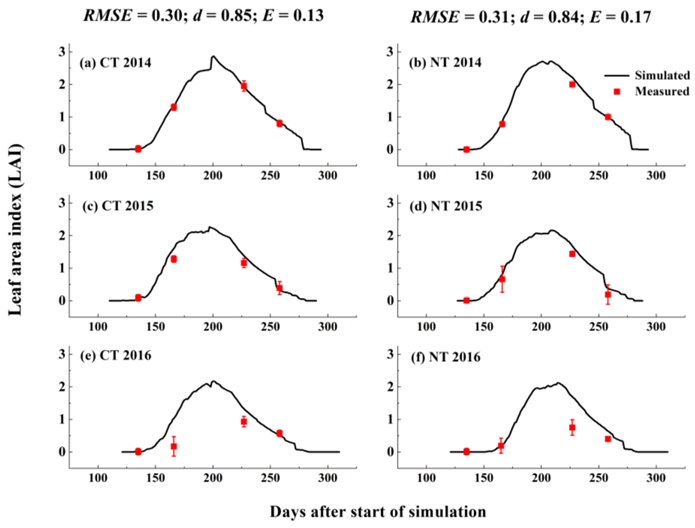
3.2.1. Maize Yields and Leaf Area Index

The measured maize yield for CT was used to calibrate the model parameters. As shown in Figure 3a, the simulated and measured maize yield for CT achieved excellent agreement; the corresponding statistics were nRMSE = 4.02%, d = 0.87, and E= −25 Kg ha−1, indicating that the maize cultivar coefficients were well calibrated for CT treatment. The difference between simulated and measured maize grain yield under NT treatment was slightly higher than that under CT treatment, but still achieved excellent agreement, and the corresponding statistics were nRMSE = 4.26%, d = 0.86, and E = −134 Kg ha−1, indicating that, although the model systematically underestimated maize grain yield, there was no significant difference (p > 0.05) between the simulated and measured values (Figure 3b). These results suggest that both the CSM-CERES-Maize model and the cultivar coefficients (Table 2) were successfully calibrated. It was also noted that simulated grain yields and model data fit statistics for CT and NT with continuous maize production were comparable with those of other simulating studies [25,54,55].
For CT treatment, the statistics were RMSE = 0.3 and d = 0.85, the simulated and measured LAI from 2014 to 2016 showed good agreement, and the corresponding E value was 0.13, indicating that the model slightly overestimated LAI value. However, there was no statistically significant difference between the simulated and the measured LAI value (Figure 4a,c,e). For NT treatment, although E = 0.24 indicated that the difference between simulated and measured LAI was higher than that of CT treatment, the RMSE = 0.31 and d = 0.84 indicated the moderate-to-good agreement of simulated and measured LAI for NT treatment. Overall, the fitting degree was acceptable for NT treatment (Figure 4b,d,f).

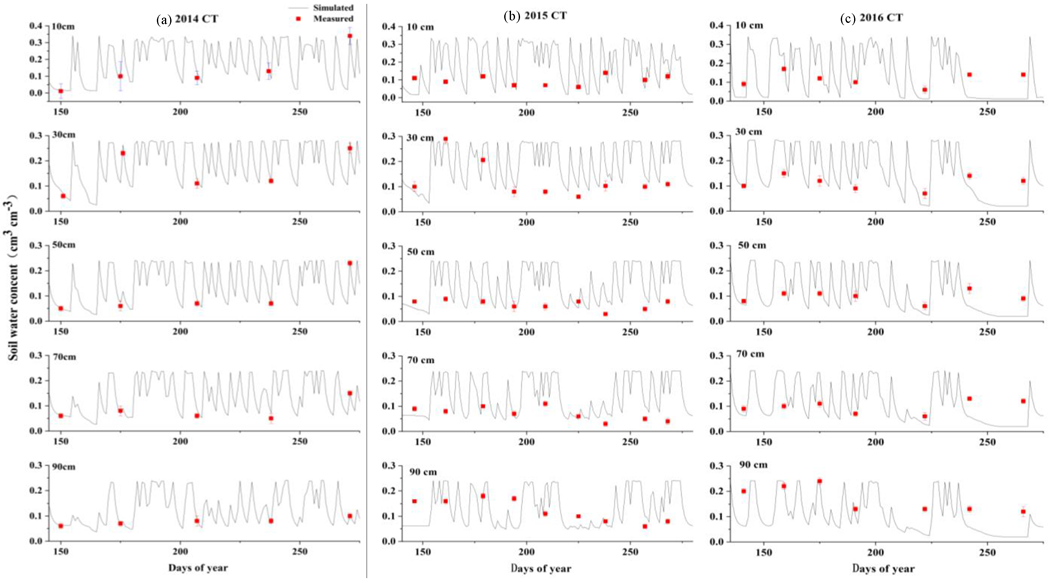
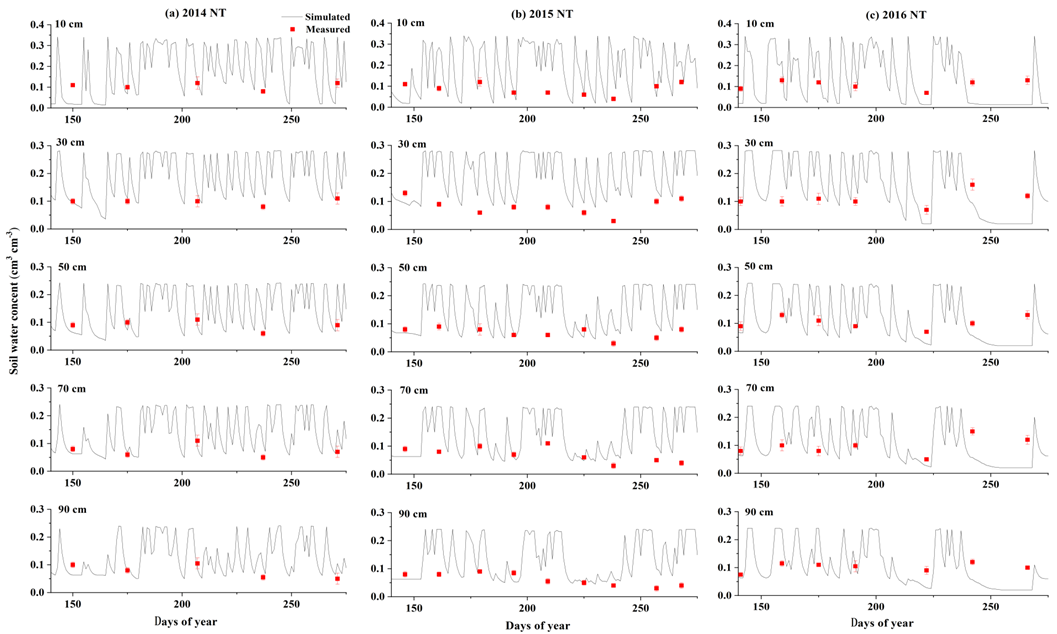
3.2.2. Soil Water Content

The soil water contents between tillage managements were successfully simulated by the DSSAT model (Table S2). The simulated and measured mean soil water variations were similar between CT and NT (Table S2), but the simulated water contents showed a substantially greater variation (Figure 5 and Figure 6). As a result, RMSE values ranged from 0.03 to 0.09 for both CT and NT during 2014–2016, which is lower than 0.3, indicating that the temporal and spatial soil water content variations were successfully predicted for both CT and NT treatments (Figure 5 and Figure 6; Table S1). d indicated good-to-moderate model data agreement (d = 0.73‒0.88) except at the 50 cm soil depth for CT, and good agreement for NT (d = 0.81‒0.95) during 2014–2016. Moreover, E values ranging from 0.00 to 0.04 cm3 cm3 for both CT and NT treatments were observed but were not significantly different from zero during 2014–2016 (Figure 5 and Figure 6; Table S2), which indicated that soil water contents were not systematically underestimated or overestimated by the model at the 0–90 cm soil depth during 2014–2016.

3.3. Model Application

3.3.1. Evapotranspiration

From 2014 to 2016, the total amounts of evapotranspiration for CT and NT treatments showed a similar change pattern during the whole growth period, first increasing and then decreasing, gradually increasing from seedling stage to tasseling stage, reaching their highest values at the tasseling stage, and decreasing at the harvest stage, as follows: tasseling start > harvest stage > elongation stage > seedling stage. In addition, the total crop transpiration of both CT and NT was higher than soil evaporation during the whole maize growth period over the three years (Figure 7). For CT, the total crop transpirations during the whole growth period were 400 mm, 389 mm, and 327 mm for 2014, 2015, and 2016, respectively (Figure 7a,c,e), which were greater than those of NT (371 mm, 352 mm, and 267 mm, respectively) (Figure 7b,d,f). This is due to the better growth of maize under CT, as evidenced by the higher values of LAI and grain yields (Figure 3 and Figure 4). However, the soil evaporation during the whole growth period for 2014, 2015, and 2016 was 195 mm, 215 mm, and 214 mm, respectively, for CT (Figure 7a,c,e), which was slightly lower than that of NT (200 mm, 235 mm, and 235 mm, respectively) (Figure 7b,d,f). Therefore, the total evapotranspiration during the growth period was greater for CT (595 mm, 605 mm, and 541 mm) than that of NT (571 mm, 589 mm, and 503 mm) during 2014–2016 (Figure 7). Thus, the evapotranspiration was influenced by both the weather conditions (i.e., rainfall and air temperature) and tillage managements [5].

3.3.2. Correlations between Crop Production and Water Conditions

At the seedling stage of maize, the crop dry-matter accumulation (CWAD) was significantly positively correlated with crop transpiration (EPAA), with a correlation coefficient of 0.784 (p < 0.01), and negatively correlated with soil water content (SWTD), with a correlation coefficient of ‒0.198 (p < 0.01), and there was a significant negative correlation between EPAA and SWTD, with a correlation coefficient of 0.237 (p < 0.01) (Table 3). At the jointing stage of maize, there was a significant positive correlation between CWAD and EPAA (correlation coefficient of ‒0.296). At the tasseling stage, SWTD was significantly positively (r = 0.138, p < 0.05) correlated with CWAD, but significantly negatively (r = ‒0.219, p < 0.01) correlated with EPAA. During the harvest period, the CWAD was significantly negatively correlated with EPAA (r = ‒0.396, p < 0.01), but significantly positively (p < 0.01) correlated with SWTD and GWAD (r = 0.332 and r = 0.465, respectively), and there was a significant negative correlation between GWAD and EPAA (r = ‒0.679, p < 0.01) (Table 3). The SWTD was generally negatively correlated with EPAA, and CWAD was generally positively correlated with EPAA and SWTD during the four stages. These results indicated that the maize yields and productions were mainly influenced by both EPAA and SWTD, e.g., the maize yields and productions increased as the SWTD and EPAA increased, to some extent.

4. Conclusions

No-tillage (NT) with a residue cover soil surface resulted in an enhanced soil-water-holding capacity and bulk density, but decreased total porosity. This did not significantly affect LAI, but decreased maize grain yields. There was no significant difference in mean soil water content between CT and NT during the cropping period. The DSSAT CSM-CERES maize model could generally provide reasonably good accuracy predictions for maize grain yields, good-to-moderate leaf area index (LAI), and good-to-poor accuracy for profile soil water contents. The physical-processes-based crop model (CSM-CERES maize model), together with the same soil water model, is, therefore, considered useful for predicting overall continuous maize growth and production, soil water dynamics, and water components under CT and NT systems in a semi-arid loess plateau of northwest China. The model can be used in this area to serve as a foundation for additional investigations into the effects of comparable tillage practices and continuous maize schedules to improve soil quality and agricultural productivity. The focus of future research should be on studies with other crops (mainly cereals) and under different habitat and humidity conditions, along with longer experimental studies, and consideration of the uncertainty caused by soil properties and measurements of soil water in profiles.

Supplementary Materials

The following supporting information can be downloaded at: https://www.mdpi.com/article/10.3390/land11111881/s1, Table S1: Field management for CT and NT during 2014–2016. Table S2: Statistical evaluations of measured and simulated soil water content in different layers for CT and NT during 2014–2016.

Author Contributions

Conceptualization, S.L.; methodology, S.L.; software, Y.G. and H.L.; validation, S.L. and Y.G.; formal analysis, S.L.; investigation, H.Z.; resources, H.Z. and Y.L.; data curation, S.L.; writing—original draft preparation, S.L.; writing—review and editing, S.L.; visualization, Y.G. and H.L.; supervision, H.Z.; project administration, Y.L.; funding acquisition, Y.L. All authors have read and agreed to the published version of the manuscript.

Funding

This study was supported by the National Natural Science Foundation of China (grant number U1910207 and 41401618) and the Shanxi Scholarship Council of China (grant number 2022‒022).

Data Availability Statement

Summarized data are presented and available in this manuscript and the rest of the data used and/or analyzed are available from the corresponding author on reasonable request.

Conflicts of Interest

The authors declare no conflict of interest.

References

  1. Deepak, T.S.; Jayadeep, P.A. Prospects of maize (corn) wet milling by-products as a source of functional food ingredients and nutraceuticals. Food Technol. Biotechnol. 2022, 60, 109–120. [Google Scholar] [CrossRef] [PubMed]
  2. Dabija, A.; Ciocan, M.E.; Chetrariu, A.; Codină, G.G. Maize and sorghum as raw materials for brewing, a review. Appl. Sci. 2021, 11, 3139. [Google Scholar] [CrossRef]
  3. Lobulu, J.; Shimelis, H.; Laing, M.; Mushongi, A.A. Maize production constraints, traits preference and current striga control options in western Tanzania: Farmers’ consultation and implications for breeding. Acta Agric. Scand. B Soil Plant Sci. 2019, 69, 734–746. [Google Scholar] [CrossRef]
  4. Zhang, D.; Li, D.; Li, H.; Wang, H.; Liu, J.; Ju, H.; Batchelor, W.D.; Li, R.; Li, Y. Strategies to reduce crop water footprint in intensive wheat-maize rotations in North China Plain. Agronomy 2022, 12, 357. [Google Scholar] [CrossRef]
  5. Liu, S.; Zhang, X.Y.; Yang, J.Y.; Drury, C.F. Effect of conservation tillage on soil physical properties, water storage and water use efficiency in Northeast China. Acta Agric. Scand. B Soil Plant Sci. 2013, 63, 383–394. [Google Scholar] [CrossRef]
  6. Gan, Y.; Campbell, C.A.; Liu, L.; Basnyat, P.; McDonald, C.L. Water use and distribution profile under pulse and oilseed crops in semiarid northern high latitude areas. Agric. Water Manag. 2009, 96, 337–348. [Google Scholar] [CrossRef]
  7. Endale, D.M.; Cabrera, M.L.; Steiner, J.L.; Radcliffe, D.E.; Vencill, W.K.; Schomberg, H.H.; Lohr, L. Impact of conservation tillage and nutrient management on soil water and yield of cotton fertilized with poultry litter or ammonium nitrate in the Georgia Piedmont. Soil Tillage Res. 2002, 66, 55–68. [Google Scholar] [CrossRef]
  8. Drury, C.F.; Reynolds, W.D.; Welacky, T.W.; Weaver, S.E.; Hamill, A.S.; Vyn, T.J. Impacts of zone tillage and red clover on corn performance and soil physical quality. Soil Sci. Soc. Am. J. 2003, 67, 867–877. [Google Scholar] [CrossRef]
  9. Drury, C.F.; Reynolds, W.D.; Yang, X.M.; McLaughlin, N.B.; Welacky, T.W.; Weaver, C.W.; Grant, C.A. Nitrogen source, application time, and tillage effects on soil nitrous oxide emission and corn grain yields. Soil Sci. Soc. Am. J. 2011, 76, 1268–1279. [Google Scholar] [CrossRef]
  10. Gruber, S.; Pekrun, C.; Mohring, J.; Claupein, W. Long-term yield and weed response to conservation and stubble tillage in SW Germany. Soil Tillage Res. 2012, 121, 49–56. [Google Scholar] [CrossRef]
  11. Drury, C.F.; Tan, C.S.; Welacky, T.W.; Oloya, T.O.; Hamill, A.S.; Weaver, S.E. Red clover and tillage influence on soil temperature, water content, and corn emergence. Agron. J. 1999, 91, 101–108. [Google Scholar] [CrossRef]
  12. Puustinen, M.; Koskiaho, J.; Peltonen, K. Influence of cultivation methods on suspended solids and phosphorus concentrations in surface runoff on clayey sloped fields in boreal climate. Agric. Ecosyst. Environ. 2005, 105, 565–579. [Google Scholar] [CrossRef]
  13. Dahiya, R.; Ingwersen, J.; Streck, T. The effect of mulching and tillage on the water and temperature regimes of a loess soil: Experimental findings and modeling. Soil Tillage Res. 2007, 96, 52–63. [Google Scholar] [CrossRef]
  14. Sharma, P.; Abrol, V.; Sharma, R.K. Impact of tillage and mulch management on economics, energy requirement and crop performance in maize-wheat rotation in rainfed subhumid inceptisols, India. Eur. J. Agron. 2011, 34, 46–51. [Google Scholar] [CrossRef]
  15. Moussa-Machraoui, S.B.; Errouissi, F.; Ben-Hammouda, M.; Nouira, S. Comparative effects of conventional and no-tillage management on some soil properties under mediterranean semi-arid conditions in northwestern Tunisia. Soil Tillage Res. 2010, 106, 247–253. [Google Scholar] [CrossRef]
  16. Soane, B.D.; Ball, B.C.; Arvidsson, J.; Basch, G.; Moreno, F.; Roger-Estrade, J. No-till in northern, western and south-western Europe: A review of problems and opportunities for crop production and the environment. Soil Tillage Res. 2012, 118, 66–87. [Google Scholar] [CrossRef] [Green Version]
  17. He, J.; Wang, Q.J.; Li, H.W.; Liu, L.J.; Gao, H.W. Effect of alternative tillage and residue cover on yield and water use efficiency in annual double cropping system in North China plain. Soil Tillage Res. 2009, 104, 198–205. [Google Scholar] [CrossRef]
  18. Chen, Z.; Cui, H.; Wu, P.; Zhao, Y.; Sun, Y. Study on the optimal intercropping width to control wind erosion in North China. Soil Tillage Res. 2010, 110, 230–235. [Google Scholar] [CrossRef]
  19. Wang, X.; Dai, K.; Zhang, D.; Zhang, X.; Wang, Y.; Zhao, Q.; Cai, D.; Hoogmoed, W.B.; Oenema, O. Dryland maize yields and water use efficiency in response to tillage/crop stubble and nutrient management practices in China. Field Crop Res. 2011, 120, 47–57. [Google Scholar] [CrossRef]
  20. Jin, Y.H.; Zhou, D.W.; Jiang, S.C. Comparison of soil water content and corn yield in furrow and conventional ridge sown systems in a semiarid region of China. Agric. Water Manag. 2010, 97, 326–332. [Google Scholar] [CrossRef]
  21. Prasuhn, V. On-farm effects of tillage and crops on soil erosion measured over 10 years in Switzerland. Soil Tillage Res. 2012, 120, 137–146. [Google Scholar] [CrossRef]
  22. DeLaune, P.B.; Sij, J.W. Impact of tillage on runoff in long term no-till wheat systems. Soil Tillage Res. 2012, 124, 32–35. [Google Scholar] [CrossRef]
  23. Su, Z.Y.; Zhang, J.S.; Wu, W.L.; Cai, D.X.; Lv, J.J.; Jiang, G.H.; Huang, J.; Gao, J.; Hartmann, R.; Gabriels, D. Effects of conservation tillage practices on winter wheat water-use efficiency and crop yield on the loess plateau, China. Agric. Water Manag. 2007, 87, 307–314. [Google Scholar] [CrossRef]
  24. Khaledian, M.R.; Mailhol, J.C.; Ruelle, P.; Rosique, P. Adapting pilote model for water and yield management under direct deeding system: The case of corn and durum wheat in a Mediterranean context. Agric. Water Manag. 2009, 96, 757–770. [Google Scholar] [CrossRef] [Green Version]
  25. Liu, S.; Yang, J.Y.; Zhang, X.Y.; Drury, C.F.; Reynolds, W.D.; Hoogenboom, G. Modelling crop yield, soil water content and soil temperature for a soybean-maize rotation under conventional and conservation tillage systems in Northeast China. Agric. Water Manag. 2013, 123, 32–44. [Google Scholar] [CrossRef]
  26. Brisson, N.; Gary, C.; Justes, E.; Roche, R.; Mary, B.; Ripoche, D.; Zimmer, D.; Sierra, J.; Bertuzzi, P.; Burger, P.; et al. An overview of the crop model STICS. Eur. J. Agron. 2003, 18, 309–332. [Google Scholar] [CrossRef]
  27. Flerchinger, G.N.; Hardegree, S.P. Modelling near-surface soil temperature and moisture for germination response predictions of post-wildfire seedbeds. J. Arid Environ. 2004, 59, 369–385. [Google Scholar] [CrossRef]
  28. Kool, J.B.; Van Genuchten, M.T. HYDRUS, One-Dimensional Variably Saturated Flow and Transport Model, Including Hysteresis and Root Water Uptake, Version 3.2; User Manual; Hydrogeologic Inc.: Herndon, VA, USA, 1989. [Google Scholar]
  29. Flerchinger, G.N.; Sauer, T.J.; Aiken, R.A. Effects of crop residue cover and architecture on heat and water transfer at the soil surface. Geoderma 2003, 116, 217–233. [Google Scholar] [CrossRef]
  30. Mailhol, J.C.; Olufayo, A.A.; Ruelle, P. Sorghum and sunflower evapotranspiration and yield from simulated leaf area index. Agric. Water Manag. 1997, 35, 167–182. [Google Scholar] [CrossRef]
  31. Jansson, P.E.; Moonb, D.S. A coupled model of water, heat and mass transfer using object orientation to improve flexibility and functionality. Environ. Modell Softw. 2001, 16, 37–46. [Google Scholar] [CrossRef]
  32. Ma, L.W.; Trout, T.J.; Ahuja, L.R.; Bausch, W.C.; Saseendran, S.A.; Malone, R.W.; Nielsen, D.C. Calibrating rzwqm2 model for maize responses to deficit irrigation. Agric. Water Manag. 2012, 103, 140–149. [Google Scholar] [CrossRef]
  33. Williams, J.R. The Erosion-Productivity Impact Calculator (EPIC) Model: A Case History; USDA ARS: Beltsville, MD, USA, 1990; pp. 421–427. [Google Scholar]
  34. Williams, J.R. The EPIC model. In Computer Models of Watershed Hydrology; Singh, V.P., Ed.; Water Resources Publisher: Highlands Ranch, CO, USA, 1995; pp. 909–1000. [Google Scholar]
  35. Jones, J.W.; Hoogenboom, G.; Porter, C.H.; Boote, K.J.; Batchelor, W.D.; Hunt, L.A.; Wilkens, P.W.; Singh, U.; Gijsman, A.J.; Ritchie, J.T. The DSSAT cropping system model. Eur. J. Agron. 2003, 18, 235–265. [Google Scholar] [CrossRef]
  36. Knörzer, H.; Grözinger, H.; Graeff-Hönninger, S.; Hartung, K.; Piepho, H.P.; Claupein, W. Integrating a simple shading algorithm into Ceres-wheat and Ceres-maize with particular regard to a changing microclimate within a relayintercropping system. Field Crop Res. 2011, 121, 274–285. [Google Scholar] [CrossRef]
  37. Gijsman, A.J.; Hoogenboom, G.; Parton, W.J.; Kerridge, P.C. Modifying DSSAT crop models for low-input agricultural systems using a soil organic matterresidue module from CENTURY. Agron. J. 2002, 94, 462–474. [Google Scholar] [CrossRef]
  38. IUSS Working Group WRB. World Reference Base for Soil Resources 2014, Update 2015: International Soil Classification System for Naming Soils and Creating Legends for Soil Maps; World Soil Resources Reports No. 106; FAO: Rome, Italy, 2015. [Google Scholar]
  39. Liang, H.B.; Xue, Y.R.; Shi, J.W.; Li, Z.S.; Liu, G.H.; Fu, B.J. Soil moisture dynamics under Caragana korshinskii shrubs of different ages in Wuzhai County on the Loess Plateau, China. Earth Environ. Sci. Trans. R. Soc. Edinb. 2019, 109, 387–396. [Google Scholar] [CrossRef]
  40. Jiang, X.J.; Liu, S.; Zhang, H. Effects of different management practices on vertical soil water flow patterns in the Loess Plateau. Soil Tillage Res. 2017, 166, 33–42. [Google Scholar] [CrossRef]
  41. Evett, S.R. Gravimetric and volumetric direct measurements of soil water content. In Field Estimation of Soil Water Content: A Practical Guide to Methods, Instrumentation, and Sensor Technology. IAEA-TCS-30; Evett, S.R., Heng, L.K., Moutonnet, P., Nguyen, M.L., Eds.; International Atomic Energy Agency: Vienna, Austria, 2008; pp. 23–24. [Google Scholar]
  42. Wilkens, P.W. Chaper 4-DSSAT v4 Weather Data Editing Program (WeatherMan). In Decision Support System for Agrotechnology Transfer Version 4.0; Hoogenboom, G., Jones, J.W., Porter, C.H., Wilkens, P.W., Boote, K.J., Batchelor, W.D., Hunt, L.A., Tsuji, G.Y., Eds.; DSSAT v4: Data Management and Analysis Tools; University of Hawaii: Honolulu, HI, USA, 2004; Volume 2. [Google Scholar]
  43. Yang, J.Y.; Huffman, E.C. Easygrapher: Software for graphical and statistical validation of dssat outputs. Comput. Electron. Agric. 2004, 45, 125–132. [Google Scholar] [CrossRef]
  44. Boote, K.J.; Jones, J.W.; Hoogenboom, G. Simulation of crop growth: CROPGRO model. In Agricultural Systems Modeling and Simulation; Peart, R.M., Curry, R.B., Eds.; Marcel Dekker: New York, NY, USA, 1998; pp. 1–42. [Google Scholar]
  45. Fabrizzi, K.P.; García, F.O.; Costa, J.L.; Picone, L.I. Soil water dynamics, physical properties and corn and wheat responses to minimum and no-tillage systems in the southern Pampas of Argentina. Soil Tillage Res. 2005, 81, 57–69. [Google Scholar] [CrossRef]
  46. Hou, X.; Li, R.; Jia, Z.; Han, Q.; Wang, W.; Yang, B. Effects of rotational tillage practices on soil properties, winter wheat yields and water-use efficiency in semi-arid areas of north-west China. Field Crop Res. 2012, 129, 7–13. [Google Scholar] [CrossRef]
  47. Franzluebbers, A.J.; Schomberg, H.H.; Endale, D.M. Surface-soil responses to paraplowing of long-term no-tillage cropland in the Southern Piedmont USA. Soil Tillage Res. 2007, 96, 303–315. [Google Scholar] [CrossRef]
  48. Glab, T.; Kulig, B. Effect of mulch and tillage system on soil porosity under wheat (Triticum aestivum). Soil Tillage Res. 2008, 99, 169–178. [Google Scholar] [CrossRef]
  49. Alvarez, R.; Steinbach, H.S. A review of the effects of tillage systems on some soil physical properties, water content, nitrate availability and crops yield in the Argentine Pampas. Soil Tillage Res. 2009, 104, 1–15. [Google Scholar] [CrossRef]
  50. Van den Putte, A.; Govers, G.; Diels, J.; Gillijns, K.; Demuzere, M. Assessing the effect of soil tillage on crop growth: A meta-regression analysis on european crop yields under conservation agriculture. Europ. J. Agron. 2010, 33, 231–241. [Google Scholar] [CrossRef]
  51. Verhulst, N.; Govaerts, B.; Nelissen, V.; Sayre, K.D.; Crossa, J.; Raes, D.; Deckers, J. The effect of tillage, crop rotation and residue management on maize and wheat growth and development evaluated with an optical sensor. Field Crop Res. 2011, 120, 58–67. [Google Scholar] [CrossRef]
  52. Schwartz, R.C.; Baumhardt, R.L.; Evett, S.R. Tillage effects on soil water redistribution and bare soil evaporation throughout a season. Soil Tillage Res. 2010, 110, 221–229. [Google Scholar] [CrossRef]
  53. Cullum, R.F. Influence of tillage on maize yield in soil with shallow fragipan. Soil Tillage Res. 2012, 119, 1–6. [Google Scholar] [CrossRef]
  54. Monzon, J.P.; Sadras, V.O.; Andrade, F.H. Modelled yield and water use efficiency of maize in response to crop management and Southern Oscillation Index in a soil-climate transect in Argentina. Field Crop Res. 2012, 130, 8–18. [Google Scholar] [CrossRef]
  55. Liu, H.L.; Yang, J.Y.; Drury, C.F.; Reynolds, W.D.; Tan, C.S.; Bai, Y.L.; He, P.; Jin, J.; Hoogenboom, G. Using the DSSAT-CERES-Maize model to simulate crop yield and nitrogen cycling in fields under long-term continuous maize production. Nutr. Cycl. Agroecosyst. 2011, 89, 313–328. [Google Scholar] [CrossRef]
Figure 1. Daily precipitation, solar radiation, and maximum and minimum air temperature during 2014–2016.
Land 11 01881 g001
Figure 2. Soil bulk density (a), total porosity (b), and water holding capacity (c) for CT and NT at 0–5 cm and 5–10 cm depths at spring (S) and fall (F) of 2014–2016. * p < 0.05.
Land 11 01881 g002
Figure 3. Measured and simulated maize grain yield for CT and NT during 2014–2016.
Land 11 01881 g003
Figure 4. Measured and simulated maize LAI for CT and NT during 2014–2016.
Land 11 01881 g004
Figure 5. Measured and simulated soil water contents for CT at different soil depths during 2014–2016.
Land 11 01881 g005
Figure 6. Measured and simulated soil water contents for NT at different soil depths during 2014–2016.
Land 11 01881 g006
Figure 7. Simulated change in evapotranspiration at different stages during 2014–2016.
Land 11 01881 g007
Table 1. Soil profile data collected in 2014 spring and used as initial condition input of the model.
Soil DepthBulk DensityField CapacityWilting PointSaturated Water ContentSilt
Content
Clay
Content
Organic
Carbon Content
pH
(cm)(g cm−3)(cm3 cm−3 )(cm3 cm−3 )(cm3 cm−3 )(%)(%)(%)
0‒101.100.3850.1150.44012.991.900.479.44
10‒201.190.3330.1400.37215.112.050.369.42
20‒301.380.1930.1380.2098.481.330.369.56
30‒401.390.2410.1280.2527.921.140.379.38
40‒501.500.2400.1530.2466.490.410.379.36
50‒701.550.2200.1360.2255.090.420.319.33
70‒901.570.2010.1300.2113.160.560.269.30
90‒1101.580.1980.1460.2001.990.850.219.20
Table 2. Default cultivar coefficient ranges in the DSSAT model and calibrated cultivar coefficients for CT of maize.
Maize Cultivar ParameterRangeDefault CultivarCalibrated
Cultivar
P1: Time from seedling emergence to the end of juvenile phase during which the plant is not responsive to photoperiod (degree day > 8 °C)100‒400220.8230.8
P2: Extent to which development (expressed as days) is delayed for each hour increase in photoperiod > the longest photoperiod 12.5 h)0‒4.02.552.9
P5: Thermal time from silking to physiological maturity (degree day > 8 °C)600‒900842.8842.8
G2: Maximum possible number of kernels per plant380‒1000898.8950.1
G3: Kernel growth rate during the linear grain filling stage under optimum conditions (mg d−1)5‒126.9527.529
PHINT: Phyllochron interval between successive leaf tip appearances (degree day per tip)38.9‒55.038.938.9
Table 3. Correlation between crop production and water condition.
Growth Stage CWADEPAASWTDGWAD
CWAD1.000
SeedingEPAA0.784 **1.000
SWTD−0.198 **−0.237 **1.000
CWAD1.000
JointingEPAA0.332 **1.000
SWTD0.087−0.0921.000
CWAD1.000
TasselingEPAA0.0351.000
SWTD0.138 *−0.219 **1.000
CWAD1.000
HarvestingEPAA−0.396 **1.000
SWTD0.149 **0.1001.000
GWAD0.019 **−0.679 **−0.0031.000
Note: CWAD: Dry matter accumulation (kg ha1); EPAA: Crop transpiration (mm d−1); SWTD: Soil water content (mm); GWAD: Grain yield (kg ha1); * p < 0.05; ** p < 0.01.
Publisher’s Note: MDPI stays neutral with regard to jurisdictional claims in published maps and institutional affiliations.

