Article

Land Use Pattern Affects Microplastic Concentrations in Stormwater Drains in Urban Catchments in Perth, Western Australia

1
School of Agriculture and Environment, The University of Western Australia, 35 Stirling Highway, Perth, WA 6009, Australia
2
Centre for Microscopy, Characterization, and Analysis, The University of Western Australia, 35 Stirling Highway, Perth, WA 6009, Australia
*
Author to whom correspondence should be addressed.
Land 2022, 11(10), 1815; https://doi.org/10.3390/land11101815
Submission received: 14 September 2022 / Revised: 12 October 2022 / Accepted: 12 October 2022 / Published: 17 October 2022
(This article belongs to the Special Issue Impacts of Land Use Pattern in Metropolitan Area)

Abstract

:
Stormwater drains act as important vectors for microplastics, enabling the transportation of microplastic polymers from terrestrial systems where they are produced and consumed to aquatic and marine ecosystems. In this study, microplastic concentrations and their size fractions were measured in six stormwater catchments in the Perth and Peel region of Western Australia. Stormwater drains with contrasting land uses and catchment characteristics were selected and two sites along each drain were sampled. Water samples were filtered in situ with a purpose-built fractionation device. Catchment boundaries and contributing drainage areas were derived from a hydrologically enforced digital elevation model. Microplastic concentrations within the sites varied from 8.8 to 25.1 microplastics/L (mean 14.2 microplastics/L). Fibrous microplastics were the most common morphology, followed by fragments. Polymer types identified using Raman spectroscopy included polypropylene (64.6% of samples), polyethylene (64.7%), polytetrafluoroethylene (5.9%) and polyvinylidene fluoride (5.9%). There was no statistically significant variation in microplastic concentrations across or within stormwater catchments. A linear mixed-effect model showed that several components of the land use pattern: catchment area, catchment population, and the proportion of industrial land, natural land and public open space, were positively related to microplastic concentrations. The proportion of residential land was negatively related to microplastic concentrations. The lack of significant variation in microplastic concentration observed both across and within the catchments points to their ubiquitous presence in stormwater systems in the region. This study is the first to examine microplastic contamination in the water of stormwater drainage systems in Perth, Western Australia. These stormwater systems contain considerable concentrations of microplastics, confirming their importance as transport mechanisms for plastics into aquatic and marine ecosystems.

1. Introduction

The mass production of plastic products began in the 1940s and over 7800 million tons of plastics have been produced since the year 1950 [1]. Less than 5% of these plastic products have been recovered, resulting in accumulation in various environments including marine, freshwater, urban, remote, agricultural, and industrial systems [2,3].
Microplastics are plastic particles with a diameter of less than 5 mm and have been widely identified as contaminants of concern [3,4]. Microplastics are important pollutants due to their small particle size, resistance to biodegradation and ability to move through various environmental media. Importantly, microplastics have a significant capacity to be readily absorbed and ingested by organisms [5]. As such, microplastic polymers represent a substantial risk to wildlife as the small particles may be mistaken as food and ingested; they are also small enough to be ingested by filter feeders and planktonic organisms giving a high potential for bioaccumulation of plastics themselves and co-contaminants [6,7]. The high surface area and hydrophobicity of microplastics allows the sorption of co-contaminants such as polycyclic aromatic hydrocarbons and heavy metals [8,9].
Microplastics can be classified by shape (fibres, fragments, film, microbeads) [10]. As well as shape, microplastics can also be categorised as either primary (intentionally manufactured as small particles, e.g., cosmetic microbeads) or secondary (derived from degradation and fragmentation of larger plastics).
Microplastic research was initially focused on marine environments, while terrestrial systems received far less attention [11]. Terrestrial microplastic contamination is 4–23 times greater than in marine environments, and land-based inputs are important sources preceding the transport of microplastics to the ocean [12].
Stormwater was first indirectly identified as a source of microplastics to urban lakes, and marine locations near urbanisation, based on mass balance rather than direct measurement [13,14] Stormwater runoff has since been widely identified as an important transport mechanism for microplastic pollution on land to the marine environment [12,15]. Urban stormwater seldom receives treatment which could remove microplastic particles, allowing direct fluxes to riverine and marine systems [16]. Microplastics enter stormwater systems through a combination of atmospheric deposition and overland flow [17,18] following which they may be removed by entanglement with organic materials, biofouling, or sedimentation [17,19,20]. Whether microplastics flow through stormwater systems or settle in sediment is determined by the size, shape and density of the particles [19].
Microplastics found in stormwater are comprised of a wide range of polymers with some of the most common being polyethylene, polypropylene, polyvinyl chloride, polyethylene terephthalate, and polystyrene [17]. The absolute abundance of microplastics, and the relative abundance of polymer types, will to some extent reflect the land use and human activities in the catchment [12]. There is no widespread consensus that land use intensity and population density can adequately account for microplastic concentrations in all areas of the globe [20]. Instead, other factors such as weather, specifically the timing of rainfall before sampling, affect measured microplastic concentrations, but these effects are also inconsistent [21,22].
This study is the first to examine the concentration, polymer type and shape of microplastics found in the water of stormwater drainage in Western Australia. The study aimed to answer the following research questions:
  • What is the concentration of microplastics in selected stormwater drains across the Perth and Peel region?
  • What plastic shapes, sizes, colours and polymer types are identified in the drainage systems?
  • Is there a significant difference in microplastic concentrations within or between any of the drainage systems?
  • Does the land use pattern, as defined by catchment area, catchment population, pre-sampling rainfall, and the proportions of residential, industrial, commercial, agricultural, natural land, and public open spaces, affect stormwater plastic concentrations?

2. Materials and Methods
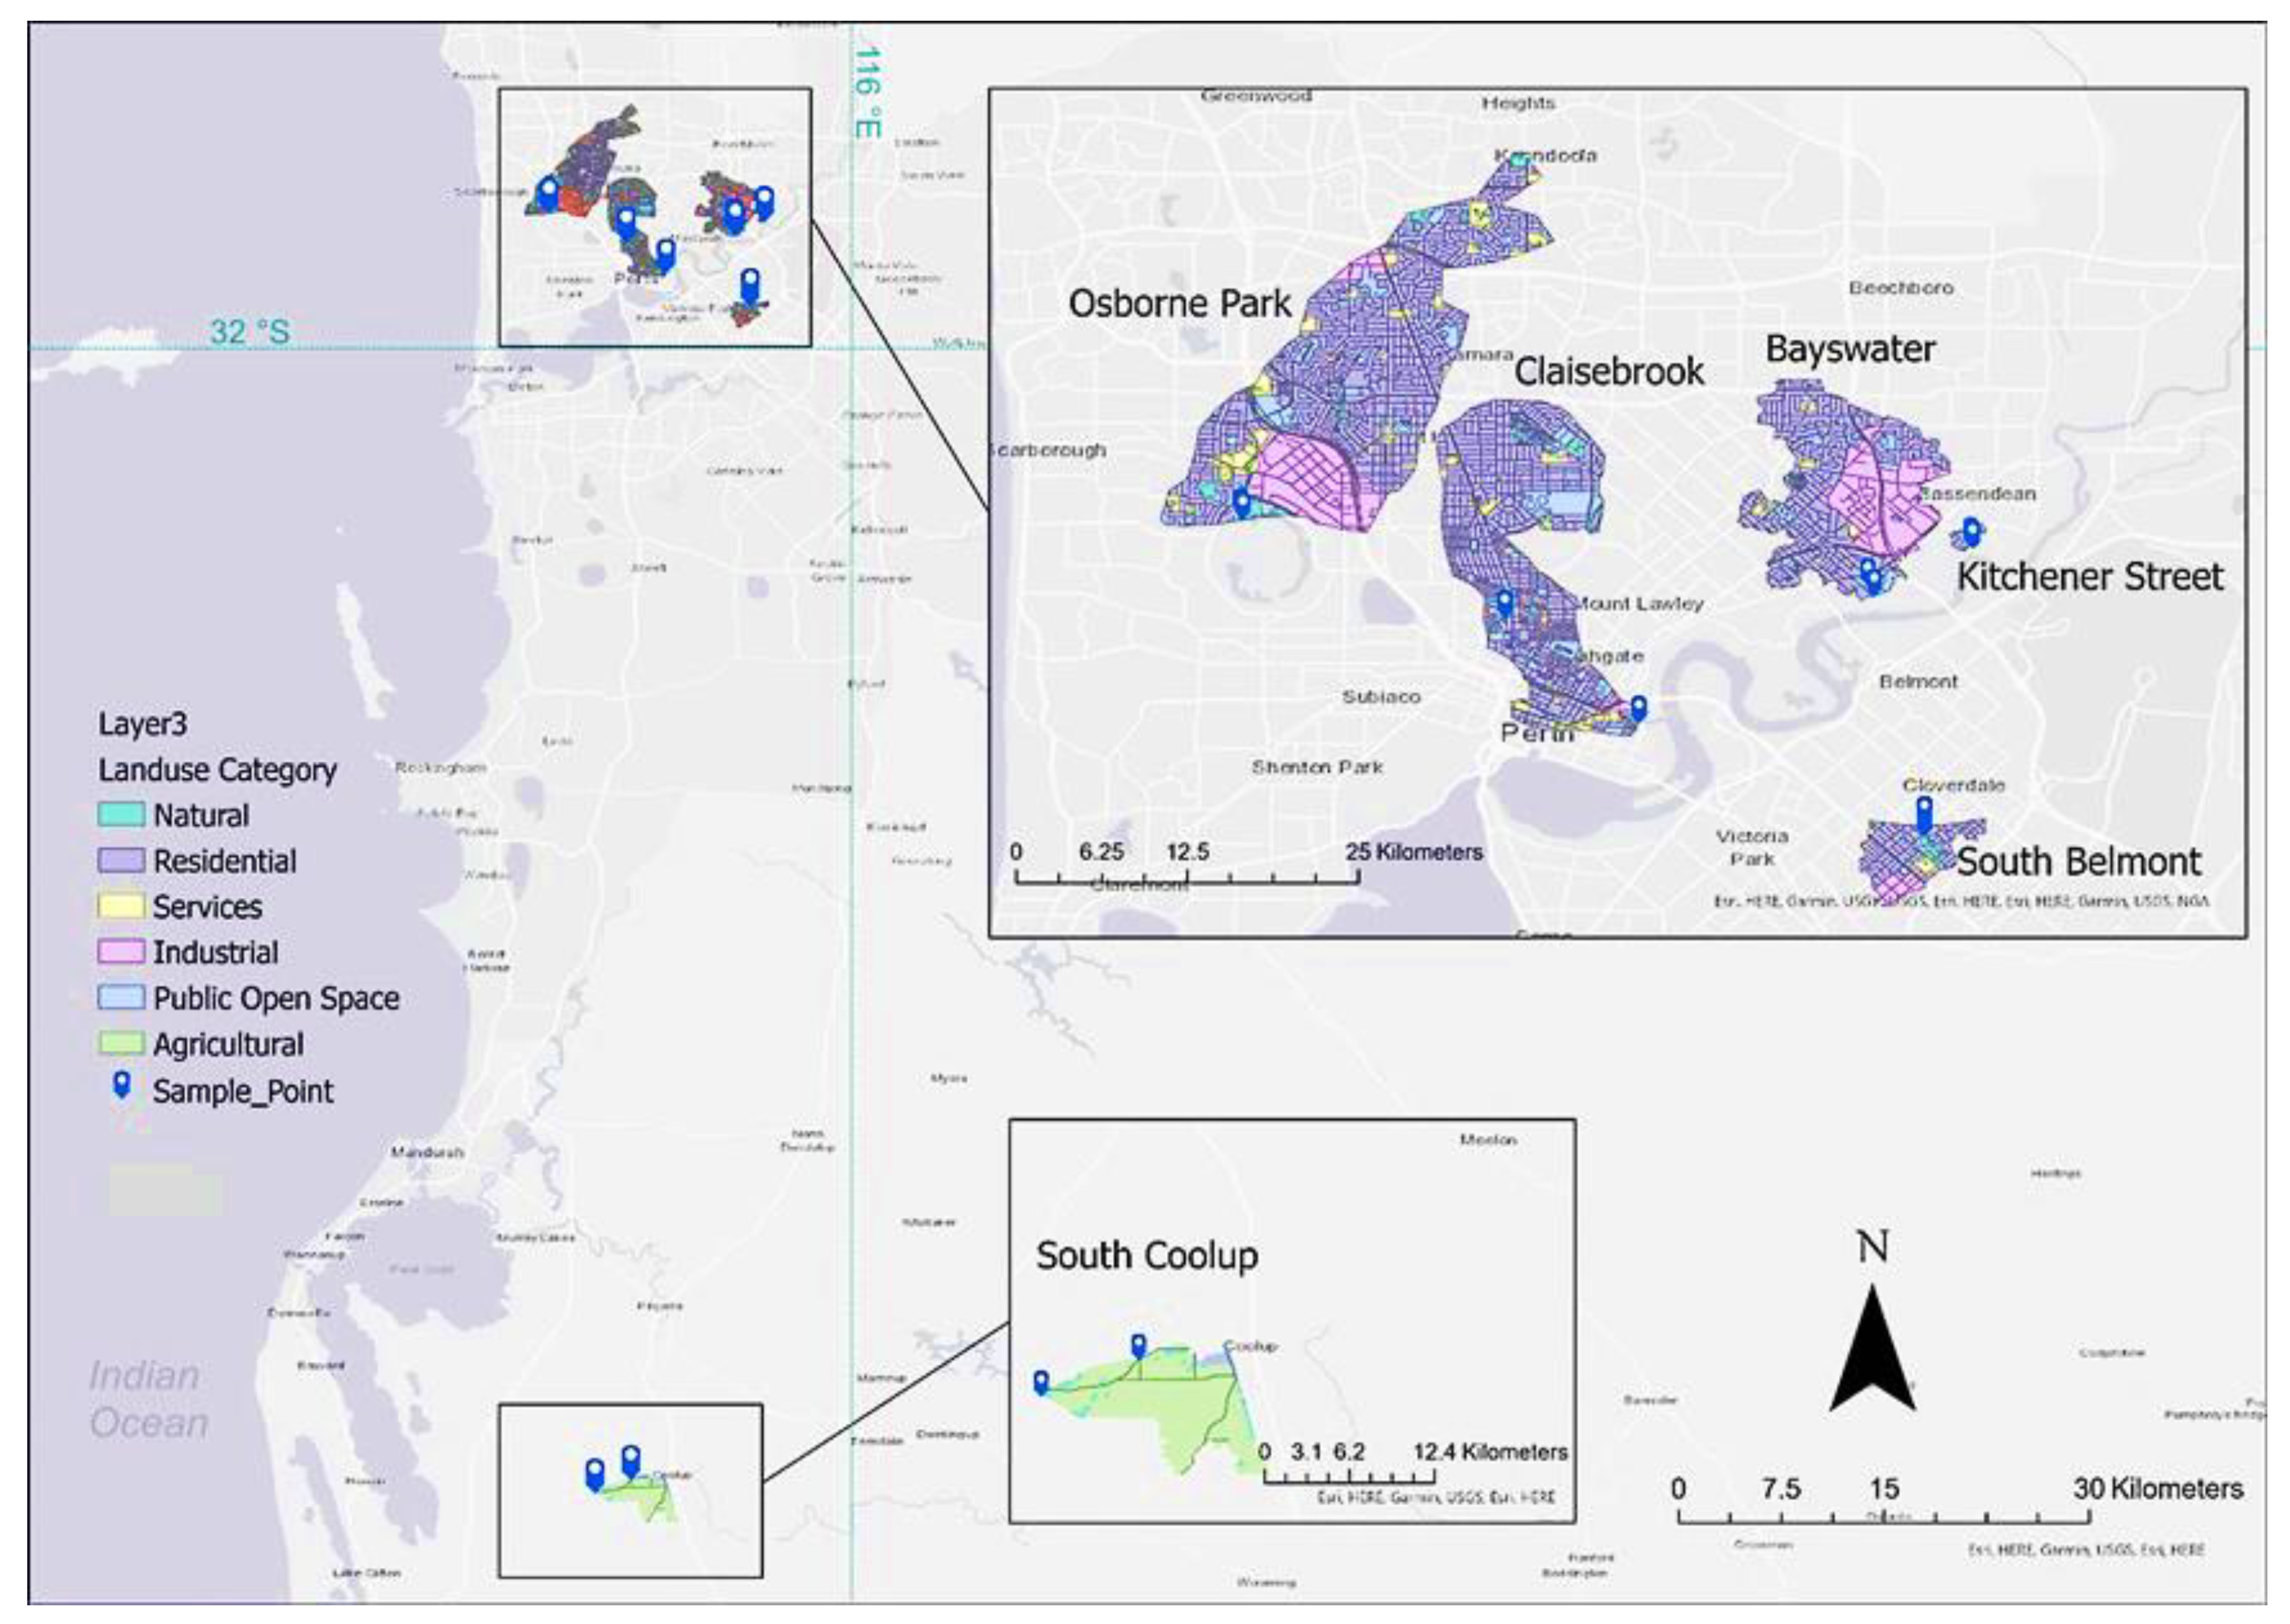
2.1. Sample Sites

Six stormwater drainage systems were selected for sampling (Figure 1), based on their accessibility, broad distribution across the Perth area, and pattern of surrounding land uses, based on a shapefile of Water Corporation stormwater drains [23]. Two sites were sampled along each of the Bayswater Main Drain, Claisebrook Main Drain, Kitchener St Drain, Osborne Park Branch Drain, South Belmont Main Drain and South Coolup Main Drain (Figure 1). Details of samples are presented in Table 1. The region sampled has a winter-wet subtropical climate (Köppen Csa), with mean annual rainfall (1993–2021) of 737 mm, with 77% of rainfall occurring May–September.

2.2. Sampling Protocol

The design of the sampler used (Figure 2) was adapted from Ziajahromi et al. [24]. Each sampler used 10 cm diameter stainless steel disks (All-round Mesh, Victoria, Australia), with one of each of the aperture sizes (530 µm, 190 µm, 100 µm, and 25 µm), stacked between five 5 cm long PVC pipe joiners of 10 cm diameter, so each size class had a lower bound corresponding to the aperture size of the filter. The PVC joiners were then fastened together to form one 25 cm pipe with the filtration disks at 5 cm intervals.
Samples of either 5 L or 10 L were taken from the top 10–15 cm of the water body using a bucket. Where suspended solid content was high, and filtering the full 10 L was not feasible, 5 L samples were taken. The samples were then decanted through the stacked filtration device, leaving only suspended particles including any microplastics in the samples on the mesh disks. 250 mL of clean water was then added to rinse any potential microplastics stuck to the sides and poured through the sampling device. Each mesh disk was wrapped in aluminium foil for transport and storage. Sampling was conducted during winter. The timing of sampling was not related to the timing of rainfall.

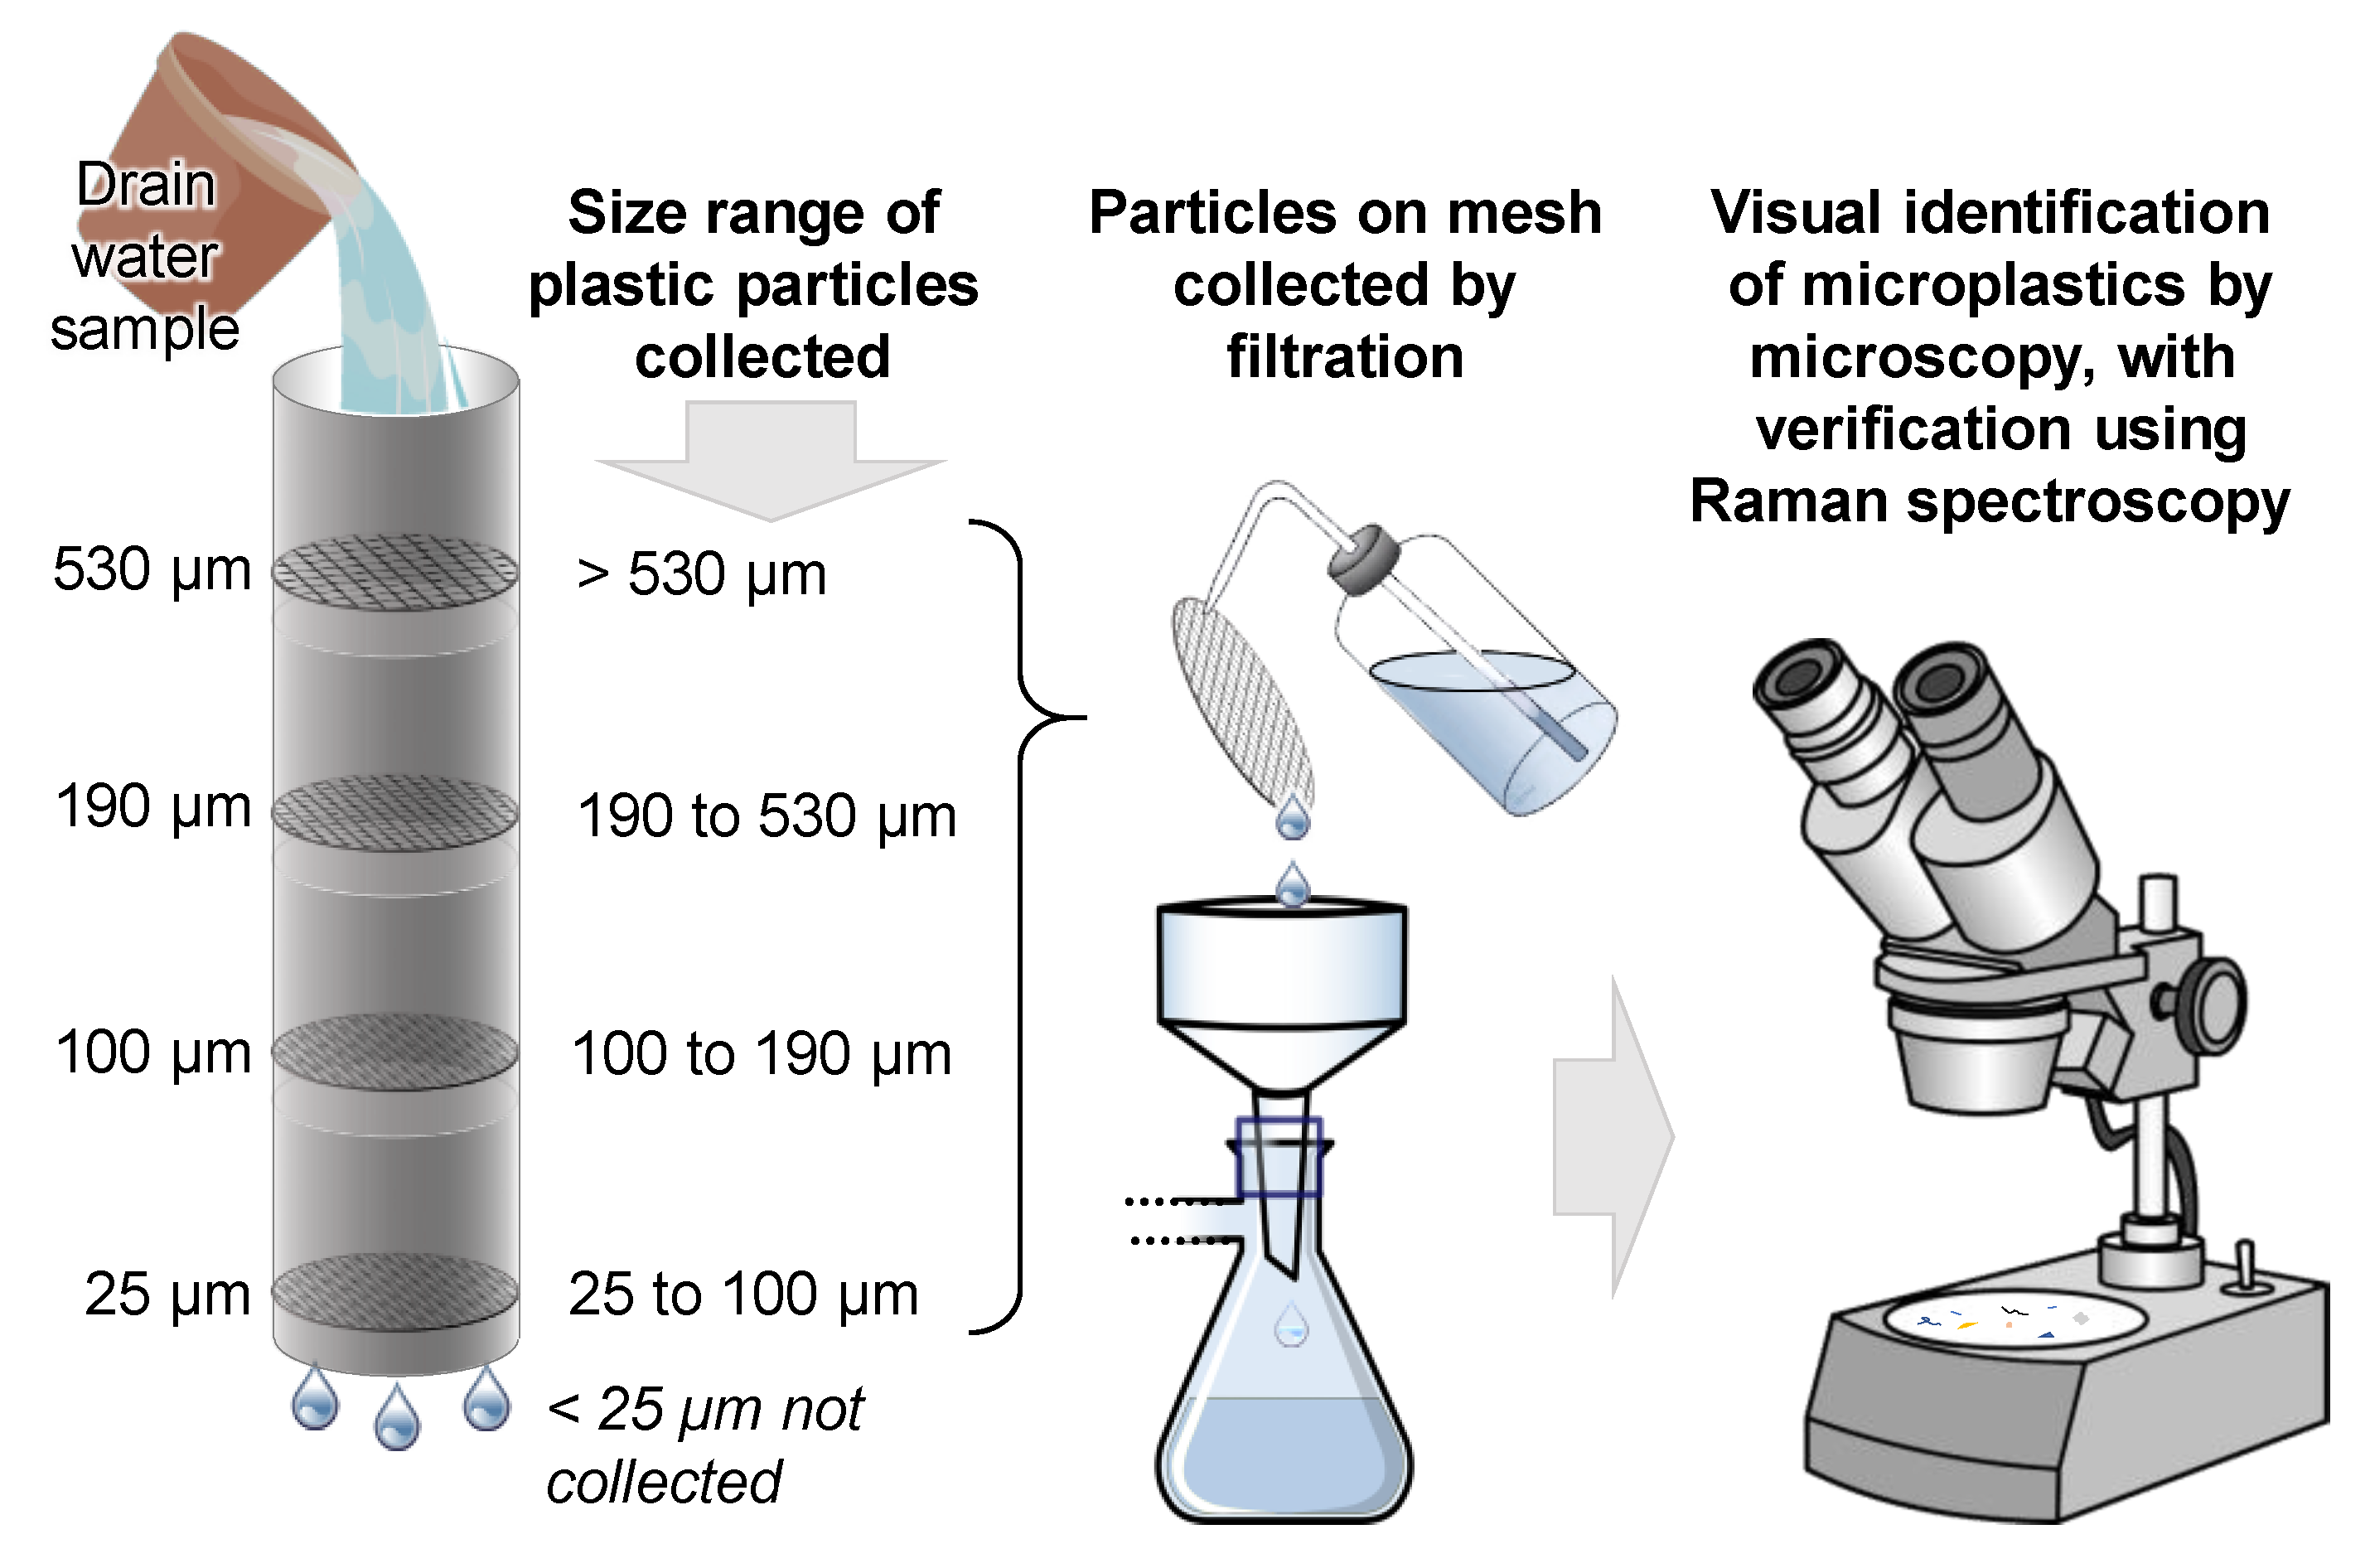
2.3. Sample Processing

The solids on mesh sample filters and Al-foil wrappers were rinsed onto glass fibre filters (Whatman GF/A) for vacuum filtration. A scalpel was used to remove gently any remaining contents onto the filter. The glass filters were then removed carefully from the filter funnel/manifold and placed in clean Petri dishes in prior to microscopic analysis.

2.4. Sample Analysis

Microplastics were initially identified using a Nikon TE-PSE30 microscope at 4.5× magnification, according to the criteria identified by Hidalgo-Ruz et al. [25]; in addition, there should be no visible cellular or other organic structures, except for possible biofouling, and a positive reaction to the hot needle test [20,25]. Suspected microplastics on each filter were counted and categorised according to shape and colour. The shape categories included beads (spherical particles), films (thin coatings), fragments (diameter > thickness) or fibres (length > diameter) [10]. Colour categories included clear, white, grey, black, brown, blue, green, yellow, orange, red and pink.

2.5. Blanks

Potential background contamination in the laboratory and filtration processes were accounted for by assessing blank samples. Uniformity across the controls and samples themselves was ensured by processing both samples and blanks simultaneously in the laboratory. Five blank samples of 10 mL deionised (DI) water were passed through the glass fibre filters and analysed to determine background contamination from the equipment and DI water [20]. These filters were left uncovered for half an hour to replicate the exposure to atmospheric deposition experienced by the samples during the processing and counting of suspected microplastics on the samples.

2.6. Microplastic Identification and Characterisation

A randomly selected subset of visually identified microplastics were analysed using Raman microscopy (WITEC Alpha 300 RA+ Confocal Raman microscope). This representative subsample consisted of 6 fragments and 32 fibres, approximating the proportions of these particle morphologies in the samples. Microplastic particles were adhered to a clean glass slide with a droplet of silicone oil having a known Raman spectrum with minimal interfering bands.
Raman spectroscopy was conducted on a WITec Alpha 300 RA+ system with an Andor iDUS 401 CCD maintained at −60 °C, and a 20× objective. Infrared (785 nm) and red (633 nm) lasers were used with a 600 mm−1 grating. Spectra were collected using ProjectFIVE software and cross-referenced manually using reference materials from the Spectral Database Index from the Infrared & Raman Users Group [26]. A false positive frequency was then calculated from the results of this Raman subsample verification and used to correct raw microplastic counts. Raman analysis was selected over ATR-FTIR spectroscopy due to its ability to analyse smaller particle sizes [27].

2.7. Data Analysis

Catchment modelling was conducted for each of the drainage systems. Geosciences Australia’s Digital Elevation Model (DEM) for the Perth and Peel region was used to delineate areas of low-lying land [28]. Water Corporation and Department of Water and Environmental Regulation drainage channel datasets were compiled, along with the DEM, in ArcGIS 2.6.0 [29]. Watersheds for the entire drainage system were then calculated by mapping the flow direction of overland runoff. These watersheds estimate the total contributing drainage area for the system from the point of discharge. These watershed polygons were then manually altered to match the extent of drainage flow at each specific sampling location. The manual alterations were determined by interpreting the flow accumulation layer and approximating where the flow would funnel into the sample location. This created a more accurate representation of the actual catchment area flowing into each individual sampling location. These site-specific catchments were then converted to polygons, and the internal area of each was calculated, giving the area of land that each of the sample sites serviced. The watersheds calculated for the Claisebrook Main Drain and Osborne Park Branch Drain catchments were originally miscalculated from this catchment modelling process, as the digital elevation model did not account for anthropogenic alterations to the drainage systems in this area. As such, the catchment for these two drainage channels was manually entered into ArcGIS using reference materials on the actual catchment extent from DWER (2014) and Kobryn (2001).
The land use classification layers imported into ArcGIS were adapted from the Australian Land Use Management categories [30] used in the Department of Primary Industries and Regional Development land use dataset [31]. To simplify analysis, land use classifications were regrouped into six categories: residential (urban and rural); industrial; services; agriculture (including horticulture); natural (including water bodies); and public open space. Any misclassifications (e.g., natural land classed as production forestry) were corrected.
The population for each catchment was then determined by multiplying the population density of each suburb within the catchment by the area of the catchment it occupies. The population estimates from the fractions of suburbs within the overall catchment were then summed to give a catchment-wide population. Rainfall amounts were calculated as the cumulative rainfall for the 7 days prior to sampling. Rainfall data were obtained from the Australian Bureau of Meteorology records at the nearest weather station to each location [32].
All data curation and analyses were performed in R [33]. Prior to statistical analysis, microplastic count data were corrected to account for both background contamination from blank measurements, and the false positive rates identified with Raman spectroscopy. Corrections involved random sampling from vectors of experimental blank and false positive count measurements, rather than using mean blank or false positive values.
The differences in mean microplastic concentrations between catchments and sites were assessed using Type-II ANOVA based on linear mixed-effect (LME) models with Tukey pairwise contrasts, cross-checked with non-parametric Kruskal–Wallis tests. LME models were implemented in the R package ‘nlme’ [34], with contrasts calculated using the R package ‘multcomp’ [35]. The effects of relevant covariates (catchment population; catchment area; prior rainfall; proportions of the land use categories residential, industrial, services, agricultural, and public open space) on microplastic concentrations were assessed using linear mixed-effect models with sampling site as random effects and each covariate separately as fixed effects. Nested alternatives for each model were (1) using constant variance structure independent of catchment or sampling site; (2) including a variance function with different standard deviations for each catchment, and (3) including a variance function with different standard deviations for each sampling site. The model alternative selected for each covariate was the one giving the lowest Aikake Information Criterion value, if an analysis of variance showed a significant improvement over the next most complex model.

3. Results

3.1. Catchment Modelling

The catchment modelling output defined the area, estimated population, rainfall total for the week leading up to the date of sampling, and land use proportions expressed as percentages (Table 2).

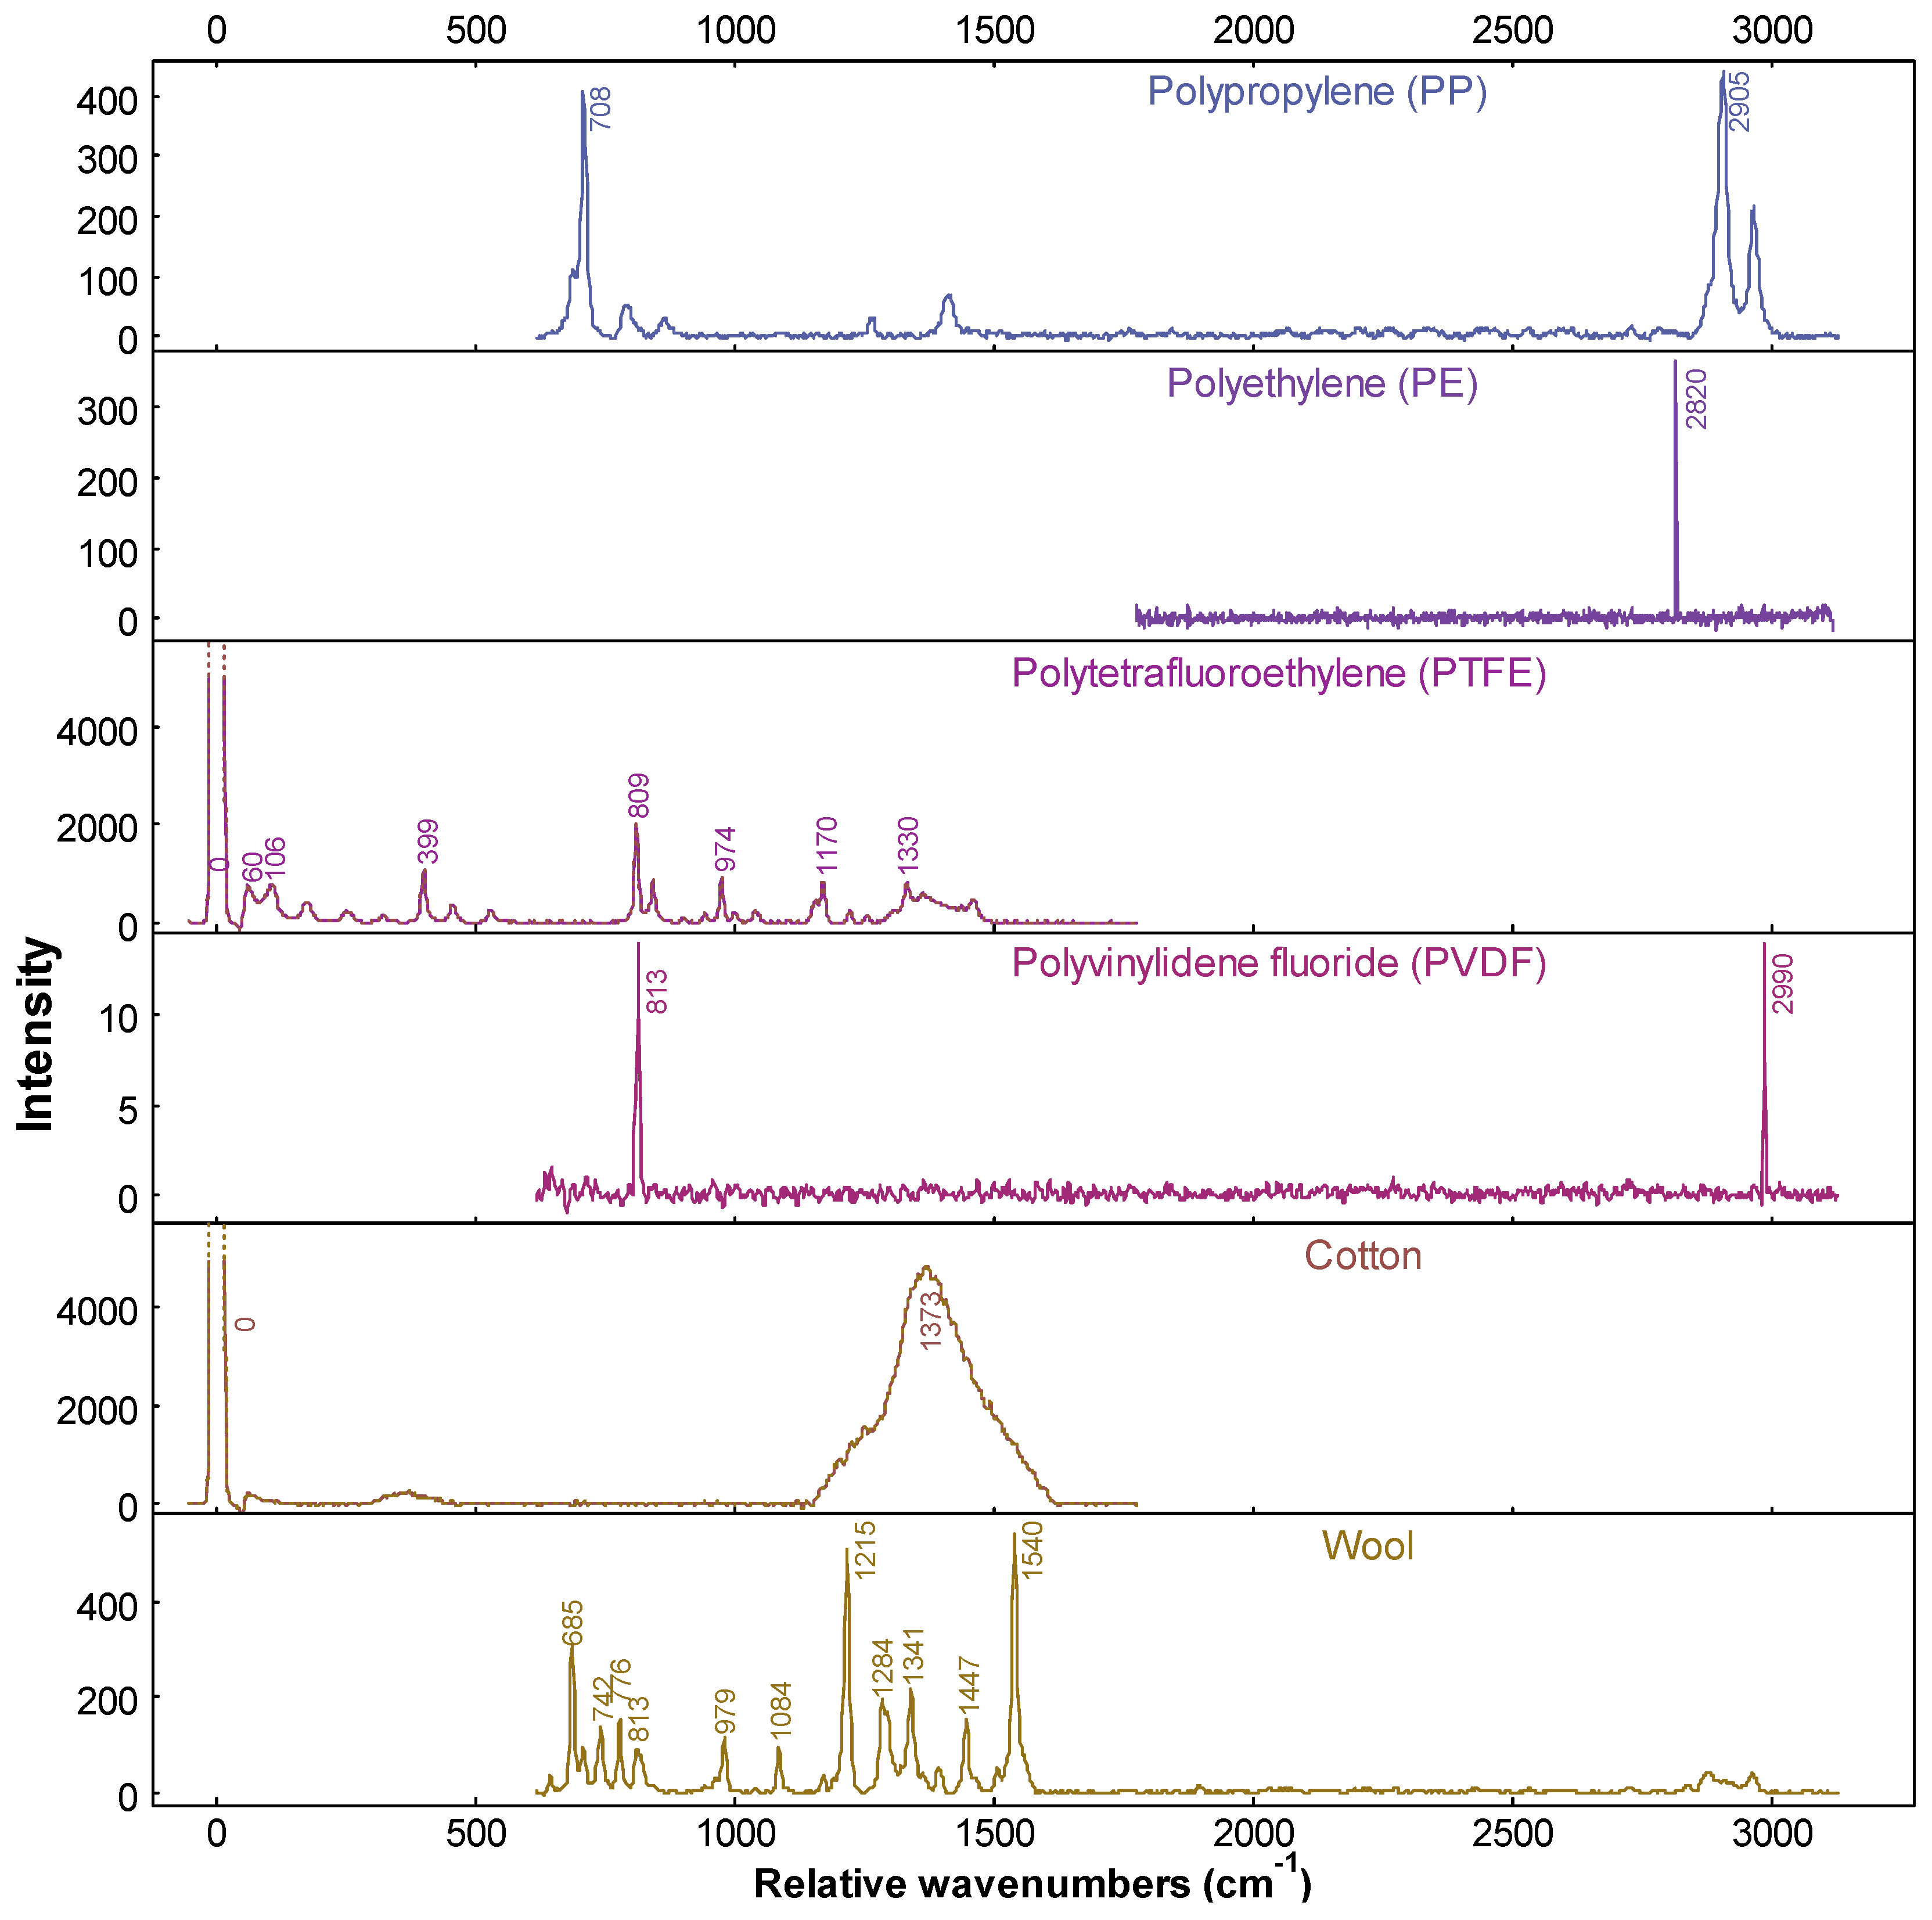
3.2. Background Contamination and Raman Spectroscopy

Background concentrations (blanks) showed 0, 1, 1, 1 and 2 black suspected microplastic fibres. A value drawn randomly from the vector [0,1,1,1,2] was then subtracted, only from fibre counts, before scaling to concentrations based on sample volumes. Raman spectroscopy indicated that 18 of the 38 suspected microplastics initially counted after visual analysis were correctly identified. The false positive rate of the analysis was therefore 52.6%. This proportion of false positive microplastic identifications is consistent with the findings of other studies, in which between 20 and 70% of polymers have been misidentified [20]. Correctly identified polymers were matched as Polypropylene (PP) (64.7%), Polyethylene (PE) (23.5%), Polytetrafluoroethylene (PTFE) (5.9%), and Polyvinylidene fluoride (PVDF) (5.9%). Natural polymers misidentified as microplastics under visual inspection included cotton and wool fibres and various organic materials derived from plant and animal matter. Raman spectra of the plastics identified, as well as wool and cotton fibres, are presented in Figure 3.

3.3. Statistical Analyses of Factors Affecting Microplastic Concentrations

(a)
Microplastic concentrations across and within drainage catchments.
The mean concentration of microplastics across the drainage catchments ranged from 9.22 (Kitchener Road) to 20.1 MP/L (Osborne Park). The catchments with the two highest microplastic concentrations (Osborne Park and South Coolup) also had the greatest intra-catchment variation (relative standard deviations of 58% at Osborne Park and 59% at South Coolup). Table 3 summarises the microplastic concentrations by catchment, and Table 4 summarises the microplastic concentrations by sampling site.
Within-catchment variation in mean microplastic concentrations was minimal, with no significant difference between the mean microplastic concentrations of site pairs in each catchment (Welch’s t-test: 0.09 < p < 0.995). Boxplots of the microplastic concentrations at each drainage catchment and each sampling site are shown in Figure 4.
Neither site nor catchment explain the variation in microplastic concentrations, based on Type-II ANOVA analysis; 3% of the variance was explained by catchment, 23% by site (unrelated to the drainage catchment), and the residual variance was 73%. The Tukey pairwise contrasts, treating catchment as a factor, suggested that none of the catchment pairings had significantly different means from one another (0.14 < p <1).
(b)
Analysis of Covariates
Summaries of the LME models for each covariate are listed in Table 5. Catchment area, catchment population, industrial, natural, and public open space land use proportions had significant positive effects on microplastic concentrations. Conversely, the proportion of residential and services land uses had significant negative effects on microplastic concentrations. Preceding rainfall, and the proportion of agricultural land had no significant effect on microplastic concentrations.
Some features of the data require further exploration. Notably, SC1 had high microplastic concentrations, despite a small catchment population (91 people) and a moderate catchment size (899 ha). Additionally, the negative effect of the proportion of services and residential land uses on microplastic concentrations appears to be influenced by the results at the South Coolup site. Here, the residential and services proportions were low (1.9% and 0%, respectively), yet mean concentrations were high. The trend of increasing microplastic concentration with the increasing proportion of industrial land also had an exception at site SC1, which had the second highest microplastic concentrations but only 0.5% industrial land use. Some covariates were significantly collinear (e.g., catchment area and population, Pearson’s r = 0.94; residential-agricultural r = −0.95; etc.), so the individual effects may represent a combination of land use or demographic variables.

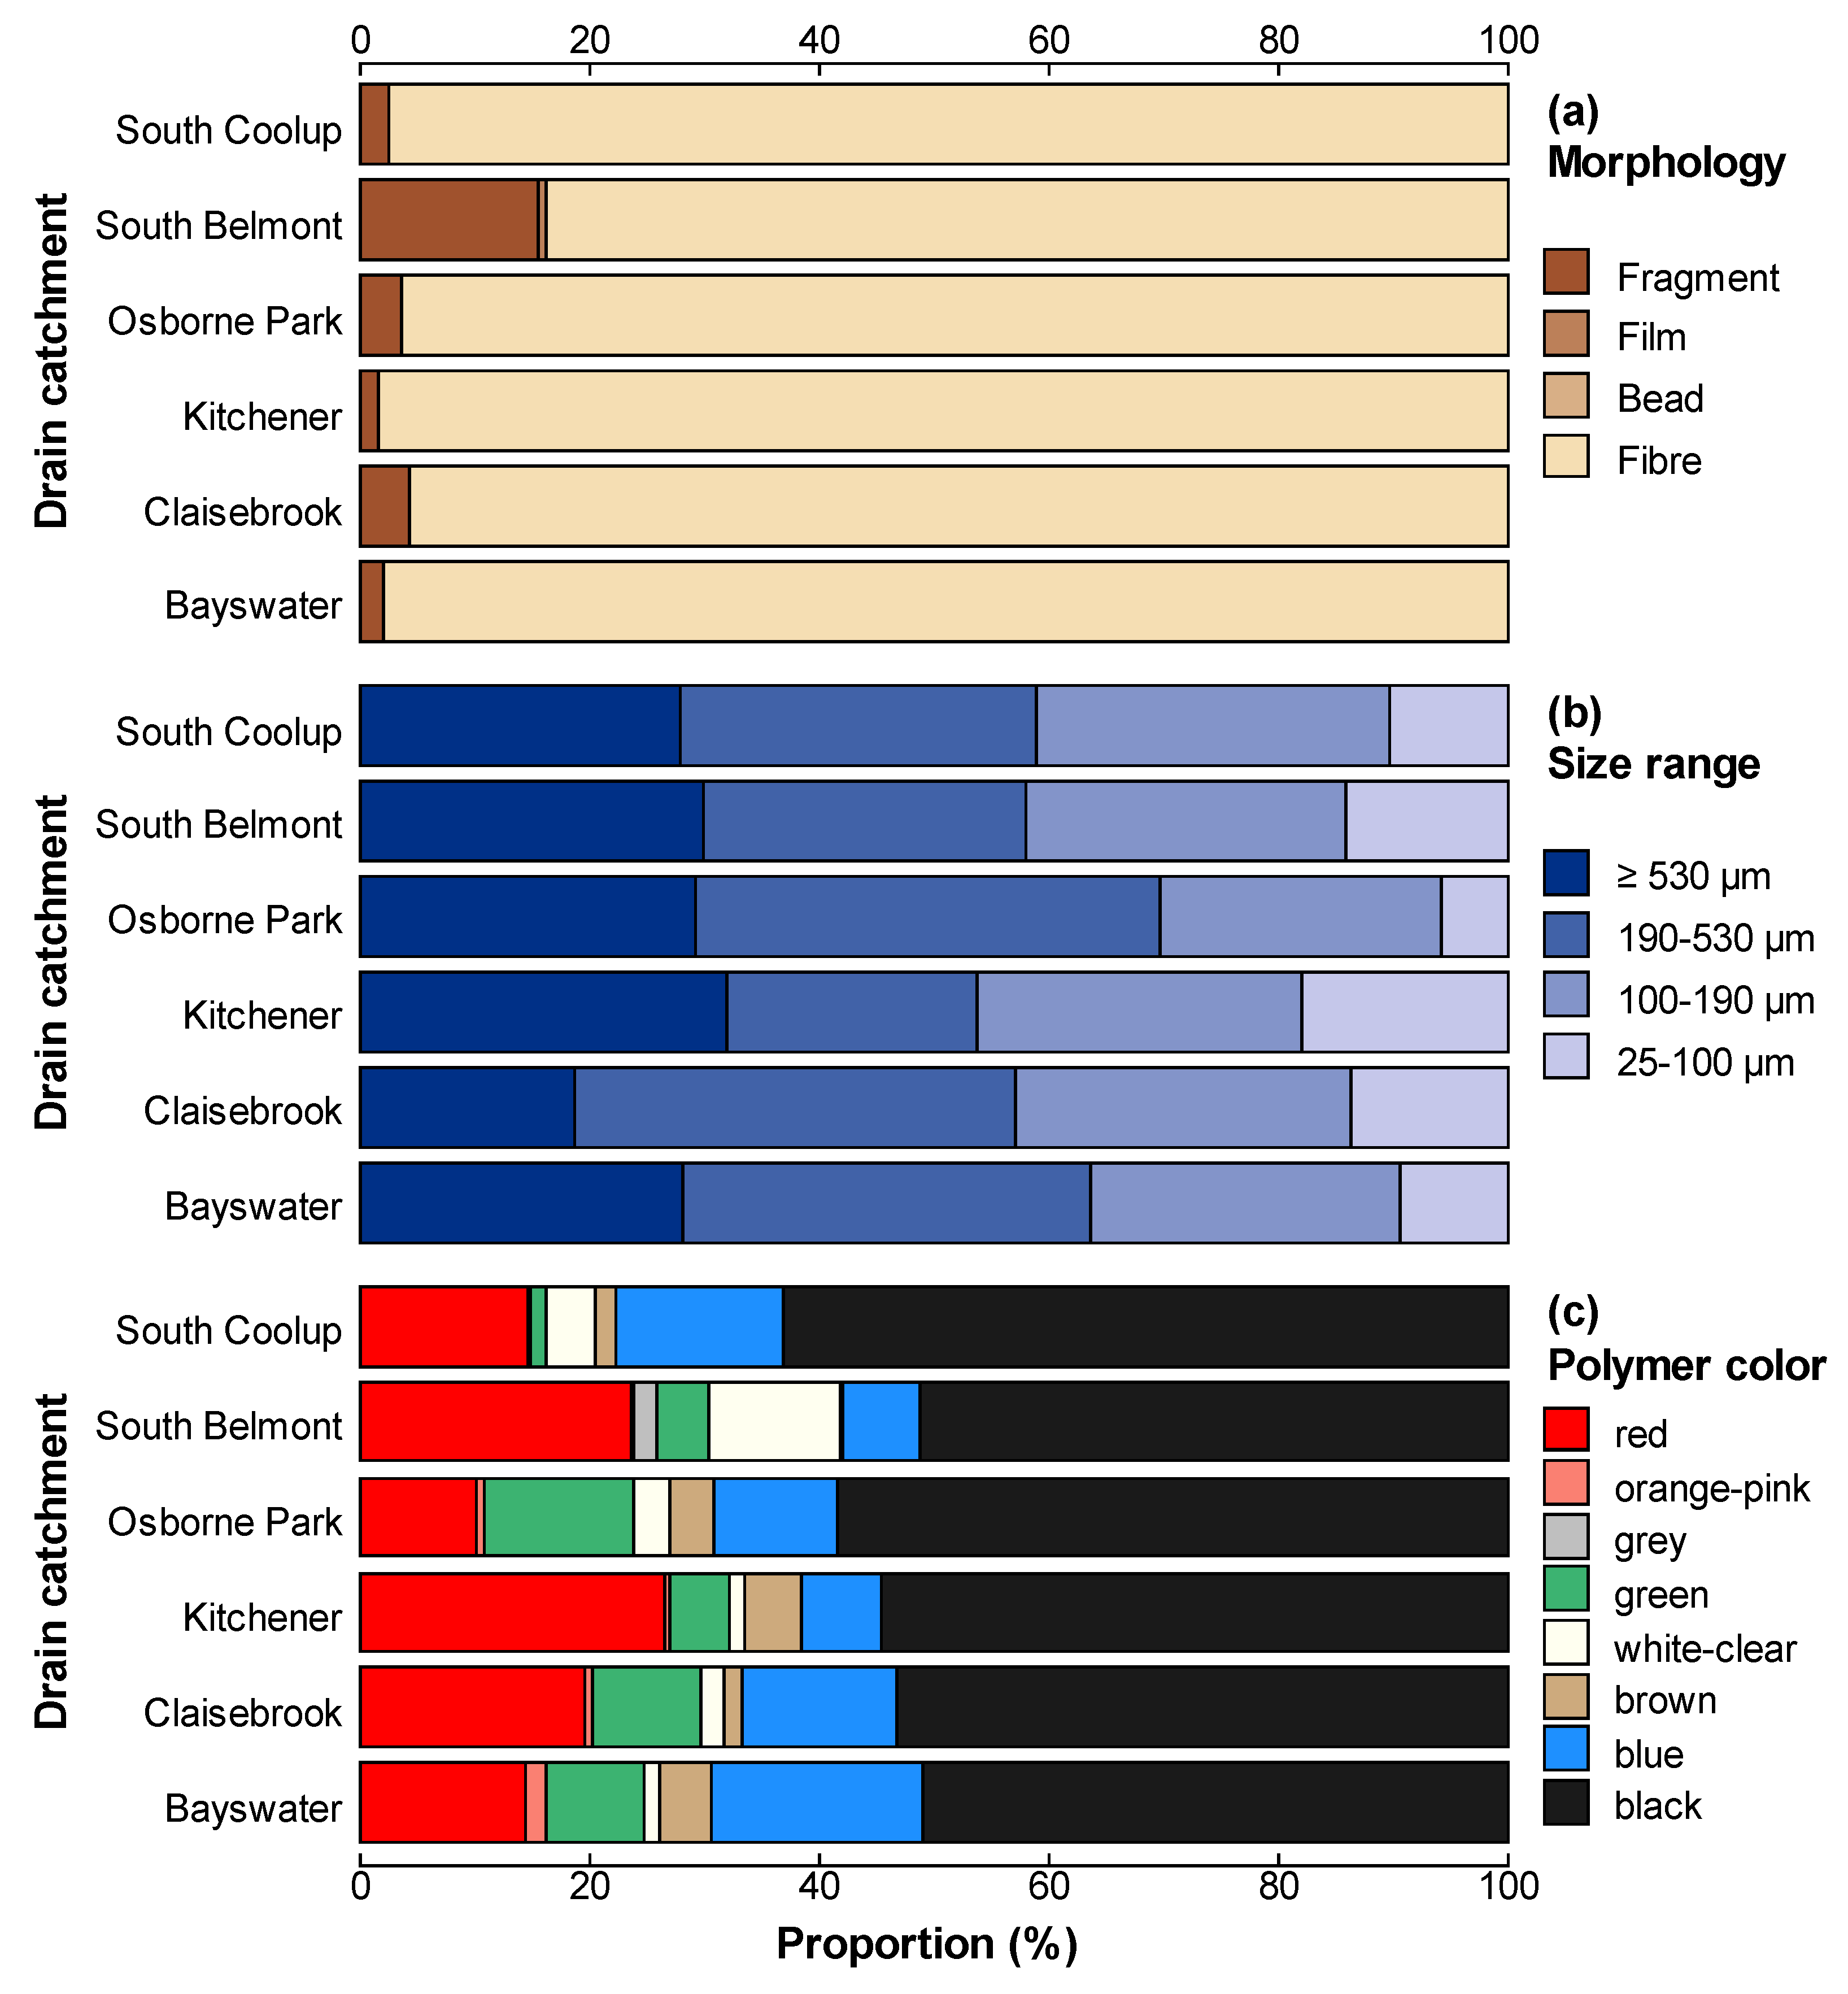
3.4. Microplastic Characteristics

Morphology. The microplastics observed included fibres, fragments, films and beads. Fibres were the most common, accounting for between 86% and 99% of synthetic polymers identified (Figure 5a). Fragments comprised between 1% and 13% of microplastics in the catchments. Films were only identified at the South Belmont Drain catchment, where they contributed 1% of the microplastic count. Claisebrook was the only drainage catchment where microplastic beads were observed but, at 0.01% of the count, microbeads were uncommon.
Size. Microplastics in the 190–530 µm size category were the most abundant (33%), followed by 100–190 µm (28%), ≥530 µm (27%) and 25–100 µm (12%). Kitchener and South Belmont were the only drainage catchments having the ≥ 530 µm size category as the most populous size fraction, comprising 32% (K) and 30% (SB) of plastics identified. Kitchener and South Belmont catchments also featured the greatest proportion of 25–100 µm polymers, at 18% (K) and 14% (SB).
Colour. The majority of microplastics identified were black (55%), followed by red (18%), blue (12%) and green (7%) (Figure 5c). Pink, orange, brown, clear, white and grey microplastics each represented less than 5% of the total microplastic count. The proportions of microplastics of different morphologies are shown in Figure 5a, different sizes in Figure 5b, and different colours in Figure 5c. Additionally, a subsample of the microplastics identified are presented in Figure 6.

4. Discussion

4.1. Catchment and Site Variation in Microplastic Concentrations

The lack of variation in microplastic concentrations across drainage catchments or sites, or within drainage catchment site pairs, reflects the ubiquitous occurrence of microplastics in the Perth region. Similarly, Mora-Teddy and Matthaei [36] found no significant difference between mean microplastic concentrations in drainage catchments in New Zealand. In contrast, Lutz et al. [20] observed substantial variation in microplastic concentrations in stormwater drain sediment in Perth, both within and between catchments. This difference may reflect the more dynamic nature of water, compared with sediments which provide a more stable, longer-term sink for microplastics [20].

4.2. Factors Affecting Microplastic Concentrations

Both catchment area and population were predictive, with positive effects, of stormwater microplastic concentrations in this study. This result is in contrast with microplastic concentrations in stormwater sediments in Perth and Melbourne, which were not related to catchment size or population [20,37].
The ability of the proportion of industrial land use to predict microplastic concentrations has been widely reported, consistent with the significant positive effect shown in this study (Table 5). Piñon-Colin et al. [21], Liu et al. [38] and Townsend et al. [37] found that catchments with higher industrial land use proportions had greater microplastic concentrations than catchments dominated by residential land.
The significant positive effect of the proportions of public open space and natural land on microplastic concentrations is somewhat unexpected. In contrast, Townsend et al. [37] found a negative correlation between public open space and microplastics, instead noting that higher concentrations were detected with increasing proportions of urbanisation. Similarly, Lutz et al. [20] measured lower microplastic concentrations in stormwater sediment in areas with greater proportions of public open space and natural land. Some studies conducted in relatively untouched environments, however, have detected high microplastic concentrations in regions with little to no urban development. This indicates that while land use intensity and population can be predictors for microplastic concentrations in some areas, these results cannot be generalised across different studies, regions, or stormwater drainage catchments [20,39,40]. Additionally, the detection of high microplastic concentrations in areas with greater natural land and public open space may be influenced by the inclusion of wetlands and lakes in these land use categories. Wetlands act as sinks for microplastics [38], and areas with greater proportions of natural land and public open spaces included wetland and lake environments and surrounding parks. Therefore, the influence of these wetland sinks may contribute to the significant positive effects of the proportion of natural land and public open space on microplastic concentrations.
Our finding that the agricultural land use fraction is not correlated with microplastic concentrations is unsurprising, given that only one catchment (South Coolup) had any agricultural land. It would usually be expected, however, that agricultural areas that do not use biosolids applications would have lower microplastic concentrations [20].
Rainfall in the preceding 7 days was not predictive of microplastic concentrations in this study. Conversely, Piñon-Colin et al. [21] found the greatest MP concentrations during rainfall events, but their approach differed in that sites were sampled at the beginning of the rainfall event and 10 and 30 min into the event for seven separate weather events. Similarly, Yonkos et al. [40] found that microplastic concentrations were higher after rainfall or other extreme weather conditions such as hurricanes. Different trends may be observed for different microplastic particle morphologies, with fragments increasing during rainfall events but not fibres [22]. This may explain the lack of a rainfall effect in our study, given the predominance of fibres over other microplastic types.

4.3. Microplastic Concentrations

The microplastic concentrations measured in the stormwater drains had means varying from 20.1 MP/L at Osborne Park Branch Drain to 9.2 MP/L at Kitchener St Drain. These concentrations match the ranges observed in recent literature, which vary between 15.4 and 30.9 MP/L [22,41,42]. Our microplastic concentrations are lower than those reported by Piñon-Colin et al. [21] for stormwater runoff in semi-arid Tijuana, Mexico with median microplastic concentrations between 66 and 191 MP/L. There may be significant variations in reported concentrations stemming from differing sampling and analytical techniques, and variations in the types of water body sampled. For instance, Liu et al. [38] assessed urban and highway retention ponds receiving stormwater runoff flows from various land uses in Denmark and found microplastic concentrations between 490 and 22,894 MP/L. However, this study included plastics between 10 and 2000 µm, an upper classification twice the size of the approximate 1000 µm upper limit in this study. Similarly, Mora-Teddy and Matthaei [36] assessed stormwater systems in New Zealand and discovered microplastic concentrations in the range of <1000–44,000 MP/L, with an upper size limit of 5,000 µm and without spectroscopic verification of polymer composition or false-positive correction.
As observed in other studies of microplastics in stormwater systems [16,20,43], the dominant microplastic shapes found were fibres. The high proportion of fibres relative to other morphologies relates to the ease of transport by water, since their sedimentation rates are slower than for other particle shapes [20].

4.4. Polymer Types

The dominance of polypropylene and polyethylene in this study is consistent with other studies of microplastic in freshwater. Piñon-Colin et al. [21] found that PE and polystyrene (PS) accounted for the greatest proportion of plastics in stormwater, while Liu et al. [38] detected PVE, PS, PP and PE, with PP being the most common polymer. Interestingly, Lutz et al. [20] detected polyethylene terephthalate (PET), nylon polyamide (PA), polyacrylonitrile (PAN) and a synthetic and natural polymer blend, as well as PP and PE in stormwater sediment across Perth. The dominance of PP and PE in our samples can be explained by their densities relative to other plastic polymers. Since PP and PE have lower densities than fresh water, they would float downstream through the drains, rather than settling into the sediments (Lutz et al. 2021). Conversely, more dense polymers such as PA, PVC, polyurethane (PU) and PET, which were not identified in this study, are more likely to become embedded in sediments [44]. Several studies have found that higher-density polymers such as PET, PVC, PA, polyester, and PU were more prevalent in sediment than in water samples [38,42,45]. The dominance of PE and PP in this study indicates some potential sources of microplastics, including single-use plastic bags (PE), and food containers, fabrics, textiles, packaging materials and reusable products (PP) [44,46].

5. Conclusions

Our understanding of the fate and transportation of microplastics in terrestrial environments is still limited, and this first study to report stormwater microplastic concentrations in Western Australia provides useful information on the role of stormwater. The study focused on the four research questions stated in the Introduction. First, stormwater drains in Perth, Western Australia, contain concentrations of microplastics similar to other stormwater drainage catchments worldwide. Second, the predominance of fibres and low-density polymers suggests an active role of stormwater drains in microplastic transport. In the case of Perth, stormwater discharge is to the Swan–Canning Estuary, with a direct connection to the Indian Ocean. Third, the consistency of concentrations between different drains, and between sampling sites on the same drain, is consistent with widely occurring microplastic contamination in this region. Finally, the significant effects of catchment population and area and urban land use proportions (residential, industrial, commercial, and public open space) on microplastic concentrations in stormwater are consistent with expectations. The unexpected positive effect of the proportion of natural land on stormwater microplastic concentrations suggests that further research is required to test hypotheses about the role of wetlands or other mechanisms for microplastic transport and retention. Stormwater drains in this urban area, and others worldwide, have a direct connection with estuarine and marine environments. This suggests that connections between stormwater and natural waters need to be interrupted using engineered solutions to limit the transport of microplastic to sensitive ecosystems. This is already widely implemented for macroscopic solids in stormwater, but the small size of plastic particles is an additional threat to urban sustainability.
Future investigations should also sample additional locations, before and after rainfall events and over an extended timeframe, with the timing of sampling designed to understand the effect of weather and seasonality on microplastic concentrations. The possible relationship between sediment microplastic concentrations and stormwater concentrations is also worthy of investigation. The predominance of microplastic fibres in our study also implies that aeolian transport may be important, a further potentially fruitful avenue for research.

Author Contributions

Conceptualisation, C.B. and A.W.R.; methodology, C.B., H.L. and A.W.R.; formal analysis, C.B. and A.W.R.; investigation, C.B. and H.L.; data curation, C.B.; writing—original draft preparation, C.B.; writing—review and editing, A.W.R.; visualisation, C.B. and A.W.R.; supervision, H.L. and A.W.R.; project administration, A.W.R. All authors have read and agreed to the published version of the manuscript.

Funding

This research received no external funding.

Data Availability Statement

The data, with metadata, are available via Mendeley Data: see Rate, Andrew; Bond, Cassandra; Li, Hua (2022), “Data relating microplastics concentrations in stormwater drains to catchment land use and demographics, Perth, Western Australia”, Mendeley Data, V1, doi:10.17632/vtdwvg34sd.1.

Acknowledgments

We acknowledge that The University of Western Australia and the sampling sites are situated on the ancestral lands of the Whadjuk Noongar people. We acknowledge the First Australians as the traditional owners of the lands where these data were collected, and pay respect to their Elders: past, present, and emerging. The authors acknowledge the facilities, and the scientific and technical assistance of the Australian Microscopy & Microanalysis Research Facility at the Centre for Microscopy, Characterisation & Analysis, The University of Western Australia, a facility funded by the University, State and Commonwealth Governments. The background image for the graphical abstract is by Bev Sykes on Flickr and is used under the terms of a CC-BY licence.

Conflicts of Interest

The authors declare no conflict of interest.

References

  1. Geyer, R.; Jambeck, J.R.; Law, K.L. Production, use, and fate of all plastics ever made. Sci. Adv. 2017, 3, e1700782. [Google Scholar] [CrossRef] [PubMed] [Green Version]
  2. Sutherland, W.J.; Clout, M.; Côté, I.M.; Daszak, P.; Depledge, M.H.; Fellman, L.; Fleishman, E.; Garthwaite, R.; Gibbons, D.W.; De Lurio, J.; et al. A horizon scan of global conservation issues for 2010. Trends Ecol. Evol. 2010, 25, 1–7. [Google Scholar] [CrossRef] [PubMed]
  3. Zhang, K.; Shi, H.; Peng, J.; Wang, Y.; Xiong, X.; Wu, C.; Lam, P.K.S. Microplastic pollution in China’s inland water systems: A review of findings, methods, characteristics, effects, and management. Sci. Total Environ. 2018, 630, 1641–1653. [Google Scholar] [CrossRef] [PubMed]
  4. Arthur, C.; Baker, J.; Bamford, H. (Eds.) Proceedings of the International Research Workshop on the Occurrence, Effects and Fate of Microplastic Marine Debris; National Oceanic and Atmospheric Administration (NOAA): Tacoma, WA, USA, 2008; Volume NOS-OR&R-30, p. 528. [Google Scholar]
  5. Qi, R.; Jones, D.L.; Li, Z.; Liu, Q.; Yan, C. Behavior of microplastics and plastic film residues in the soil environment: A critical review. Sci. Total Environ. 2020, 703, 134722. [Google Scholar] [CrossRef]
  6. Wright, S.L.; Thompson, R.C.; Galloway, T.S. The physical impacts of microplastics on marine organisms: A review. Environ. Pollut. 2013, 178, 483–492. [Google Scholar] [CrossRef]
  7. Cole, M.; Lindeque, P.; Halsband, C.; Galloway, T.S. Microplastics as contaminants in the marine environment: A review. Mar. Pollut. Bull. 2011, 62, 2588–2597. [Google Scholar] [CrossRef]
  8. Teuten, E.L.; Rowland, S.J.; Galloway, T.S.; Thompson, R.C. Potential for Plastics to Transport Hydrophobic Contaminants. Environ. Sci. Technol. 2007, 41, 7759–7764. [Google Scholar] [CrossRef]
  9. Khalid, N.; Aqeel, M.; Noman, A.; Khan, S.M.; Akhter, N. Interactions and effects of microplastics with heavy metals in aquatic and terrestrial environments. Environ. Pollut. 2021, 290, 118104. [Google Scholar] [CrossRef]
  10. Dris, R.; Gasperi, J.; Tassin, B. Sources and Fate of Microplastics in Urban Areas: A Focus on Paris Megacity. In Freshwater Microplastics: Emerging Environmental Contaminants? Wagner, M., Lambert, S., Eds.; Springer International Publishing: Cham, Switzerland, 2018; pp. 69–83. [Google Scholar]
  11. de Souza Machado, A.A.; Kloas, W.; Zarfl, C.; Hempel, S.; Rillig, M.C. Microplastics as an emerging threat to terrestrial ecosystems. Glob. Change Biol. 2018, 24, 1405–1416. [Google Scholar] [CrossRef] [Green Version]
  12. Horton, A.A.; Walton, A.; Spurgeon, D.J.; Lahive, E.; Svendsen, C. Microplastics in freshwater and terrestrial environments: Evaluating the current understanding to identify the knowledge gaps and future research priorities. Sci. Total Environ. 2017, 586, 127–141. [Google Scholar] [CrossRef]
  13. Sutton, R.; Mason, S.A.; Stanek, S.K.; Willis-Norton, E.; Wren, I.F.; Box, C. Microplastic contamination in the San Francisco Bay, California, USA. Mar. Pollut. Bull. 2016, 109, 230–235. [Google Scholar] [CrossRef]
  14. Lasee, S.; Mauricio, J.; Thompson, W.; Karnjanapiboonwong, A.; Kasumba, J.; Subbiah, S.; Morse, A.; Anderson, T. Microplastics in a freshwater environment receiving treated wastewater effluent: Microplastics in Urban Surface Water. Integr. Environ. Assess. Manag. 2017, 13, 528–532. [Google Scholar] [CrossRef]
  15. Boucher, J.; Friot, D. Primary Microplastics in the Oceans: A Global Evaluation of Sources; International Union for Conservation of Nature and Natural Resources (IUCN): Gland, Switzerland, 2017; p. 43. [Google Scholar]
  16. Smyth, K.; Drake, J.; Li, Y.; Rochman, C.; Van Seters, T.; Passeport, E. Bioretention cells remove microplastics from urban stormwater. Water Res. 2021, 191, 116785. [Google Scholar] [CrossRef]
  17. Horton, A.A.; Dixon, S.J. Microplastics: An introduction to environmental transport processes. WIREs Water 2018, 5, e1268. [Google Scholar] [CrossRef] [Green Version]
  18. Monira, S.; Bhuiyan, M.A.; Haque, N.; Shah, K.; Roychand, R.; Hai, F.I.; Pramanik, B.K. Understanding the fate and control of road dust-associated microplastics in stormwater. Process Saf. Environ. Protect. 2021, 152, 47–57. [Google Scholar] [CrossRef]
  19. Kowalski, N.; Reichardt, A.M.; Waniek, J.J. Sinking rates of microplastics and potential implications of their alteration by physical, biological, and chemical factors. Mar. Pollut. Bull. 2016, 109, 310–319. [Google Scholar] [CrossRef]
  20. Lutz, N.; Fogarty, J.; Rate, A. Accumulation and potential for transport of microplastics in stormwater drains into marine environments, Perth region, Western Australia. Mar. Pollut. Bull. 2021, 168, 112362. [Google Scholar] [CrossRef]
  21. Piñon-Colin, T.d.J.; Rodriguez-Jimenez, R.; Rogel-Hernandez, E.; Alvarez-Andrade, A.; Wakida, F.T. Microplastics in stormwater runoff in a semiarid region, Tijuana, Mexico. Sci. Total Environ. 2020, 704, 135411. [Google Scholar] [CrossRef]
  22. Treilles, R.; Gasperi, J.; Gallard, A.; Saad, M.; Dris, R.; Partibane, C.; Breton, J.; Tassin, B. Microplastics and microfibers in urban runoff from a suburban catchment of Greater Paris. Environ. Pollut. 2021, 287, 117352. [Google Scholar] [CrossRef]
  23. Data WA. Water Corporation: Drainage Open Channel (WCORP-083). Government of Western Australia: Perth, Australia. Available online: https://catalogue.data.wa.gov.au/dataset/drain-open-channel (accessed on 7 October 2022).
  24. Ziajahromi, S.; Neale, P.A.; Rintoul, L.; Leusch, F.D.L. Wastewater treatment plants as a pathway for microplastics: Development of a new approach to sample wastewater-based microplastics. Water Res. 2017, 112, 93–99. [Google Scholar] [CrossRef]
  25. Hidalgo-Ruz, V.; Gutow, L.; Thompson, R.C.; Thiel, M. Microplastics in the Marine Environment: A Review of the Methods Used for Identification and Quantification. Environ. Sci. Technol. 2012, 46, 3060–3075. [Google Scholar] [CrossRef]
  26. IRUG. Spectral Database Index. Available online: http://www.irug.org/search-spectral-database (accessed on 7 October 2022).
  27. Araujo, C.F.; Nolasco, M.M.; Ribeiro, A.M.P.; Ribeiro-Claro, P.J.A. Identification of microplastics using Raman spectroscopy: Latest developments and future prospects. Water Res. 2018, 142, 426–440. [Google Scholar] [CrossRef]
  28. Geoscience Australia. Digital Elevation model (DEM) of Australia derived from LiDAR 5 Metre Grid; Geoscience Australia: Symonston, Australia, 2021. [Google Scholar]
  29. ESRI. ArcGIS Pro: Release 2.6.0; Environmental Systems Research Institute: Redlands, CA, USA, 2020. [Google Scholar]
  30. ABARES. The Australian Land Use and Management Classification Version 8; Department of Agriculture, Fisheries and Forestry: Canberra, Australia, 2016. [Google Scholar]
  31. DPIRD. Catchment Scale Land Use Mapping for Western Australia (DPIRD-067); Department of Primary Industries and Regional Development: Perth, Autralia, 2018. [Google Scholar]
  32. BOM. Climate Data Online. Available online: http://www.bom.gov.au/climate/data/ (accessed on 15 September 2021).
  33. R Core Team. R: A Language and Environment for Statistical Computing, Version 4.2.0; R Foundation for Statistical Computing: Vienna, Austria, 2022. [Google Scholar]
  34. Pinheiro, J.; Bates, D. R Core Team nlme: Linear and Nonlinear Mixed Effects Models; R Package Version 3.1-157; R Foundation for Statistical Computing: Vienna, Austria, 2022. [Google Scholar]
  35. Hothorn, T.; Bretz, F.; Westfall, P. Simultaneous Inference in General Parametric Models. Biom. J. 2008, 50, 346–363. [Google Scholar] [CrossRef] [Green Version]
  36. Mora-Teddy, A.K.; Matthaei, C.D. Microplastic pollution in urban streams across New Zealand: Concentrations, composition and implications. N. Z. J. Mar. FreshWater Res. 2020, 54, 233–250. [Google Scholar] [CrossRef]
  37. Townsend, K.R.; Lu, H.; Sharley, D.J.; Pettigrove, V. Associations between microplastic pollution and land use in urban wetland sediments. Environ. Sci. Pollut. Res. 2019, 26, 22551–22561. [Google Scholar] [CrossRef]
  38. Liu, F.; Olesen, K.B.; Borregaard, A.R.; Vollertsen, J. Microplastics in urban and highway stormwater retention ponds. Sci. Total Environ. 2019, 671, 992–1000. [Google Scholar] [CrossRef]
  39. Free, C.M.; Jensen, O.P.; Mason, S.A.; Eriksen, M.; Williamson, N.J.; Boldgiv, B. High-levels of microplastic pollution in a large, remote, mountain lake. Mar. Pollut. Bull. 2014, 85, 156–163. [Google Scholar] [CrossRef]
  40. Yonkos, L.T.; Friedel, E.A.; Perez-Reyes, A.C.; Ghosal, S.; Arthur, C.D. Microplastics in Four Estuarine Rivers in the Chesapeake Bay, U.S.A. Environ. Sci. Technol. 2014, 48, 14195–14202. [Google Scholar] [CrossRef]
  41. Grbić, J.; Helm, P.; Athey, S.; Rochman, C.M. Microplastics entering northwestern Lake Ontario are diverse and linked to urban sources. Water Res. 2020, 174, 115623. [Google Scholar] [CrossRef]
  42. Sang, W.; Chen, Z.; Mei, L.; Hao, S.; Zhan, C.; Zhang, W.b.; Li, M.; Liu, J. The abundance and characteristics of microplastics in rainwater pipelines in Wuhan, China. Sci. Total Environ. 2021, 755, 142606. [Google Scholar] [CrossRef]
  43. Zhang, K.; Xu, S.; Zhang, Y.; Lo, Y.; Liu, M.; Ma, Y.; Chau, H.S.; Cao, Y.; Xu, X.; Wu, R.; et al. A systematic study of microplastic occurrence in urban water networks of a metropolis. Water Res. 2022, 223, 118992. [Google Scholar] [CrossRef] [PubMed]
  44. Shruti, V.C.; Pérez-Guevara, F.; Elizalde-Martínez, I.; Kutralam-Muniasamy, G. Current trends and analytical methods for evaluation of microplastics in stormwater. Trends Environ. Anal. Chem. 2021, 30, e00123. [Google Scholar] [CrossRef]
  45. Ziajahromi, S.; Drapper, D.; Hornbuckle, A.; Rintoul, L.; Leusch, F.D.L. Microplastic pollution in a stormwater floating treatment wetland: Detection of tyre particles in sediment. Sci. Total Environ. 2020, 713, 136356. [Google Scholar] [CrossRef] [PubMed]
  46. Erni-Cassola, G.; Zadjelovic, V.; Gibson, M.I.; Christie-Oleza, J.A. Distribution of plastic polymer types in the marine environment; A meta-analysis. J. Hazard. Mater. 2019, 369, 691–698. [Google Scholar] [CrossRef]
Figure 1. The drainage systems sampled, showing sample locations, catchment boundaries and land use categories.
Land 11 01815 g001
Figure 2. Stacked filter design and schematic of microplastic separation and counting procedures. Sampled water is passed through the filter stack so that microplastics are sorted according to size classification. The filtered water is discarded. Particles on each mesh filter are transferred quantitatively onto glass fibre filters for microscopic identification and counting.
Land 11 01815 g002
Figure 3. Raman spectra (intensity vs. relative wavenumbers, cm−1) used to classify polymer materials identified from the microplastic subsamples which were identified visually. The main peaks for each spectrum are labelled with their positions in relative wavenumbers.
Land 11 01815 g003
Figure 4. Comparison of microplastic concentrations (a) in each catchment and (b) at each site. The bar colours are simply to provide a visual match between catchments and sites in each catchment.
Land 11 01815 g004
Figure 5. Proportions of microplastics in each catchment, classified by (a) shape (morphology), (b) size, and (c) colour.
Land 11 01815 g005
Figure 6. Optical micrographs of selected microplastics analysed by Raman spectroscopy: (a) clear fibre, (b) clear fibre, (c) clear fragment, and (d) black fibre.
Land 11 01815 g006
Table 1. Sampling location details and the volume of water taken at each site. Two sites were selected at each drain system, denoted Site Number 1 and 2. All samples 3 repeats, 250 mL rinse.
Sample CatchmentSite
Number
Site CodeCoordinates (Decimal Degrees, WGS84)Sample Size
LongitudeLatitude
Bayswater Main Drain1B1115.92135−31.9258510 L
Bayswater Main Drain2B2115.92186−31.9273010 L
Claisebrook Main Drain1C1115.85102−31.9321010 L
Claisebrook Main Drain2C2115.87702−31.9525610 L
Osborne Park Branch Drain1O1115.79987−31.912335 L
Osborne Park Branch Drain2O2115.80029−31.913065 L
Kitchener St Drain1K1115.94133−31.9179910 L
Kitchener St Drain2K2115.94171−31.9185510 L
South Belmont Main Drain1SB1115.93236−31.9744310 L
South Belmont Main Drain2SB2115.93233−31.972025L
South Coolup Main Drain1SC1115.85390−32.744315 L
South Coolup Main Drain2SC2115.83038−32.753195 L
Table 2. Summary of drain and catchment characteristics derived from catchment modelling.
B1B2C1C2K1K2O1O2SB1SB2SC1SC2
Catchment Characteristics
Area (ha)108911051459990202122272324223238899631
Population210392137234370245482983194596349291322133879164
Rainfall (mm) ¹31.231.256.811.431.831.844.66.831.85.414.814.8
Land Use Proportion (%)
Public open8.59.216.617.90.000.009.69.38.78.10.000.00
Industrial31.430.91.40.000.000.0013.016.017.416.30.470.50
Residential58.058.076.877.784.284.268.565.964.667.01.92.7
Services2.22.13.93.015.815.86.76.45.14.80.000.00
Natural0.000.101.41.50.000.002.22.44.13.82.72.5
Agricultural0.000.000.000.000.000.000.000.000.000.0094.994.3
¹ In the 7 days prior to sampling.
Table 3. Mean microplastic concentration (MP/L) and standard deviation at a catchment level.
BayswaterClaisebrookKitchenerOsborneS. BelmontS. Coolup
Mean (MP/L)12.612.89.22012.818
Standard deviation3.64.72.1124.210
Table 4. Mean microplastic concentration (MP/L) and standard deviation at a site-specific level.
B1B2C1C2K1K2O1O2SB1SB2SC1SC2
Mean (MP/L)13.911.214.711.09.78.82515.212.912.72510.3
Standard deviation3.63.85.44.02.22.4162.61.56.5102.2
Table 5. Summaries of linear mixed-effects models predicting microplastic concentrations from each of the covariates reflecting the pattern of land use in each catchment. Coefficients and P-values for covariates with significant effects are in bold type.
CovariateModel SpecificationsCovariate
Coefficient
p-Value
Catchment population ÷ 1000Heteroskedastic,
variation at site level
0.10410.005
Catchment areaHeteroskedastic,
variation at site level
0.00250.0037
RainfallHeteroskedastic,
variation at site level
−0.01090.86
Residential proportionHeteroskedastic,
variation at catchment level
−0.11680.0169
Agricultural proportionHeteroskedastic,
variation at site level
−0.01200.60
Industrial proportionHeteroskedastic,
variation at site level
0.13520.0107
Natural proportionHeteroskedastic,
variation at site level
0.70900.0248
Services proportionHeteroskedastic,
variation at site level
−0.27610.0093
Public Open Space proportionHeteroskedastic,
variation at site level
0.31930.0051
Publisher’s Note: MDPI stays neutral with regard to jurisdictional claims in published maps and institutional affiliations.

