Abstract
Promoting the coupling coordinated development between ecological protection and high-quality development is an important path to achieve sustainable regional development around the world. Taking Guizhou, China as a typical case, this study builds a comprehensive evaluation index system for ecological protection and high-quality development, and then uses the coupling coordination degree model to assess the spatiotemporal characteristics of ecological protection and high-quality development. According to the findings, Guizhou’s ecological protection index and high-quality development index both exhibit an upward trend and a center-edge spatial pattern, but they also exhibit a “spatial misalignment relationship”. The coupling coordination between ecological protection and high-quality development in Guizhou has shown a continuous growth trend from near-disorder to a primary coordination, with a spatial pattern of “central > western > eastern”. This study enriches the knowledge body of sustainable development, helps Guizhou make decisions that are best for ecological protection and high-quality development, and is useful as a reference for other regions and countries.
1. Introduction
Sustainable development is a global challenge. In recent decades, China’s economy has experienced impressive expansion. However, the traditional way of economic development at the expense of ecology has caused serious negative effects [1]. China is experiencing serious ecological pollution and degradation phenomena, causing great pressure on ecology [2]. In response to this, the Chinese government proposed the concept of ecological civilization and the goal of high-quality development [3]. At present, sustainable development has become the consensus of the Chinese government and society [4]. Therefore, the correct handling of the relationship between ecology and economic development and the realization of coupling coordinated development between ecological protection and high-quality development are hot spots in Chinese society.
The relation between ecological protection and high-quality development has received a lot of attention in recent years [5,6,7,8,9,10,11,12]. Based on panel data of 42 countries and the Kuznets curve, American economists Grossman and Krueger (1991) proposed the environmental Kuznets curve. When a country’s economic development level is low, the degree of environmental pollution is correspondingly light. As the economy grows, the degree of environmental degradation increases. When economic development reaches a certain level, the degree of environmental pollution will gradually slow down with economic growth, and the environmental quality will gradually improve [13]. Azar et al. (1996) created multi-level ecological resource indicators, including ecological and resource indicators, and a composite index of ecological and economic development was obtained by a weighted average [14]. Dasgupta (2002) believed that the role of price and market participants can increase the price of natural resources, reduce economic activities, reduce pollution emissions, and improve environmental quality to achieve the complementary role of ecology and economic growth [15]. On the basis of the Solow economic model, Brock et al. (2005) further constructed the green Solow model and concluded that environmental pollution has a negative impact on economic growth, and the development of pollution-reduction technologies has a positive impact on environmental improvement and economic growth [16]. Markandya (2006) discussed the impact of the air pollution rule and regulation on the relationship between economic income and ecology and concluded that there is an “inverted U” curve. Furthermore, turning points do exist in most countries, which confirms that the environmental rule and environmental regulation can change the location of turning points [17]. Murphy (2010) effectively solved environmental problems and promoted economic development by encouraging innovative green technologies, developing clean technologies, and changing production structures [18]. Booyens (2017) constructed an empirical model from the perspective of ecology system value to analyze the mechanism of action between ecology and economic development. Scientifically moderate economic development contributes to the sustainability of ecology. If economic development exceeds the environment’s carrying capacity, the economy will also experience recession. On this basis, some scholars have measured the coordination relationship between ecological protection and economy through the concept of coupling coordination [19]. Wang and Li (2019) used geographic detectors to study the influencing factors of the synergistic relationship between urbanization and ecology in the Beijing-Tianjin-Hebei region. Among them, industrialization plays a key role in the development of Beijing-Tianjin-Hebei’s urban agglomeration, and green urbanization is an effective path to achieve sustainable development of Beijing-Tianjin-Hebei’s urban agglomeration [20]. Huang (2019) applied a center of gravity model to calculate the degree of negative impact of human activities on the environment and applied a spatial model to identify the potential of human influence on regional soil pollution changes [21]. Wan (2020) constructed an evaluation index system for urban agglomeration urbanization and ecology. Moreover, the variation method coefficient was used to determine the urbanization and ecology indexes, and the coupling coordination model was used to measure the coupling coordination degree of urbanization and ecology [22]. Li (2021) constructed a model of the coupling coordination relationship between social economy and resource environment with the central city of the Yellow River Basin as the research scale. Based on the disorder model, the coupling coordination disorder factor was diagnosed [23]. With the loess plateau area as a case study, Xiao (2022) constructed an index system for evaluating the coupling coordination degree of the loess plateau society, economy, and ecology and used the dynamic deviation maximization method and coupling coordination degree method to evaluate the society, economy, and ecology of the loess plateau [24].
On the one hand, most studies on the coupling coordination relationship between ecological protection and high-quality development have been global studies. Considering the heterogeneity and particularity of space, it is necessary to carry out more refined, targeted, and precise regional research. On the other hand, the research on the interaction mechanism between ecological protection and high-quality development is weak, and there have been few theoretical discussions and empirical analyses. Therefore, this study chooses Guizhou, China as a typical case to precisely portray the spatiotemporal characteristics of the coupling coordinated development between regional ecological protection and high-quality development through the coupling coordination degree model and the construction of an assessment index system.
Guizhou is a typical province in western China, with a long history of economic backwardness and an abundance of natural resources. In the past development process, Guizhou’s ecological protection and high-quality development were disconnected. Some regions continue to prioritize economic development over ecology, leading to the occurrence of ecological contamination and ecological degradation. How to realize the coupling coordination development between ecological protection and high-quality development has become an urgent challenge for Guizhou [25]. With Guizhou as a typical case, the research on the coupling coordinated development of ecological protection and high-quality development will not only promote the sustainable development of Guizhou, but also serve as a valuable benchmark and demonstration effect for other regions.
In the following sections, we first briefly introduce the study area, research methods, and data sources. Next, we analyze spatiotemporal characteristics and the coupling coordination development degree between the regional ecological protection and high-quality development in Guizhou. Finally, we conclude with a policy implication of this study in a broader context.
2. Materials and Methods
The workflow of this study is shown in Figure 1. First, we make a brief introduction of Guizhou. Then, we construct the evaluation index systems for ecological protection and high-quality development, and use the entropy method to assign weights. Finally, the development degree and spatiotemporal characteristics are evaluated by the coupling coordination degree model.
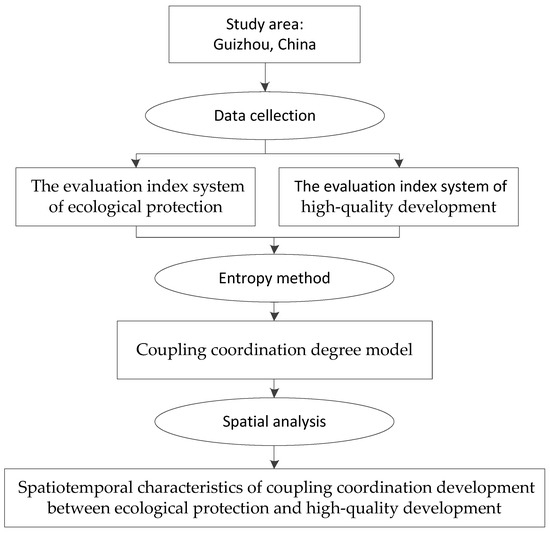
Figure 1.
Workflow of the research.
2.1. The Study Area
Guizhou is located at latitude 24°37′–29°13′ north and longitude 103°36′–109°35′ east, with a total area of 176,200 km2. As of 2021, Guizhou has a total of 9 prefecture-level cities and a population of 38.56 million. Guizhou’s GDP is 1676.9 billion yuan and ranks 24th among China’s 34 provinces, and its per-capita GDP ranks 31st. In general, Guizhou is an underdeveloped area. Guizhou’s terrain can be divided into a plateau, mountainous region, hill, and basin, of which 92.5% of the area is mountainous and hilly (Figure 2). There are relatively few land resources for agricultural development, and the area of cultivated land per capita is much lower than the national average. In contrast, Guizhou has abundant and high reserves of hydropower resources. With over 60% forest coverage, Guizhou has outstanding advantages in biodiversity.
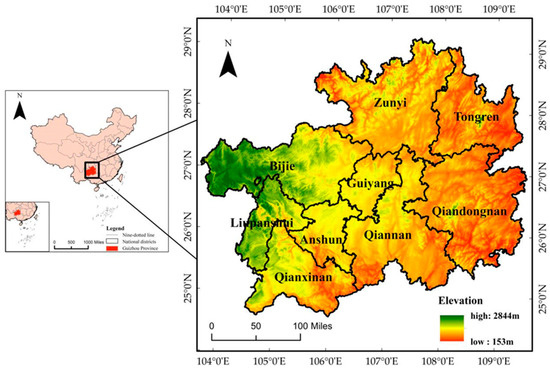
Figure 2.
Location and altitude of Guizhou in 2020.
2.2. Methods
2.2.1. Developing the Evaluation Index System
This study intends to provide light on the spatiotemporal pattern of coupling between ecological protection and high-quality development in Guizhou. As a result, it is essential to build an assessment index system to assess the qualities of high-quality development and ecological protection. The indicators are chosen based on the findings of a previous study and Guizhou’s actual condition [6,10,26,27]. The index system between ecological protection and high-quality development in Guizhou, which has 8 criteria and 28 indicators, is built on the connotation of ecological protection and high-quality development, as well as the concepts of scientificity, comprehensiveness, and hierarchy (Table 1). The weight values for the chosen indicators are computed by the entropy method.

Table 1.
Index system of ecological protection and high-quality development.
The “pressure-state-response” (PSR) model is primarily used in the development of the ecological protection index system. The PSR model has been widely used in the assessment of environmental systems, beginning with research from the Organization for Economic Co-operation and Development (OECD) in the 1990s [28,29,30,31,32,33]. In this study, the state criteria refer to the ecological state in the process of sustainable development. The ecological resource indicator selects forest, water, and cultivated land resources. The pressure criteria refer to unsustainable human activities and environmental pollution. Considering the pollution emission intensity per unit of output value and waste of natural resources, four indicators are selected. The response criteria speak of the actions made by people to support sustainable development. The indicators of afforestation, green coverage, and harmless disposal of garbage are selected.
The “innovative, coordinated, green, and open” development vision, which involves 5 dimensions and 18 indicators, serves as the foundation for the creation of the high-quality development index system. (1) Innovative development leads to high-quality development. Considering factors such as talents, innovation input, innovation output, R&D, science and technology expenditure, and patents, we finally select three indicators, such as R&D personnel’s full-time equivalent, the proportion of science and technology expenditure to fiscal expenditure, and patent authorization. (2) Coordinated development releases a new impetus for high-quality development, including 4 indicators, namely, the urban–rural income gap, poverty-stricken areas, as well as employment and unemployment. (3) The greening of the industrial process, sustainable development, and investments in energy efficiency and environmental protection are the key areas of attention for the four indicators that make up green development. (4) There are 4 indicators in openness development, mainly emphasizing the degree of openness of the regional economy and society, and considering import and export, foreign investment, and foreign tourists. (5) Shared development selects 3 indicators including income, public service level, and construction of public facilities.
Subjective weighting, objective weighting, and combination weighting are the three basic approaches used to determine weight [34]. Given the complexity and abundance of indicators in the ecological protection and high-quality development, this paper chooses to use the objective weighting method to avoid the interference of human factors and reflect the importance of indicators at all levels in the comprehensive evaluation indicator system. The degree of variance in the evaluation index is taken into account when calculating the index weight using the entropy approach. Information entropy decreases with increasing index degree of variation, increasing index weight value and vice versa. High reliability and validity characterize the weighing process of the entropy method, which is characterized by objectivity, the monotonous nature, constant data information, and scaling independence [35,36,37,38,39]. The ideas of logarithms and entropy are used in the entropy method calculating process. Negative and extreme values are prohibited from directly contributing to the calculation by the relative constraints; thus, some adjustments are required. The entropy method is enhanced in this work using the standardized transformation method, and the system level, criterion level, and indicator level of ecological protection and high-quality development are calculated using the improved entropy method. The following are the key steps.
A total of 9 regions and 28 indicators of Guizhou are selected. The raw data matrix X = is formed. For a certain index , the greater the gap between the index value , the greater the role it plays in the evaluation.
The data are standardized (homogenization of heterogeneous indicators). As different indicators have different dimensions and units, in order to eliminate the incommensurability caused by different dimensions and units, it is necessary to transform the indicator data with the standardization method.
Positive indicator calculation method: = ( − min)/max − min);
Reverse index calculation method: = (max)/max − min). where is the j-th evaluation index of the i-th sample; is the standardized index; min and max are the minimum and maximum values of the j-th evaluation index in all regions, respectively.
The proportion of the j-th index value of the i-th sample: = /. The j-th index information entropy: = . Let k = , the constant k-th is related to the number of m-th cities, and there is 0 ≤ ≤ 1.
Let us calculate the difference coefficient of the j-th index. The difference coefficient indicates the effect of this indicator on the research object. The larger the value, the greater the impact on the research object. Information entropy redundancy: = 1 −
In the formula, the larger the , the more important the indicator.
Weight of indicator: = /
Score for single-index evaluation: =
The overall level score of the i-th city: =
2.2.2. Coupling Coordination Degree Model
The coupling theory is used to describe the degree of interaction between ecological protection and high-quality development [27]. The coupling coordination degree model is used to calculate the degree of coupling coordination between two systems, which can clearly reflect the coordination degree of interaction and mutual influence between the systems, and judge whether the systems develop harmoniously [40,41,42]. The coupling coordination degree model is as follows.
where R is the coupling coordination degree; T is the comprehensive coordination index between systems; α and β are undetermined coefficients (α + β = 1). Because this study considers ecological protection and high-quality development to interact and have the same status, α = β = 0.5. The coupling coordination degree of ecological protection and high-quality development in Guizhou is divided into 3 stages and 10 levels (Table 2).
Table 2.
Levels and stages of coupling coordinated development of ecological protection and high-quality development.
2.3. Data Source
Considering the desirability and scientificity of the data samples, Guizhou’s ecological protection and high-quality development indicators conduct statistics from the perspective of time and space. Primary data include spatial, environmental, and socioeconomic data. Basic map data such as administrative division data are from the Resource and Environmental Science Data Center of the Chinese Academy of Sciences [43], which is analyzed and processed through ArcGIS 10.6. The topographic maps of Guizhou are made with DEM from the geospatial data cloud [44]. Guizhou’s ecological protection and socioeconomic data are mainly from the 2015–2019 China Urban Statistical Yearbook, Guizhou Statistical Yearbook, and statistical yearbooks and bulletins of the national economic and social development of 9 cities in Guizhou. For the integrity and accuracy of the data, some missing data were filled by interpolation.
3. Results and Discussion
3.1. Spatiotemporal Characteristics of Ecological Protection in Guizhou
3.1.1. Development Process
During the period 2015–2019, the average value of the ecological protection index in Guizhou showed a constant growth trend. At an average annual growth rate of 5.6%, it increased from 0.49 in 2015 to 0.6 in 2019. All 9 cities showed a continuous growth trend. Among them, Qianxinan and Qiannan saw the largest growth, reaching 43% and 38%. Guizhou’s ecological protection actively developed as a whole, reflecting Guizhou’s emphasis on ecological protection, including the transformation of development methods, accelerated upgrade of green industries, and strengthening of ecological civilization construction and ecological protection. During 2015–2019, the ratios of the maximum and minimum values of the ecological protection index were 2.63, 2.9, 2.44, 2.4, and 2.4, respectively. The spatial difference first increased and then decreased significantly and maintained a decreasing trend. As Guizhou strengthens the regional integration development, the ecological resource endowment and ecological construction of each city are gradually balanced.
3.1.2. Spatial Characteristics
Guizhou’s ecological protection index overall showed a distribution pattern of “low core and high fringe” (Figure 3). Guiyang, Bijie, and Liupanshui had the highest number of lower rankings over 5 years, which belongs to the ecological protection low-value area. Among them, Guizhou has a poor ecological background, large industrial “three wastes” emissions, and serious environmental pollution. Guiyang’s ecological protection index has been at the bottom for 5 years, which belongs to the de facto “ecological protection collapse” area. Tongren and Qiandongnan had the most top-three rankings in five years, which belongs to the ecological protection high-value area. The ecological protection index of Qiannan and Qianxinan increased significantly, which became an ecological protection high-level area after 2017. Because Qiannan and Qianxinan attach importance to ecological protection and restoration, the ecological spatial pattern is actively adjusted and optimized, which specializes in the problem of illegal construction in nature reserves. Guizhou’s ecological protection spatial pattern is relatively stable. During the five-year period, most cities did not experience a grade change. Qiandongnan is always a high-level area. Zunyi is always a higher-level area. Bijie and Liupanshui are always medium-level areas. Guiyang is always a low-level area. Cities with grade changes, such as Qiannan and Qianxinan, involve only 2 levels and are predominantly positive.
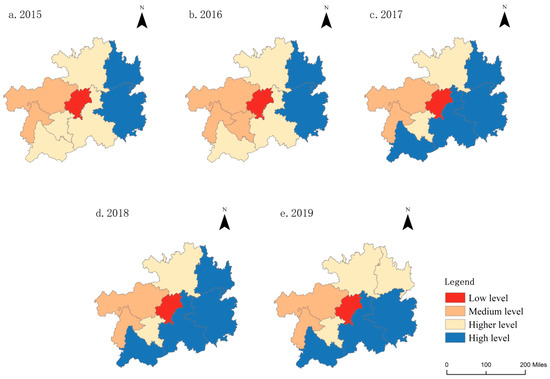
Figure 3.
Spatial distribution of the ecological protection in Guizhou from 2015 to 2019.
All in all, Guizhou’s ecological protection system is developing well. Among them, most of the cities are higher-level and high-level areas and produce a benign resonance response. In addition, the level of ecological protection increases in an orderly manner. Therefore, it can be concluded that local governments pay more attention to ecology. However, it is necessary to further optimize the industrial structure, increase the rectification of high-energy consumption and high-polluting enterprises, and reduce industrial and pesticide pollution to the water body and soil to achieve the purpose of improving ecological quality.
3.2. Spatiotemporal Characteristics of High-Quality Development in Guizhou
3.2.1. Development Process
From 2015 to 2019, Guizhou’s high-quality development index showed an overall growth trend. With an average annual growth rate of 6.8%, it increased from 2.02 in 2015 to 2.57 in 2019. The high-quality development of Guiyang, Bijie, Qiandongnan, Qianxinan, and Qiannan has grown steadily. Among them, Guiyang had the largest increase (25.4%), from 0.59 in 2015 to 0.74 in 2019, which became the high-value area of Guizhou’s high-quality development. As the core city of Guizhou, Guiyang has a relatively high comprehensive carrying capacity and gathers many high-end manufacturing, service, and emerging industries. The high-quality development of Anshun, Liupanshui, and Tongren showed a fluctuating growth trend, with relatively small increments (less than 0.1). Anshun’s high-quality development is on the decline. Anshun is positioned as the tourist center city of Guizhou, with backward industrial development, slow enterprise upgrading, small city volume, a poor population and enterprise agglomeration effect, and unbalanced intra-city development. During the period from 2015 to 2019, the maximum and minimum ratios of the high-quality development index were 4.54, 3.78, 4, 4.2, and 4.35, respectively. The trend of first sharply decreasing and then slightly increasing indicates that Guizhou’s high-quality development generally moved toward an unbalanced direction after 2016. The main reasons are the significant differences in resource endowment, location, history, and culture among cities, as well as inconsistent economic development growth rates.
3.2.2. Spatial Characteristics
In terms of spatial structure, Guizhou’s high-quality development index presents a center-edge shape similar to the ecological protection (Figure 4). However, the two form a distinct “spatial misalignment relationship”. The central region of Guizhou has a high level of high-quality development but a low level of ecological protection. The outer area has a low level of high-quality development but high level of ecological protection. In the past five years, Guiyang’s high-quality development index has been in first place, with the fastest growth rate, which has formed a single-centered development trend with the provincial capital city as the core. Tongren and Qiandongnan’s high-quality development index has ranked in the bottom for five years, with slow development, which belongs to the high-quality development low-value area. The fact that the eastern part of Guizhou is backward reflects the constraints imposed by historical reasons, location conditions, and backward stages on high-quality development. Guizhou has a relatively active high-quality development spatial pattern, which has undergone several grade changes over a five-year period. Bijie reverted to a medium-level area after transitioning to a low-level area in 2016. Tongren transformed into a medium-level area in 2016 and 2017 and then reverted to a low-level area. Liupanshui and Anshun fluctuate between higher-level and medium-level areas. Guizhou, Zunyi, Qianxinan, Qiannan, and Qiandongnan are unchanged.
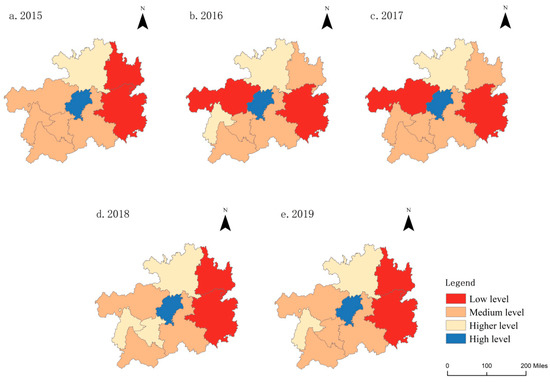
Figure 4.
Spatial distribution of the high-quality development in Guizhou from 2015 to 2019.
In general, Guizhou’s innovation, coordination, green, open, and development subsystems are still in the grinding-in stage, failing to reach a benign resonance stage. Although the increase in most cities during the study period was small, the overall high-quality development system developed in an orderly manner.
3.3. Spatiotemporal Characteristics of Coupling Coordination Development between Ecological Protection and High-Quality Development in Guizhou
3.3.1. Development Process
In terms of sequential variation, the coupling coordination degree between ecological protection and high-quality development in Guizhou showed a continuous growth trend, from 0.42 in 2015 to 0.6 in 2019. In addition, Guizhou has developed from a near-disorder degree to a primary coordination degree. At the regional level, the coupling coordination degrees of Guiyang, Bijie, Tongren, Qiandongnan, Qiannan, and Qianxinan showed a steady growth trend. Guiyang had the largest increase (79%), which reached the level of primary coordination. Anshun and Liupanshui showed a trend of volatile growth and reached the level of reluctant coordination in 2019. During this five-year period, Guizhou’s level of coupling coordination grew steadily as it utilized high-quality ecological resources to develop characteristic green industries, and it continues to increase financial investment and policy subsidies. The coupling coordination degree of Zunyi showed a downward trend of fluctuation, from 0.72 in 2019 to 0.69 in 2015. Although the decline is small, a cautious approach is required. It is necessary to take measures to improve coordination and maintain an internal balance between ecological protection and high-quality development. The type of coupling relation in most cities has changed, and the speed is fast, which indicates that these cities have preliminarily established a coupling development between ecological protection and high-quality development.
3.3.2. Spatial Characteristics
Guizhou has a regional spatial pattern of central > western > eastern in terms of the degree of coupling coordination between ecological protection and high-quality development. The eastern section of Guizhou has the lowest level of coupling coordination because, despite having great ecological resources, it has not used them as a competitive advantage in economic development, causing a delay in the pace of high-quality development and a clear disconnect. The central section of Guizhou has experienced significant economic growth. Ecological protection and high-quality development interact favorably under the influence of a reasonable industrial structure, rapid industrial upgrading, and a solid ecological foundation.
3.4. Further Discussion
For emerging nations, managing the interaction between economic growth and ecological protection has been a significant problem [45]. To solve this issue, the UN has suggested sustainable development. In the Chinese context, the Chinese government has put out a sustainable development concept and model called high-quality development [46]. To promote economic growth, high-quality development places a strong emphasis on ecological protection, innovation, and industrial modernization [47]. The Chinese government has implemented numerous particular policies that are based on the principle and purpose of high-quality development [48]. The case study of Guizhou shows that the policies and models of high-quality development are initially working, with environmental improvements, economic growth, and an increased degree of coupling coordinated development between the environment and the economy. Other emerging nations can learn from China’s experience that ecological protection and economic growth can coexist and integrate.
As high-quality development is a relatively new idea, the majority of studies that have been conducted so far have examined each aspect of high-quality development and ecological protection separately. The small number of studies have also placed more emphasis on the basin scale [29,49,50]. The main focus of measuring high-quality development was economic growth, and the definition of high-quality development was singular [48,51,52]. In order to more accurately describe the meaning of high-quality development, a high-quality development indicator system is constructed with five development concepts and multiple dimensions. Guizhou Province is used as the typical case in this paper. Additionally, it builds an ecological protection evaluation index system using the pressure-situation-response, which accurately captures the state of ecological protection in Guizhou Province at the moment. The evaluation of coupling coordination also attests to the high-quality development policy’s efficacy.
4. Conclusions and Policy Implications
Guizhou, which is wealthy in ecological resources but has a relatively underdeveloped economy, was chosen as the typical case based on the coupling coordination between region ecological protection and high-quality development. In this study, the ecological protection and high-quality development evaluation index system was built using data from Guizhou from 2015 to 2019. The spatial pattern of ecological protection and high-quality development was identified and the spatiotemporal characteristics of coupling coordination development between ecological protection and high-quality development were evaluated.
Guizhou’s ecological protection and high-quality development indexes showed an increasing trend in general. In terms of spatial pattern, the two have a similar center-edge morphology, but form a distinct “spatial misalignment relationship”. The central region has high levels of high-quality development but low levels of ecological protection. Peripheral areas have low levels of high-quality development but high levels of ecological protection.
The coupling coordination between ecological protection and high-quality development in various cities in Guizhou has shown a clear positive trend, that is, the transition from “disorder” to “coordination”. The spatial pattern is central> west> east. Except for Zunyi, all cities basically eliminated the disorder state, which all showed ideal codirectional changes, mainly distributed by reluctant and primary coordination.
Sustainable development is a common task facing the world, and the Chinese government proposed and implemented the idea of ecological civilization as a response. As a typical region with ecological advantages but underdeveloped economy, Guizhou’s experience also has implications for regional sustainable development in China and other developing countries. Constructing ecological governance mechanisms is a key measure to address the challenges of coupling coordinated development between regional ecological protection and high-quality development.
It is necessary to develop a cooperative governance mechanism. Many regions around the world are facing the challenges of ecological vulnerability, unsound green industries, and severe pollution. The response and intervention of government are crucial. Therefore, it is necessary to build a networked, open, and integrated regional cooperation mechanism, strengthen joint governance and joint protection, break administrative barriers, and implement the responsibilities of all local governments while, at the same time, strengthening the cooperation of multiple parties such as the government, the market, and the public.
Building a tailored governance mechanism is necessary. Regional ecological resources have significant spatial heterogeneity and should be treated differently according to local characteristics. The regions with a strong ecological foundation but a shaky economic base and poor coupling coordination levels need an incremental approach. Through the full use of good ecological resources, the transformation and upgrading of the industrial structure can be realized. Modern green businesses should be built in place of the outdated energy-intensive sectors that deplete resources and harm the environment. The regions with a coupling coordination degree should rely on the beneficial fields of the current industry. The level of coupling coordination between ecological protection and high-quality development has been further improved by accelerating the construction of strategic emerging industries that adapt to the region’s development and strengthening investment in green industries.
There are also some limitations in this study. On the one hand, due to the limitation of data acquisition, the analysis was currently only carried out in the prefecture-level city scale. As long as the data permit, other regions should carry out more exact and thorough research based on county scales. On the other hand, future research could integrate quantitative techniques to conduct a more thorough examination of the driving factors and development trends.
Author Contributions
Conceptualization, Z.C. and H.L.; methodology, T.Z.; software, T.Z.; validation, Z.C., Y.Z. and H.L.; formal analysis, T.Z.; investigation, T.Z.; data curation, T.Z.; writing—original draft preparation, T.Z. and Z.C.; writing—review and editing, Y.Z. and H.L.; visualization, T.Z. and Y.Z.; project administration, H.L. All authors have read and agreed to the published version of the manuscript.
Funding
This research was funded by grants of the National Natural Science Foundation of China (No. 42271185), the Major Program of Philosophy and Social Science Planning of Guizhou Province (No. 21GZZB28), and the Major Program of Philosophy and Social Science of Chinese Ministry of Education (No. 21JZD034).
Institutional Review Board Statement
Not applicable.
Informed Consent Statement
Not applicable.
Data Availability Statement
Not applicable.
Conflicts of Interest
The authors declare no conflict of interest.
References
- Meng, F.; Guo, J.; Guo, Z.; Lee, J.C.K.; Liu, G.; Wang, N. Urban Ecological Transition: The Practice of Ecological Civilization Construction in China. Sci. Total Environ. 2021, 755, 142633. [Google Scholar] [CrossRef]
- Zuo, Z.; Guo, H.; Cheng, J.; Li, Y.L. How to Achieve New Progress in Ecological Civilization Construction?–Based on Cloud Model and Coupling Coordination Degree Model. Ecol. Indic. 2021, 127, 107789. [Google Scholar] [CrossRef]
- Yan, L.; Zhang, X.; Pan, H.; Wu, J.; Lin, L.; Zhang, Y.; Xu, C.; Xu, M.; Luo, H. Progress of Chinese Ecological Civilization Construction and Obstacles during 2003–2020: Implications from One Set of Emergy-Based Indicator System. Ecol. Indic. 2021, 130, 108112. [Google Scholar] [CrossRef]
- Jiang, S.; Li, Y.; Lu, Q.; Hong, Y.; Guan, D.; Xiong, Y.; Wang, S. Policy Assessments for the Carbon Emission Flows and Sustainability of Bitcoin Blockchain Operation in China. Nat. Commun. 2021, 12, 1938. [Google Scholar] [CrossRef]
- Fu, H.; Niu, J.; Wu, Z.; Cheng, b.; Guo, X.; Zuo, J. Exploration of public stereotypes of supply-and-demand characteristics of recycled water infrastructure—Evidence from an event-related potential experiment in Xi’an, China. J. Environ. Manag. 2022, 322, 116103. [Google Scholar] [CrossRef]
- Ariken, M.; Zhang, F.; weng Chan, N.; Kung, H. Coupling Coordination Analysis and Spatio-Temporal Heterogeneity between Urbanization and Eco-Environment along the Silk Road Economic Belt in China. Ecol. Indic. 2021, 121, 107014. [Google Scholar] [CrossRef]
- Zhang, Z.; Li, Y. Coupling Coordination and Spatiotemporal Dynamic Evolution between Urbanization and Geological Hazards–A Case Study from China. Sci. Total Environ. 2020, 728, 138825. [Google Scholar] [CrossRef]
- Ariken, M.; Zhang, F.; Liu, K.; Fang, C.; Kung, H. Coupling Coordination Analysis of Urbanization and Eco-Environment in Yanqi Basin Based on Multi-Source Remote Sensing Data. Ecol. Indic. 2020, 114, 106331. [Google Scholar] [CrossRef]
- Liu, Y.; Yang, L.; Jiang, W. Coupling Coordination and Spatiotemporal Dynamic Evolution between Social Economy and Water Environmental Quality–A Case Study from Nansi Lake Catchment, China. Ecol. Indic. 2020, 119, 106870. [Google Scholar] [CrossRef]
- Cai, J.; Li, X.; Liu, L.; Chen, Y.; Wang, X.; Lu, S. Coupling and Coordinated Development of New Urbanization and Agro-Ecological Environment in China. Sci. Total Environ. 2021, 776, 145837. [Google Scholar] [CrossRef]
- Liu, N.; Liu, C.; Xia, Y.; Da, B. Examining the Coordination between Urbanization and Eco-Environment Using Coupling and Spatial Analyses: A Case Study in China. Ecol. Indic. 2018, 93, 1163–1175. [Google Scholar] [CrossRef]
- Yang, C.; Zeng, W.; Yang, X. Coupling Coordination Evaluation and Sustainable Development Pattern of Geo-Ecological Environment and Urbanization in Chongqing Municipality, China. Sustain. Cities Soc. 2020, 61, 102271. [Google Scholar] [CrossRef]
- Grossman, G.; Krueger, A. Environmental Impacts of a North American Free Trade Agreement. In CEPR Discussion Papers; Centre for Economic Policy Research (CEPR): Washington, DC, USA, 1992. [Google Scholar]
- Azar, C.; Holmberg, J.; Lindgren, K. Socio-Ecological Indicators for Sustainability. Ecol. Econ. 1996, 18, 89–112. [Google Scholar] [CrossRef]
- Dasgupta, S.; Laplante, B.; Wang, H.; Wheeler, D. Confronting the Environmental Kuznets Curve. J. Econ. Perspect. 2002, 16, 147–168. [Google Scholar] [CrossRef]
- Taylor, M.S.; Brock, W.A. Economic Growth and the Environment: A Review of Theory and Empirics. Handb. Econ. Growth 2005, 1, 1749–1821. [Google Scholar]
- Markandya, A.; Golub, A.; Pedroso-Galinato, S. Empirical Analysis of National Income and SO2 Emissions in Selected European Countries. Environ. Resour. Econ. 2006, 35, 221–257. [Google Scholar] [CrossRef]
- Murphy, J.; Gouldson, A. Environmental Policy and Industrial Innovation: Integrating Environment and Economy through Ecological Modernisation. Geoforum 2000, 31, 275–294. [Google Scholar] [CrossRef]
- Boons, F.; Wagner, M. Assessing the Relationship between Economic and Ecological Performance: Distinguishing System Levels and the Role of Innovation. Ecol. Econ. 2009, 68, 1908–1914. [Google Scholar] [CrossRef]
- Wang, S.; Ma, H.; Zhao, Y. Exploring the Relationship between Urbanization and the Eco-Environment—A Case Study of Beijing-Tianjin-Hebei Region. Ecol. Indic. 2014, 45, 171–183. [Google Scholar] [CrossRef]
- Huang, D.; Yang, X.; Cai, H.; Xiao, Z.; Han, D. Identifying Human-Induced Spatial Differences of Soil Erosion Change in a Hilly Red Soil Region of Southern China. Sustainability 2019, 11, 3103. [Google Scholar] [CrossRef]
- Wan, J.; Zhang, L.; Yan, J.; Wang, X.; Wang, T. Spatial–Temporal Characteristics and Influencing Factors of Coupled Coordination between Urbanization and Eco-Environment: A Case Study of 13 Urban Agglomerations in China. Sustainability 2020, 12, 8821. [Google Scholar] [CrossRef]
- Li, H.; Jiang, Z.; Dong, G.; Wang, L.; Huang, X.; Gu, X.; Guo, Y. Spatiotemporal Coupling Coordination Analysis of Social Economy and Resource Environment of Central Cities in the Yellow River Basin. Discret. Dyn. Nat. Soc. 2021, 2021, 6637631. [Google Scholar] [CrossRef]
- Xiao, Y.; Tian, K.; Huang, H.; Wang, J.; Zhou, T. Coupling and Coordination of Socioeconomic and Ecological Environment in Wenchuan Earthquake Disaster Areas: Case Study of Severely Affected Counties in Southwestern China. Sustain. Cities Soc. 2021, 71, 102958. [Google Scholar] [CrossRef]
- Cheng, Z.; Zhao, T.; Song, T.; Cui, L.; Zhou, X. Assessing the Spatio-Temporal Pattern and Development Characteristics of Regional Ecological Resources for Sustainable Development: A Case Study on Guizhou Province, China. Land 2022, 11, 899. [Google Scholar] [CrossRef]
- Lv, T.; Wang, L.; Zhang, X.; Xie, H.; Lu, H.; Li, H.; Liu, W.; Zhang, Y. Coupling Coordinated Development and Exploring Its Influencing Factors in Nanchang, China: From the Perspectives of Land Urbanization and Population Urbanization. Land 2019, 8, 178. [Google Scholar] [CrossRef]
- Liu, W.; Zhan, J.; Zhao, F.; Wei, X.; Zhang, F. Exploring the Coupling Relationship between Urbanization and Energy Eco-Efficiency: A Case Study of 281 Prefecture-Level Cities in China. Sustain. Cities Soc. 2021, 64, 102563. [Google Scholar] [CrossRef]
- Hu, X.; Xu, H. A New Remote Sensing Index Based on the Pressure-State-Response Framework to Assess Regional Ecological Change. Environ. Sci. Pollut. Res. 2019, 26, 5381–5393. [Google Scholar] [CrossRef]
- Hazbavi, Z.; Sadeghi, S.H.; Gholamalifard, M.; Davudirad, A.A. Watershed Health Assessment Using the Pressure–State–Response (PSR) Framework. Land Degrad. Dev. 2020, 31, 3–19. [Google Scholar] [CrossRef]
- Chen, M.; Jiang, Y.; Wang, E.; Wang, Y.; Zhang, J. Measuring Urban Infrastructure Resilience via Pressure-State-Response Framework in Four Chinese Municipalities. Appl. Sci. 2022, 12, 2819. [Google Scholar] [CrossRef]
- Neri, A.C.; Dupin, P.; Sánchez, L.E. A Pressure-State-Response Approach to Cumulative Impact Assessment. J. Clean. Prod. 2016, 126, 288–298. [Google Scholar] [CrossRef]
- Li, W.; Liu, C.; Su, W.; Ma, X.; Zhou, H.; Wang, W.; Zhu, G. Spatiotemporal Evaluation of Alpine Pastoral Ecosystem Health by Using the Basic-Pressure-State-Response Framework: A Case Study of the Gannan Region, Northwest China. Ecol. Indic. 2021, 129, 108000. [Google Scholar] [CrossRef]
- Yang, W.; Zhang, Z.; Sun, T.; Liu, H.; Shao, D. Marine Ecological and Environmental Health Assessment Using the Pressure-State-Response Framework at Different Spatial Scales, China. Ecol. Indic. 2021, 121, 106965. [Google Scholar] [CrossRef]
- Jiang, R.; Chen, X.; Zhao, L.; Zhou, Z.; Zhang, T. An Evaluation Model of Water-Saving Reconstruction Projects Based on Resource Value Flows. Front. Eng. Manag. 2022, 9, 257–267. [Google Scholar] [CrossRef]
- Essletzbichler, J. Relatedness, Industrial Branching and Technological Cohesion in US Metropolitan Areas. Reg. Stud. 2015, 49, 752–766. [Google Scholar] [CrossRef]
- Wu, L.; Guo, X.; Chen, Y. Grey Relational Entropy Calculation and Fractional Prediction of Water and Economy in the Beijing-Tianjin-Hebei Region. J. Math. 2021, 2021, 4418260. [Google Scholar] [CrossRef]
- Liu, R.; Li, L.; Guo, L.; Jiao, L.; Wang, Y.; Cao, L.; Wang, Y. Multi-Scenario Simulation of Ecological Risk Assessment Based on Ecosystem Service Values in the Beijing-Tianjin-Hebei Region. Environ. Monit. Assess. 2022, 194, 434. [Google Scholar] [CrossRef]
- Gong, X. Coupling Coordinated Development Model of Urban-Rural Logistics and Empirical Study. Math. Probl. Eng. 2019, 2019, 9026795. [Google Scholar] [CrossRef]
- Nithin, K.; Roy, R. Finance Commission of India’s Assessments: A Political Economy Contention between Expectations and Outcomes. Appl. Econ. 2016, 48, 73–88. [Google Scholar] [CrossRef]
- Ren, F.; Yu, X. Coupling Analysis of Urbanization and Ecological Total Factor Energy Efficiency—A Case Study from Hebei Province in China. Sustain. Cities Soc. 2021, 74, 103183. [Google Scholar] [CrossRef]
- Chen, M.; Liu, W.; Lu, D.; Chen, H.; Ye, C. Progress of China’s New-Type Urbanization Construction since 2014: A Preliminary Assessment. Cities 2018, 78, 180–193. [Google Scholar] [CrossRef]
- Chen, J.; Li, Z.; Dong, Y.; Song, M.; Shahbaz, M.; Xie, Q. Coupling Coordination between Carbon Emissions and the Eco-Environment in China. J. Clean. Prod. 2020, 276, 123848. [Google Scholar] [CrossRef]
- Resource and Environmental Science Data Center of the Chinese Academy of Sciences. Available online: https://www.resdc.cn (accessed on 22 September 2022).
- Geospatial Data Cloud. Available online: http://www.gscloud.cn (accessed on 22 September 2022).
- Fan, J.L.; Li, K.; Zhang, X.; Hu, J.; Hubacek, K.; Da, Y.; Liang, X.; Cheng, D. Measuring Sustainability: Development and Application of the Inclusive Wealth Index in China. Ecol. Econ. 2022, 195, 107357. [Google Scholar] [CrossRef]
- Liu, Z.; Ling, Y. Structural Transformation, TFP and High-Quality Development. China Econ. 2022, 17, 70–82. [Google Scholar] [CrossRef]
- Zeng, S.; Shu, X.; Ye, W. Total Factor Productivity and High-Quality Economic Development: A Theoretical and Empirical Analysis of the Yangtze River Economic Belt, China. Int. J. Environ. Res. Public Health 2022, 19, 2783. [Google Scholar] [CrossRef] [PubMed]
- Pan, W.; Wang, J.; Lu, Z.; Liu, Y.; Li, Y. High-Quality Development in China: Measurement System, Spatial Pattern, and Improvement Paths. Habitat Int. 2021, 118, 102458. [Google Scholar] [CrossRef]
- Zhang, Y.; Wei, T.; Tian, W.; Zhao, K. Spatiotemporal Differentiation and Driving Mechanism of Coupling Coordination between New-Type Urbanization and Ecological Environment in China. Sustainability 2022, 14, 11780. [Google Scholar] [CrossRef]
- Li, X.; Lu, Z.; Hou, Y.; Zhao, G.; Zhang, L. The Coupling Coordination Degree between Urbanization and Air Environment in the Beijing(Jing)-Tianjin(Jin)-Hebei(Ji) Urban Agglomeration. Ecol. Indic. 2022, 137, 108787. [Google Scholar] [CrossRef]
- Zuo, Q.; Jiang, L.; Ma, J.; Li, D. Judgment Criteria and Evaluation System for High-Quality Development of the Yellow River Basin. J. Irrig. Drain. 2021, 40, 1–8. [Google Scholar]
- Huang, X.; Cai, B.; Li, Y. Evaluation Index System and Measurement of High-Quality Development in China. Rev. Cercet. Interv. Soc. 2020, 68, 163. [Google Scholar] [CrossRef]
Publisher’s Note: MDPI stays neutral with regard to jurisdictional claims in published maps and institutional affiliations. |
© 2022 by the authors. Licensee MDPI, Basel, Switzerland. This article is an open access article distributed under the terms and conditions of the Creative Commons Attribution (CC BY) license (https://creativecommons.org/licenses/by/4.0/).