
Measuring Multi-Faceted Land Use Efficiency of Large-Scale Urban Agglomerations under Multi-Scale Drivers: Evidence from China


Abstract
:1. Introduction
2. Data and Methods
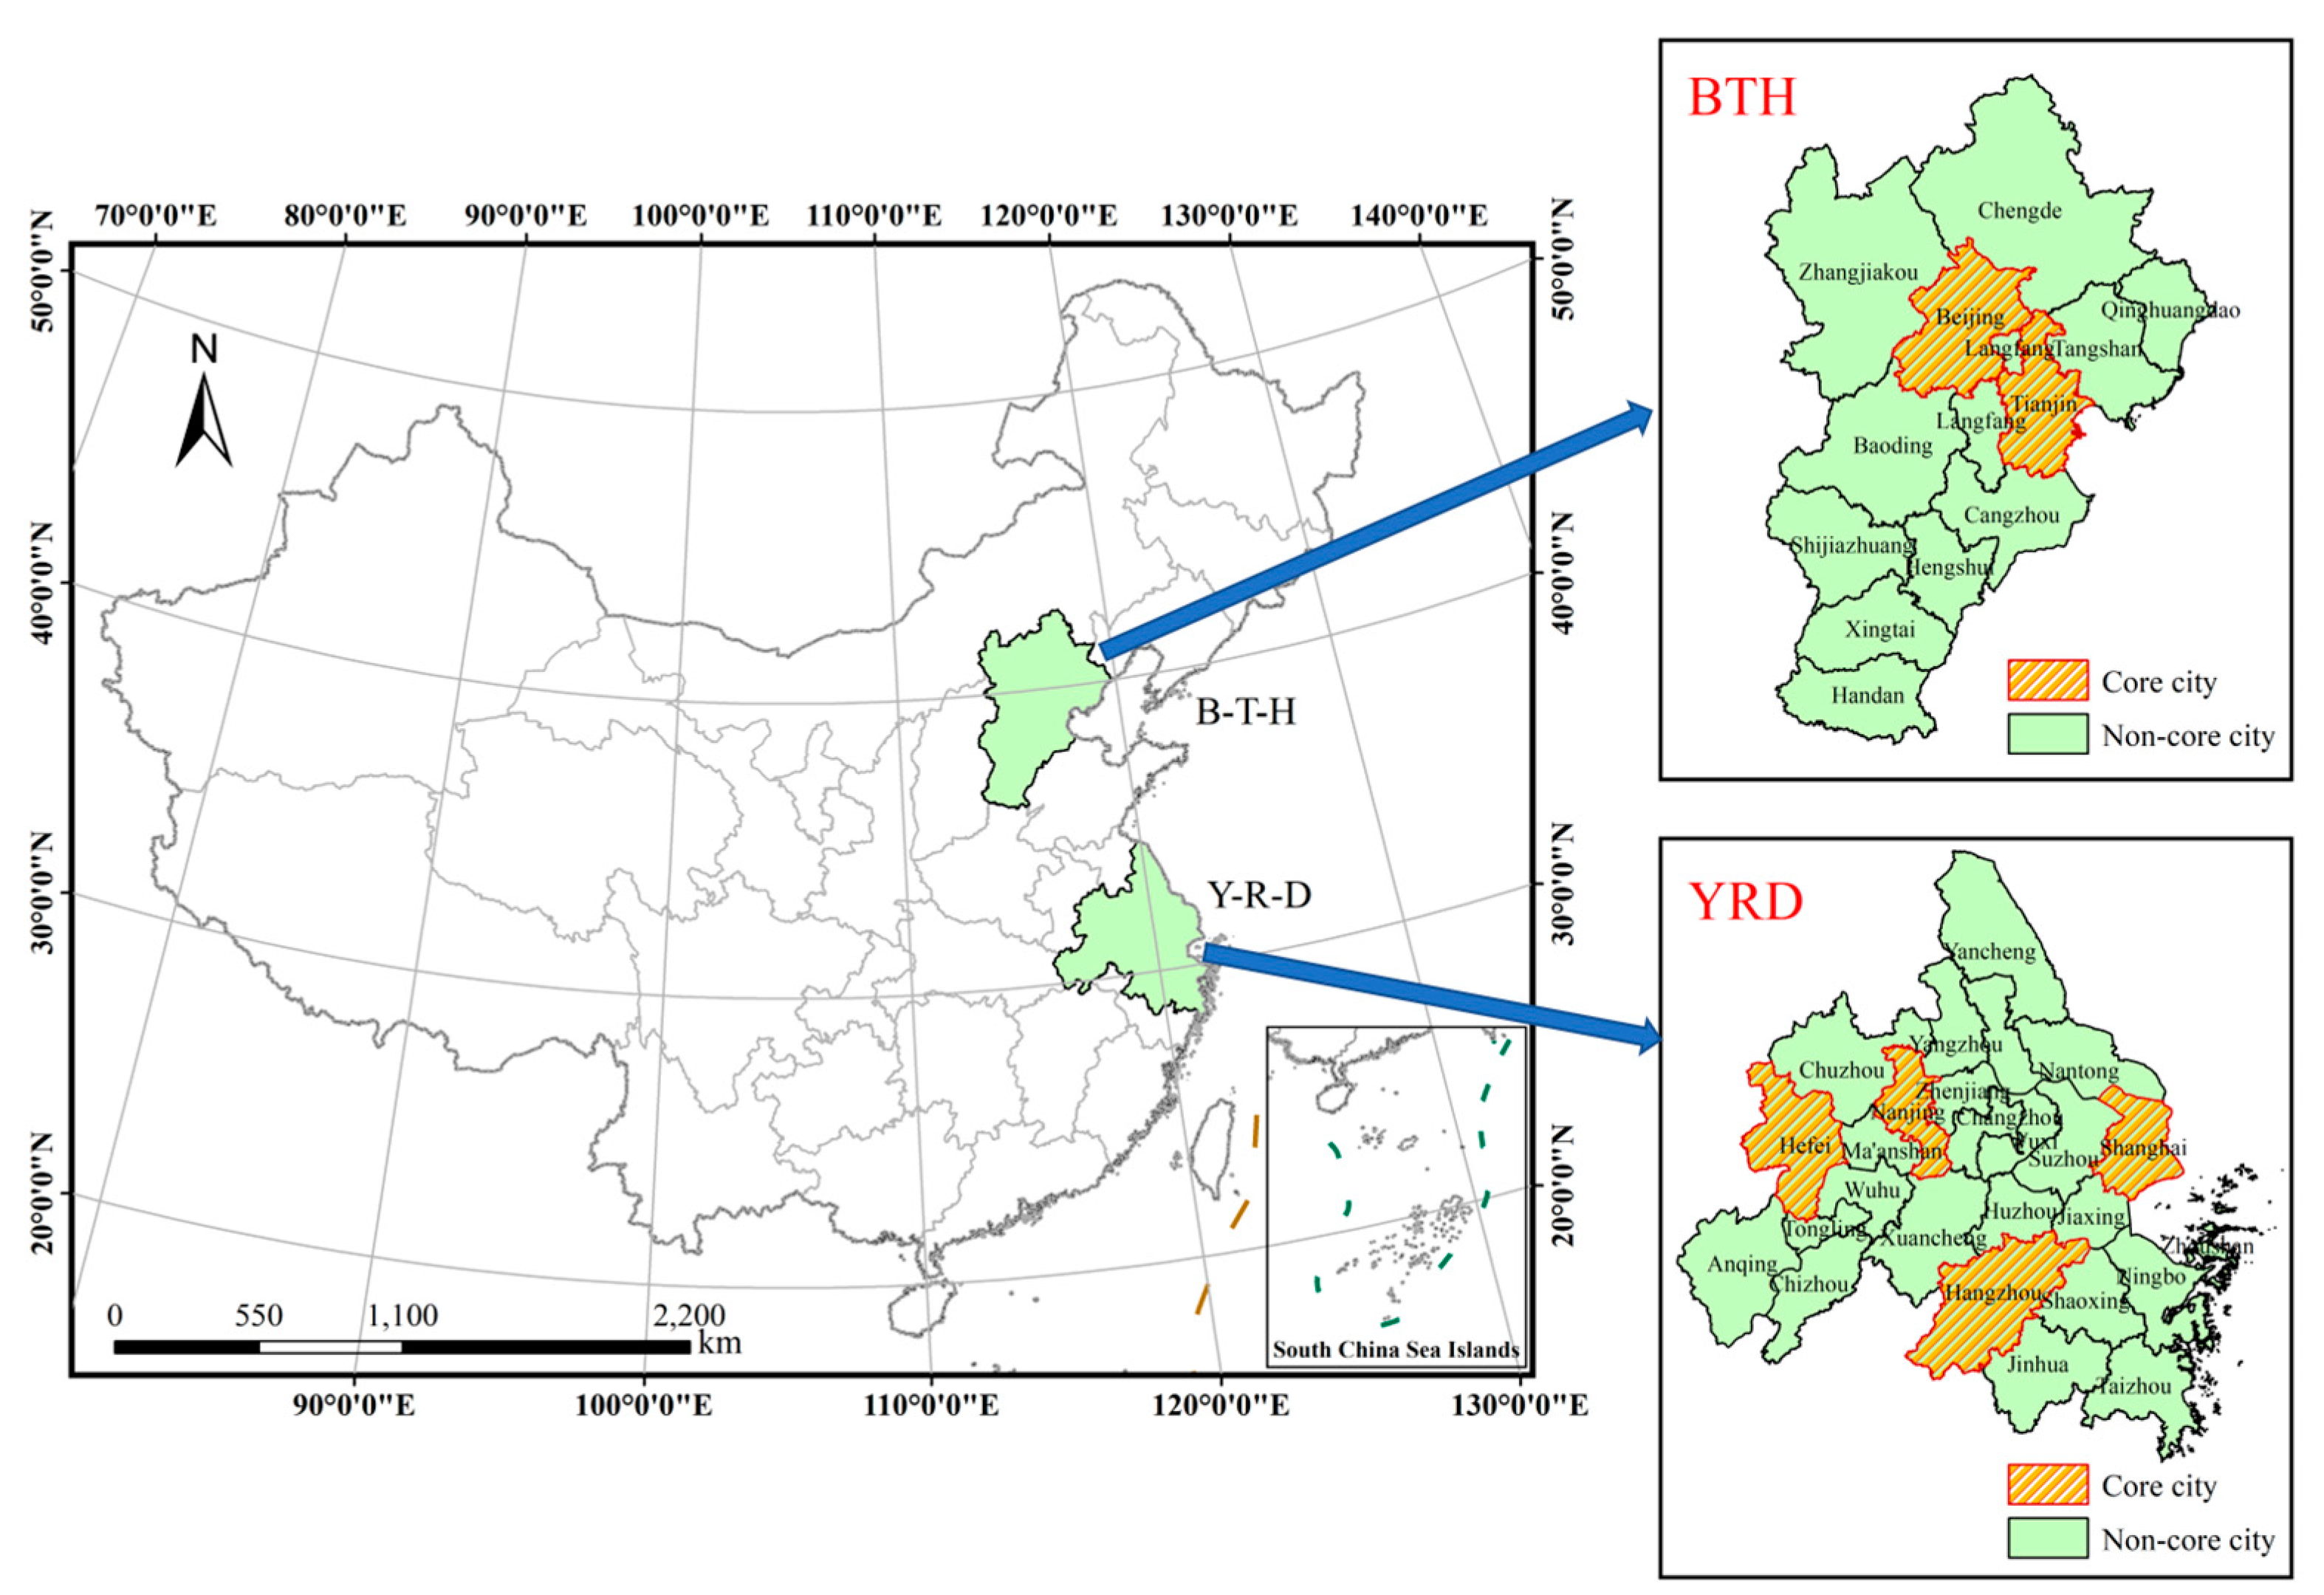
2.1. Study Area
2.2. Urban Land Use Efficiency
2.3. Drivers of Land Development
3. Results
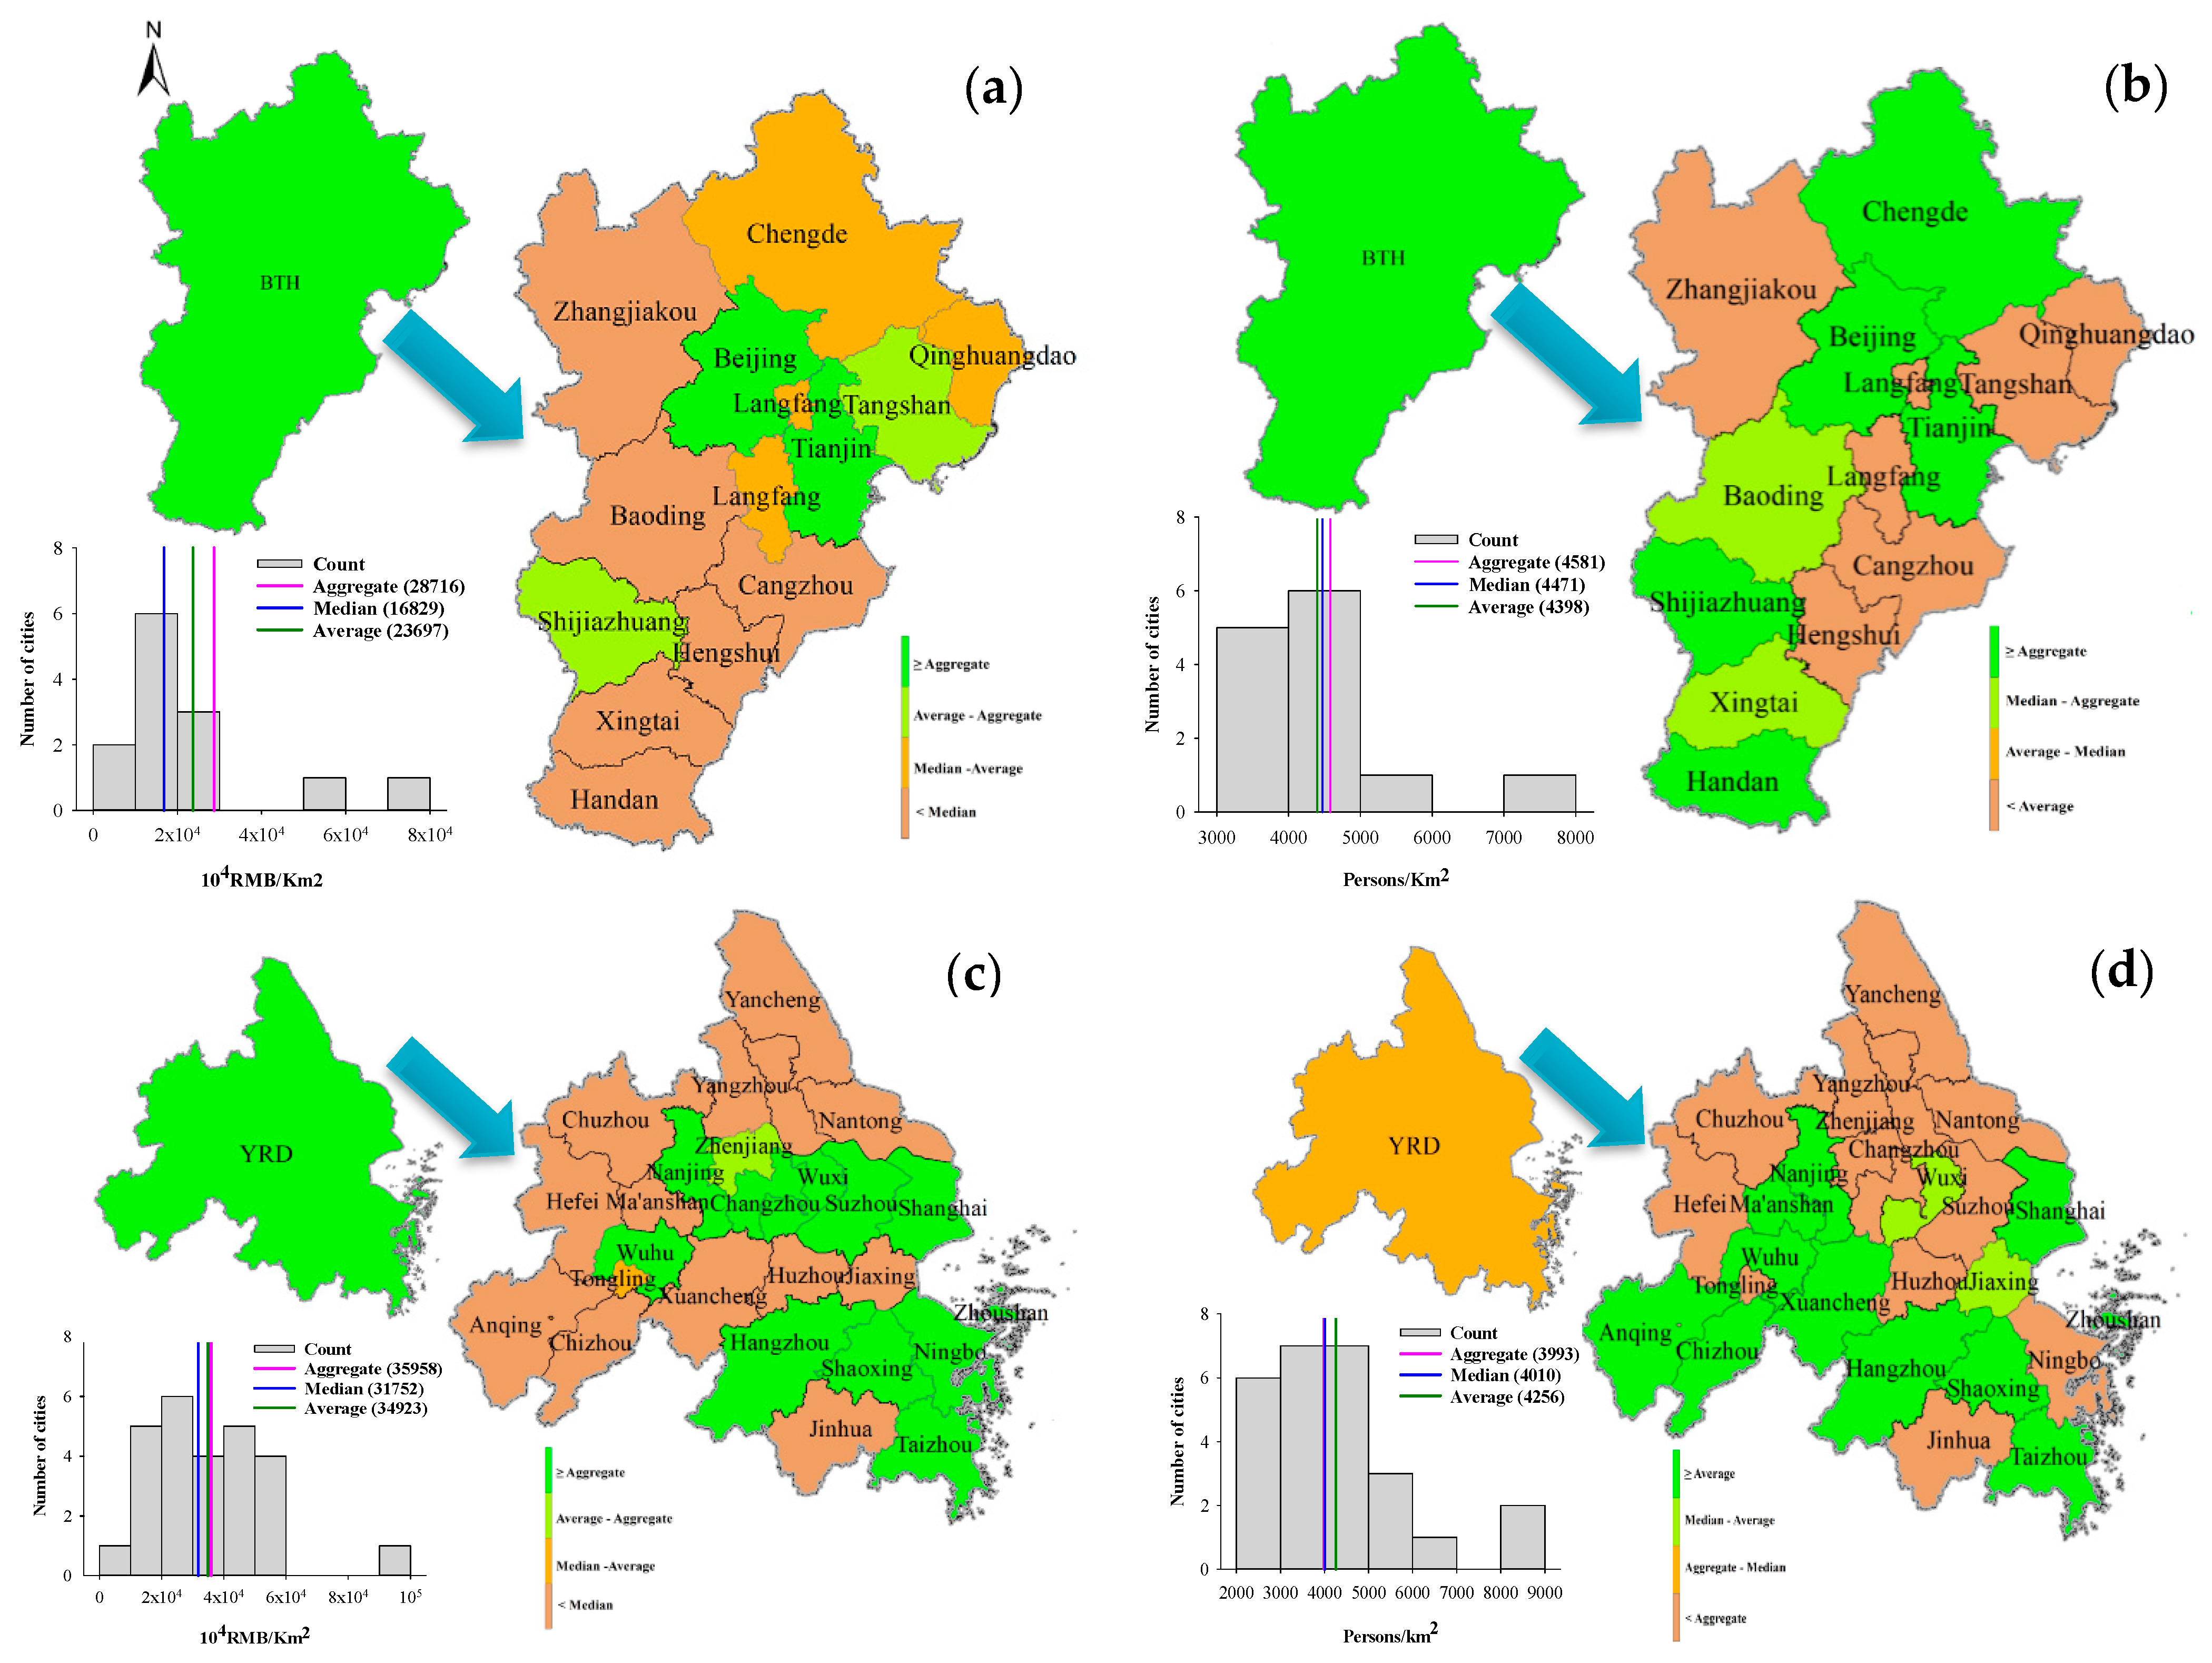
3.1. Urban Land Use Efficiency of Urban Agglomerations
3.2. Factors Driving Land Development in Urban Agglomerations
4. Discussion
4.1. Different Faceted Performance of Urban Agglomerations
4.2. Multi Factors Driving the Development of Construction Land in Urban Agglomerations
5. Conclusions
Author Contributions
Funding
Data Availability Statement
Acknowledgments
Conflicts of Interest
References
- Dadashpoor, H.; Azizi, P.; Moghadasi, M. Analyzing spatial patterns, driving forces and predicting future growth scenarios for supporting sustainable urban growth: Evidence from Tabriz metropolitan area, Iran. Sustain. Cities Soc. 2019, 47, 101502. [Google Scholar] [CrossRef]
- Guneralp, B.; Reba, M.; Hales, B.U.; Wentz, E.A.; Seto, K.C. Trends in urban land expansion, density, and land transitions from 1970 to 2010: A global synthesis. Environ. Res. Lett. 2020, 15, 044015. [Google Scholar] [CrossRef]
- Koroso, N.H.; Lengoiboni, M.; Zevenbergen, J.A. Urbanization and urban land use efficiency: Evidence from regional and Addis Ababa satellite cities, Ethiopia. Habitat Int. 2021, 117, 102437. [Google Scholar] [CrossRef]
- Chen, W.; Chen, W.; Ning, S.; Liu, E.; Zhou, X.; Wang, Y.; Zhao, M. Exploring the industrial land use efficiency of China’s resource-based cities. Cities 2019, 93, 215–233. [Google Scholar] [CrossRef]
- Yu, J.; Zhou, K.; Yang, S. Land use efficiency and influencing factors of urban agglomerations in China. Land Use Policy 2019, 88, 104143. [Google Scholar] [CrossRef]
- Zhong, T.; Qian, Z.; Huang, X.; Zhao, Y.; Zhou, Y.; Zhao, Z. Impact of the top-down quota-oriented farmland preservation planning on the change of urban land-use intensity in China. Habitat Int. 2018, 77, 71–79. [Google Scholar] [CrossRef]
- Chen, S.; Liu, Y.; Chen, C. Evaluation of Land-Use Efficiency Based on Regional Scale A Case Study in Zhanjiang, Guangdong Province. J. China Univ. Min. Technol. 2007, 17, 215–219. [Google Scholar] [CrossRef]
- Jiao, L.; Xu, Z.; Xu, G.; Zhao, R.; Liu, J.; Wang, W. Assessment of urban land use efficiency in China: A perspective of scaling law. Habitat Int. 2020, 99, 102172. [Google Scholar] [CrossRef]
- Zhu, X.; Zhang, P.; Wei, Y.; Li, Y.; Zhao, H. Measuring the efficiency and driving factors of urban land use based on the DEA method and the PLS-SEM model—A case study of 35 large and medium-sized cities in China. Sustain. Cities Soc. 2019, 50, 101646. [Google Scholar] [CrossRef]
- Dong, T.; Jiao, L.; Xu, G.; Yang, L.; Liu, J. Towards sustainability? Analyzing changing urban form patterns in the United States, Europe, and China. Sci. Total Environ. 2019, 671, 632–643. [Google Scholar] [CrossRef] [PubMed]
- Han, W.; Zhang, Y.; Cai, J. Does Urban Industrial Agglomeration Lead to the Improvement of Land Use Efficiency in China? An Empirical Study from a Spatial Perspective. Sustainability 2019, 11, 986. [Google Scholar] [CrossRef] [Green Version]
- Liu, J.; Jin, X.; Xu, W. A new framework of land use efficiency for the coordination among food, economy and ecology in regional development. Sci. Total Environ. 2020, 710, 135670. [Google Scholar] [CrossRef]
- Zitti, M.; Ferrara, C.; Perini, L.; Carlucci, M.; Salvati, L. Long-Term Urban Growth and Land Use Efficiency in Southern Europe: Implications for Sustainable Land Management. Sustainability 2015, 7, 3359–3385. [Google Scholar] [CrossRef] [Green Version]
- Liu, Y.; Zhang, Z.; Zhou, Y. Efficiency of construction land allocation in China: An econometric analysis of panel data. Land Use Policy 2018, 74, 261–272. [Google Scholar] [CrossRef]
- Chen, Y.; Chen, Z.; Xu, G.; Tian, Z. Built-up land efficiency in urban China: Insights from the General Land Use Plan (2006–2020). Habitat Int. 2016, 51, 31–38. [Google Scholar] [CrossRef]
- Kuang, W.; Liu, J.; Dong, J.; Chi, W.; Chi, Z. The rapid and massive urban and industrial land expansions in China between 1990 and 2010: A CLUD-based analysis of their trajectories, patterns, and drivers. Landsc. Urban Plan. 2016, 154, 21–33. [Google Scholar] [CrossRef]
- Zeng, C.; Yang, L.; Dong, J. Management of urban land expansion in China through intensity assessment: A big data perspective. J. Clean. Prod. 2017, 153, 637–647. [Google Scholar] [CrossRef]
- Baker, V.; Verburg, P.H.; Vliet, J.V. Trade-offs between prosperity and urban land per capita in major world cities. Geogr. Sustain. 2021, 2, 134–138. [Google Scholar] [CrossRef]
- Estoque, R.C.; Ooba, M.; Togawa, T.; Hijioka, Y.; Murayama, Y. Monitoring global land-use efficiency in the context of the UN 2030 Agenda for Sustainable Development. Habitat Int. 2021, 115, 102403. [Google Scholar] [CrossRef]
- Masini, E.; Tomao, A.; Barbati, A.; Corona, P.; Salvati, L. Urban Growth, Land-use Efficiency and Local Socioeconomic Context: A Comparative Analysis of 417 Metropolitan Regions in Europe. Environ Manage. 2019, 63, 322–337. [Google Scholar] [CrossRef]
- Fang, C.; Yu, D. Urban agglomeration: An evolving concept of an emerging phenomenon. Landsc. Urban Plan. 2017, 162, 126–136. [Google Scholar] [CrossRef]
- Dewar, M.; Epstein, D. Planning for “Megaregions” in the United States. J. Plan Lit. 2007, 22, 108–128. [Google Scholar] [CrossRef]
- Hagler, Y. Defining U.S. Megaregions; America 2050; Regional Plan Association: New York, NY, USA, 2009. [Google Scholar]
- Seto, K.C.; Sanchez-Rodriguez, R.; Fragkias, M. The New Geography of Contemporary Urbanization and the Environment. Annu. Rev. Environ. Res. 2010, 35, 167–194. [Google Scholar] [CrossRef] [Green Version]
- Cerina, F.; Mureddu, F. Is agglomeration really good for growth? Global efficiency, interregional equity and uneven growth. J. Urban Econ. 2014, 84, 9–22. [Google Scholar] [CrossRef] [Green Version]
- Cottineau, C.; Finace, O.; Hatna, E.; Arcaute, E.; Batty, M. Defining urban clusters to detect agglomeration economies. Environ. Plan. B Urban Anal. City Sci. 2019, 46, 1611–1626. [Google Scholar] [CrossRef] [Green Version]
- Fan, J.; Wang, Y.; Ouyang, Z.; Li, L.; Xu, Y.; Zhang, W.; Wang, C.; Xu, W.; Li, J.; Yu, J. Risk forewarning of regional development sustainability based on a natural resources and environmental carrying index in China. Earth’s Future 2017, 5, 196–213. [Google Scholar] [CrossRef]
- Felsenstein, D. Do high technology agglomerations encourage urban sprawl? Ann. Reg. Sci. 2002, 36, 663–682. [Google Scholar] [CrossRef]
- Li, W.; Zhou, W.; Han, L.; Qian, Y. Uneven urban-region sprawl of China’s megaregions and the spatial relevancy in a multi-scale approach. China. Ecol. Indic. 2019, 97, 194–203. [Google Scholar] [CrossRef]
- He, D.; Yin, Q.; Zheng, M.; Gao, P. Transport and regional economic integration: Evidence from the Chang-Zhu-Tan region in China. Transp. Policy 2019, 79, 193–203. [Google Scholar] [CrossRef]
- Li, G.; Sun, S.; Fang, C. The varying driving forces of urban expansion in China: Insights from a spatial-temporal analysis. Landsc. Urban Plan. 2018, 174, 63–77. [Google Scholar] [CrossRef]
- Wetwitoo, J.; Kato, H. High-speed rail and regional economic productivity through agglomeration and network externality: A case study of inter-regional transportation in Japan. Case Stud. Transp. Policy 2017, 5, 549–559. [Google Scholar] [CrossRef]
- Li, X.; Zhou, W.; Ouyang, Z. Forty years of urban expansion in Beijing: What is the relative importance of physical, socioeconomic, and neighborhood factors? Appl. Geogr. 2013, 38, 1–10. [Google Scholar] [CrossRef]
- Shu, B.; Zhang, H.; Li, Y.; Qu, Y.; Chen, L. Spatiotemporal variation analysis of driving forces of urban land spatial expansion using logistic regression: A case study of port towns in Taicang City, China. Habitat Int. 2014, 43, 181–190. [Google Scholar] [CrossRef]
- Wang, Z.; Chen, J.; Zheng, W.; Deng, X. Dynamics of land use efficiency with ecological intercorrelation in regional development. Landsc. Urban Plan. 2018, 177, 303–316. [Google Scholar] [CrossRef]
- Borjesson, M.; Isacsson, G.; Andersson, M.; Anderstig, C. Agglomeration, productivity and the role of transport system improvements. Econ. Transp. 2019, 18, 27–39. [Google Scholar] [CrossRef] [Green Version]
- Sun, Y.; Zhao, S. Spatiotemporal dynamics of urban expansion in 13 cities across the Jing-Jin-Ji Urban Agglomeration from 1978 to 2015. Ecol. Indic. 2018, 87, 302–313. [Google Scholar] [CrossRef]
- National Bureau of Statistics of China (NBSC). China Urban Statistical Yearbook; National Bureau of Statistics Press: Beijing, China, 2016.
- Zhang, P.; Zhao, Y.; Zhu, X.; Cai, Z.; Xu, J.; Shi, S. Spatial structure of urban agglomeration under the impact of high-speed railway construction: Based on the social network analysis. Sustain. Cities Soc. 2020, 62, 102404. [Google Scholar] [CrossRef]
- Huang, C.; Zhuang, Q.; Meng, X.; Guo, H.; Han, J. An improved nightlight threshold method for revealing the spatiotemporal dynamics and driving forces of urban expansion in China. J. Environ. Manag. 2021, 289, 112574. [Google Scholar] [CrossRef] [PubMed]
- Ju, X.; Li, W.; He, L.; Li, J.; Han, L.; Mao, J. Ecological redline policy may significantly alter urban expansion and affect surface runoff in the Beijing-Tianjin-Hebei megaregion of China. Environ. Res. Lett. 2020, 15, 1040b1. [Google Scholar] [CrossRef]
- Verburg, P.H.; Soepboer, W.; Veldkamp, A.; Limpiada, R.; Espaldon, V.; Mastura, S.S.A. Modeling the spatial dynamics of regional land use: The CLUE-S model. Environ. Manage. 2002, 30, 391–405. [Google Scholar] [CrossRef]
- Lamichhane, S.; Shakya, N.M. Integrated assessment of climate change and land use change impacts on hydrology in the Kathmandu Valley watershed, Central Nepal. Water 2019, 11, 2059. [Google Scholar] [CrossRef] [Green Version]
- Pietrzak, O.; Pietrzak, K. The role of railway in handling transport services of cities and agglomerations. Transp. Res. Procedia 2019, 39, 405–416. [Google Scholar] [CrossRef]
- Rodrigue, J. Transportation and Land Use. In International Encyclopedia of Human Geography, 2nd ed.; Department of Geography, Queen’s University: Kingston, ON, Canada, 2019; Volume 13, pp. 463–469. [Google Scholar]
- Wu, C.; Wei, Y.D.; Huang, X.; Chen, B. Economic transition, spatial development and urban land use efficiency in the Yangtze River Delta, China. Habitat Int. 2017, 63, 67–78. [Google Scholar] [CrossRef]


| Classification of Driving Forces Based on Spatial Relevance | Classification of Driving Forces Based on Social–Economic–Natural Attributes | Driving Forces |
|---|---|---|
| Regional-scale driving forces | Geophysical factors | Elevation/m |
| Slope/° | ||
| Distance to river/km | ||
| Distance to coastline/km | ||
| Social factors | Distance to railway/km | |
| Distance to national highway/km | ||
| Distance to highway/km | ||
| Distance to urban center/km | ||
| Distance to core city/km | ||
| City-scale driving forces | Demographic factors | Proportion of urban population/% |
| Economic factors | Proportion of the secondary industry/% | |
| Proportion of the tertiary industry/% |
| ULUE Quantification in Terms of the GDP Output per Unit of Construction Land (RMB/km2) | BTH | YRD | |
|---|---|---|---|
| ULUE at aggregate level | Aggregate | 28,716 | 35,958 |
| ULUE at city level | Average | 23,697 | 34,923 |
| Median | 16,829 | 31,752 | |
| Max | 74,854 | 91,173 | |
| Min | 9027 | 9470 | |
| ULUE Quantification in Terms of Population Density per Unit of Construction land (Persons/km2) | BTH | YRD | |
|---|---|---|---|
| ULUE at aggregate level | Aggregate | 4581 | 3993 |
| ULUE at city level | Average | 4398 | 4256 |
| Median | 4471 | 4010 | |
| Max | 7061 | 8765 | |
| Min | 3055 | 2218 | |
| Drivers of Spatial Development of Construction Land | BTH Urban Agglomeration | YRD Urban Agglomeration | ||
|---|---|---|---|---|
| Beta | Exp (B) | Beta | Exp (B) | |
| Elevation/m | −0.001 | 0.999 | −0.004 | 0.996 |
| Slope/° | −0.134 | 0.874 | −0.24 | 0.787 |
| Distance to river/km | −0.003 | 0.997 | ||
| Distance to coastline/km | 0.002 | 1.002 | −0.001 | 0.999 |
| Distance to railway/km | −0.002 | 0.998 | −0.003 | 0.997 |
| Distance to national highway/km | 0.001 | 1.001 | ||
| Distance to highway/km | −0.006 | 0.994 | −0.018 | 0.983 |
| Distance to urban center/km | 0.002 | 1.002 | 0.005 | 1.005 |
| Distance to core city/km | 0.003 | 1.003 | ||
| Proportion of urban population/% | −0.004 | 0.996 | ||
| Proportion of the secondary industry/% | 0.013 | 1.014 | ||
| Proportion of the tertiary industry/% | −0.013 | 0.987 | 0.005 | 1.005 |
| Constant | −3.500 | −3.500 | −3.311 | 0.036 |
| ROC value | 0.86 | 0.85 | ||
Publisher’s Note: MDPI stays neutral with regard to jurisdictional claims in published maps and institutional affiliations. |
© 2022 by the authors. Licensee MDPI, Basel, Switzerland. This article is an open access article distributed under the terms and conditions of the Creative Commons Attribution (CC BY) license (https://creativecommons.org/licenses/by/4.0/).
Share and Cite
Ma, J.; Li, W.; Wang, Z.; He, L.; Han, L. Measuring Multi-Faceted Land Use Efficiency of Large-Scale Urban Agglomerations under Multi-Scale Drivers: Evidence from China. Land 2022, 11, 91. https://doi.org/10.3390/land11010091
Ma J, Li W, Wang Z, He L, Han L. Measuring Multi-Faceted Land Use Efficiency of Large-Scale Urban Agglomerations under Multi-Scale Drivers: Evidence from China. Land. 2022; 11(1):91. https://doi.org/10.3390/land11010091
Chicago/Turabian StyleMa, Jinfeng, Weifeng Li, Zhao Wang, Liang He, and Lijian Han. 2022. "Measuring Multi-Faceted Land Use Efficiency of Large-Scale Urban Agglomerations under Multi-Scale Drivers: Evidence from China" Land 11, no. 1: 91. https://doi.org/10.3390/land11010091
APA StyleMa, J., Li, W., Wang, Z., He, L., & Han, L. (2022). Measuring Multi-Faceted Land Use Efficiency of Large-Scale Urban Agglomerations under Multi-Scale Drivers: Evidence from China. Land, 11(1), 91. https://doi.org/10.3390/land11010091