
Agricultural Transformation and Its Impact on Ecosystem Services and Human Well-Being in Peri-Urban Areas: The Case of Xi’an, China


Abstract
1. Introduction
2. Material
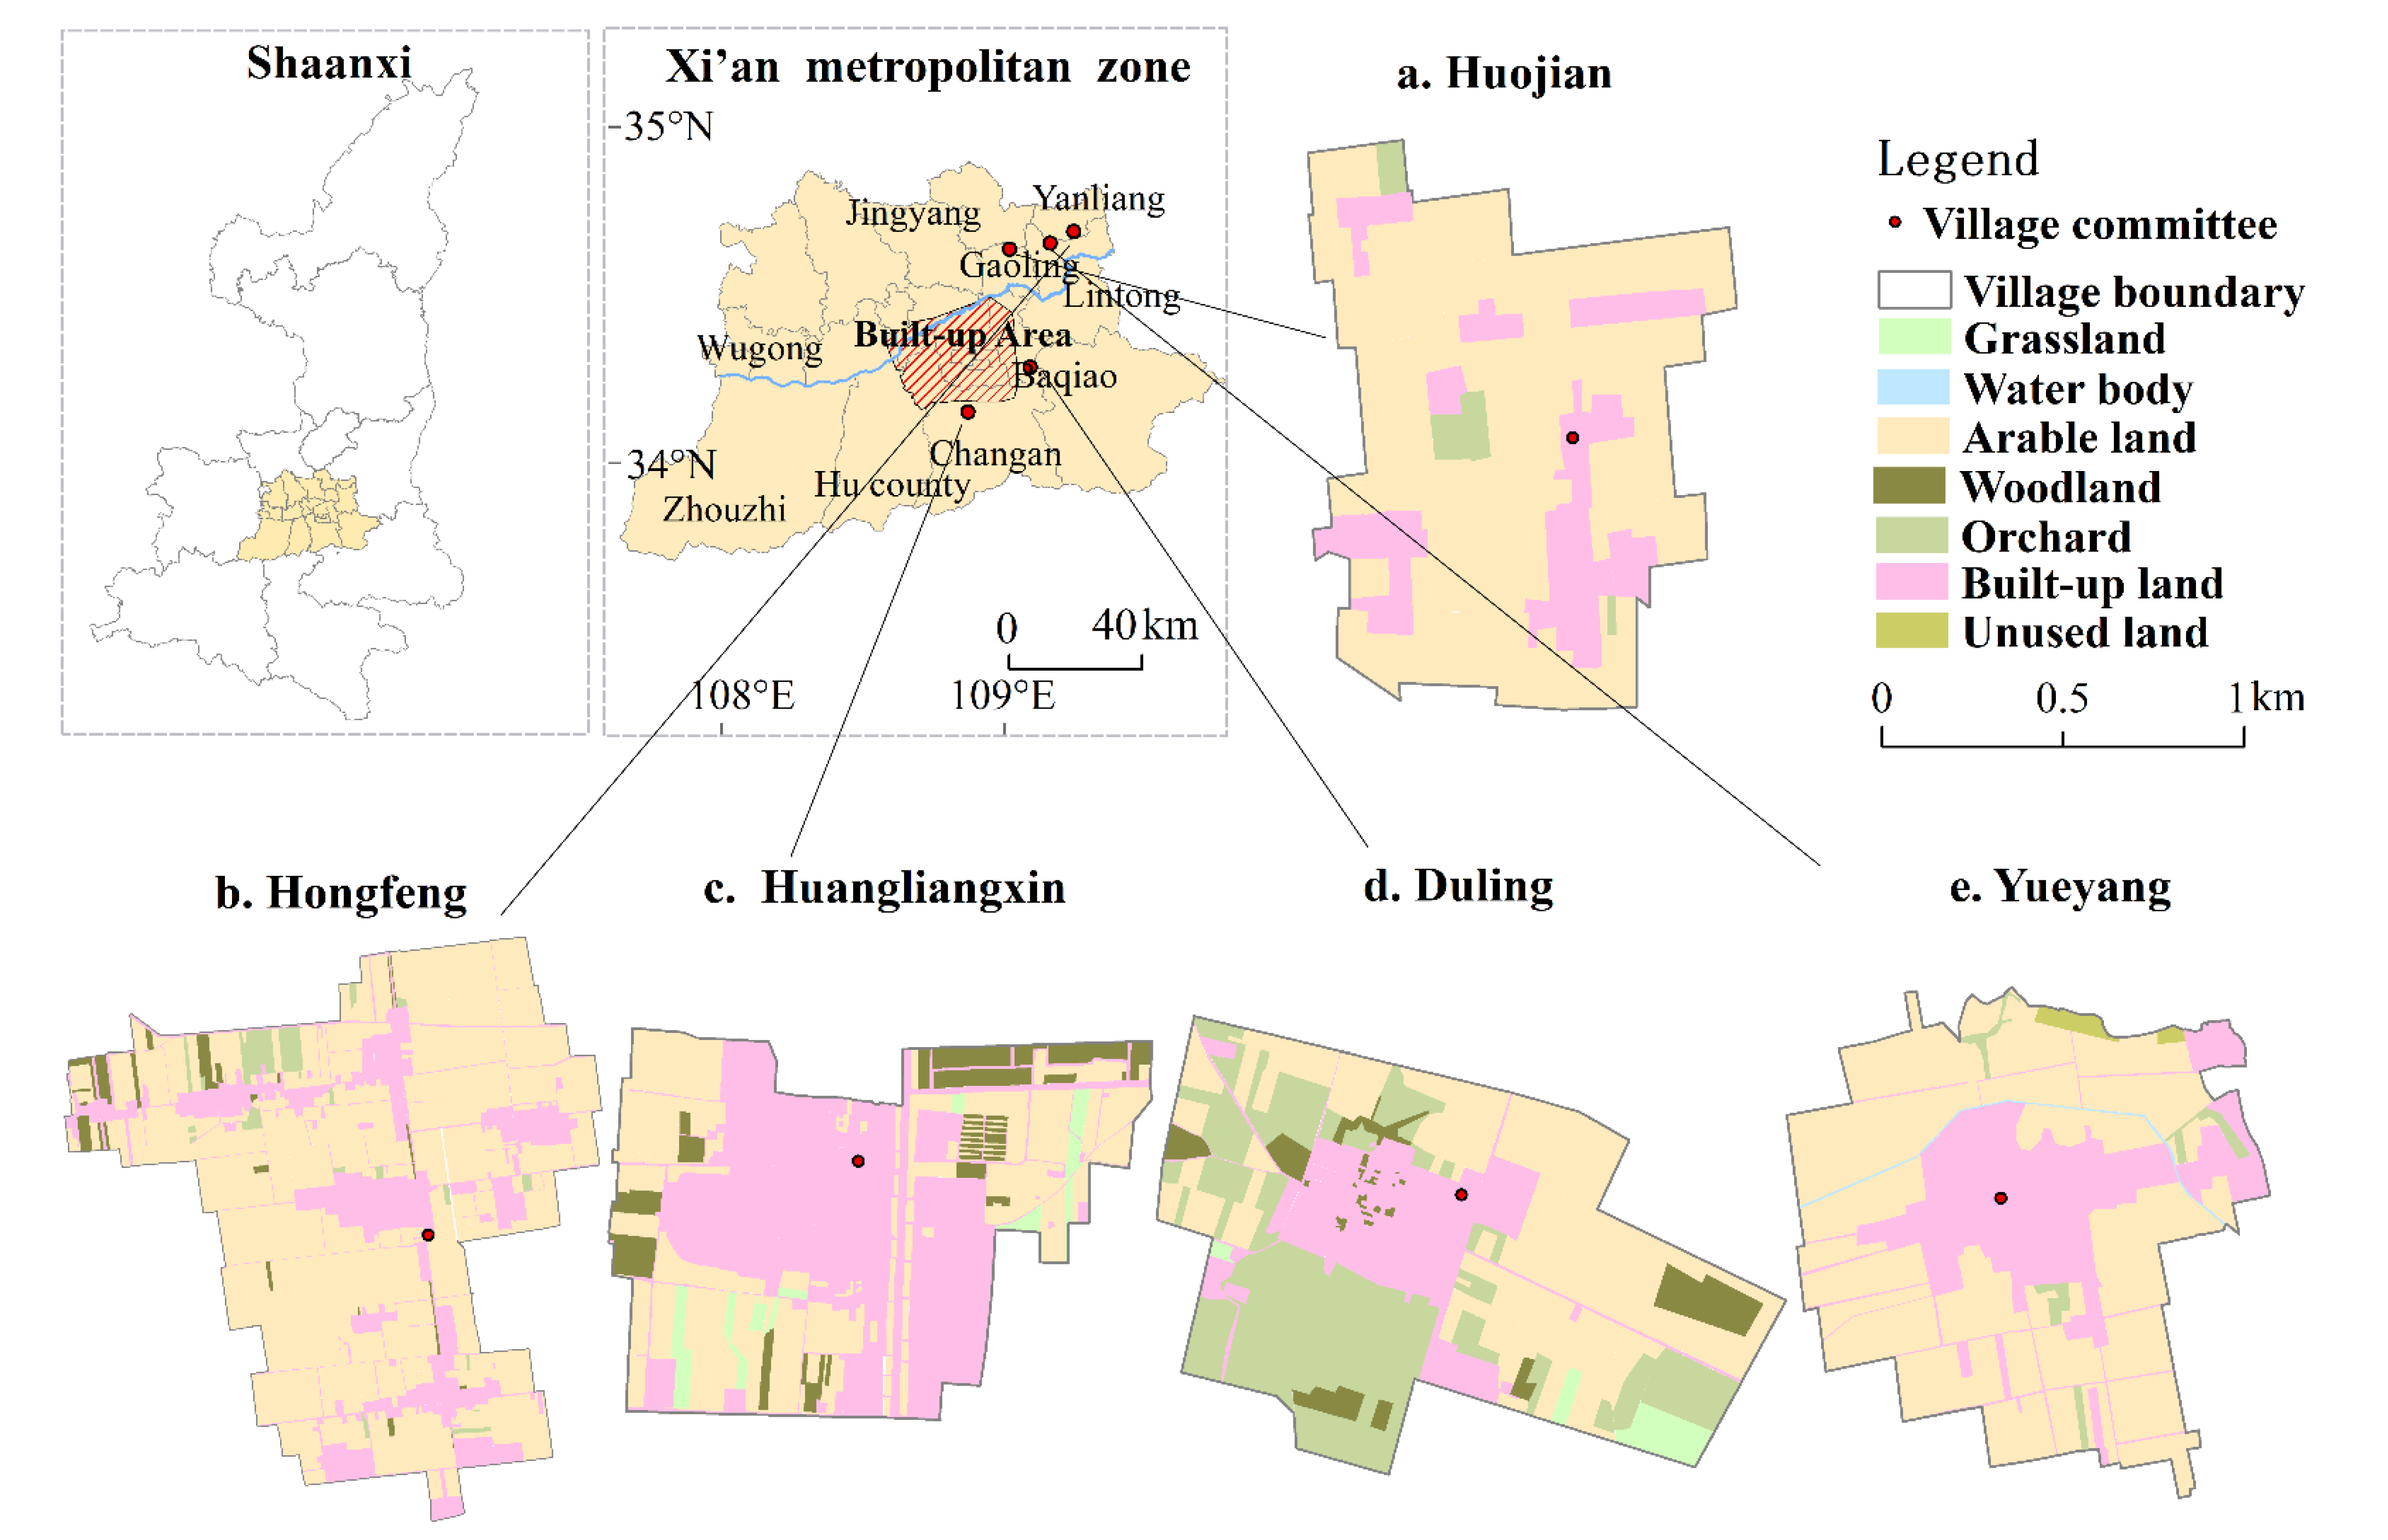
2.1. The Study Area
2.2. Methods and Data Sources
2.2.1. Remote Sensing Interpretation and Field-Mapping Method
2.2.2. Semi-Structured Interviews and Questionnaire Survey
2.2.3. Assessment Methods of Ecosystem Services
- (1)
- Economic-production services
- (2)
- Air-purification services
- (3)
- Carbon sequestration and oxygen-release services
- (4)
- Water-conservation services
- (5)
- Tourism and leisure services
2.2.4. Human Well-Being Assessment Methods
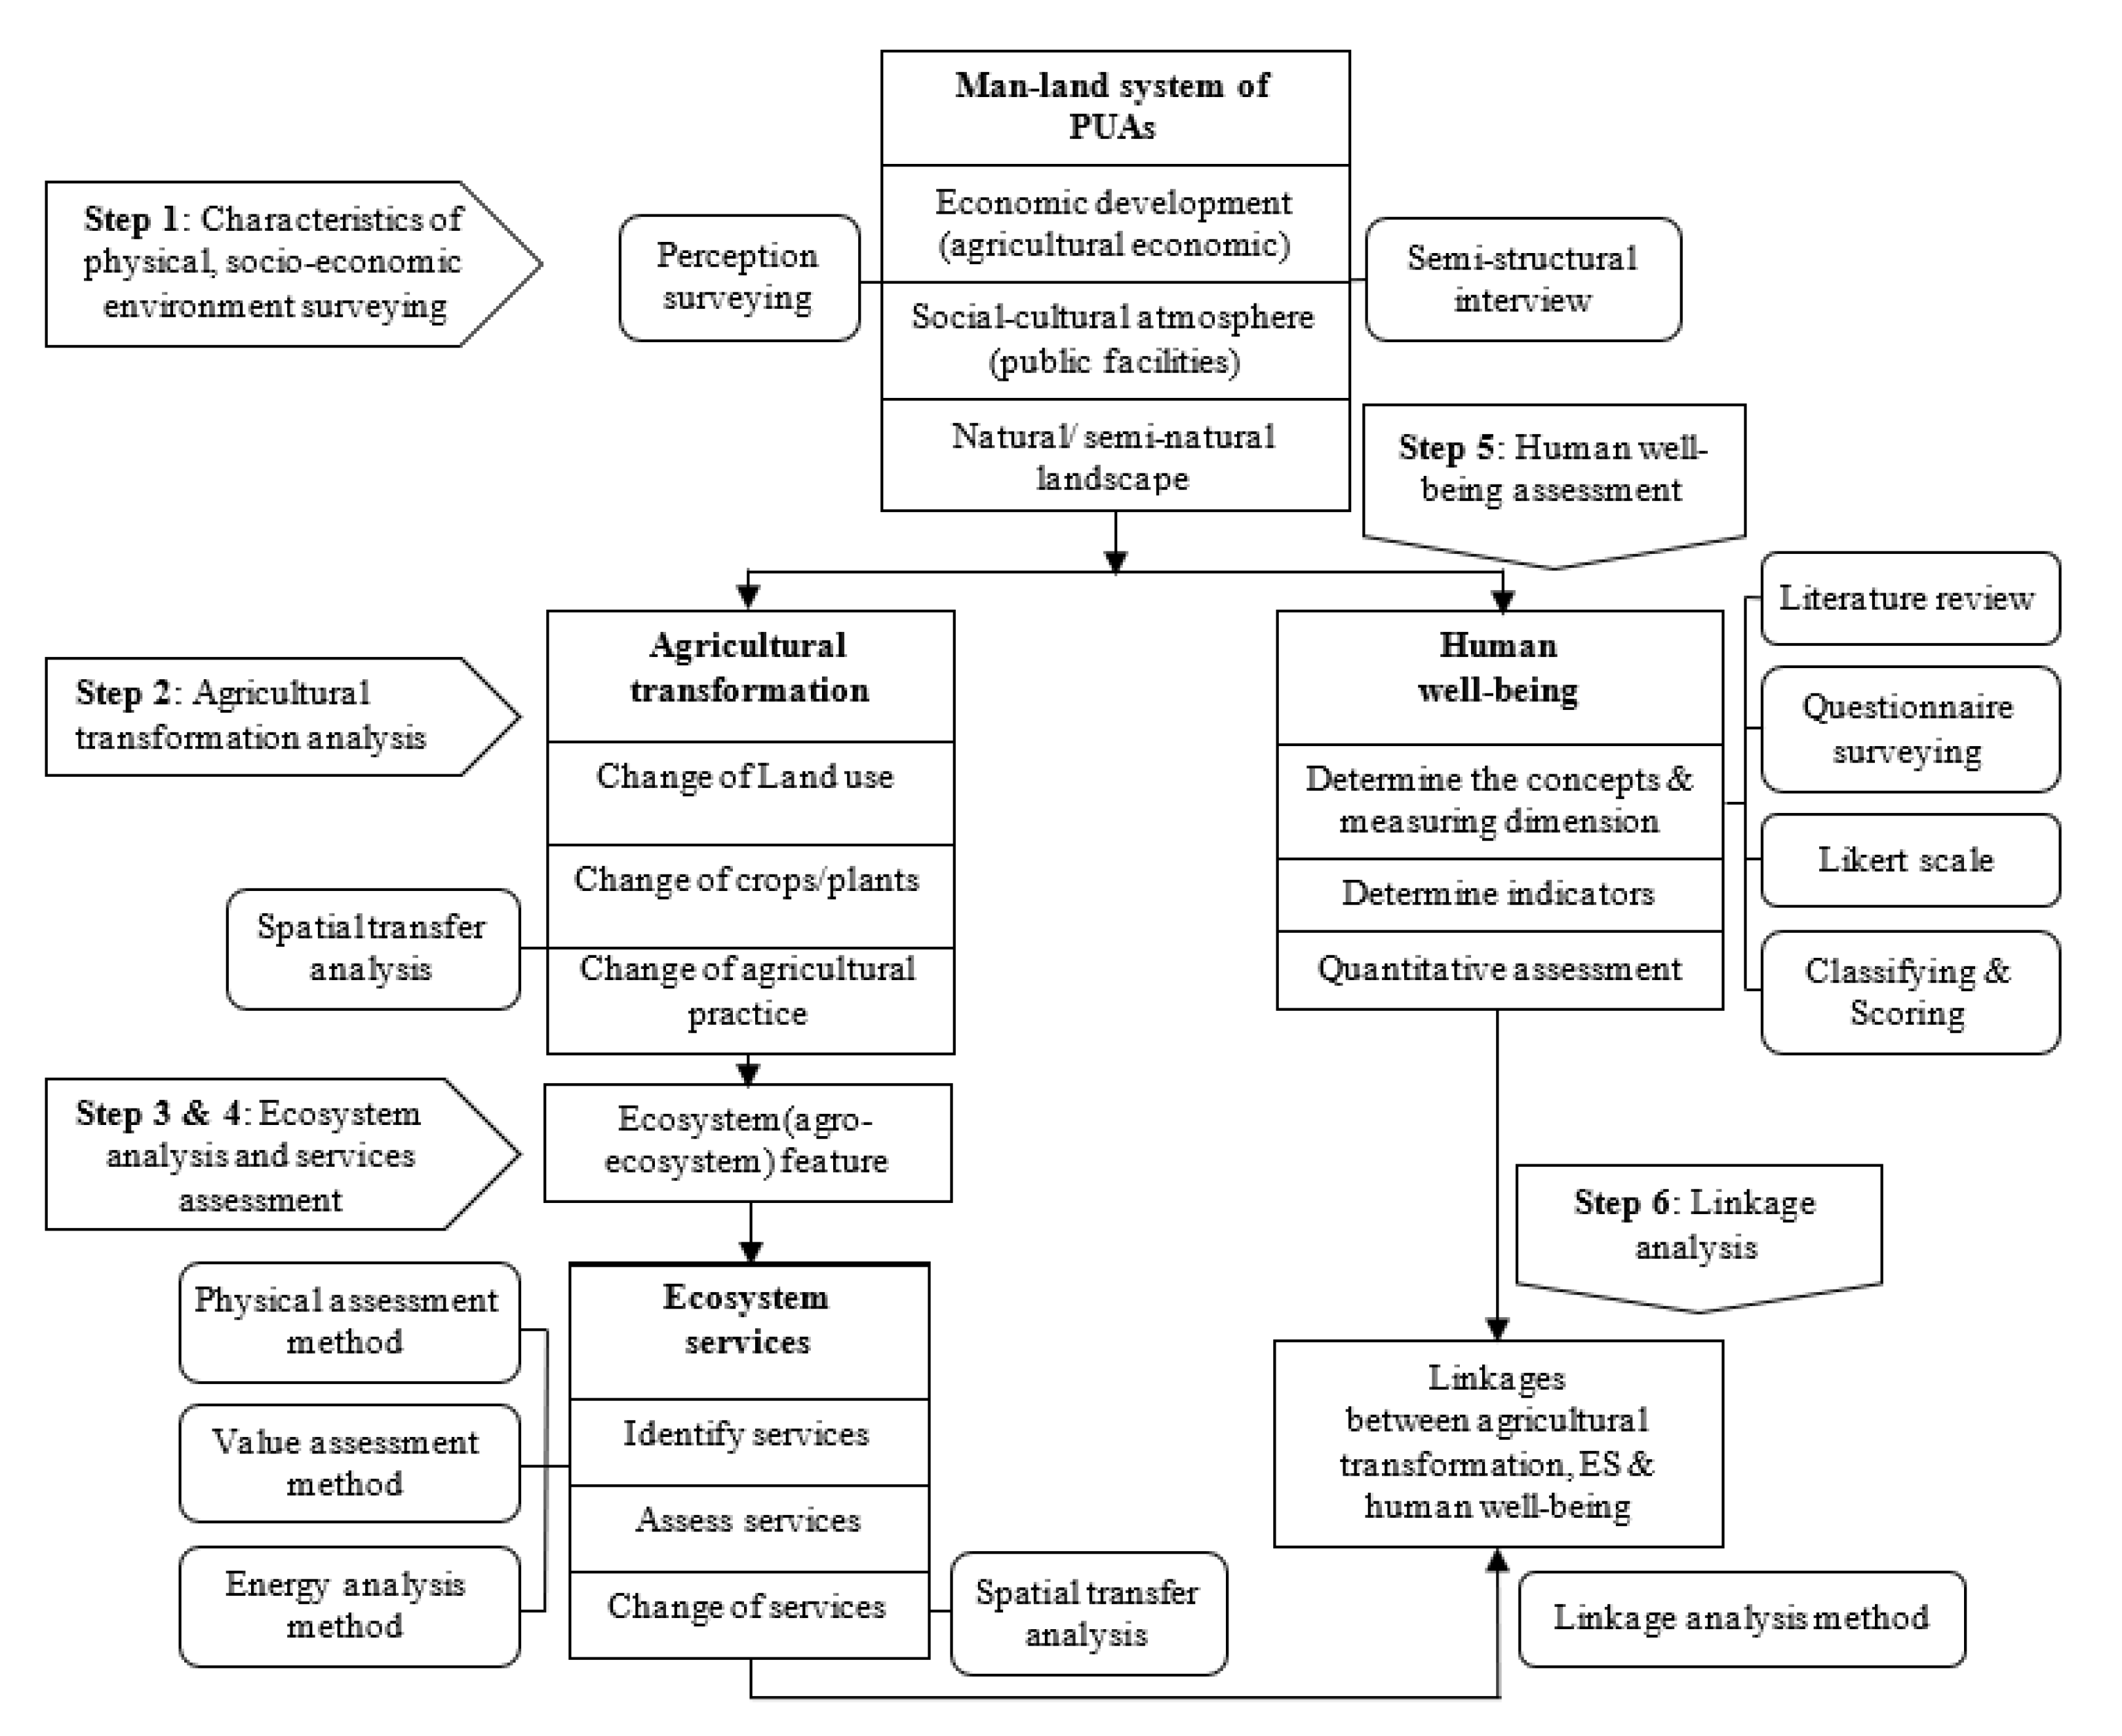
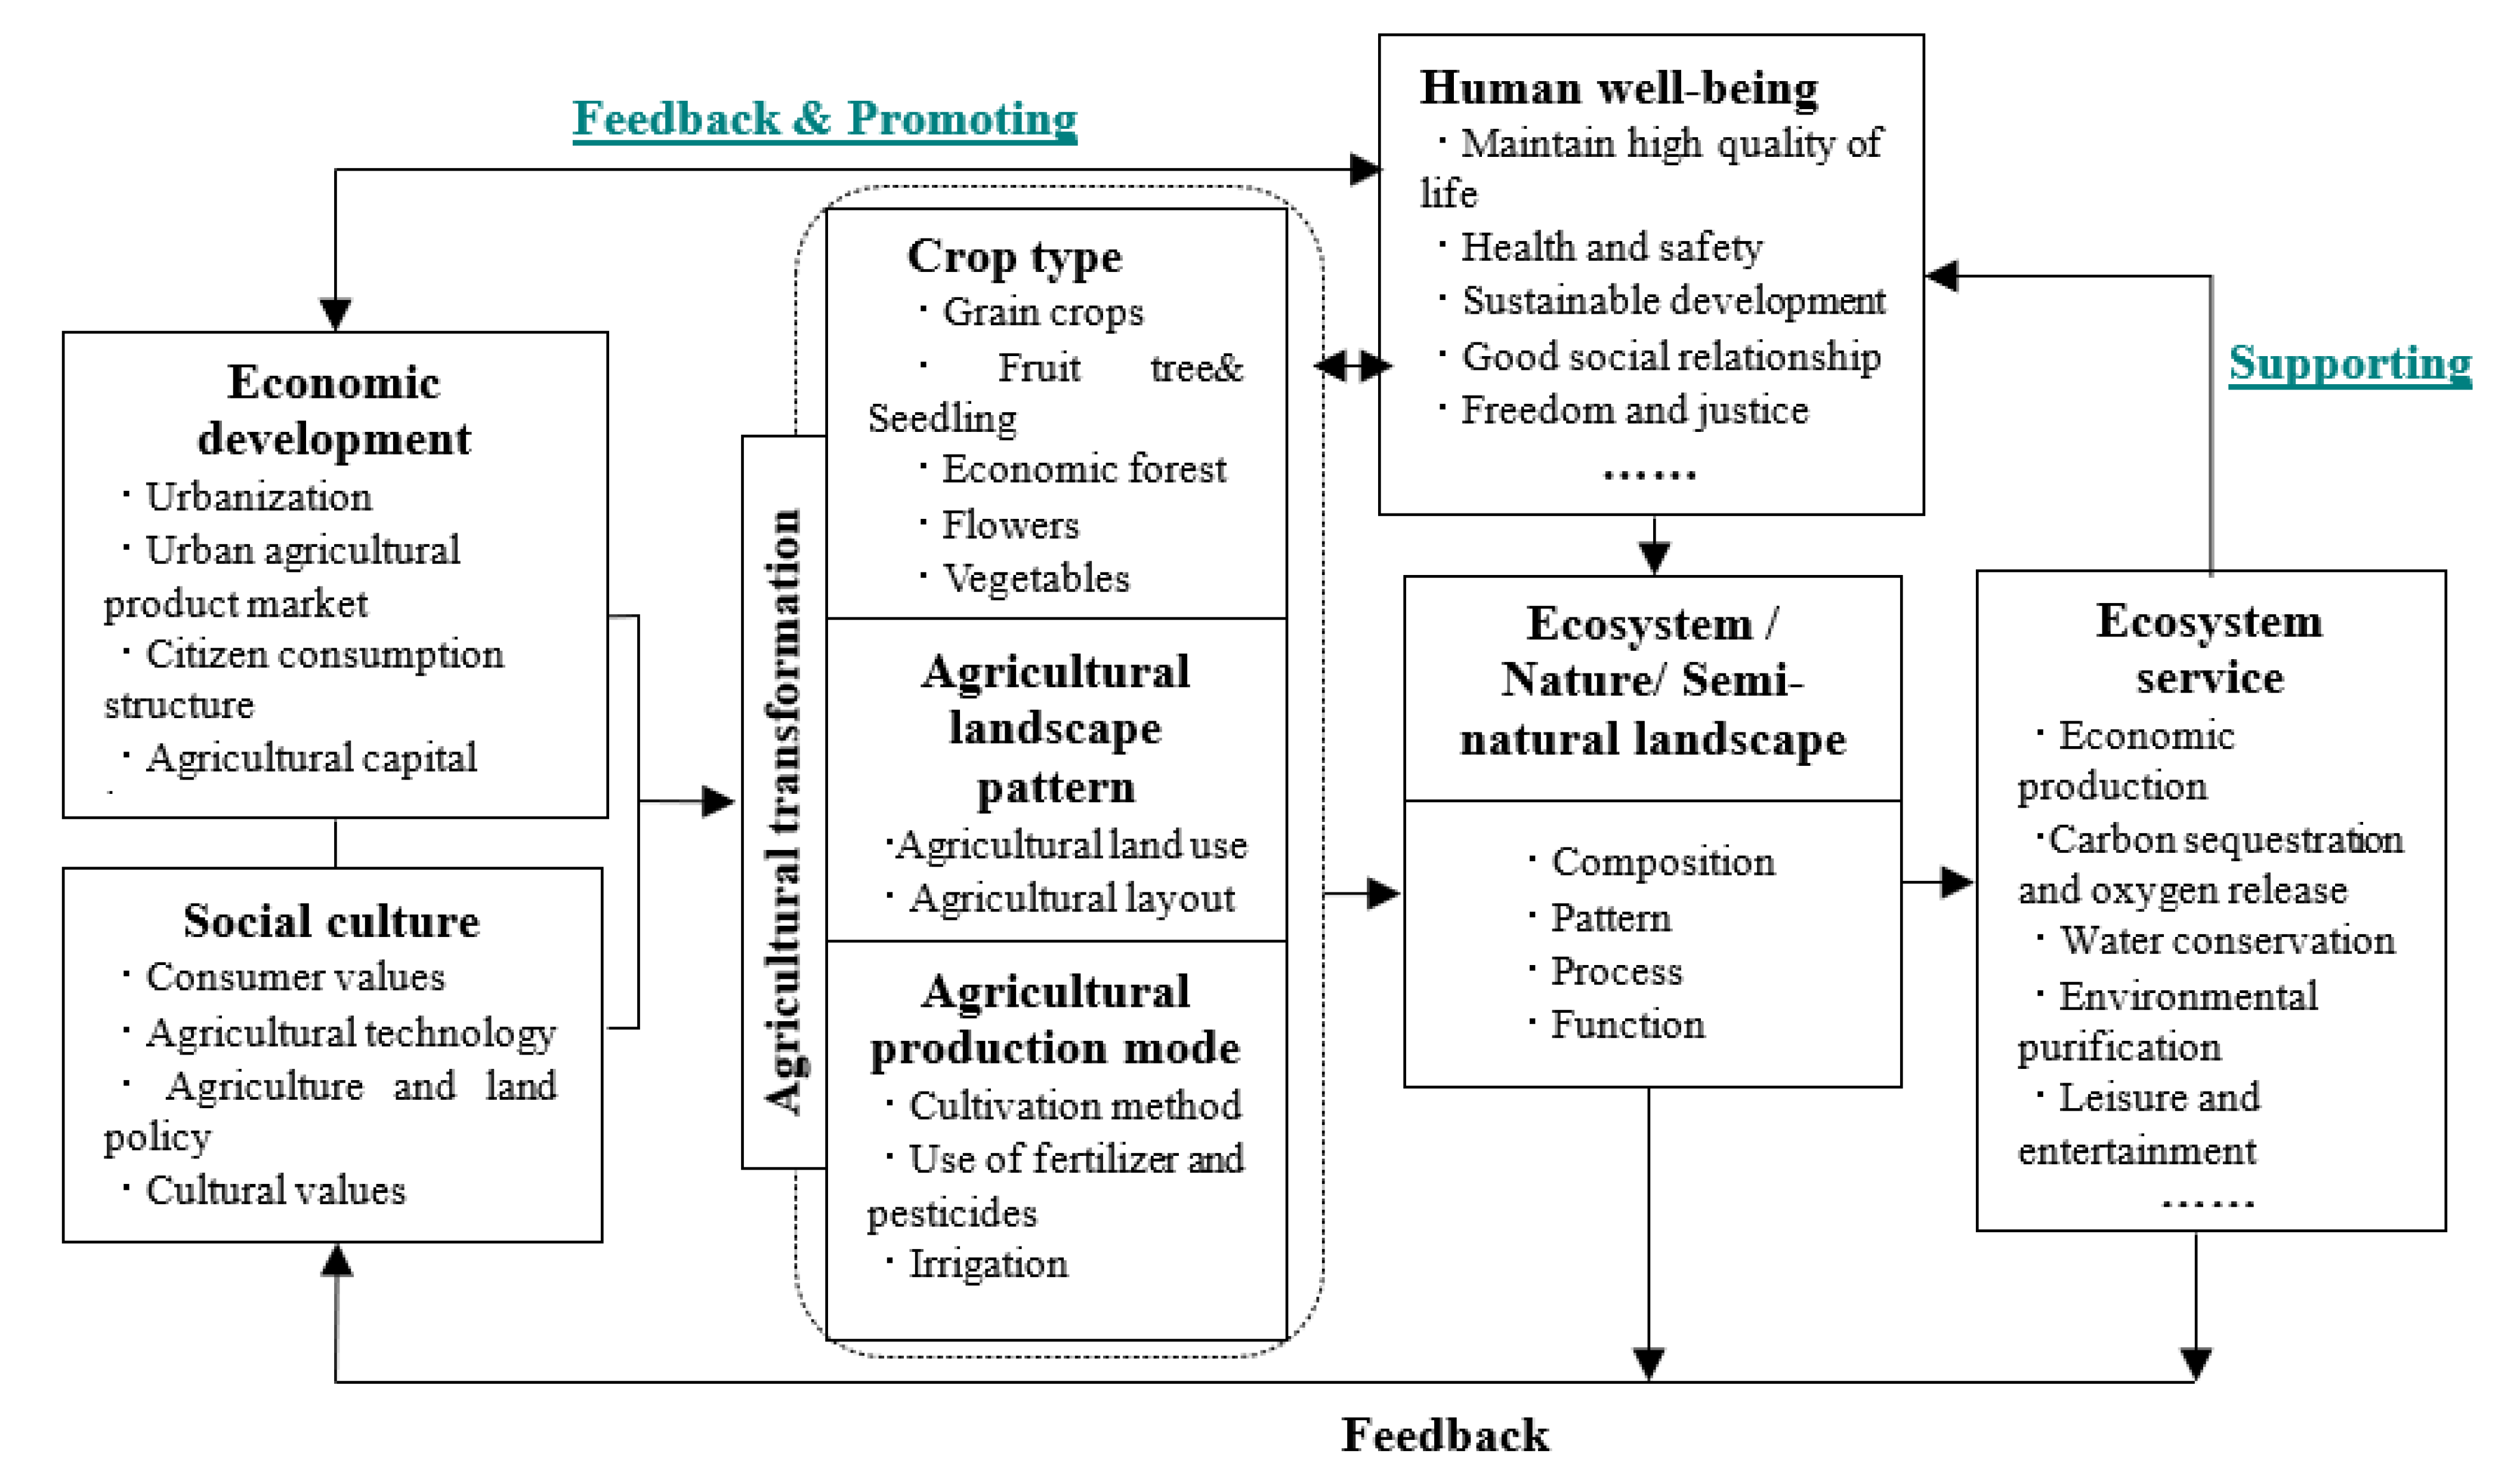
2.2.5. An Analysis Framework of Linkages between Agricultural Transformation, Ecosystem Services and Human Well-Being
- (1)
- The characteristics of economic development (especially the agricultural economy), sociocultural and physical geographical environment (via semi-structured interview and questionnaire survey), identifying the crucial causal relationships within the human-land system.
- (2)
- The nature of the agricultural transformation, examining the characteristics and driving factors of agricultural landscape change, focusing on changes in agricultural land use, crop types and practices.
- (3)
- Ecosystem characteristics: the types, structure and pattern of local ecosystems (especially agroecosystems).
- (4)
- Analysis of changes to ES, identifying major ecosystem services and evaluating and analysing changes in ES.
- (5)
- Human well-being assessment. Define human well-being and determine measurement dimensions, select the indicators and quantitatively evaluate.
- (6)
- Analyse the linkages between ES and human well-being (Figure 2).
3. Results
3.1. Agriculture Transformation Analysis
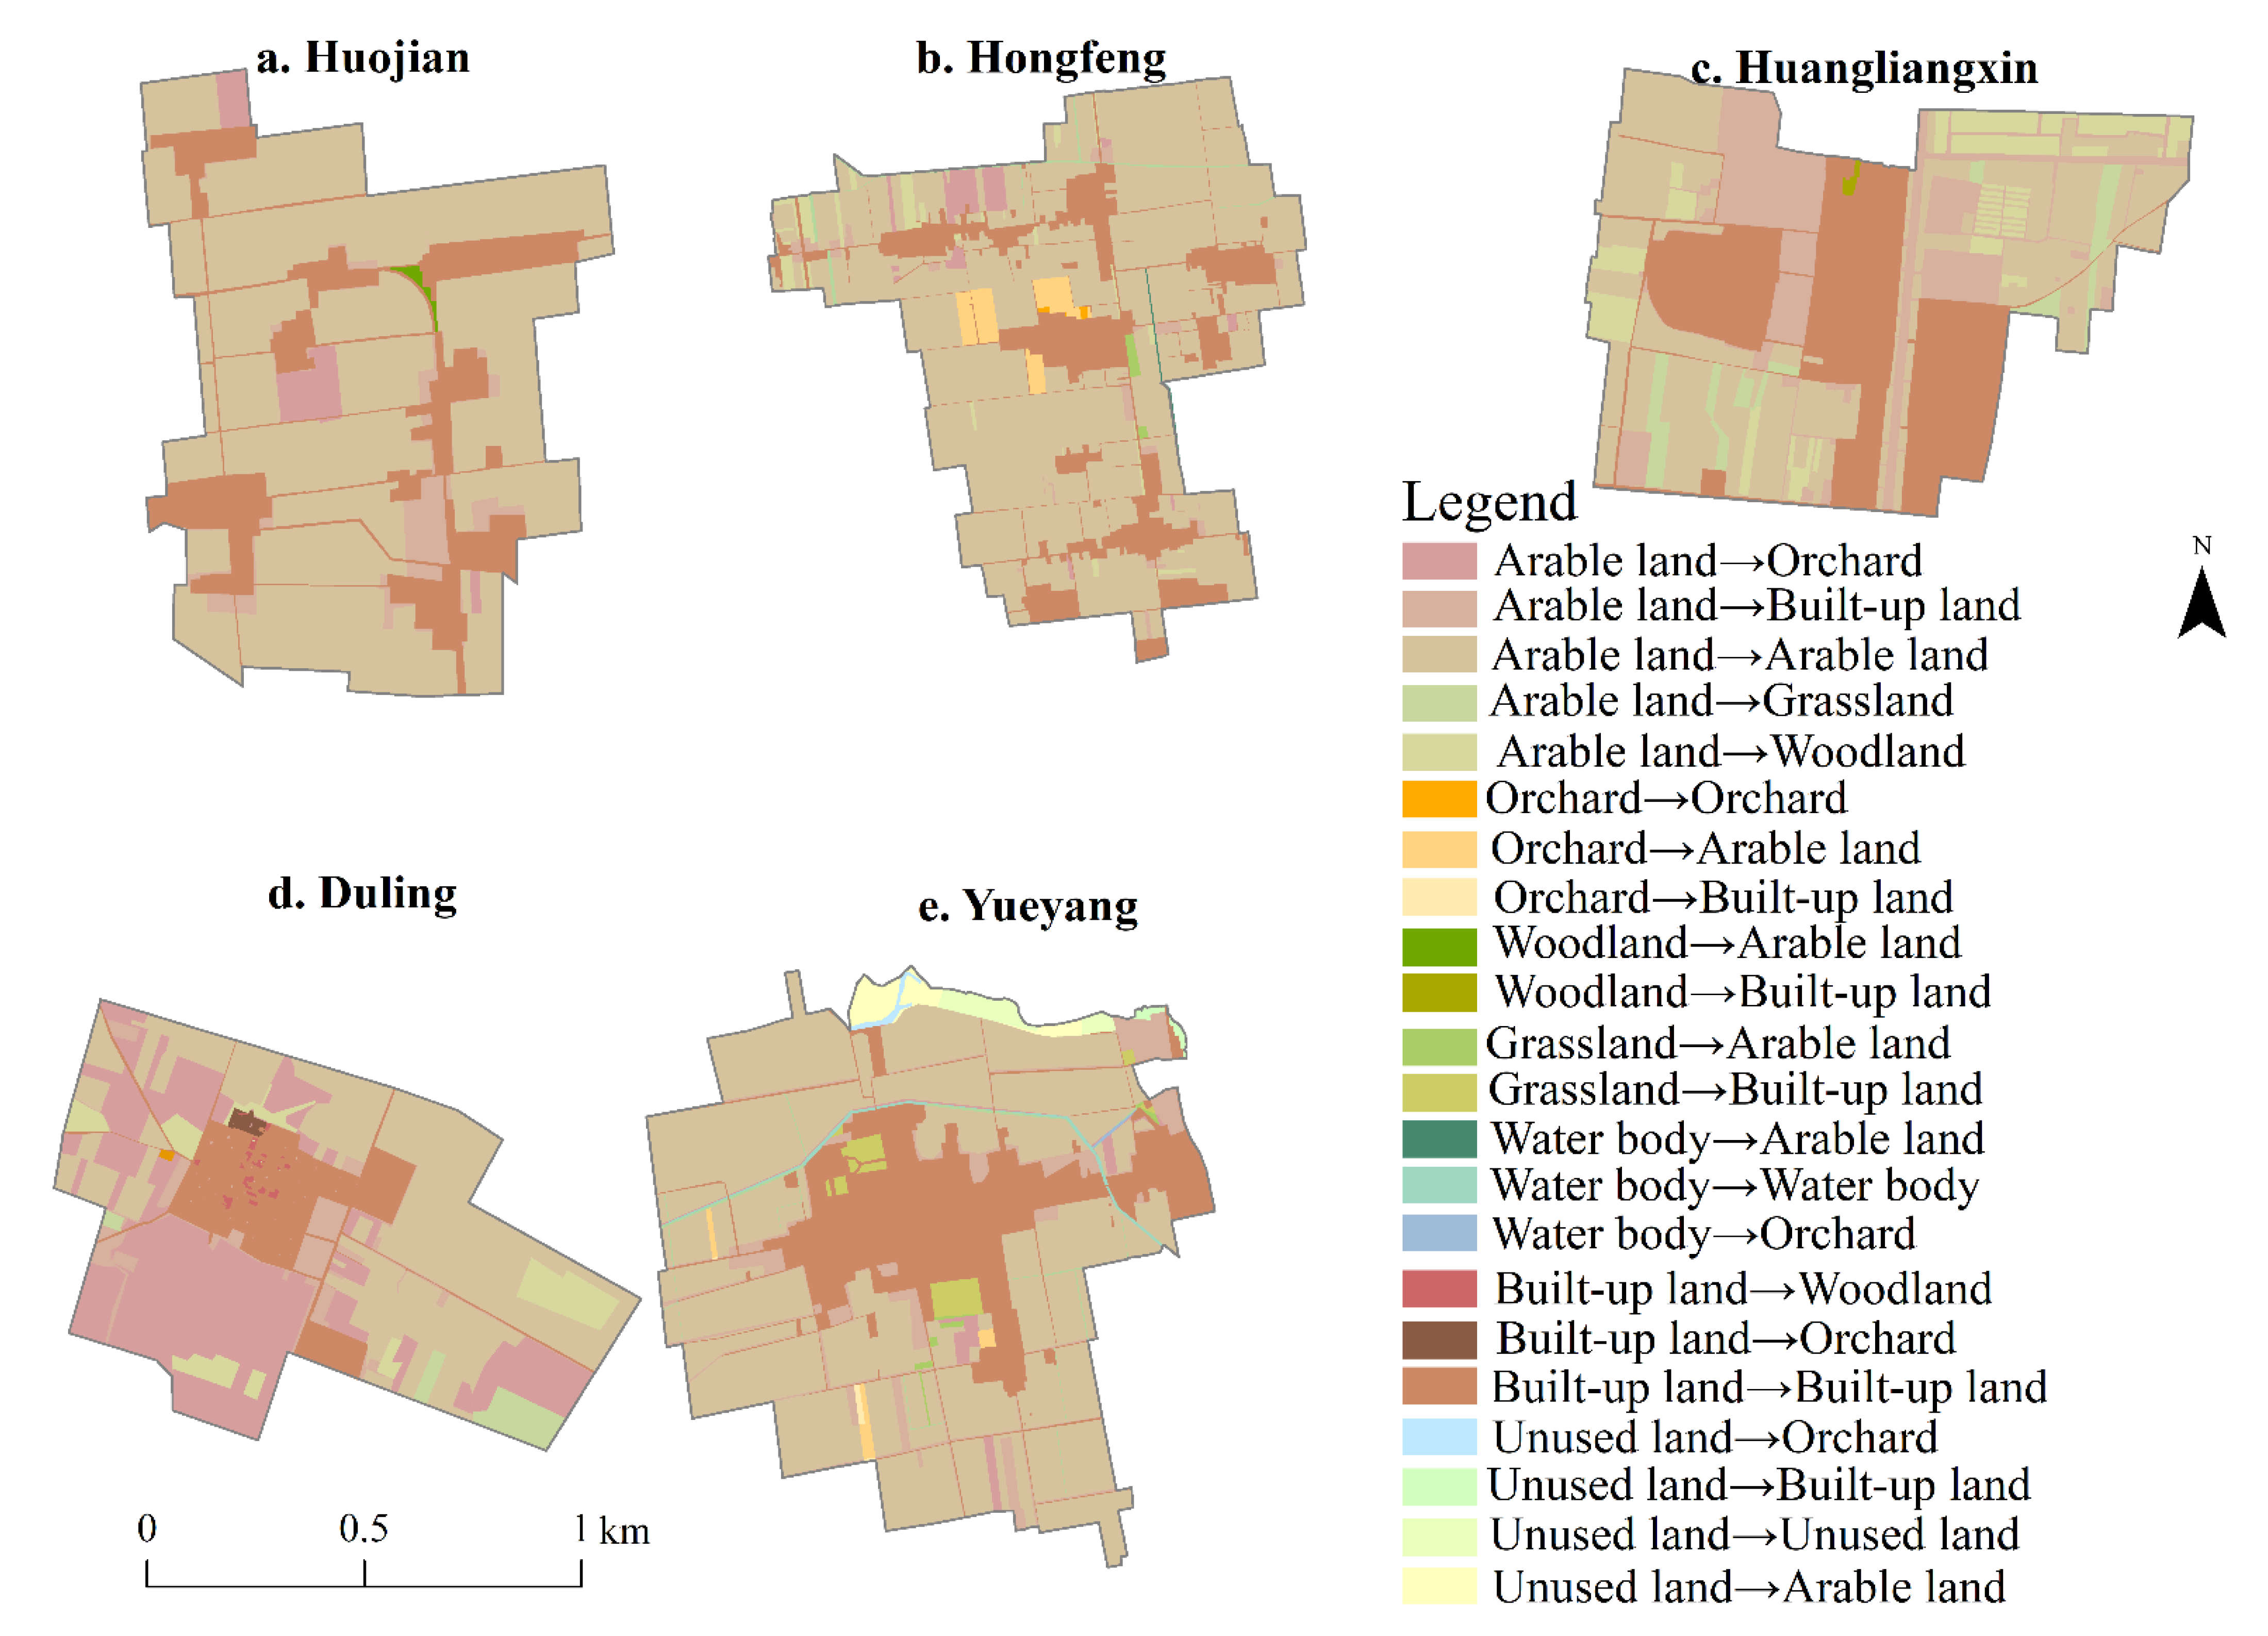
3.1.1. Changes to Agricultural Land Use
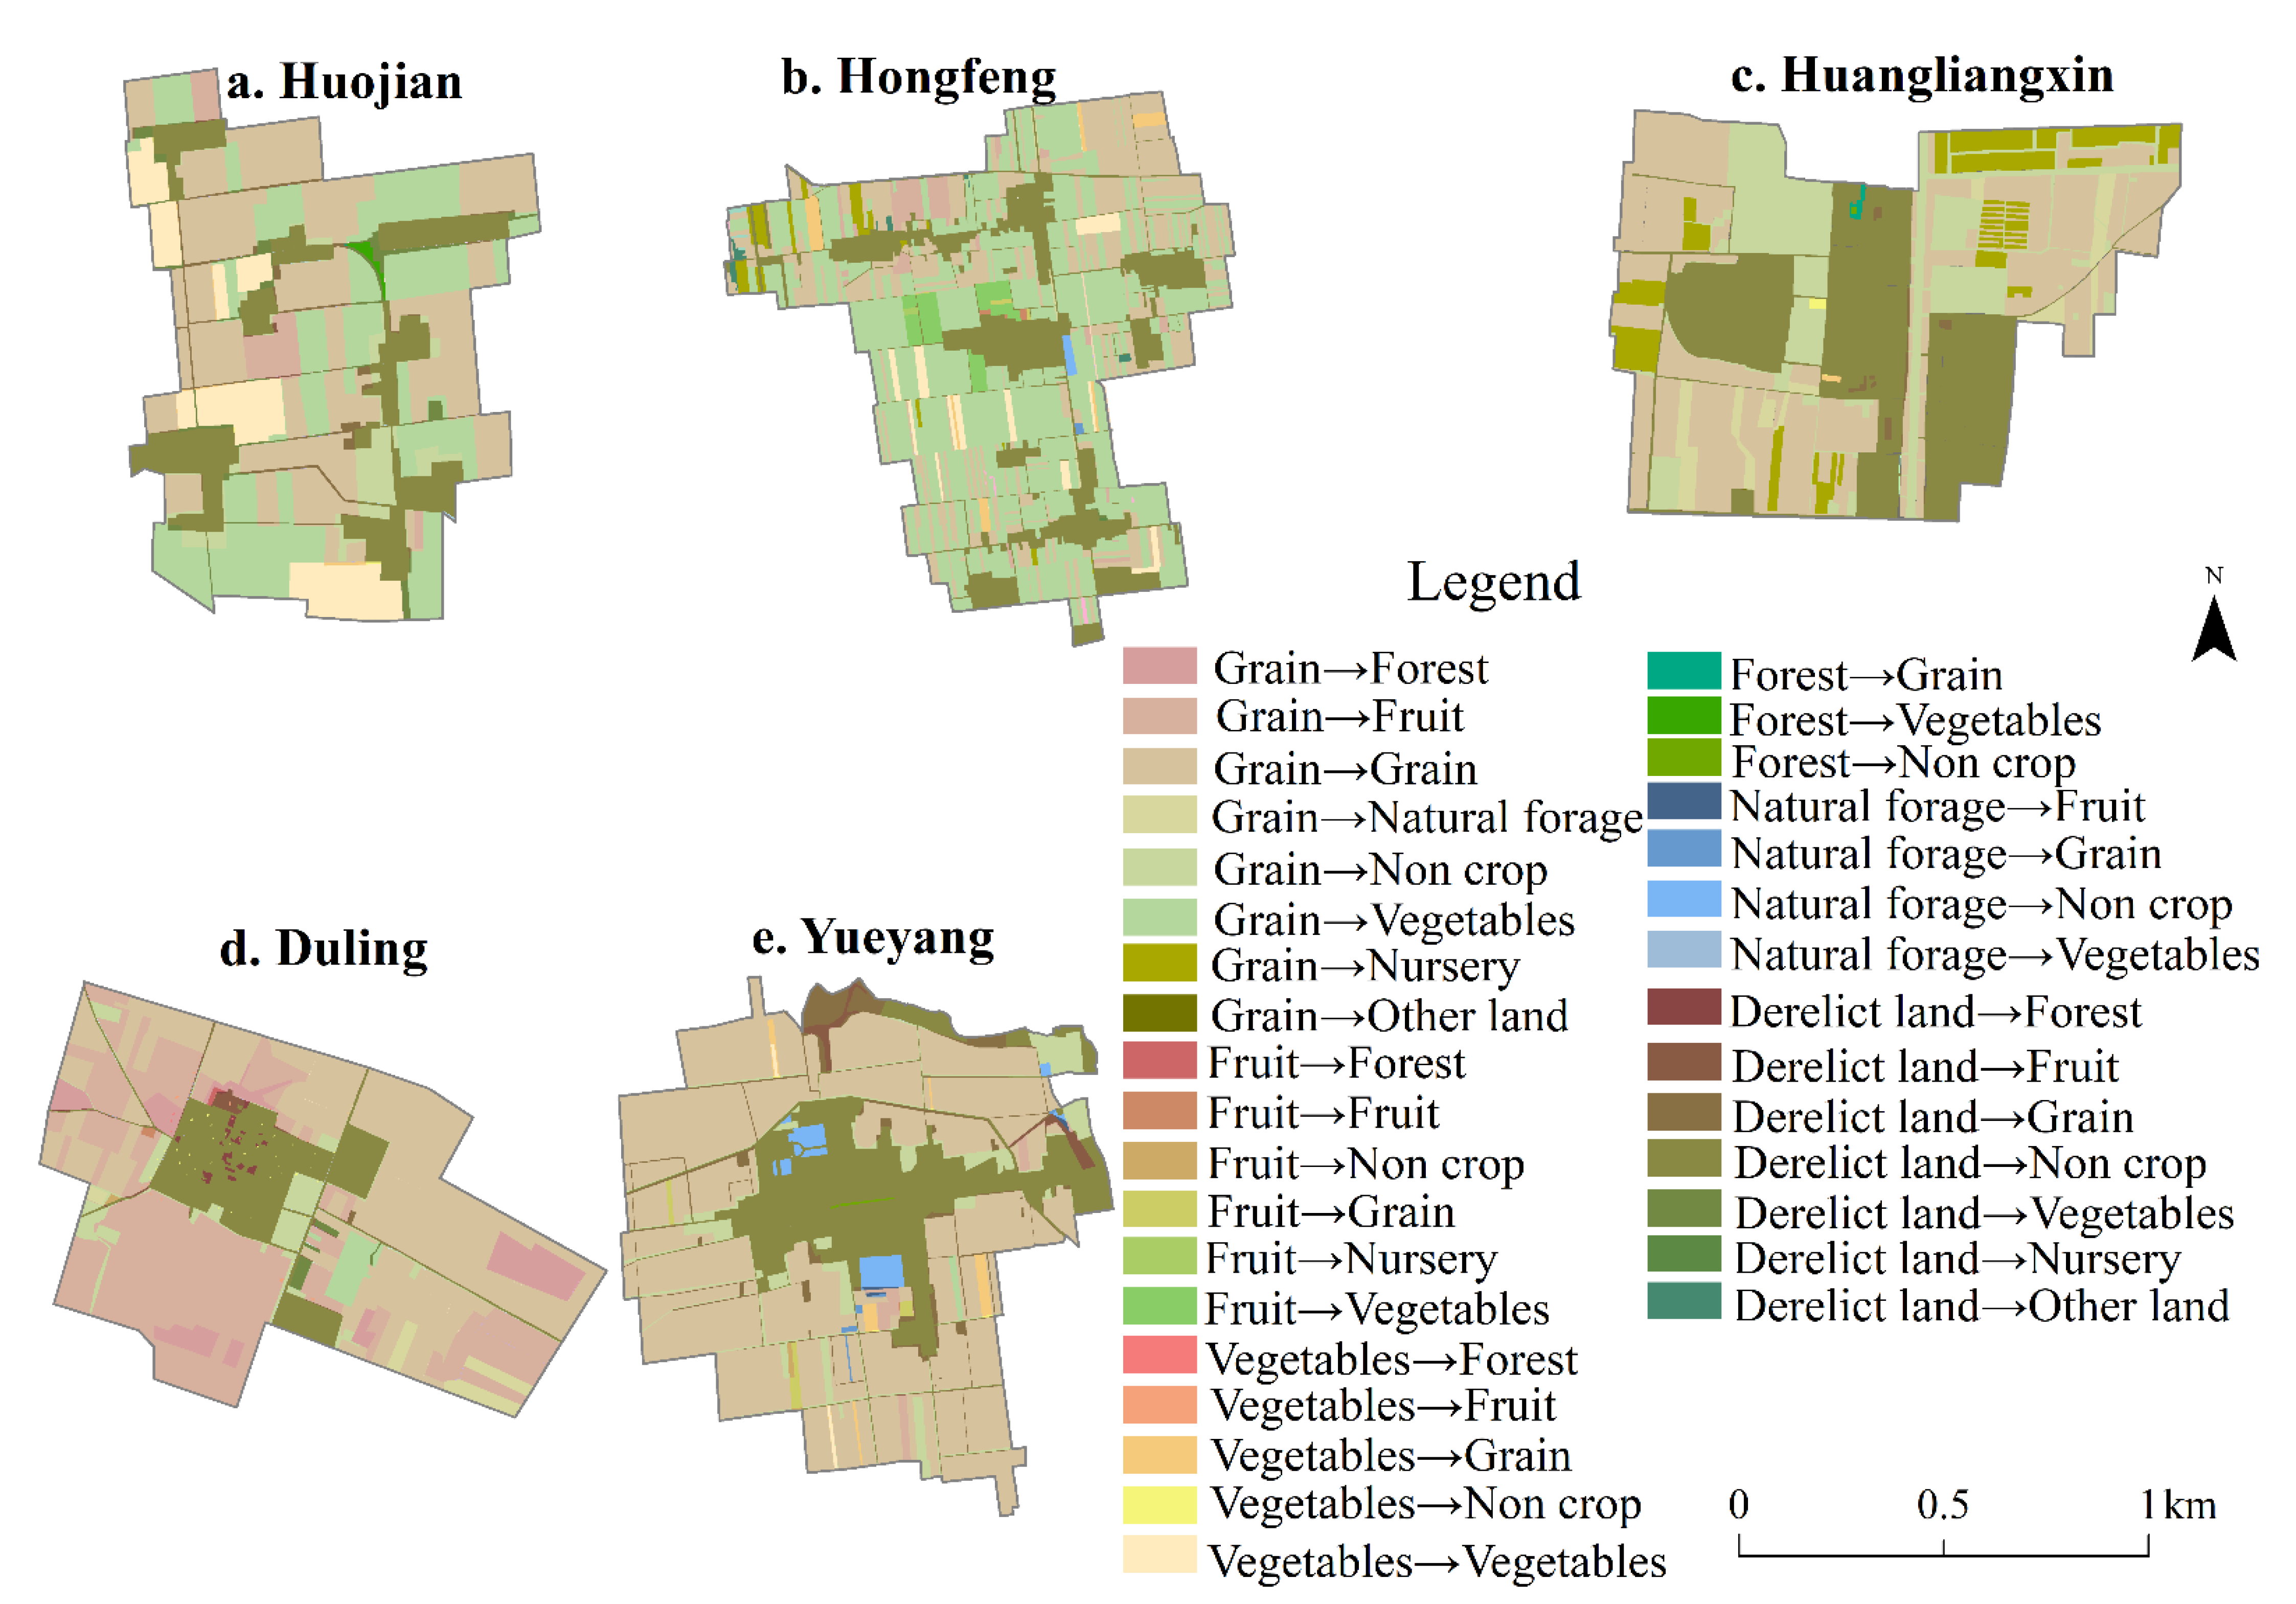
3.1.2. Changes of Agricultural Types
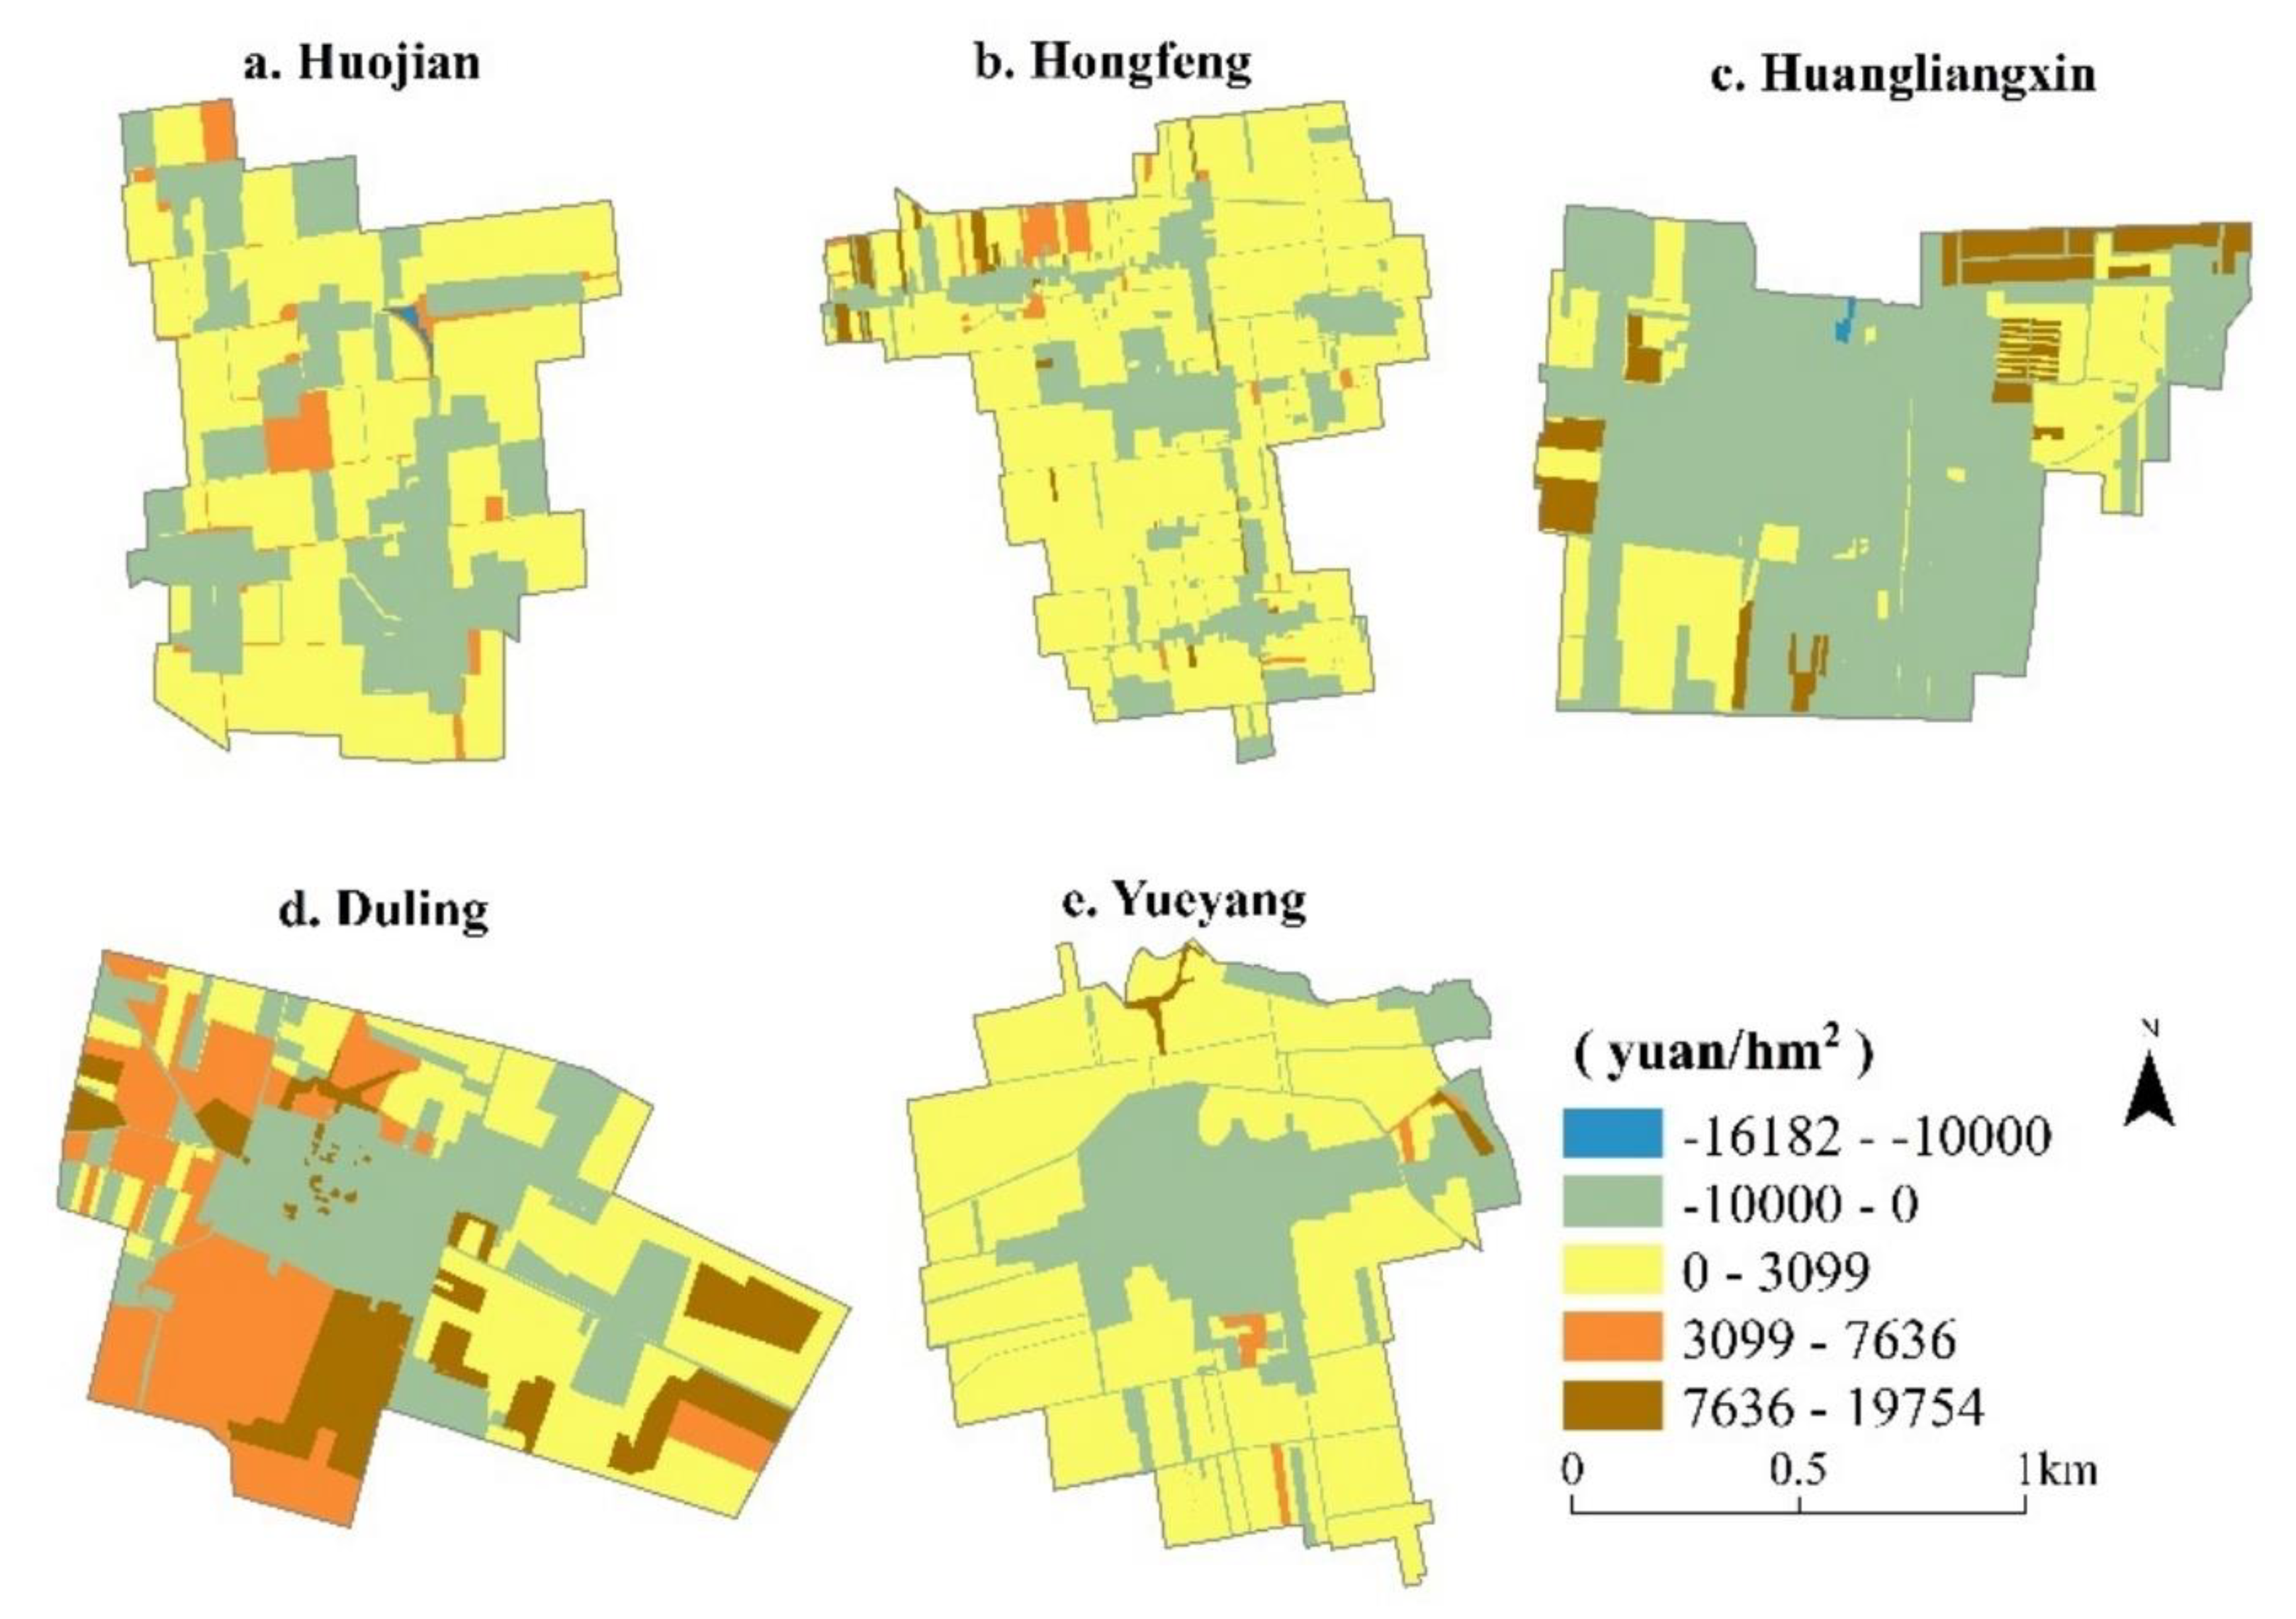
3.2. Changes to ES
3.3. Changes in Human Well-Being
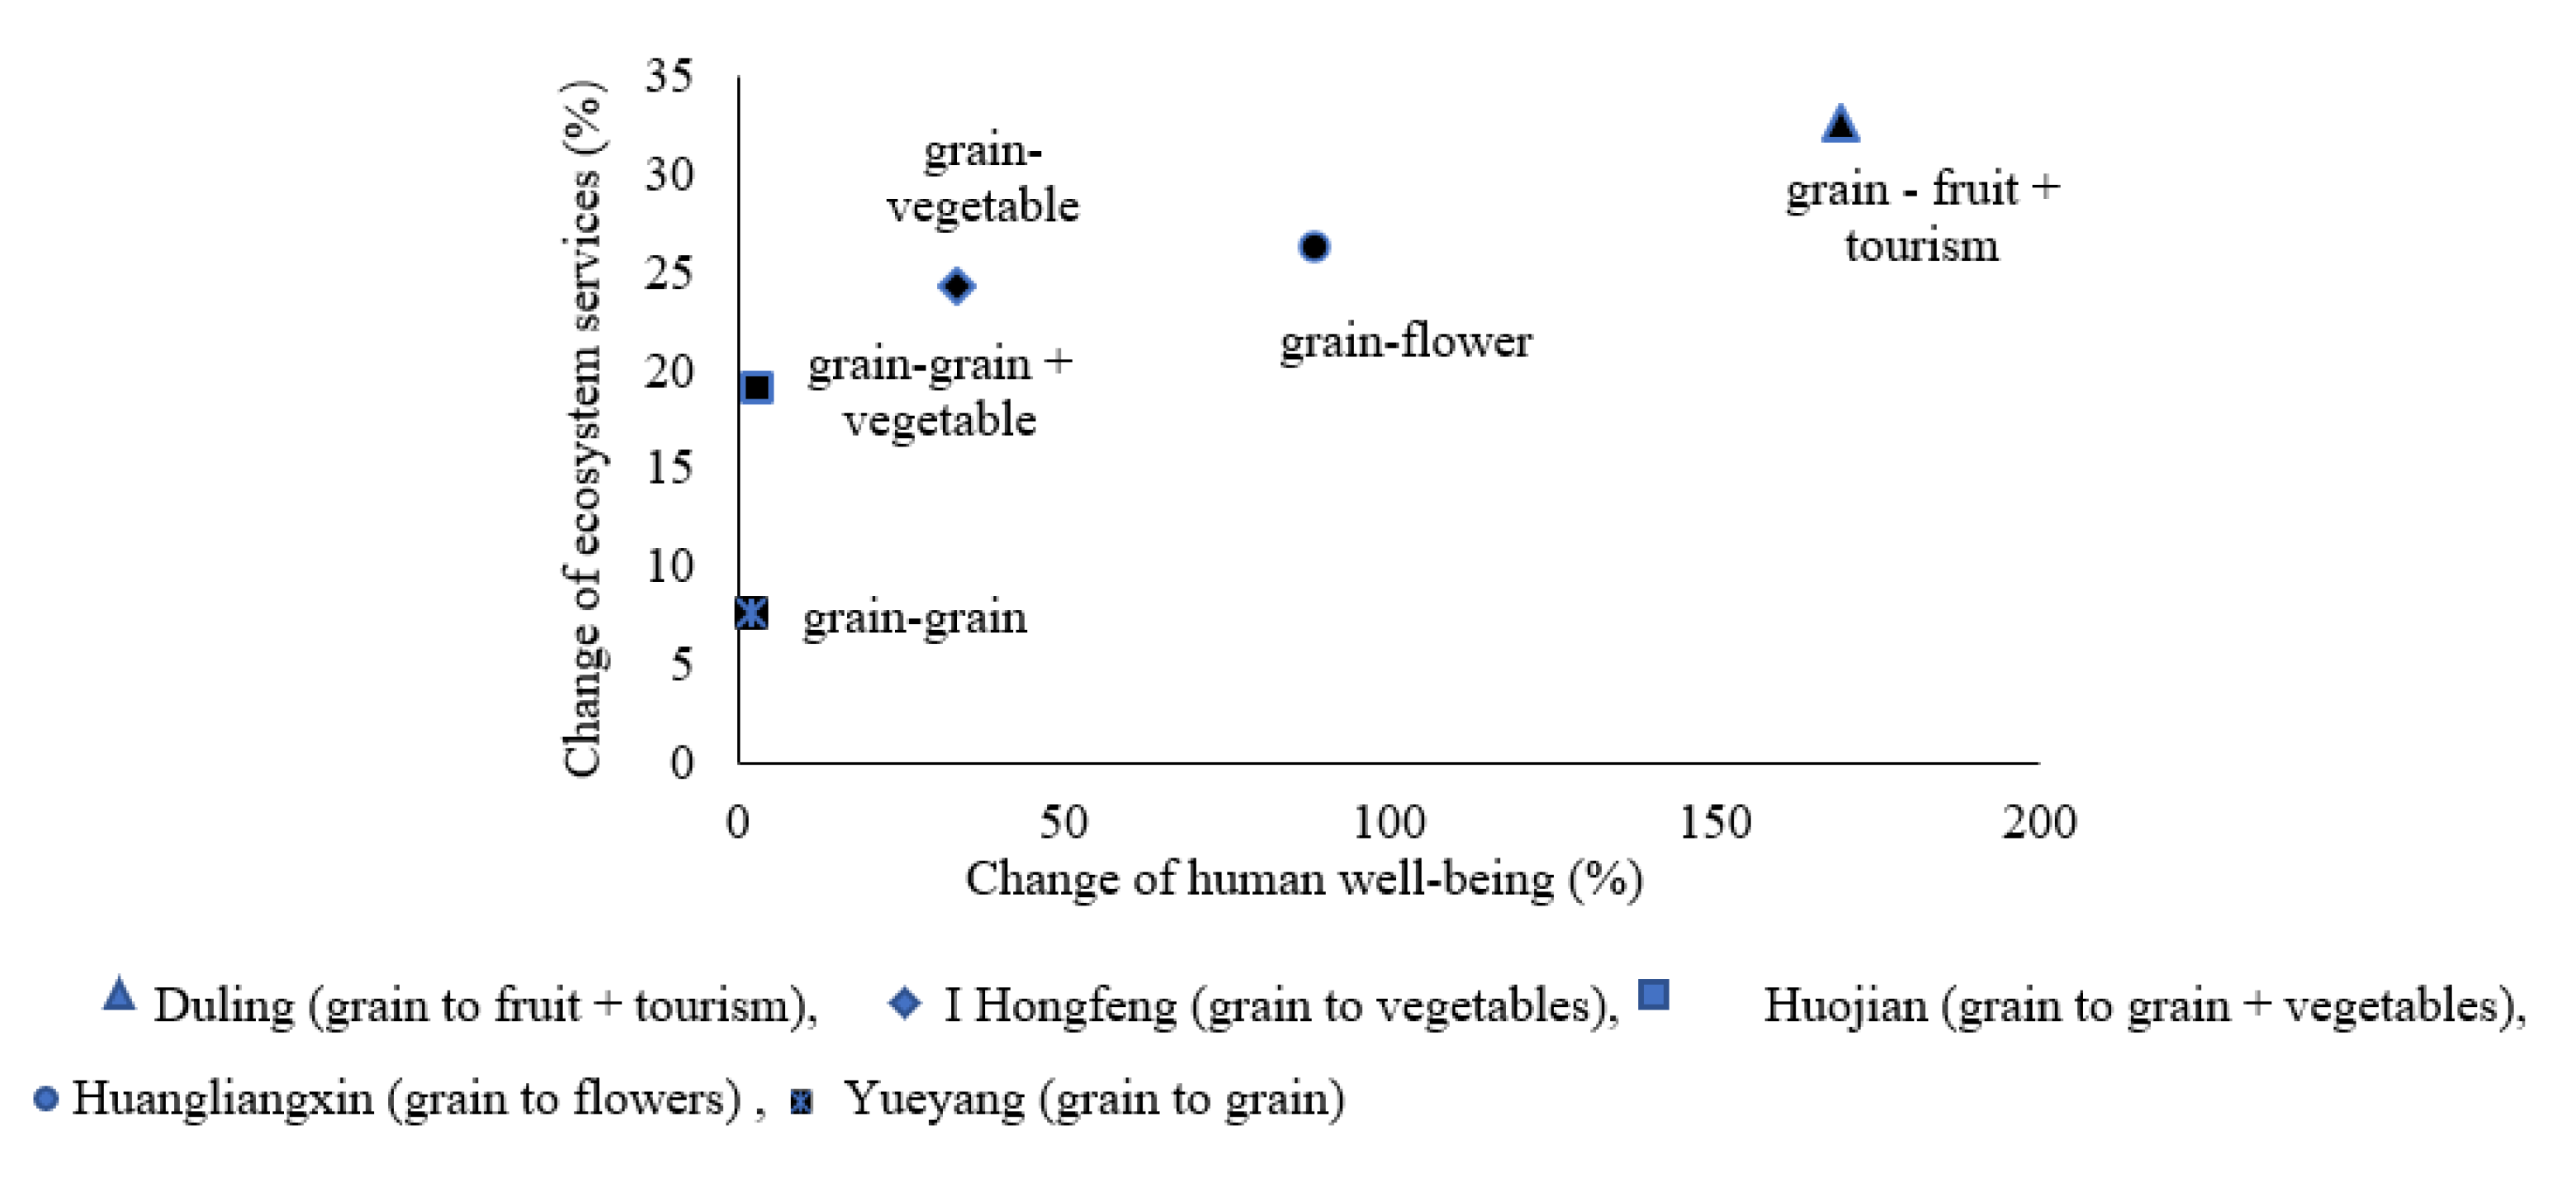
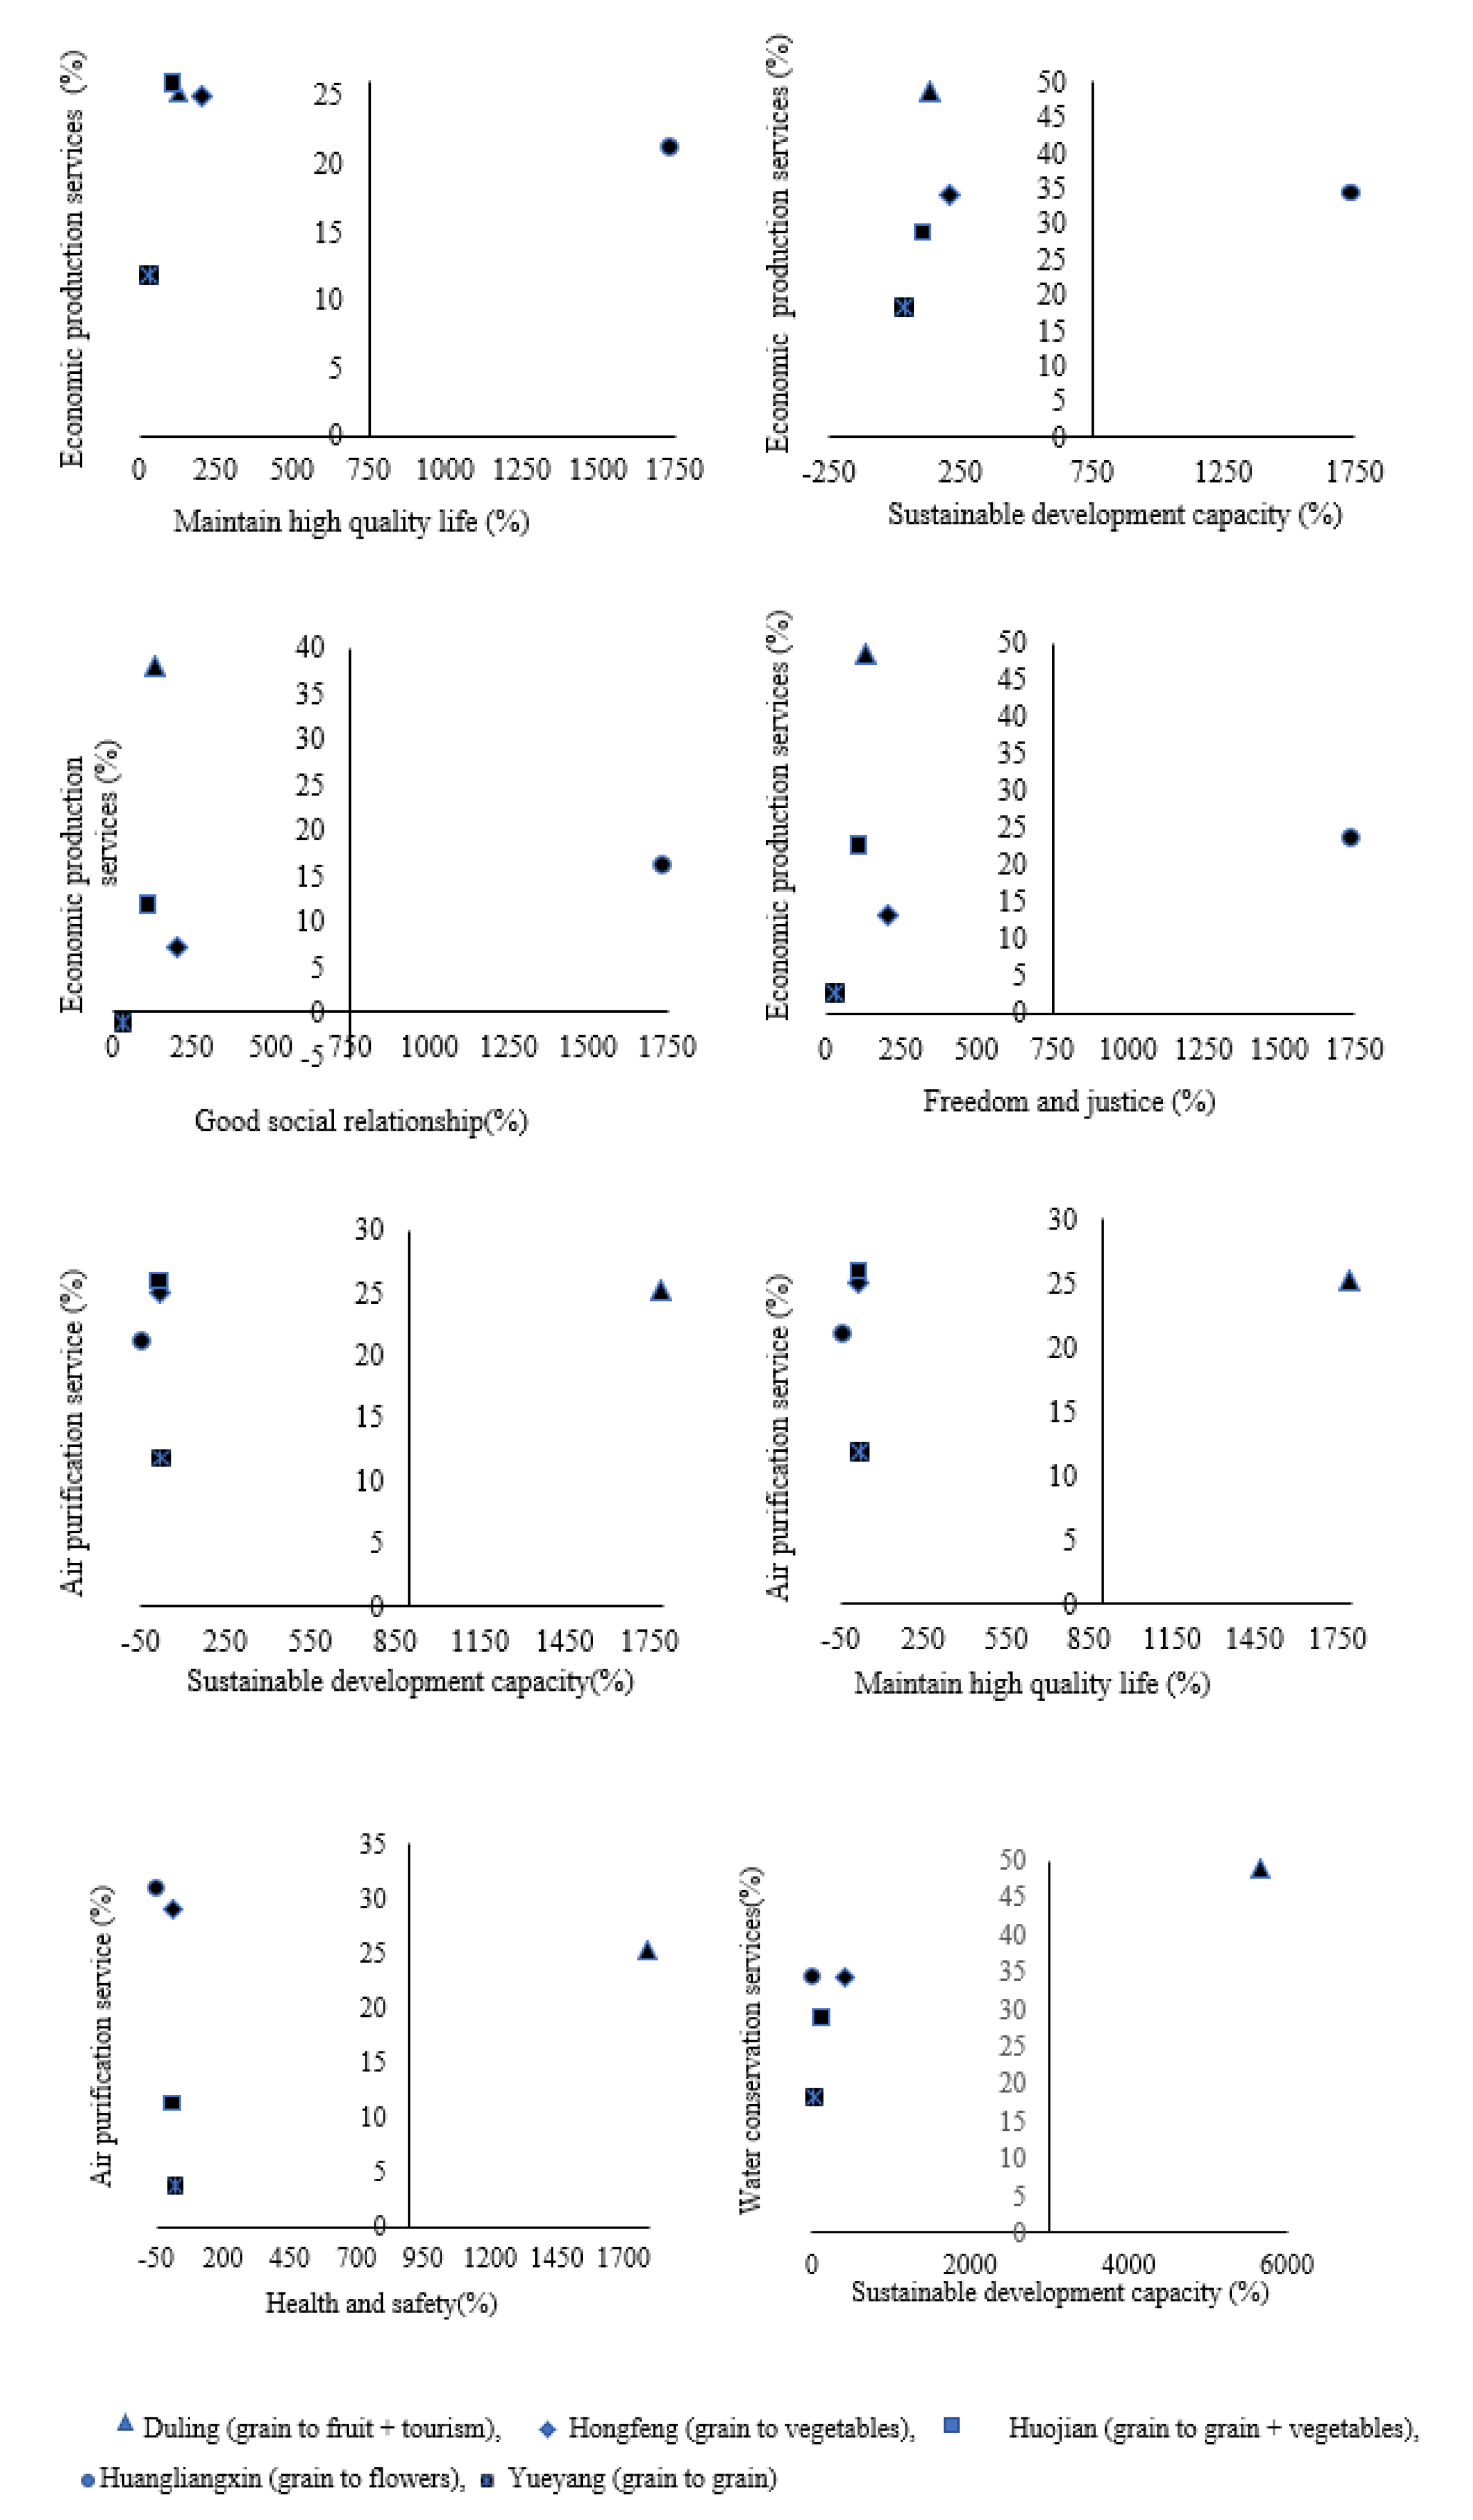
3.4. The Linkages between Ecosystem Services and Human Well-Being
4. Discussion and Conclusions
4.1. Discussion
4.2. Conclusions
- (1)
- Agricultural transition in the PUA of XMZ has involved a shift in the rural economy away from grain towards fruit and vegetables, with some additional involvement of farmers in tourism.
- (2)
- Agriculture has become more diverse and multifunctional, generating higher incomes as part of the moves away from grain but with a more fragmented landscape in which farmland is increasingly threatened by urban sprawl.
- (3)
- There are notable differences between our five sample villages based on the nature of their evolving specialisations. The transformation towards multifunctional agriculture increased the supply of ES, especially through the increase in tourism and leisure activities and economic-production services.
- (4)
- Increases in total ES were most closely associated with the introduction of orchards, vegetables and tourism. The combination of orchards and tourism also contributed most to improved human well-being in the five villages. This reflected both increased income to farm households and improvements in quality of life associated with better provision of schools, medical services, welfare provision and road links to the city.
Author Contributions
Funding
Institutional Review Board Statement
Informed Consent Statement
Data Availability Statement
Conflicts of Interest
References
- UN Habitat. World Cities Report 2020: The Value of Sustainable Urbanization; United Nations Human Settlements Programme (UN Habitat): Nairobi, Kenya, 2020. [Google Scholar]
- Artmann, M.; Sartison, K. The role of urban agriculture as a nature-based solution: A review for developing a systemic assessment framework. Sustainability 2018, 10, 1937. [Google Scholar] [CrossRef]
- Dadashpoor, H.; Malekzadeh, N. Driving factors of formation, development, and change of spatial structure in metropolitan areas: A systematic review. J. Urban Manag. 2020, 9, 286–297. [Google Scholar] [CrossRef]
- Seto, K.C.; Fragkias, M.; Güneralp, B.; Reilly, M.K. A meta-analysis of global urban land expansion. PLoS ONE 2011, 6, e23777. [Google Scholar] [CrossRef]
- d’Amour, C.B.; Reitsma, F.; Baiocchi, G.; Barthel, S.; Guneralp, B.; Erb, K.H.; Haberl, H.; Creutzig, F.; Seto, K.C. Future urban land expansion and implications for global croplands. Proc. Natl. Acad. Sci. USA 2017, 114, 8939–8944. [Google Scholar] [CrossRef]
- Solecka, I.; Sylla, M.; Świąder, M. Urban sprawl impact on farmland conversion in a suburban area of Wroclaw, Poland. IOP Conf. Ser. Mater. Sci. Eng. 2017, 245, 72002. [Google Scholar] [CrossRef]
- Inostroza, L.; Tábbita, J.H. Informal urban development in the Greater Buenos Aires area: A quantitative-spatial assessment based on households’ physical features using GIS and principal components analysis. Procedia Eng. 2016, 161, 2138–2146. [Google Scholar] [CrossRef][Green Version]
- Song, B.; Robinson, G.M.; Zhou, Z. Agricultural transformation and ecosystem services: A case study from Shaanxi Province, China. Habitat Int. 2017, 69, 114–125. [Google Scholar] [CrossRef]
- Su, S.; Wang, Y.; Luo, F.; Mai, G.C.; Pu, J. Peri-urban vegetated landscape pattern changes in relation to socioeconomic development. Ecol. Indic. 2014, 46, 477–486. [Google Scholar] [CrossRef]
- Zhou, Z.; Li, M. Spatial-temporal change in urban agricultural land use efficiency from the perspective of agricultural multi-functionality: A case study of the Xi’an metropolitan zone. J. Geogr. Sci. 2017, 27, 1499–1520. [Google Scholar] [CrossRef]
- Banos, A.; Abrantes, P.; Rocha, J.; Kristensen, S.B.P.; Busck, A. Agricultural land fragmentation analysis in a peri-urban context: From the past into the future. Ecol. Indic. 2019, 97, 380–388. [Google Scholar]
- Lee, Y.; Ahern, J.; Yeh, C.T. Ecosystem services in peri-urban landscapes: The effects of agricultural landscape change on ecosystem services in Taiwan’s western coastal plain. Landsc. Urban Plan. 2015, 139, 137–148. [Google Scholar] [CrossRef]
- James, S.W.; O’Neill, P.M. Planning for peri-urban agriculture: A geographically-specific, evidence-based approach from Sydney. Aust. Geogr. 2016, 47, 179–194. [Google Scholar] [CrossRef]
- Nicholls, E.; Ely, A.; Birkin, L.; Basu, P.; Goulson, D. The contribution of small-scale food production in urban areas to the sustainable development goals: A review and case study. Sustain. Sci. 2020, 15, 1585–1599. [Google Scholar] [CrossRef]
- Spyra, M.; Kleemann, J.; Furst, C. Protection of peri-urban open spaces at the level of regional policy-making: Examples from six European regions. Land Use Policy 2021, 107, 105480. [Google Scholar] [CrossRef]
- Elhadary, Y.A.E.; Samat, N.; Obeng-Odoom, F. Development at the peri-urban area and its impact on agricultural activities: An example from the Seberang Perai region, Penang State. Agroecol. Sustain. Food Syst. 2013, 37, 834–856. [Google Scholar] [CrossRef]
- Yu, D.; Wang, D.Y.; Zhou, Y.H. Decreased landscape ecological security of peri-urban cultivated land following rapid urbanization: An impediment to sustainable agriculture. Sustainability 2018, 10, 394. [Google Scholar] [CrossRef]
- Dadashpoor, H.; Ahanib, S. Land tenure-related conflicts in peri-urban areas: A review. Land Use Policy 2019, 85, 218–229. [Google Scholar] [CrossRef]
- Hedblom, M.; Andersson, E.; Borgström, S. Flexible land-use and undefined governance: From threats to potentials in peri-urban landscape planning. Land Use Policy 2017, 63, 523–527. [Google Scholar] [CrossRef]
- Gullino, P.; Battisti, L.; Larcher, F. Linking multifunctionality and sustainability for valuing peri-urban farming: A case study in the Turin Metropolitan Area (Italy). Sustainability 2018, 10, 1625. [Google Scholar] [CrossRef]
- Long, H.; Zou, J.; Li, T. Study on the characteristics and territorial types of rural transformation development: The case of “Southern Jiangsu-Northern Shaanxi” transect. Geogr. Res. 2012, 31, 495–506. [Google Scholar]
- Robinson, G.M.; Song, B. Transforming the peri-urban fringe in China: The example of Xi’an-Xianyang. Sustainability 2018, 10, 3932. [Google Scholar] [CrossRef]
- Vandercasteelen, J.; Beyene, S.; Minten, B.; Swinnen, J. Cities and agricultural transformation in Africa: Evidence from Ethiopia. World Dev. 2018, 105, 383–399. [Google Scholar] [CrossRef]
- Ustaoglu, E.; Williams, B. Determinants of urban expansion and agricultural land conversion in 25 EU countries. Environ. Manag. 2017, 60, 717–746. [Google Scholar] [CrossRef]
- Wadduwage, S. Drivers of peri-urban farmers’ land-use decisions: An analysis of factors and characteristics. J. Land Use Sci. 2021, 16, 273–290. [Google Scholar] [CrossRef]
- Thanh, B.N.; Le, V.; Minh, N.A.; Nguyen, M.N.; Trung, N.H. Drivers of agricultural transformation in the coastal areas of the Vietnamese Mekong Delta. Environ. Sci. Policy 2021, 122, 49–58. [Google Scholar] [CrossRef]
- Yang, Z.; Hao, P.; Liu, W.; Cai, J. Peri-urban agricultural development in Beijing: Varied forms, innovative practices and policy implications. Habitat Int. 2016, 56, 222–234. [Google Scholar] [CrossRef]
- Ayele, A.; Tarekegn, K. The impact of urbanization expansion on agricultural land in Ethiopia: A review. Environ. Socio-Econ. Stud. 2020, 8, 73–80. [Google Scholar] [CrossRef]
- Mallinis, G.; Koutsias, N.; Arianoutsou, M. Monitoring land use/land cover transformations from 1945 to 2007 in two peri-urban mountainous areas of Athens metropolitan area, Greece. Sci. Total Environ. 2014, 490, 262–278. [Google Scholar] [CrossRef]
- Ouyang, Z.; Wang, R. Ecosystem services and their economic valuation. World Sci-Tech. R D 2000, 5, 1006–6055. [Google Scholar]
- Paul, S.; Saxena, K.G.; Nagendra, H.; Lele, N. Tracing land use and land cover change in peri-urban Delhi, India, over 1973–2017 period. Environ. Monit. Assess. 2021, 193, 52. [Google Scholar] [CrossRef] [PubMed]
- Ashiagbor, G.; Amoako, C.; Asabere, S.B.; Quaye-Ballard, J.A. Landscape transformations in rapidly developing peri-urban areas of Accra, Ghana: Results of 30 years. Open Geosci. 2019, 11, 172–182. [Google Scholar] [CrossRef]
- Perez-Campana, R.; Valenzuela-Montes, L.M. Nodes of a peri-urban agricultural landscape at local level: An interpretation of their contribution to the eco-structure. J. Environ. Plan. Manag. 2018, 61, 406–429. [Google Scholar] [CrossRef]
- Pribadi, D.; Pauleit, S. The dynamics of peri-urban agriculture during rapid urbanization of Jabodetabek Metropolitan Area. Land Use Policy 2015, 48, 13–24. [Google Scholar] [CrossRef]
- Dadashpoor, H.; Ahani, S. Explaining objective forces, driving forces, and causal mechanisms affecting the formation and expansion of the peri-urban areas: A critical realism approach. Land Use Policy 2021, 102, 105232. [Google Scholar] [CrossRef]
- Perez-Belmont, P.; Lerner, A.; Mazari-Hiriart, M.; Valiente, E. The survival of agriculture on the edge: Perceptions of push and pull factors for the persistence of the ancient chinampas of Xochimilco, Mexico City. J. Rural Stud. 2021, 86, 452–462. [Google Scholar] [CrossRef]
- Bogunovic, I.; Viduka, A.; Magdic, I.; Telak, L.J.; Francos, M.; Pereira, P. Agricultural and forest land-use impact on soil properties in Zagreb Periurban Area (Croatia). Agron. J. 2020, 10, 1331. [Google Scholar] [CrossRef]
- Calzolari, C.; Tarocco, P.; Lombardo, N.; Marchi, N.; Ungaro, F. Assessing soil ecosystem services in urban and peri-urban areas: From urban soils survey to providing support tool for urban planning. Land Use Policy 2020, 99, 105037. [Google Scholar] [CrossRef]
- Huang, S.; Chen, Y.; Kuo, F.; Wang, S. Emergy-based evaluation of peri-urban ecosystem services. Ecol. Complex. 2011, 8, 38–50. [Google Scholar] [CrossRef]
- Rigby, D.; Woodhouse, P.; Young, T. Constructing a farm level indicator of sustainable agricultural practice. Ecol. Econ. 2001, 39, 463–478. [Google Scholar] [CrossRef]
- Boody, G.; Vondracek, B.; Andow, D.A.; Krinke, M.; Westra, J.; Zimmerman, J.; Welle, P. Multifunctional agriculture in the United States. Bioscience 2005, 55, 27–38. [Google Scholar] [CrossRef]
- Song, B.; Robinson, G.M. Multifunctional agriculture: Policies and implementation in China. Geogr. Compass. 2020, 14, e12538. [Google Scholar] [CrossRef]
- Zhou, T.; Vermaat, J.E.; Ke, X. Variability of agroecosystems and landscape service provision on the urban-rural fringe of Wuhan, Central China. Urban Ecosyst. 2019, 22, 1207–1214. [Google Scholar] [CrossRef]
- Russo, A.; Escobedo, F.J.; Cirella, G.T.; Zerbe, S. Edible green infrastructure: An approach and review of provisioning ecosystem services and disservices in urban environments. Agric. Ecosyst. Environ. 2017, 242, 53–66. [Google Scholar] [CrossRef]
- Swinton, S.M.; Lupi, F.; Robertson, G.P.; Hamilton, S.K. Ecosystem services and agriculture: Cultivating agricultural ecosystems for diverse benefits. Ecol. Econ. 2007, 64, 245–252. [Google Scholar] [CrossRef]
- Zhang, W.; Ricketts, T.; Kremen, C.; Carney, K.; Swinton, S. Ecosystem services and dis-services to agriculture. Ecol. Econ. 2007, 64, 253–260. [Google Scholar] [CrossRef]
- Islam, G.; Islam, A.; Shopan, A.A.; Rahman, M.; Lazar, A.; Mukhopadhyay, A. Implications of agricultural land use change to ecosystem services in the Ganges delta. J. Environ. Manag. 2015, 161, 443–452. [Google Scholar] [CrossRef] [PubMed]
- Stenchly; Waongo, A.; Schaeper, W.; Nyarko, G.; Buerkert, A. Structural landscape changes in urban and peri-urban agricultural systems of two West African cities and their relations to ecosystem services provided by woody plant communities. Urban Ecosyst. 2019, 22, 397–408. [Google Scholar] [CrossRef]
- Torquati, B.; Giacchè, G.; Tempesta, T. Landscapes and services in peri-urban areas and choice of housing location: An application of discrete choice experiments. Land 2020, 9, 393. [Google Scholar] [CrossRef]
- Cui, J.; Yan, P.; Wang, X.; Yang, J.; Li, Z.; Yang, X.; Sui, P.; Chen, Y. Integrated assessment of economic and environmental consequences of shifting cropping system from wheat-maize to mono-cropped maize in the North China Plain. J. Clean. Prod. 2018, 193, 524–532. [Google Scholar] [CrossRef]
- Zhou, Z.X.; Robinson, G.M.; Song, B.J. Experimental research on trade-offs in ecosystem services: The agro-ecosystem functional spectrum. Ecol. Indic. 2019, 106, 105536. [Google Scholar] [CrossRef]
- Chakraborty, S.; Avtar, R.; Raj, R.; Minh, H. Village level provisioning ecosystem services and their values to local communities in the peri-urban areas of Manila, The Philippines. Land 2019, 8, 177. [Google Scholar] [CrossRef]
- Manners, R.; Varela-Ortega, C. The role of decision-making in ecosystem service trade-offs in lowland Bolivia’s Amazonian agricultural systems. Ecol. Econ. 2018, 153, 31–42. [Google Scholar] [CrossRef]
- Montoya, D.; Haegeman, B.; Loreau, M. Trade-offs in the provisioning and stability of ecosystem services in agroecosystems. Ecol. Appl. 2019, 29, e01853. [Google Scholar] [CrossRef] [PubMed]
- Christopher, D.; Kendal, D. Values and attitudes of the urban public towards peri-urban agricultural land. Land Use Policy 2013, 34, 80–90. [Google Scholar] [CrossRef]
- Reng, T.; Zhou, Z. Influence of agricultural structure transformation on ecosystem services and human well-being: Case study in Xi’an metropolitan area. Acta Ecol. Sin. 2019, 37, 2353–2365. [Google Scholar]
- Pili, S.; Grigoriadis, E.; Carlucci, M.; Clemente, M.; Salvati, L. Towards sustainable growth? A multi-criteria assessment of (changing) urban forms. Ecol. Indic. 2017, 76, 71–80. [Google Scholar] [CrossRef]
- Dadashpoor, H.; Azizi, P.; Moghadasi, M. Analyzing spatial patterns, driving forces, and predicting future growth scenarios for supporting sustainable urban growth: Evidence from Tabriz metropolitan area, Iran. Sustain. Cities Soc. 2019, 47, 101502. [Google Scholar] [CrossRef]
- Langemeyer, J.; Madrid-Lopez, C.; Mendez, G.V. Urban agriculture—A necessary pathway towards urban resilience and global sustainability? Landsc. Urban Plan. 2021, 210, 104055. [Google Scholar] [CrossRef]
- Rolf, W.; Diehl, K.; Zasada, I.; Wiggering, H. Integrating farmland in urban green infrastructure planning. An evidence-based synthesis for informed policymaking. Land Use Policy 2020, 99, 104823. [Google Scholar] [CrossRef]
- Viana, C.M.; Freire, D.; Abrantes, P.; Rocha, J.; Pereira, P. Agricultural land systems importance for supporting food security and sustainable development goals: A systematic review. Sci. Total Environ. 2021, 806, 150718. [Google Scholar] [CrossRef]
- Zhang, B.; Zhou, Z. Impact of land use change on agro-ecosystem services in Qinba Mountain area: A case study of Hanzhong Basin. J. Shaanxi Norm. Univ. 2020, 48, 21–31. [Google Scholar]
- Li, M.; Zhou, Z. Positive and negative ecosystem services evaluation and its spatial pattern analysis on urban landscape: A case study of Xi’an City. Acta Geogr. Sinica 2016, 71, 1215–1230. [Google Scholar]
- Reid, W.V.; Mooney, H.A.; Cropper, A. Millennium Ecosystem Assessment. Ecosystems and Human Well-Being: Synthesis; Island Press: Washington, DC, USA, 2005. [Google Scholar]
- Hu, Z.; Yang, X.; Yang, J.; Yuan, J.; Zhang, Z. Linking landscape pattern, ecosystem service value, and human well-being in Xishuangbanna, southwest China: Insights from a coupling coordination model. Glob. Ecol. Conserv. 2021, 27, 1583. [Google Scholar] [CrossRef]
- Liu, L.; Wu, J. Ecosystem services-human wellbeing relationships vary with spatial scales and indicators: The case of China. Res. Conserv. Recycl. 2021, 172, 105662. [Google Scholar] [CrossRef]
- Schultner, J.; Dorresteijn, I.; Manlosa, A.; Wehrden, H.; Hylander, K.; Senbeta, F.; Fischer, J. Ecosystem services from forest and farmland: Present and past access separates beneficiaries in rural Ethiopia. Ecosyst. Serv. 2021, 48, 101263. [Google Scholar] [CrossRef]
- Wheeler, R.; Lobley, M. Managing extreme weather and climate change in UK agriculture: Impacts, attitudes and action among farmers and stakeholders. Clim. Risk Manag. 2021, 32, 100313. [Google Scholar] [CrossRef]
- Verhagen, W.; van der Zanden, E.H.; Strauch, M.; van Teeffelen, A.J.; Verburg, P.H. Optimizing the allocation of agri-environment measures to navigate the trade-offs between ecosystem services, biodiversity and agricultural production. Environ. Sci. Policy 2018, 84, 186–196. [Google Scholar] [CrossRef]
- Chami, E.; Daccache, A.; Moujabber, M. What are the impacts of sugarcane production on ecosystem services and human well-being? A review. Ann. Agric. Sci. 2020, 65, 188–199. [Google Scholar] [CrossRef]
- Fisher, C.; Gayer, C.; Kurucz, K.; Riesch, F.; Tscharntke, T.; Batáry, P. Ecosystem services and disservices provided by small rodents in arable fields: Effects of local and landscape management. J. Appl. Ecol. 2017, 55, 548–558. [Google Scholar] [CrossRef]
- Murray, I.; Jover-Avella, G.; Fullana, O.; Tello, E. Biocultural heritages in Mallorca: Explaining the resilience of peasant landscapes within a Mediterranean Tourist Hotspot, 1870–2016. Sustainability 2019, 11, 1926. [Google Scholar] [CrossRef]
- Montanaro, G.; Xiloyannis, C.; Nuzzo, V.; Dichio, B. Orchard management, soil organic carbon and ecosystem services in Mediterranean fruit tree crops. Sci. Hortic. 2017, 217, 92–101. [Google Scholar] [CrossRef]
- Aubry, C.; Manouchehri, N. Urban agriculture and health: Assessing risks and overseeing practices. J. Field Actions 2019, 20, 108–111. [Google Scholar]
- Sroka, W.; Bojarszczuk, J.; Satoła, L.; Szczepanska, B.; Sulewski, P.; Lisek, S.; Luty, L.; Zioło, M. Understanding residents’ acceptance of professional urban and peri-urban farming: A socio-economic study in Polish metropolitan areas. Land Use Policy 2021, 109, 105599. [Google Scholar] [CrossRef]


| Village | Population | Land Area (ha) | Agricultural Land (ha) | Agricultural Income as a % of Household Income | Agricultural Transformation Process |
|---|---|---|---|---|---|
| Huangliangxin | 2648 | 118.9 | 103.3 | 80 | Around 1990, wheat and corn were planted as the main crops (accounting for more than 90% of farmland). Vegetables have been introduced since 2000, with flowers grown from 2015. In 2020, the crops mainly comprised grain and flowers. |
| Yueyang | 3000 | 419.4 | 286.7 | 80 | Since the 1990s, grain has been planted continuously. Grain dominates the farmland (96% share of total farmland), with just a small amount of vegetables and trees. |
| Duling | 1520 | 75.6 | 57.3 | 45 | Before 1990, wheat, corn and other grain crops were dominant. After 1990, there was a gradual shifting to cherries and grapevines. Together with surrounding villages, a cherry-picking leisure park was created, with an associated tourism businesses. In 2016, Bailucang tourist village and scenic spots were established, and tourism recreation services expanded. Agriculture is dominated by fruit and tourism. |
| Hongfeng | 3614 | 784.3 | 391.9 | 55 | Around 2000, grain crops (wheat, corn) accounted for 99% of farmland. In 2005, a rotation of vegetables and grains was apparent. In 2010, more than 50% of farmland was planted with a variety of vegetables. After 2015, the area under grain gradually decreased with further shifts to vegetables and land mainly planted with cabbages and organic cauliflowers. |
| Huojian | 4962 | 420.7 | 353.3 | 60 | Before 2000, wheat and corn occupied nearly all farmland. After 2010, some farmers began to grow vegetables, seedlings, flowers and other crops, and there was a flower estate created, engaging in tourism. At present, agriculture is equally dominated by grain and vegetable crops. |
| Dimension | Items | Indicators | Weights |
|---|---|---|---|
| Maintain a high quality of life | Income | Agricultural income (103 yuan) | 0.0332 |
| Agricultural resource supply | 0.0334 | ||
| Farmer occupation | Occupation satisfaction | 0.0332 | |
| Allowance policy | Agricultural allowance satisfaction | 0.0332 | |
| Subsistence resource | Domestic water security | 0.0333 | |
| Fuel and its supply | 0.0333 | ||
| Cultural leisure | Cultural facilities and services | 0.0334 | |
| Cultural and entertainment | 0.0332 | ||
| Social security | Social security | 0.0333 | |
| Health and safety | Physical health | Convenience to seek medical treatment | 0.0333 |
| Life expectancy | 0.0335 | ||
| Mental health | Psychological pressure | 0.0327 | |
| Agricultural security | Risk of agricultural practice | 0.0332 | |
| Living safety | Water quality | 0.0334 | |
| Food diversification | 0.0334 | ||
| Beautiful residential environment | 0.0334 | ||
| Clean air quality | 0.0334 | ||
| Sewage and waste disposal | 0.0333 | ||
| Village public security | 0.0337 | ||
| Capacity of sustainable development | Traffic | Traffic convenience | 0.0334 |
| Medical care | Medical resources and facilities | 0.0334 | |
| Education | Education facilities and resources | 0.0334 | |
| Debt burden | Family debt burden | 0.0333 | |
| Confidence in rural development | Confidence in rural and agricultural development | 0.0331 | |
| Good social relationship | Family relationship | Family reunion | 0.0335 |
| Neighbourhood relationship | Harmonious neighbourhood relationship | 0.0335 | |
| Villager cohesion | 0.0335 | ||
| Freedom and justice | Knowlege of village key decision making | 0.0333 | |
| Social justice | Allowance satisfaction | 0.0332 | |
| Independent decision making of farmers | 0.0335 |
| Arable Land | Woodland | Grassland | Orchard | Water | Built-Up Land | Unused Land | Total Land | ||
|---|---|---|---|---|---|---|---|---|---|
| Yueyang | 2000 | 296.6 | 0.3 | 7.5 | 2.7 | 5.5 | 94.5 | 12.3 | 419.4 |
| 2020 | 285.8 | 0 | 0 | 8 | 2.7 | 118.3 | 4.6 | ||
| Change (%) | −3.6 | −100.0 | −100.0 | 196.3 | −0.9 | 25.2 | −62.6 | ||
| Duling | 2000 | 63.4 | 0 | 0 | 0.1 | 0 | 12.2 | 0 | 75.7 |
| 2020 | 28.4 | 5 | 9.1 | 17.8 | 0 | 15.4 | 0 | ||
| Change (%) | −55.2 | 0.0 | 0.0 | 17,700.0 | 0.0 | 26.2 | 0.0 | ||
| Huojian | 2000 | 372.8 | 0 | 0 | 6.5 | 0 | 41.4 | 0 | 420.7 |
| 2020 | 324.6 | 0 | 0 | 12.1 | 0 | 84 | 0 | ||
| Change (%) | −12.9 | 0.0 | 0.0 | 86.2 | 0.0 | 102.9 | 0.0 | ||
| Hongfeng | 2000 | 377.6 | 0 | 1.5 | 11.6 | 5.4 | 88.3 | 0 | 484.4 |
| 2020 | 362.8 | 9.5 | 0 | 11.5 | 0 | 100.6 | 0 | ||
| Change (%) | −3.9 | 0.0 | −100.0 | −0.9 | −100.0 | 13.9 | 0.0 | ||
| Huangliangxin | 2000 | 82 | 0.2 | 0 | 0 | 8.3 | 28.4 | 0 | 118.9 |
| 2020 | 45.9 | 10.4 | 4.4 | 0 | 0 | 58.2 | 0 | ||
| Change (%) | −44.0 | 5100.0 | 0.0 | 0.0 | 100.0 | 104.9 | 0.0 |
| Grain | Apple | Vegetable | Apricots & Plums | Melons | Grapes | Cherries | Peaches | Beans | Flowers | Agricultural Land Area (ha) | ||
|---|---|---|---|---|---|---|---|---|---|---|---|---|
| Yueyang | 2000 | 292.1 | 2.1 | 4.5 | 0.5 | 0 | 0 | 0 | 0 | 0 | 0 | 299.3 |
| 2020 | 284 | 8 | 1.8 | 0 | 0 | 0 | 0 | 0 | 0 | 0 | 293.8 | |
| Change (%) | −2.8 | 281.0 | −60.0 | −100.0 | 0.0 | 0.0 | 0.0 | 0.0 | 0.0 | 0.0 | ||
| Duling | 2000 | 63.3 | 0.1 | 0.03 | 0 | 0.03 | 0 | 0.04 | 0 | 0 | 0 | 63.5 |
| 2020 | 30.4 | 0 | 1.7 | 0 | 0 | 7.7 | 18.4 | 0 | 0 | 0 | 58.2 | |
| Change (%) | −52.0 | −100.0 | 5566.7 | 0.0 | −100.0 | 100.0 | 45,900 | 0.0 | 0.0 | 0.0 | ||
| Huojian | 2000 | 333.1 | 6.5 | 39.7 | 0 | 0 | 0 | 0 | 0 | 0 | 0 | 379.3 |
| 2020 | 160.6 | 11.3 | 164.9 | 0 | 0 | 0 | 0 | 0 | 0 | 0 | 336.8 | |
| Change (%) | −51.8 | 73.8 | 315.4 | 0.0 | 0.0 | 0.0 | 0.0 | 0.0 | 0.0 | 0.0 | ||
| Hongfeng | 2000 | 360.3 | 1.9 | 17.3 | 3.2 | 0 | 0 | 0 | 6.5 | 0 | 0 | 389.2 |
| 2020 | 109.9 | 0 | 242.5 | 1.1 | 10.7 | 8.5 | 0 | 1.6 | 0 | 0 | 374.3 | |
| Change (%) | −69.5 | −100.0 | 1301.7 | −65.6 | 100.0 | 100.0 | 0.0 | −75.4 | 0.0 | 0 | ||
| Huangliangxin | 2000 | 79 | 0 | 0.3 | 0 | 0 | 0 | 0 | 0 | 2.7 | 0 | 82 |
| 2020 | 45.9 | 0 | 0 | 0 | 0 | 0 | 0 | 0 | 0 | 10.5 | 56.4 | |
| Change (%) | −41.9 | 0 | −100.0 | 0 | 0 | 0 | 0 | 0 | −100.0 | 100.0 |
| Feature | Classification | Duling | Hongfeng | Huangliangxin | Huojian | Yueyang | |||||
|---|---|---|---|---|---|---|---|---|---|---|---|
| n | % | n | % | n | % | n | % | n | % | ||
| Gender | Male | 9 | 37.5 | 7 | 33.3 | 11 | 50 | 9 | 60 | 8 | 50 |
| Female | 15 | 62.5 | 14 | 66.7 | 11 | 50 | 6 | 40 | 8 | 50 | |
| Age (years) | <30 | 1 | 4.2 | 4 | 19 | 1 | 4.5 | 2 | 13.3 | 2 | 12.5 |
| 30–50 | 4 | 16.7 | 7 | 33.4 | 6 | 27.3 | 6 | 40 | 7 | 43.8 | |
| 50–60 | 7 | 29.1 | 5 | 23.8 | 7 | 31.8 | 5 | 33.3 | 3 | 18.7 | |
| >60 | 12 | 50 | 5 | 23.8 | 8 | 36.4 | 2 | 13.4 | 4 | 25 | |
| Educational experience | High school and below | 22 | 91.7 | 17 | 81 | 21 | 95.5 | 11 | 73.3 | 13 | 81.3 |
| Junior college degree and above | 2 | 8.3 | 4 | 19 | 1 | 4.5 | 4 | 26.7 | 3 | 18.7 | |
| Household income from agriculture (1000 yuan/year) | <30 | 12 | 50 | 10 | 47.6 | 6 | 27.3 | 6 | 40 | 5 | 31.3 |
| 30–80 | 7 | 29.2 | 7 | 33.3 | 12 | 54.5 | 6 | 40 | 6 | 37.5 | |
| 80–150 | 2 | 8.3 | 2 | 9.5 | 1 | 4.5 | 1 | 6.7 | 2 | 12.5 | |
| 150–200 | 2 | 8.3 | 1 | 4.8 | 2 | 9.2 | 1 | 6.7 | 1 | 6.2 | |
| >200 | 1 | 4.2 | 1 | 4.8 | 1 | 4.5 | 1 | 6.6 | 2 | 12.5 | |
| Profession | Crop planting | 21 | 52.5 | 16 | 44.4 | 17 | 51.5 | 13 | 56.5 | 13 | 48.1 |
| Livestock | 0 | 0 | 1 | 2.8 | 0 | 0 | 0 | 0 | 0 | 0 | |
| Tertiary services | 14 | 35 | 13 | 36.1 | 15 | 45.5 | 8 | 34.8 | 5 | 18.5 | |
| Corporate staff | 3 | 7.5 | 1 | 2.8 | 0 | 0 | 1 | 4.3 | 4 | 14.8 | |
| Government staff | 2 | 5 | 1 | 2.8 | 0 | 0 | 0 | 0 | 3 | 11.1 | |
| Private factory owner | 0 | 0 | 4 | 11.1 | 1 | 3 | 1 | 4.4 | 0 | 0 | |
| Others | 0 | 0 | 0 | 0 | 0 | 0 | 0 | 0 | 2 | 7.5 | |
| Place of residence | Dwell in village | 22 | 91.7 | 17 | 81 | 21 | 95.5 | 14 | 93.3 | 13 | 81.3 |
| Occasionally dwell in village | 2 | 8.3 | 2 | 9.5 | 1 | 4.5 | 0 | 0 | 3 | 18.7 | |
| Live in city | 0 | 0 | 2 | 9.5 | 0 | 0 | 1 | 6.7 | 0 | 0 | |
| Total number (people) | 24 | 21 | 22 | 15 | 16 | ||||||
| Air Purification (105 Yuan) | Carbon Sequestration and Oxygen Release (105 Yuan) | Water Conservation (105 Yuan) | Tourism and Leisure (105 Yuan) | Economic Production (105 Yuan) | Total Value (105 Yuan) | ||
|---|---|---|---|---|---|---|---|
| Yueyang | 2000 | 0.2 | 5 | 0.08 | 0.06 | 0.4 | 5.8 |
| 2020 | 0.3 | 4.7 | 0.1 | 0.3 | 0.6 | 5.9 | |
| Change (%) | 50.0 | −6.0 | 25.0 | 400.0 | 50.0 | 1.7 | |
| Duling | 2000 | 0.03 | 1.1 | 0.01 | 0.01 | 0.08 | 1.2 |
| 2020 | 0.6 | 1.2 | 0.4 | 0.7 | 0.2 | 3.2 | |
| Change (%) | 1900.0 | 9.1 | 3900.0 | 6900.0 | 150.0 | 166.7 | |
| Huojian | 2000 | 0.3 | 6.2 | 0.14 | 0.11 | 0.6 | 7.3 |
| 2020 | 0.3 | 5.04 | 0.3 | 0.6 | 1.3 | 7.6 | |
| Change (%) | 0.0 | −18.7 | 114.3 | 445.5 | 116.7 | 4.1 | |
| Hongfeng | 2000 | 0.4 | 6.5 | 0.2 | 0.2 | 0.6 | 7.7 |
| 2020 | 1 | 5.8 | 0.9 | 0.9 | 1.8 | 10.3 | |
| Change (%) | 150.0 | −10.8 | 350.0 | 350.0 | 200.0 | 33.8 | |
| Huangliangxin | 2000 | 0.05 | 1.4 | 0.02 | 0.01 | 0.1 | 1.5 |
| 2020 | 0.03 | 0.9 | 0.02 | 0.03 | 1.9 | 2.9 | |
| Change (%) | −40.0 | −35.7 | 0.0 | 200.0 | 1800.0 | 93.3 | |
| Duling | Hongfeng | Huangliangxin | Huojian | Yueyang | |
|---|---|---|---|---|---|
| 2000 | 4.9 | 5.0 | 5.1 | 4.9 | 5.7 |
| 2020 | 6.4 | 6.2 | 6.4 | 5.8 | 6.1 |
| Change (%) | 30.6 | 24.0 | 25.5 | 18.4 | 7.0 |
| Maintain High-Quality Life | Health and Safety | Sustainable Development | Good Social Relationship | Freedom and Justice | ||
|---|---|---|---|---|---|---|
| Duling | 2000 | 1.4 | 1.8 | 0.7 | 0.5 | 0.5 |
| 2020 | 1.7 | 2.2 | 1.1 | 0.8 | 0.7 | |
| Change (%) | 21.4 | 22.2 | 57.1 | 60.0 | 40.0 | |
| Hongfeng | 2000 | 1.3 | 1.7 | 0.8 | 0.7 | 0.5 |
| 2020 | 1.7 | 2.2 | 1.1 | 0.7 | 0.6 | |
| Change (%) | 30.8 | 29.4 | 37.5 | 0.0 | 20.0 | |
| Huangliangxin | 2000 | 1.3 | 1.7 | 0.9 | 0.7 | 0.5 |
| 2020 | 1.6 | 2.3 | 1.2 | 0.8 | 0.7 | |
| Change (%) | 23.1 | 35.3 | 33.3 | 14.3 | 40.0 | |
| Huojian | 2000 | 1.2 | 1.7 | 0.8 | 0.6 | 0.5 |
| 2020 | 1.6 | 1.9 | 1 | 0.7 | 0.6 | |
| Change (%) | 33.3 | 11.8 | 25.0 | 16.7 | 20.0 | |
| Yueyang | 2000 | 1.6 | 1.9 | 0.9 | 0.7 | 0.6 |
| 2020 | 1.8 | 1.9 | 1.1 | 0.7 | 0.7 | |
| Change (%) | 12.5 | 0.0 | 22.2 | 0.0 | 16.7 | |
Publisher’s Note: MDPI stays neutral with regard to jurisdictional claims in published maps and institutional affiliations. |
© 2022 by the authors. Licensee MDPI, Basel, Switzerland. This article is an open access article distributed under the terms and conditions of the Creative Commons Attribution (CC BY) license (https://creativecommons.org/licenses/by/4.0/).
Share and Cite
Zhou, Z.; Liu, X.; Zheng, B.; Robinson, G.M.; Song, B. Agricultural Transformation and Its Impact on Ecosystem Services and Human Well-Being in Peri-Urban Areas: The Case of Xi’an, China. Land 2022, 11, 110. https://doi.org/10.3390/land11010110
Zhou Z, Liu X, Zheng B, Robinson GM, Song B. Agricultural Transformation and Its Impact on Ecosystem Services and Human Well-Being in Peri-Urban Areas: The Case of Xi’an, China. Land. 2022; 11(1):110. https://doi.org/10.3390/land11010110
Chicago/Turabian StyleZhou, Zhongxue, Xiaofang Liu, Bijun Zheng, Guy M. Robinson, and Bingjie Song. 2022. "Agricultural Transformation and Its Impact on Ecosystem Services and Human Well-Being in Peri-Urban Areas: The Case of Xi’an, China" Land 11, no. 1: 110. https://doi.org/10.3390/land11010110
APA StyleZhou, Z., Liu, X., Zheng, B., Robinson, G. M., & Song, B. (2022). Agricultural Transformation and Its Impact on Ecosystem Services and Human Well-Being in Peri-Urban Areas: The Case of Xi’an, China. Land, 11(1), 110. https://doi.org/10.3390/land11010110