
Ecological Efficiency of Urban Industrial Land in Metropolitan Areas: Evidence from China

Abstract
:1. Introduction
2. Literature Review
3. Methodology
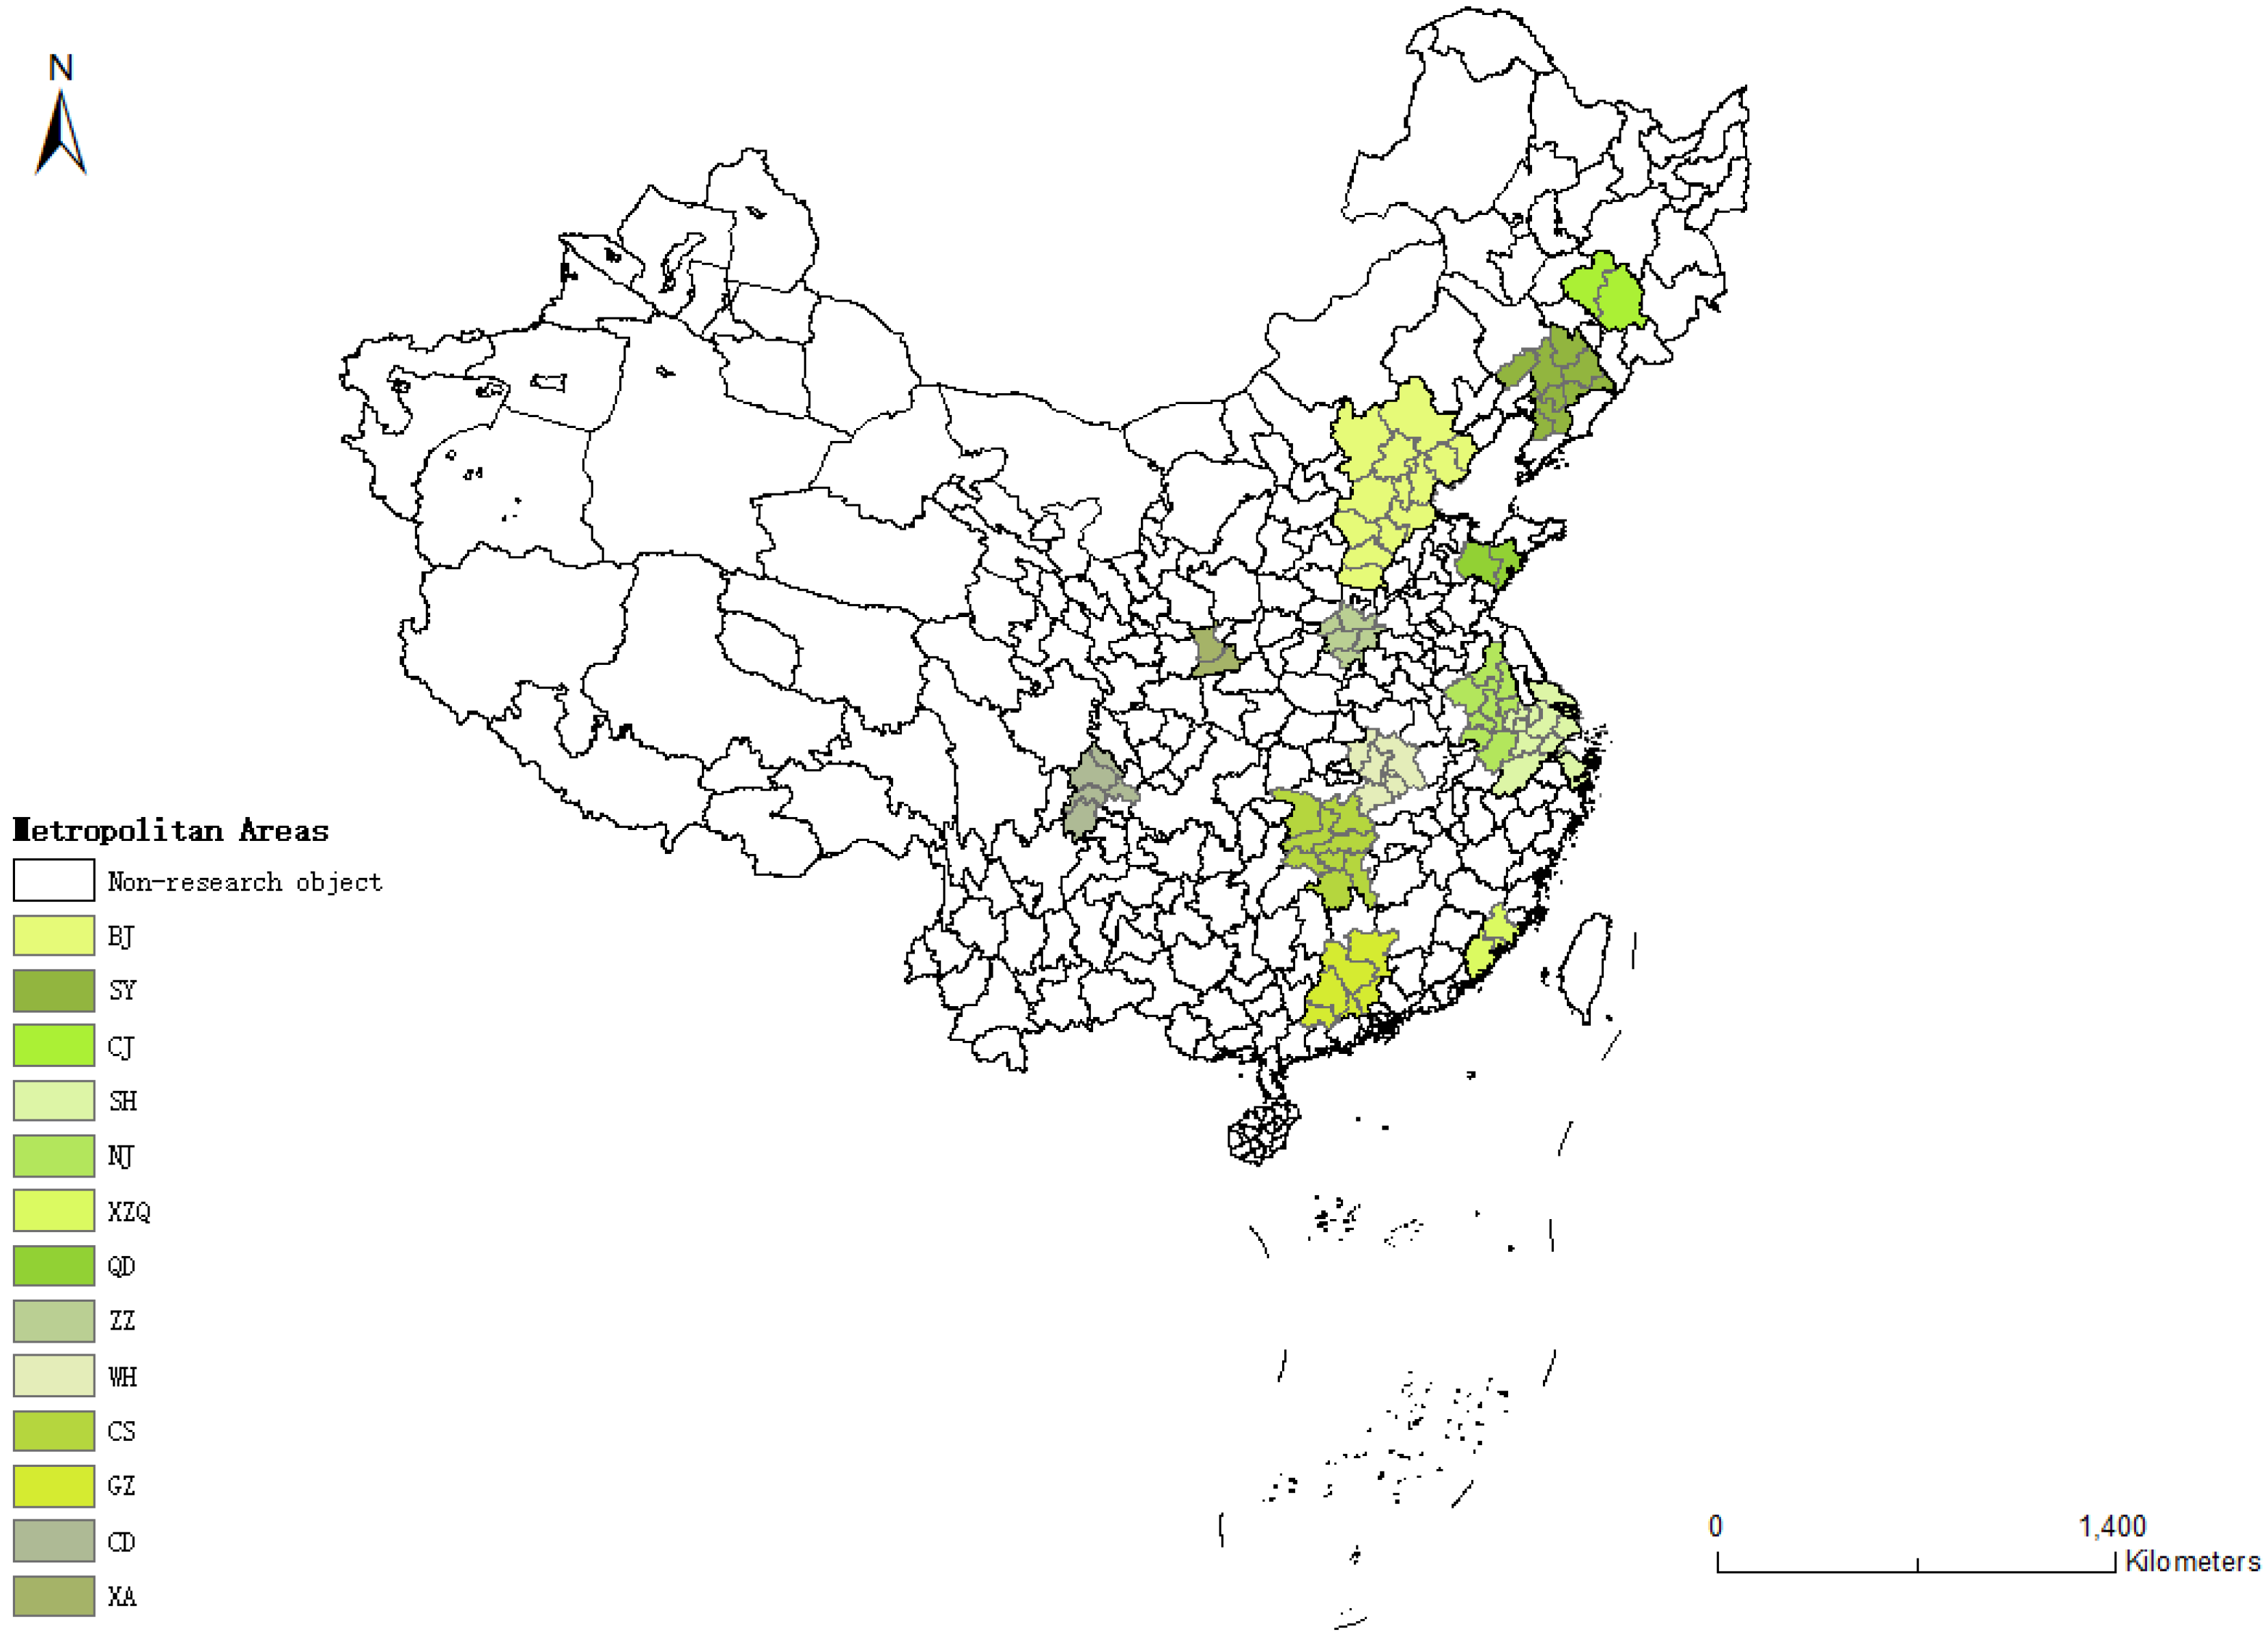
3.1. Sample Selection
3.2. SBM Model
3.3. Tobit Regression
3.4. Data
3.4.1. Input and Output Indexes
- Input indicators. Land, capital, and labor are important input factors in social and economic construction activities. Considering this, this study selected the indicators from three aspects: First, land input. Industrial production activities do not require the quality of land; they only need to meet the supply of a certain area of input. Therefore, this study used the size of the available land area and selected the city’s industrial land area as the indicator of land investment. Second, capital investment. Industrial production needs funds to start, run, complete production activities, and maintain the operation of industrial enterprises. Because the total amount of fixed assets can reflect the actual assets of industrial enterprises in the year, this study selected the total amount of fixed assets of industrial enterprises above the urban scale as the index of capital investment. Third, labor input. This study selected the number of employees in the urban secondary industry to represent the labor input index.
- Desirable output indicators. To a certain extent, industrial added value eliminates intermediate consumption in production activities, which can more accurately reflect regional industrial output. Therefore, this study selected the industrial added value of industrial enterprises above scale to represent economic benefits.
- Undesirable output indicators. This study selected carbon emissions as an undesirable output indicator to represent the total annual carbon dioxide emissions (million tons), which can reflect the impact on environmental changes when industrial production activities are carried out on land, to construct the ECILU measurement model.
3.4.2. Influencing Factor Variables
- Urban scale (gdp). The economy is an important aspect when judging the degree of development of a city. Provinces with higher per capita GDP levels are relatively more ecologically efficient [44]. The environmental Kuznets curve shows that when the economy develops to a higher level, environmental pollution will be improved [45], and cities with larger scales and higher levels of economic development are better able to cope with environmental challenges. Therefore, this study selected regional GDP as the proxy variable of urban scale that indicated the level of economic development in the region.
- Industrial structure (ic). The change in regional industrial structure will affect the ratio of input factors in industrial production and the change in resource utilization form. The higher the proportion of the tertiary industry, especially the service industry, the higher the eco-efficiency will be [46,47]. Therefore, this study selected the proportion of tertiary industry to GDP to measure the industrial structure of a region.
- Regional population quality (rpq). The agglomeration degree and potential development force of talents in the region are important driving forces for industrial growth, but they will also affect the local ecological quality [48]. Furthermore, mid-to-high-end labor can improve the efficiency of economic growth more than low-end labor [49]. This study selected the number of students in regional colleges and universities to measure the quality of the regional population.
- Degree of regional marketization (drm). The degree of marketization can reflect the allocation effect of the market on the elements needed for industrial production to a certain extent, thereby increasing the industrial output value and sales value and improving the ecological efficiency of local industrial land [50]. This study selected the total retail sales of social consumer goods to measure the marketization level.
- Infrastructure construction level (icl). Regional infrastructure level can provide development carriers and logistics support for the industrial and commercial economy [51]. This study used urban road areas to characterize the infrastructure levels.
- Regional green coverage (rg). The urban green coverage rate is an important indicator for the assessment of China’s environmental protection model cities and the creation of civilized cities. In this study, the urban greening coverage area was used to characterize the ecological level and the degree of regional environmental protection to reflect local attention to environmental protection and the level of sustainable development and construction.
- Industrial wastewater pollution (wp). The discharge of industrial wastewater is significantly related to the quality of the local environment. Soil irrigated by industrial wastewater will have a substantial increase in heavy metal content [52,53]. This study selected industrial wastewater discharge as an ecological variable to measure the degree of regional ecological environmental pollution.
- Sulfur dioxide pollution (sp). Sulfur dioxide is an important indicator for evaluating pollution caused by industrial production [54]. The emission of industrial sulfur dioxide and other substances will inhibit the release of carbon dioxide and polycyclic aromatic hydrocarbons from the soil [55,56]. This study selected industrial sulfur dioxide emissions as another indicator to measure ecological pollution.
3.4.3. Data Sources
4. Results and Discussions
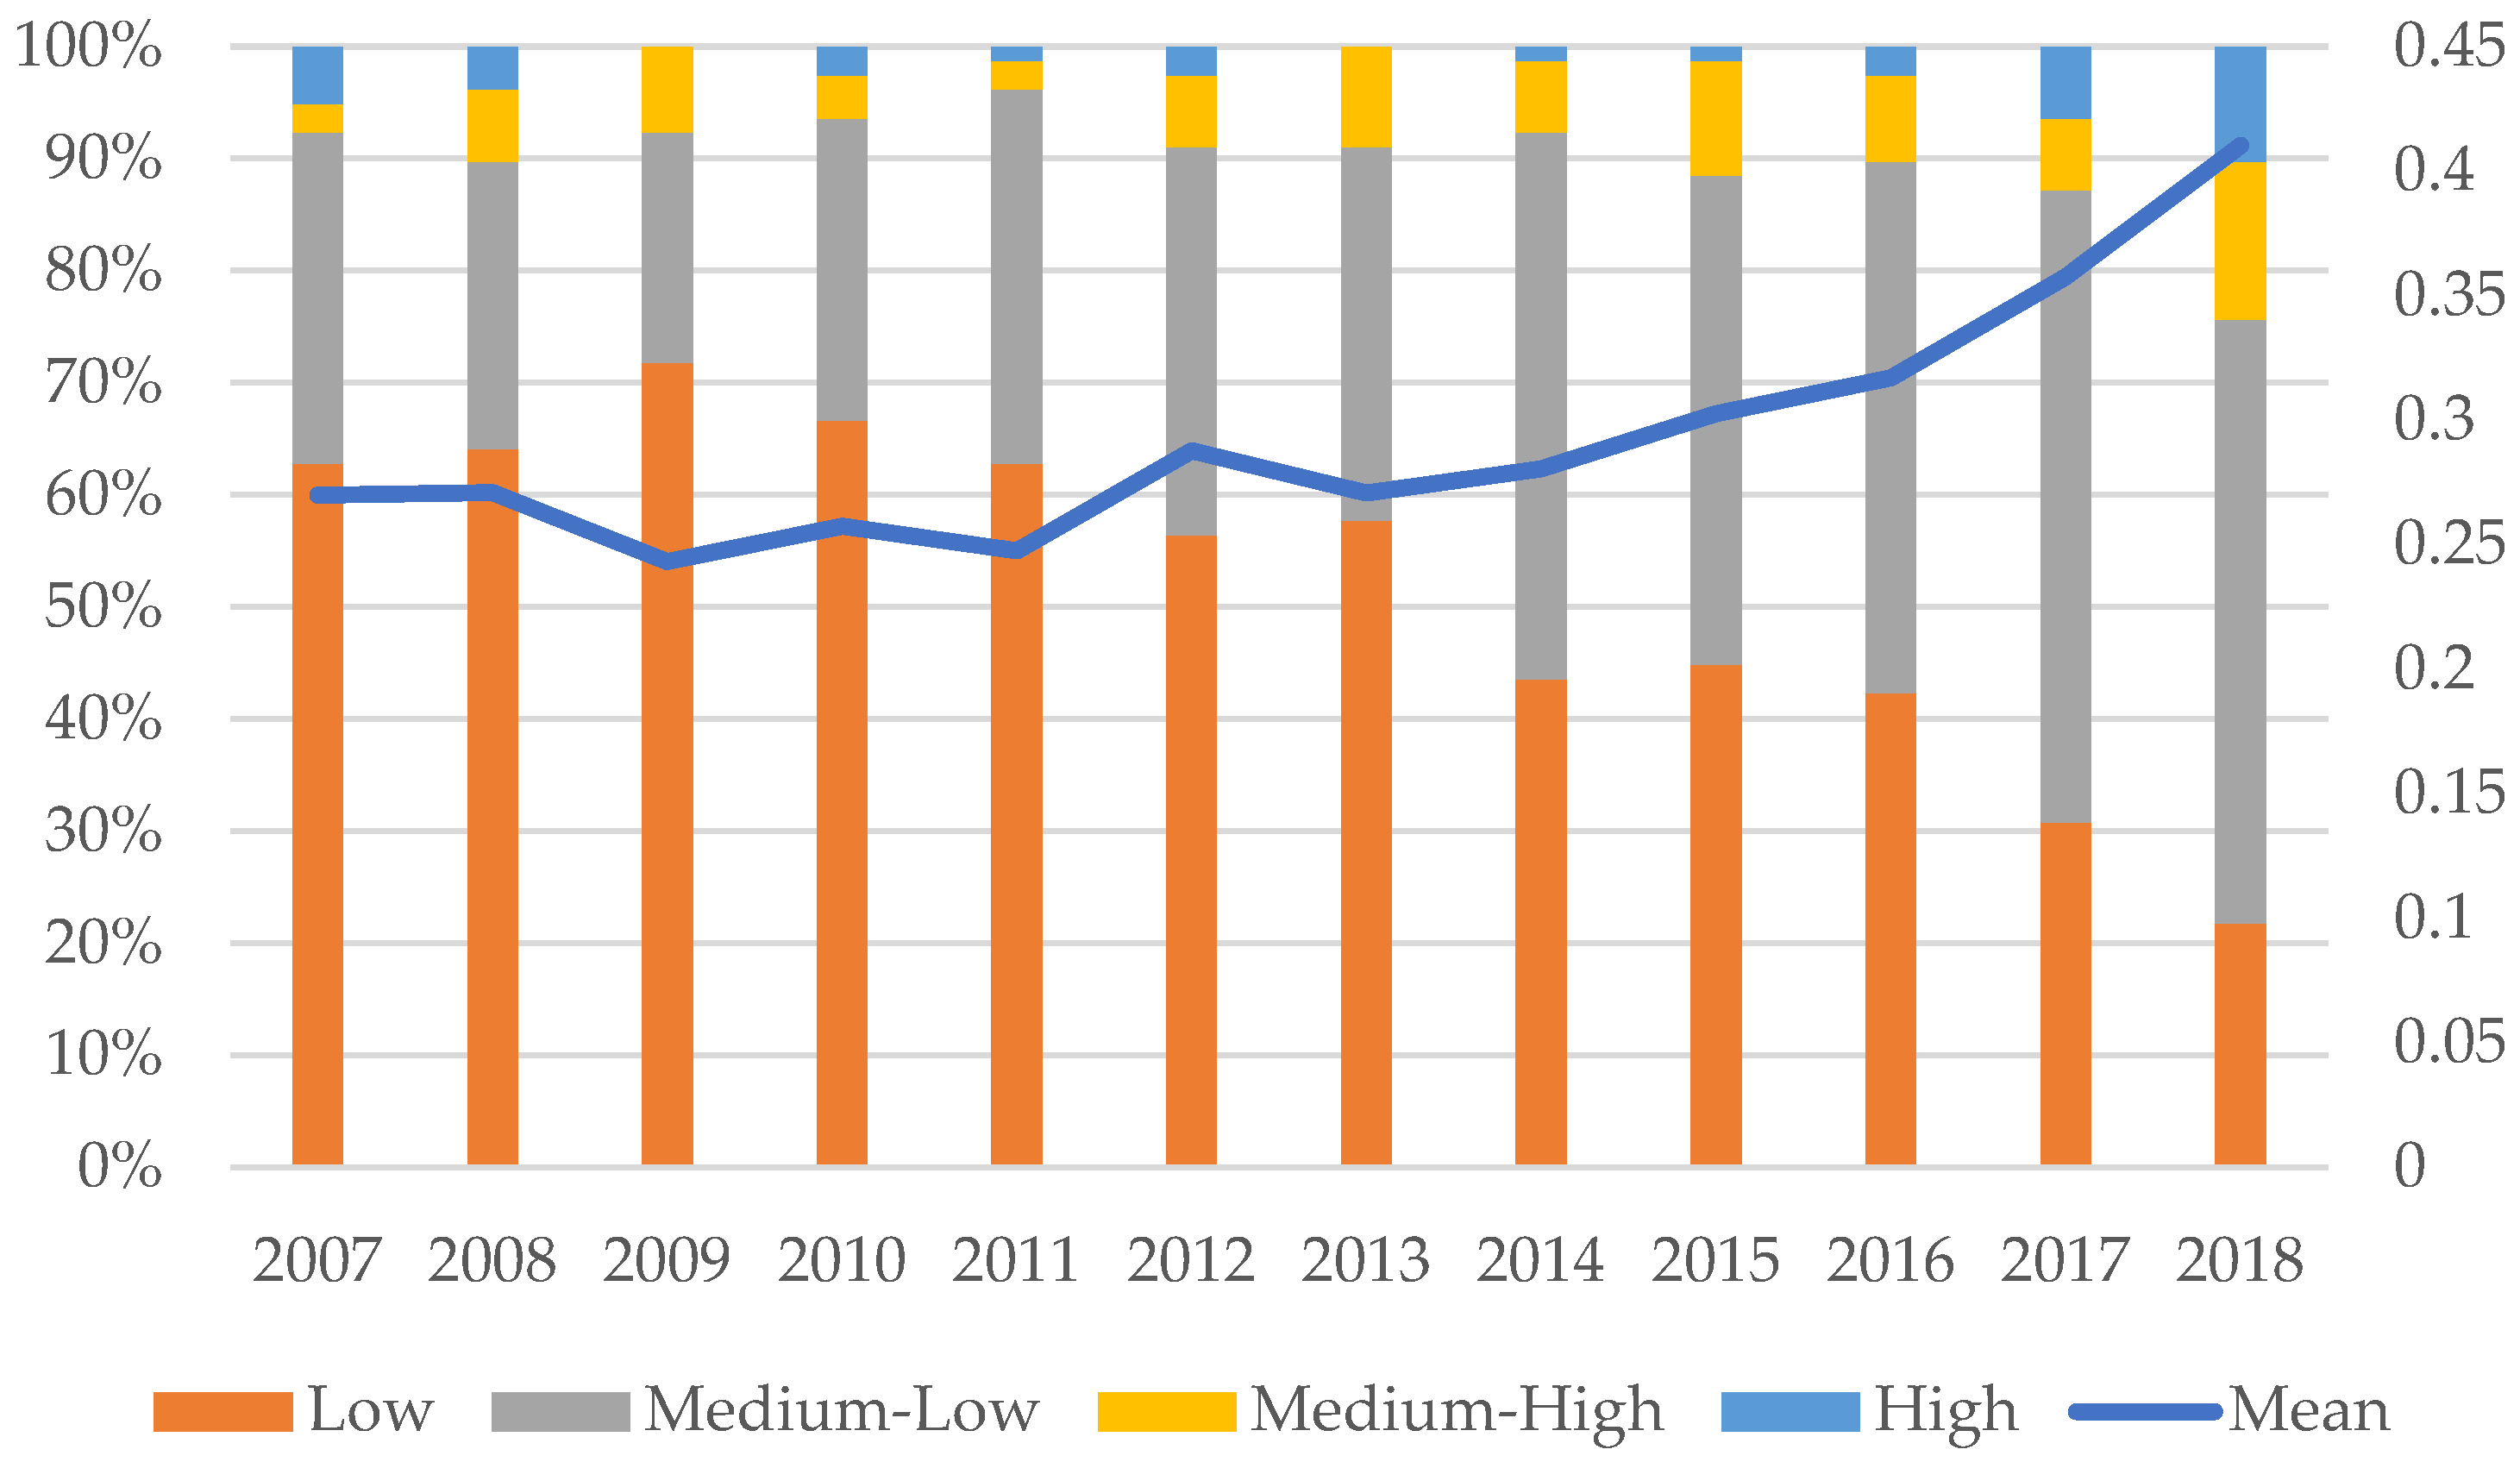
4.1. Measurement Results of the ECILU
4.1.1. Comparison of the ECILU
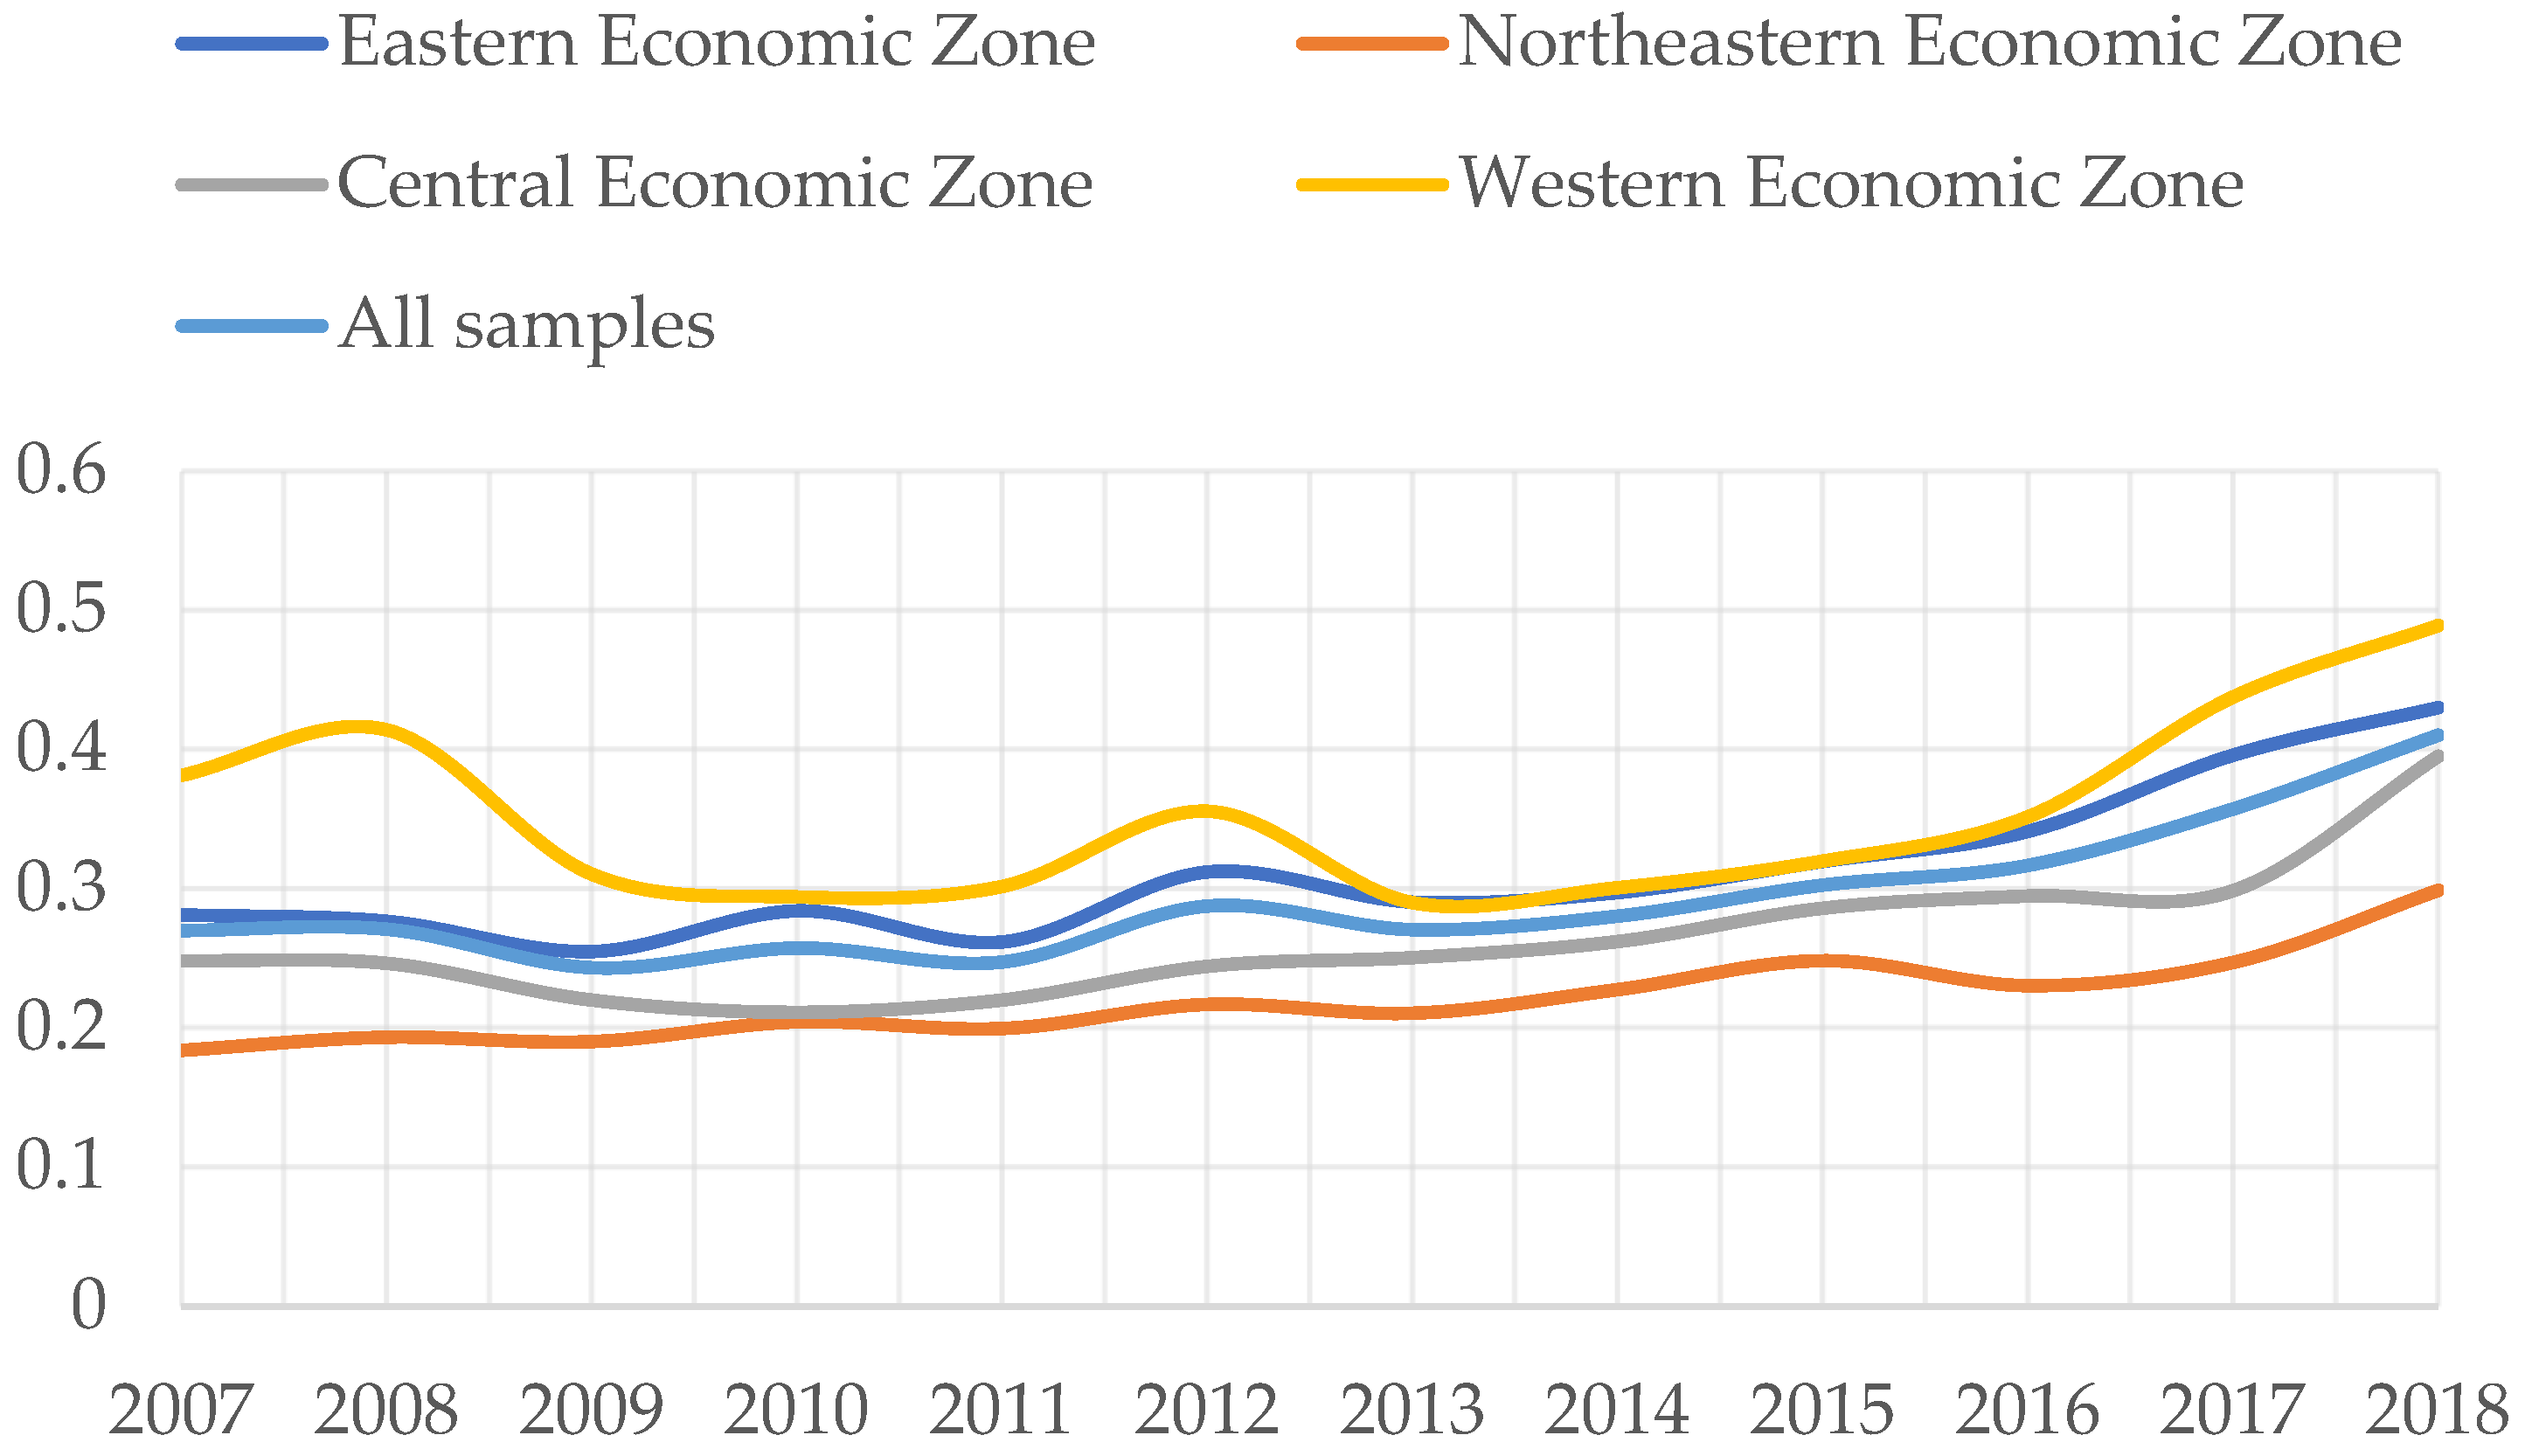
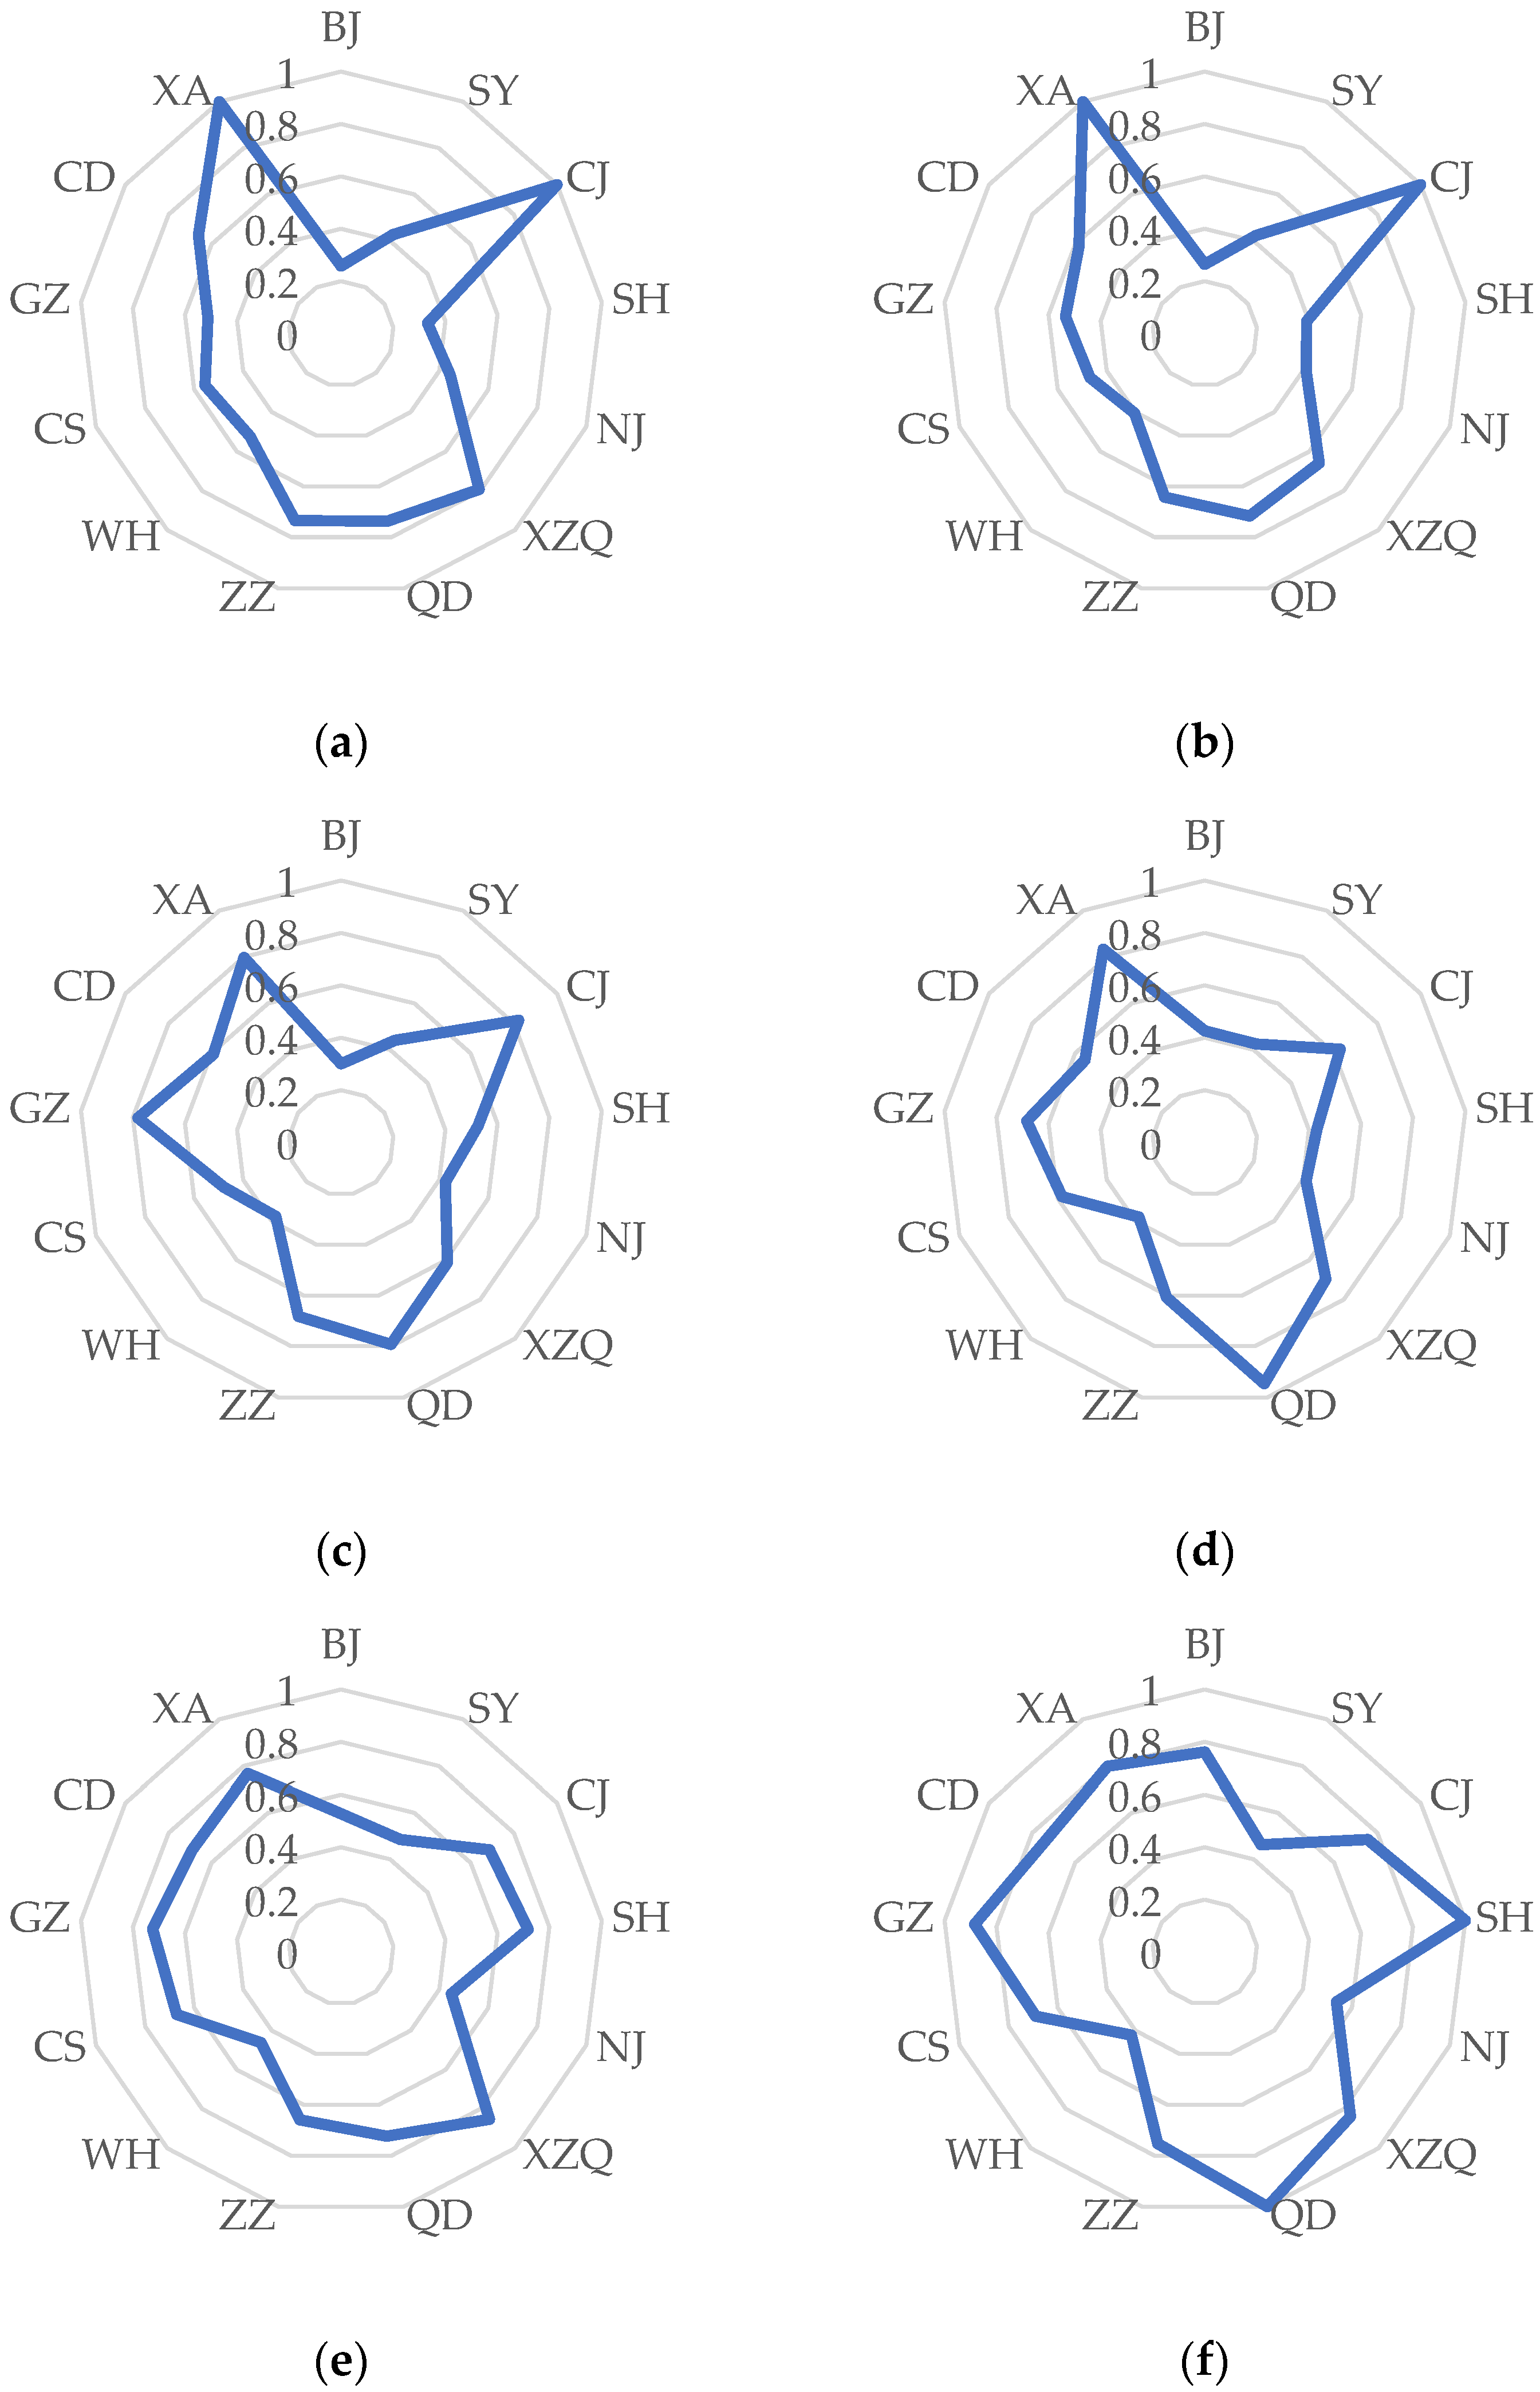
4.1.2. Spatial and Temporal Differences in ECILUs in Metropolitan Areas
4.2. Analysis of the Influencing Factors of the ECILU
- The urban scales of the Eastern, Central, and Northeastern Economic Zones had an appreciable impact on their ECILUs, and the regression coefficients were all positive. The industrial economy affected the ecological efficiency of industrial land by providing support for ecological environment protection, but there were significant differences in the effects of different regions [58], which may have been the reason why the urban scale did not have a significant impact on the Western Economic Zone. Therefore, each economic zone should pay attention to the positive role of urban scale, and strengthen the introduction of regional factors and industrial upgrading by expanding the economic scale of cities.
- Industrial structure had a negative correlation with the Eastern Economic Zone and a positive correlation with the Western Economic Zone. Within a certain range, the improvement in the industrial structure level will affect the allocation mode of various resources and transfer them in the direction conducive to industrial development. However, when the industrial structure level reaches a certain standard under the combined effect of the siphon effect and the negative externality of environmental pollution, it may hinder the improvement of ECILU. Existing research showed that large cities mainly improve eco-efficiency by influencing the tertiary industries, and other small- and medium-sized cities mainly improve eco-efficiency via the secondary industries [59]. Therefore, it is suggested that the Western Economic Zone should strengthen industrial and ecological construction in the construction of metropolitan areas, and also innovate the internal inter-city cooperation mechanism [60].
- Regional population quality had a significant impact on the ECILUs of all economic zones, and the impact coefficients were all negative. The allocation of labor among industries and regions is a direct manifestation of the efficiency of economic operation [61]. The negative correlation shown in the regression results may have been due to the existence of a large surplus of industrial labor, which had a negative impact on the ECILUs [16]. It is recommended that the economic zones appropriately reduce the proportion of industrial labor to slow down the phenomenon of labor surplus.
- The degree of regional marketization had an appreciable impact on the ECILU only in the Central Economic Zone, and the regression coefficient was −0.0378645. The vitality of the market is crucial to industrial efficiency [62]. Industrial agglomerations and transfers have become the main ways for China to improve industrial efficiency [63]. However, when the negative crowding effect caused by industrial agglomeration brought by the marketization level is greater than the positive scale effect, it will have a negative impact on the ECILU.
- There was a significant negative correlation between the level of infrastructure construction and ECILU in the Eastern and Central Economic Zones. Cross-regional transportation and other infrastructure construction provide logistic guarantees for local industrial agglomerations, and industrial agglomerations can also promote the use of urban land resources and reduce the total cost of industrial activities through external economies of scale [64,65]. However, in fact, the eastern and central parts of China are flat and the spatial distribution of public transportation services is uneven [66]. This study suggests that scientific planning of road transportation and other infrastructure should be strengthened, road utilization should be improved, and an efficient connection between public transportation and land use should be established [67].
- The area of regional green coverage had a negatively correlated and significant impact on the Northeastern and Western Economic Zones, and a positively correlated impact on the Central Economic Zone. Compared with the Central and Eastern Economic Zones, it can be explained that the more green areas in the Northeastern and Western Economic Zones may compress industrial land and limit the growth of the industrial economy, while the green areas in the Central Economic Zone may greatly improve the local ecology. Improving ECILU entails the common development of “economy” and “ecology.” Therefore, each economic zone should jointly promote industrial economic growth and environmental protection and realize their harmony.
- The regression coefficients of industrial wastewater pollution and sulfur dioxide pollution for ECILU were both negative. This is consistent with existing research. Industrialization has brought serious pollution problems to the ecological environment, resulting in the decline of water and air quality, soil structure destruction, etc., and has severely weakened the ecosystem service functions of concentrated industrial areas [68]. Therefore, strengthening the city’s management of industrial production factors and reducing pollutant emissions is one of the important ways to improve ECILU on the basis of building a sustainable city [69].
5. Conclusions
Author Contributions
Funding
Data Availability Statement
Conflicts of Interest
References
- Needham, B.; Louw, E.; Metzemakers, P. An economic theory for industrial land policy. Land Use Pol. 2013, 33, 227–234. [Google Scholar] [CrossRef]
- Zhou, L. Optimization of industrial land allocation from the perspective of high-quality development during the 14th five-year plan. China Soft Sci. 2020, 10, 156–164. (In Chinese) [Google Scholar]
- Wu, Q.; Zhang, X.; Shang, Z.; Li, Z. Political-economy based institutional industry complex and sustainable development: The case of the salt-chemical industry in Huai’an, China. Energy Policy 2015, 87, 39–47. [Google Scholar] [CrossRef]
- Seyfang, G.; Smith, A. Grassroots innovations for sustainable development: Towards a new research and policy agenda. Environ. Polit. 2007, 16, 584–603. [Google Scholar] [CrossRef]
- Krekel, C.; Kolbe, J.; Wuestemann, H. The greener, the happier? The effect of urban land use on residential well-being. Ecol. Econ. 2016, 121, 117–127. [Google Scholar] [CrossRef] [Green Version]
- Schaltegger, S.; Sturm, A. Ökologische Rationalität: Ansatzpunkte zur Ausgestaltung von Ökologieorienttierten Management. Instrumenten. Unternehmung 1990, 44, 273–290. [Google Scholar]
- Mickwitz, P.; Melanen, M.; Rosenstrom, U.; Seppala, J. Regional eco-efficiency indicators—A participatory approach. J. Clean. Prod. 2006, 14, 1603–1611. [Google Scholar] [CrossRef]
- Korhonen, P.J.; Luptacik, M. Eco-efficiency analysis of power plants: An extension of data envelopment analysis. Eur. J. Oper. Res. 2004, 154, 437–446. [Google Scholar] [CrossRef]
- Huang, Z.; He, C.; Wei, Y.H.D. A comparative study of land efficiency of electronics firms located within and outside development zones in Shanghai. Habitat Int. 2016, 56, 63–73. [Google Scholar] [CrossRef]
- Yu, S.; Yu, W.; Chen, T.; Wang, H.; Zhang, S. Spatial-temporal distribution and convergence of eco-efficiency of industrial enterprises in coastal provinces of China. J. Coast. Res. 2020, 107, 303–307. [Google Scholar] [CrossRef]
- Georgopoulou, A.; Angelis-Dimakis, A.; Arampatzis, G.; Assimacopoulos, D. Systemic eco-efficiency assessment of industrial water use systems. Desalin. Water Treat. 2017, 63, 343–350. [Google Scholar] [CrossRef]
- Gossling, S.; Peeters, P.; Ceron, J.P.; Dubois, G.; Patterson, T.; Richardson, R.B. The eco-efficiency of tourism. Ecol. Econ. 2005, 54, 417–434. [Google Scholar] [CrossRef]
- Pai, J.-T.; Hu, D.; Liao, W.-W. Research on eco-efficiency of industrial parks in Taiwan. In Proceedings of the Applied Energy Symposium and Forum—Low-Carbon Cities and Urban Energy Systems (CUE), Shanghai, China, 5–7 June 2018. [Google Scholar]
- Pu, W.; Zhang, A.; Wen, L. Can China’s Resource-Saving and Environmentally Friendly Society Really Improve the Efficiency of Industrial Land Use? Land 2021, 10, 751. [Google Scholar] [CrossRef]
- Jiang, H. Spatial-temporal differences of industrial land use efficiency and its influencing factors for China’s central region: Analyzed by SBM model. Environ. Technol. Innov. 2021, 22, 1–21. [Google Scholar] [CrossRef]
- Xie, H.; Wang, W. Spatiotemporal differences and convergence of urban industrial land use efficiency for China’s major economic zones. J. Geogr. Sci. 2015, 25, 1183–1198. [Google Scholar] [CrossRef]
- Chen, W.; Ning, S.; Chen, W.; Liu, E.-N.; Wang, Y.; Zhao, M. Spatial-temporal characteristics of industrial land green efficiency in China: Evidence from prefecture-level cities. Ecol. Indic. 2020, 113, 1–9. [Google Scholar] [CrossRef]
- Liu, S.; Lin, Y.; Ye, Y.; Xiao, W. Spatial-temporal characteristics of industrial land use efficiency in provincial China based on a stochastic frontier production function approach. J. Clean. Prod. 2021, 295, 1–12. [Google Scholar] [CrossRef]
- Yan, S.; Peng, J.; Wu, Q. Exploring the non-linear effects of city size on urban industrial land use efficiency: A spatial econometric analysis of cities in eastern China. Land Use Pol. 2020, 99, 1–14. [Google Scholar] [CrossRef]
- Xie, H.; Chen, Q.; Lu, F.; Wu, Q.; Wang, W. Spatial-temporal disparities, saving potential and influential factors of industrial land use efficiency: A case study in urban agglomeration in the middle reaches of the Yangtze River. Land Use Pol. 2018, 75, 518–529. [Google Scholar] [CrossRef]
- Wang, Q.; Wang, Y.A.; Chen, W.; Zhou, X.; Zhao, M.J. Factors affecting industrial land use efficiency in China: Analysis from government and land market. Environ. Dev. Sustain. 2021, 23, 10973–10993. [Google Scholar] [CrossRef]
- Tian, Y.; Zhou, D.; Jiang, G. A new quality management system of admittance indicators to improve industrial land use efficiency in the Beijing-Tianjin-Hebei region. Land Use Pol. 2021, 107, 1–18. [Google Scholar] [CrossRef]
- Zheng, X.; Geng, B.; Wu, X.; Lv, L.; Hu, Y. Performance Evaluation of Industrial Land Policy in China. Sustainability 2014, 6, 4823–4838. [Google Scholar] [CrossRef] [Green Version]
- Zhang, X.; Lin, Y.; Wu, Y.; Skitmore, M. Industrial land price between China’s Pearl River Delta and Southeast Asian regions: Competition or Coopetition? Land Use Pol. 2017, 61, 575–586. [Google Scholar] [CrossRef] [Green Version]
- Wu, Y.; Zhang, X.; Skitmore, M.; Song, Y.; Hui, E.C.M. Industrial land price and its impact on urban growth: A Chinese case study. Land Use Pol. 2014, 36, 199–209. [Google Scholar] [CrossRef] [Green Version]
- Festel, G.; Wuermseher, M. Benchmarking of energy and utility infrastructures in industrial parks. J. Clean. Prod. 2014, 70, 15–26. [Google Scholar] [CrossRef]
- Hui, E.C.M.; Wu, Y.; Deng, L.; Zheng, B. Analysis on coupling relationship of urban scale and intensive use of land in China. Cities 2015, 42, 63–69. [Google Scholar] [CrossRef]
- Wang, X.; Shen, X.; Pei, T. Efficiency loss and intensification potential of urban industrial land use in three major urban agglomerations in China. Sustainability 2020, 12, 1–22. [Google Scholar]
- Liu, Y.; Sun, C.; Xu, S. Eco-efficiency assessment of water systems in China. Water Resour. Manag. 2013, 27, 4927–4939. [Google Scholar] [CrossRef]
- Shi, Y.; Liu, J.; Shi, H.; Li, H.; Li, Q. The ecosystem service value as a new eco-efficiency indicator for industrial parks. J. Clean. Prod. 2017, 164, 597–605. [Google Scholar] [CrossRef]
- Zhang, X.; Zhu, F. Industrial land intensive utilization evaluation by means of improved fuzzy analytic hierarchy process (FAHP): A case study on typical enterprises of Chengdu economic and technological development zone. In Proceedings of the 20th International Symposium on Advancement of Construction Management and Real Estate, Hangzhou, China, 23–25 October 2015; Wu, Y., Zheng, S., Luo, J., Wang, W., Mo, Z., Shan, L., Eds.; Springer: Berlin/Heidelberg, Germany, 2017. [Google Scholar]
- Meng, Y.; Zhang, F.; An, P.; Dong, M.; Wang, Z.; Zhao, T. Industrial land-use efficiency and planning in Shunyi, Beijing. Landsc. Urb. Plan. 2008, 85, 40–48. [Google Scholar] [CrossRef]
- Tu, F.; Yu, X.; Ruan, J. Industrial land use efficiency under government intervention: Evidence from Hangzhou, China. Habitat Int. 2014, 43, 1–10. [Google Scholar] [CrossRef]
- Chen, W.; He, R.; Wu, Q. A Novel Efficiency Measure Model for Industrial Land Use Based on Subvector Data Envelope Analysis and Spatial Analysis Method. Complexity 2017, 1, 1–11. [Google Scholar] [CrossRef] [Green Version]
- Zhao, X.; Zhang, L.; Huang, X.; Zhao, Y.; Zhang, Y. Evolution of the spatiotemporal pattern of urban industrial land use efficiency in China. Sustainability 2018, 10, 2174. [Google Scholar] [CrossRef] [Green Version]
- Ye, L.; Huang, X.; Yang, H.; Chen, Z.; Zhong, T.; Xie, Z. Effects of dual land ownerships and different land lease terms on industrial land use efficiency in Wuxi City, East China. Habitat Int. 2018, 78, 21–28. [Google Scholar] [CrossRef]
- Chen, W.; Chen, W.; Ning, S.; Liu, E.; Zhou, X.; Wang, Y.; Zhao, M. Exploring the industrial land use efficiency of China’s resource-based cities. Cities 2019, 93, 215–223. [Google Scholar] [CrossRef]
- Yang, H.; Wu, Q. Land use eco-efficiency and its convergence characteristics under the constraint of carbon emissions in China. Int. J. Environ. Res. Public Health 2019, 16, 3172. [Google Scholar] [CrossRef] [PubMed] [Green Version]
- Jun, L. Theoretical logic and path selection of coordinated development in metropolitan area. People’s Tribune 2020, 27, 54–57. (In Chinese) [Google Scholar]
- Charnes, A.; Cooper, W.W.; Rhode, E. Measuring the efficiency ofdecision making units. Eur. J. Oper. Res. 1978, 6, 429–444. [Google Scholar] [CrossRef]
- Tone, K. A slacks-based measure of efficiency in data envelopment analysis. Eur. J. Oper. Res. 2001, 130, 498–509. [Google Scholar] [CrossRef] [Green Version]
- Zhang, J.; Zeng, W.; Wang, J.; Yang, F.; Jiang, H. Regional low-carbon economy efficiency in China: Analysis based on the super-SBM model with CO2 emissions. J. Clean. Prod. 2017, 163, 202–211. [Google Scholar] [CrossRef]
- Tobin, J. Estimation of Relationships for Limited Dependent Variables. Econometrica 1958, 26, 24–36. [Google Scholar] [CrossRef] [Green Version]
- Zhang, B.; Bi, J.; Fan, Z.; Yuan, Z.; Ge, J. Eco-efficiency analysis of industrial system in China: A data envelopment analysis approach. Ecol. Econ. 2008, 68, 306–316. [Google Scholar] [CrossRef]
- Suri, V.; Chapman, D. Economic growth, trade and energy: Implications for the environmental Kuznets curve. Ecol. Econ. 1998, 25, 195–208. [Google Scholar] [CrossRef]
- Cheng, Y.Y.; Shao, T.Y.; Lai, H.L.; Shen, M.H.; Li, Y. Total-Factor Eco-Efficiency and Its Influencing Factors in the Yangtze River Delta Urban Agglomeration, China. Int. J. Environ. Res. Public Health 2019, 16, 3814. [Google Scholar] [CrossRef] [PubMed] [Green Version]
- Zhu, B.; Zhang, T.L. The impact of cross-region industrial structure optimization on economy, carbon emissions and energy. Sci. Total Environ. 2021, 778, 1–13. [Google Scholar] [CrossRef]
- Khan, A.; Sicen, L.; Khan, B.; Salman, N. On the influence of demographic structure and industrial growth on environmental quality. J. Environ. Manag. 2021, 288, 1–11. [Google Scholar] [CrossRef] [PubMed]
- Lin, Z.J.; Chen, H. Labor Structure, Wage and Efficiency of Economic Growth. In Proceedings of the 2012 4th International Conference on Intelligent Human-Machine Systems and Cypernetics (IHMSC), Nanchang, China, 26–27 August 2012; Volume 2, pp. 167–170. [Google Scholar]
- Yu, Y.T.; Peng, C.; Li, Y.S. Do neighboring prefectures matter in promoting eco-efficiency? Empirical evidence from China. Technol. Forecast. Soc. Change 2019, 144, 456–465. [Google Scholar] [CrossRef]
- Hong, J.J.; Chu, Z.F.; Wang, Q. Transport infrastructure and regional economic growth: Evidence from China. Transportation 2011, 38, 737–752. [Google Scholar] [CrossRef]
- Kunhikrishnan, A.; Bolan, N.S.; Müller, K.; Laurenson, S.; Naidu, R.; Kim, W.I. The influence of wastewater irrigation on the transformation and bioavailability of heavy metal (loid)s in soil. Adv. Agron. 2012, 115, 215–297. [Google Scholar]
- Hu, B.; Shao, S.; Ni, H.; Fu, Z.; Hu, L.; Zhou, Y.; Min, X.; She, S.; Chen, S.; Huang, M.; et al. Current status, spatial features, health risks, and potential driving factors of soil heavy metal pollution in China at province level. Environ. Pollut. 2020, 266, 1–21. [Google Scholar] [CrossRef]
- Qian, H.; Xu, S.; Cao, J.; Ren, F.; Wei, W.; Meng, J.; Wu, L. Air pollution reduction and climate co-benefits in China’s industries. Nat. Sustain. 2021, 4, 417–425. [Google Scholar] [CrossRef]
- Kadulin, M.S.; Koptsik, G.N. Carbon Dioxide Emission by Soils as a Criterion for Remediation Effectiveness of Industrial Barrens Near Copper-Nickel Plants in the Kola Subarctic. Russ. J. Ecol. 2019, 50, 535–542. [Google Scholar] [CrossRef]
- Shi, Z.; Ji, W.; Viscarra Rossel, R.A.; Chen, S.; Zhou, Y. Prediction of soil organic matter using a spatially constrained local partial least squares regression and the Chinese vis—NIR spectral library. Eur. J. Soil Sci. 2015, 66, 679–687. [Google Scholar] [CrossRef]
- Wang, Q.P.; Chen, Z.Q.; Bai, X.; Wei, H.; Shen, P.Z. Plant Operation Working Condition of the Optimal Combination of External Research Division. In Proceedings of the 2016 3rd International Conference on Information and Communication Technology for Education (ICTE 2016), Toronto, ON, Canada, 2–3 August 2016; pp. 333–338. [Google Scholar]
- Chen, W.; Shen, Y.; Wang, Y.; Wu, Q. The effect of industrial relocation on industrial land use efficiency in China: A spatial econometrics approach. J. Clean. Prod. 2018, 205, 525–535. [Google Scholar] [CrossRef]
- Huang, Y.; Li, L.; Yu, Y.T. Does urban cluster promote the increase of urban eco-efficiency? Evidence from Chinese cities. J. Clean. Prod. 2018, 197, 957–971. [Google Scholar] [CrossRef]
- Li, L.; Ma, S.; Zheng, Y.; Xiao, X. Integrated regional development: Comparison of urban agglomeration policies in China. Land Use Pol. 2022, 114, 1–14. [Google Scholar] [CrossRef]
- Xia, B.; Dong, S.C.; Li, Y.; Li, Z.; Sun, D.; Zhang, W.; Li, W.L. Evolution Characters and Influencing Factors of Regional Eco-Efficiency in a Developing Country: Evidence from Mongolia. Int. J. Environ. Res. Public Health 2021, 18, 719. [Google Scholar] [CrossRef]
- Ying, Q.W.; Yousaf, T.; Akhtar, Y.; Rasheed, M.S. Stock Investment and Excess Returns: A Critical Review in the Light of the Efficient Market Hypothesis. J. Risk Financ. Manag. 2019, 12, 97. [Google Scholar] [CrossRef] [Green Version]
- Head, K.; Ries, J.; Swenson, D. Agglomeration benefits and location choice: Evidence from Japanese manufacturing investments in the United States. J. Int. Econ. 1995, 38, 223–247. [Google Scholar] [CrossRef] [Green Version]
- Li, C.X.; Gao, X.; He, B.J.; Wu, J.; Wu, K.N. Coupling Coordination Relationships between Urban-Industrial Land Use Efficiency and Accessibility of Highway Networks: Evidence from Beijing-Tianjin-Hebei Urban Agglomeration, China. Sustainability 2019, 11, 1446. [Google Scholar] [CrossRef] [Green Version]
- Han, W.; Zhang, Y.; Cai, J.; Ma, E. Does Urban Industrial Agglomeration Lead to the Improvement of Land Use Efficiency in China? An Empirical Study from a Spatial Perspective. Sustainability 2019, 11, 986. [Google Scholar] [CrossRef] [Green Version]
- Hassan, S.T.; Zhu, B.Z.; Lee, C.C.; Ahmad, P.; Sadiq, M. Asymmetric impacts of public service “transportation” on the environmental pollution in China. Environ. Impact Assess. Rev. 2021, 91, 1–11. [Google Scholar] [CrossRef]
- Polzin, S.E. Transportation/land-use relationship: Public transit’s impact on land use. J. Urb. Plan. Dev. 1999, 125, 135–151. [Google Scholar] [CrossRef]
- Ji, S.W.; Ma, S.H. The effects of industrial pollution on ecosystem service value: A case study in a heavy industrial area, China. Environ. Dev. Sustain. 2021, 1, 1–30. [Google Scholar] [CrossRef]
- Li, L.; Zheng, Y.; Zheng, S.; Ke, H. The new smart city programme: Evaluating the effect of the internet of energy on air quality in China. Sci. Total Environ. 2020, 714, 1–17. [Google Scholar] [CrossRef]
- Li, L.; Ma, S.; Wang, R.; Wang, Y.; Zheng, Y. Citizen Participation in the Co-Production of Urban Natural Resource Assets: Analysis Based on Social Media Big Data. J. Glob. Inf. Manag. 2021, 30, 1–21. [Google Scholar] [CrossRef]

| Inputs | Outputs | Method | Study |
|---|---|---|---|
| Land, labor, fixed-asset investment | Industrial GDP, wastewater, SO2, smoke and dust | Slack-based model | Pu et al. [14] |
| Land, labor, fixed-asset investment | Industrial GDP, pollution | Slack-based model | Jiang [15] |
| Land, labor, fixed-asset investment | Industrial economic output | Slack-based model | Xie and Wang [16] |
| Land, labor, fixed capital, energy consumption | Industrial GDP, wastewater, SO2, smoke and dust | SBM-undesirable model | Chen et al. [17] |
| Labor, energy, fixed capital | Industrial GDP, SO2, CO2, dust, smoke, and wastewater | SFA | Liu et al. [18] |
| Land, labor, the net value of fixed assets | Industrial GDP | SFA | Yan et al. [19] |
| Land, labor, the net value of fixed assets | Industrial GDP, exhaust, wastewater | SGDDF | Xie et al. [20] |
| / | Industrial GDP | Industrial GDP per unit land | Wang et al. [21] |
| Name of Metropolitan Area | Symbol | Covered Cities |
|---|---|---|
| Capital economic circle | BJ | Beijing, Tianjin, Baoding, Tangshan, Langfang, Shijiazhuang, Cangzhou, Qinhuangdao, Zhangjiakou, Chengde, Handan, Xingtai, and Hengshui |
| Shenyang metropolitan area | SY | Shenyang, Anshan, Fushun, Benxi, Yingkou, Fuxin, Liaoyang, and Tieling |
| Changji metropolitan area | CJ | Changchun and Jilin |
| Shanghai metropolitan area | SH | Shanghai, Suzhou, Wuxi, Changzhou, Nantong, Jiaxing, Ningbo, Hangzhou, Zhoushan, and Huzhou |
| Nanjing metropolitan area | NJ | Nanjing, Zhenjiang, Yangzhou, Huaian, Maanshan, Chuzhou, Wuhu, Xuancheng, and Changzhou |
| Xia–Zhang–Quan metropolitan area | XZQ | Quanzhou, Xiamen, and Zhangzhou |
| Qingdao metropolitan area | QD | Qingdao and Weifang |
| Zhengzhou metropolitan area | ZZ | Zhengzhou, Kaifeng, Xinxiang, Jiaozuo, and Xuchang |
| Wuhan metropolitan area | WH | Wuhan, Huangshi, Ezhou, Huanggang, Xiaogan, and Xianning |
| Great Changsha metropolitan area | CS | Changsha, Zhuzhou, Xiangtan, Yueyang, Changde, Yiyang, Loudi, and Hengyang |
| Guangzhou metropolitan area | GZ | Guangzhou, Foshan, Zhaoqing, Qingyuan, Yunfu, and Shaoguan |
| Chengdu metropolitan area | CD | Chengdu, Deyang, Meishan, Ziyang, and Leshan |
| Xi’an metropolitan area | XA | Xi’an and Xianyang |
| Explanatory Variable | Symbol | Unit | Definition |
|---|---|---|---|
| Urban scale | gdp | 10,000 CNY | Regional GDP, taken as a logarithm |
| Industrial structure | ic | % | The proportion of tertiary industry in regional GDP (gross domestic product), taken as a logarithm |
| Regional population quality | rpq | People | The number of students in regional colleges and universities, taken as a logarithm |
| Degree of regional marketization | drm | 10,000 CNY | The total retail sales of social consumer goods, taken as a logarithm |
| Infrastructure construction level | icl | 10,000 m2 | Urban road area, taken as a logarithm |
| Regional green coverage | rg | ha | Urban greening coverage area, taken as a logarithm |
| Industrial wastewater pollution | wp | 10,000 tons | Volume of industrial wastewater discharged, taken as a logarithm |
| Sulfur dioxide pollution | sp | ton | Volume of industrial sulfur dioxide emissions, taken as a logarithm |
| Year | Mean | Maximum | Minimum | ECILU Levels | |||
|---|---|---|---|---|---|---|---|
| Low | Medium–Low | Medium–High | High | ||||
| 2007 | 0.2699 | 1.0000 | 0.1024 | 49 | 23 | 2 | 4 |
| 2008 | 0.2709 | 1.0000 | 0.0942 | 50 | 20 | 5 | 3 |
| 2009 | 0.2432 | 0.7068 | 0.0891 | 56 | 16 | 6 | 0 |
| 2010 | 0.2574 | 1.0000 | 0.1056 | 52 | 21 | 3 | 2 |
| 2011 | 0.2475 | 1.0000 | 0.0998 | 49 | 26 | 2 | 1 |
| 2012 | 0.2876 | 1.0000 | 0.0863 | 44 | 27 | 5 | 2 |
| 2013 | 0.2707 | 0.6887 | 0.0810 | 45 | 26 | 7 | 0 |
| 2014 | 0.2804 | 0.7620 | 0.0953 | 34 | 38 | 5 | 1 |
| 2015 | 0.3026 | 0.8825 | 0.1111 | 35 | 34 | 8 | 1 |
| 2016 | 0.3169 | 1.0000 | 0.1773 | 33 | 37 | 6 | 2 |
| 2017 | 0.3574 | 1.0000 | 0.1613 | 24 | 44 | 5 | 5 |
| 2018 | 0.4103 | 1.0000 | 0.1239 | 17 | 42 | 11 | 8 |
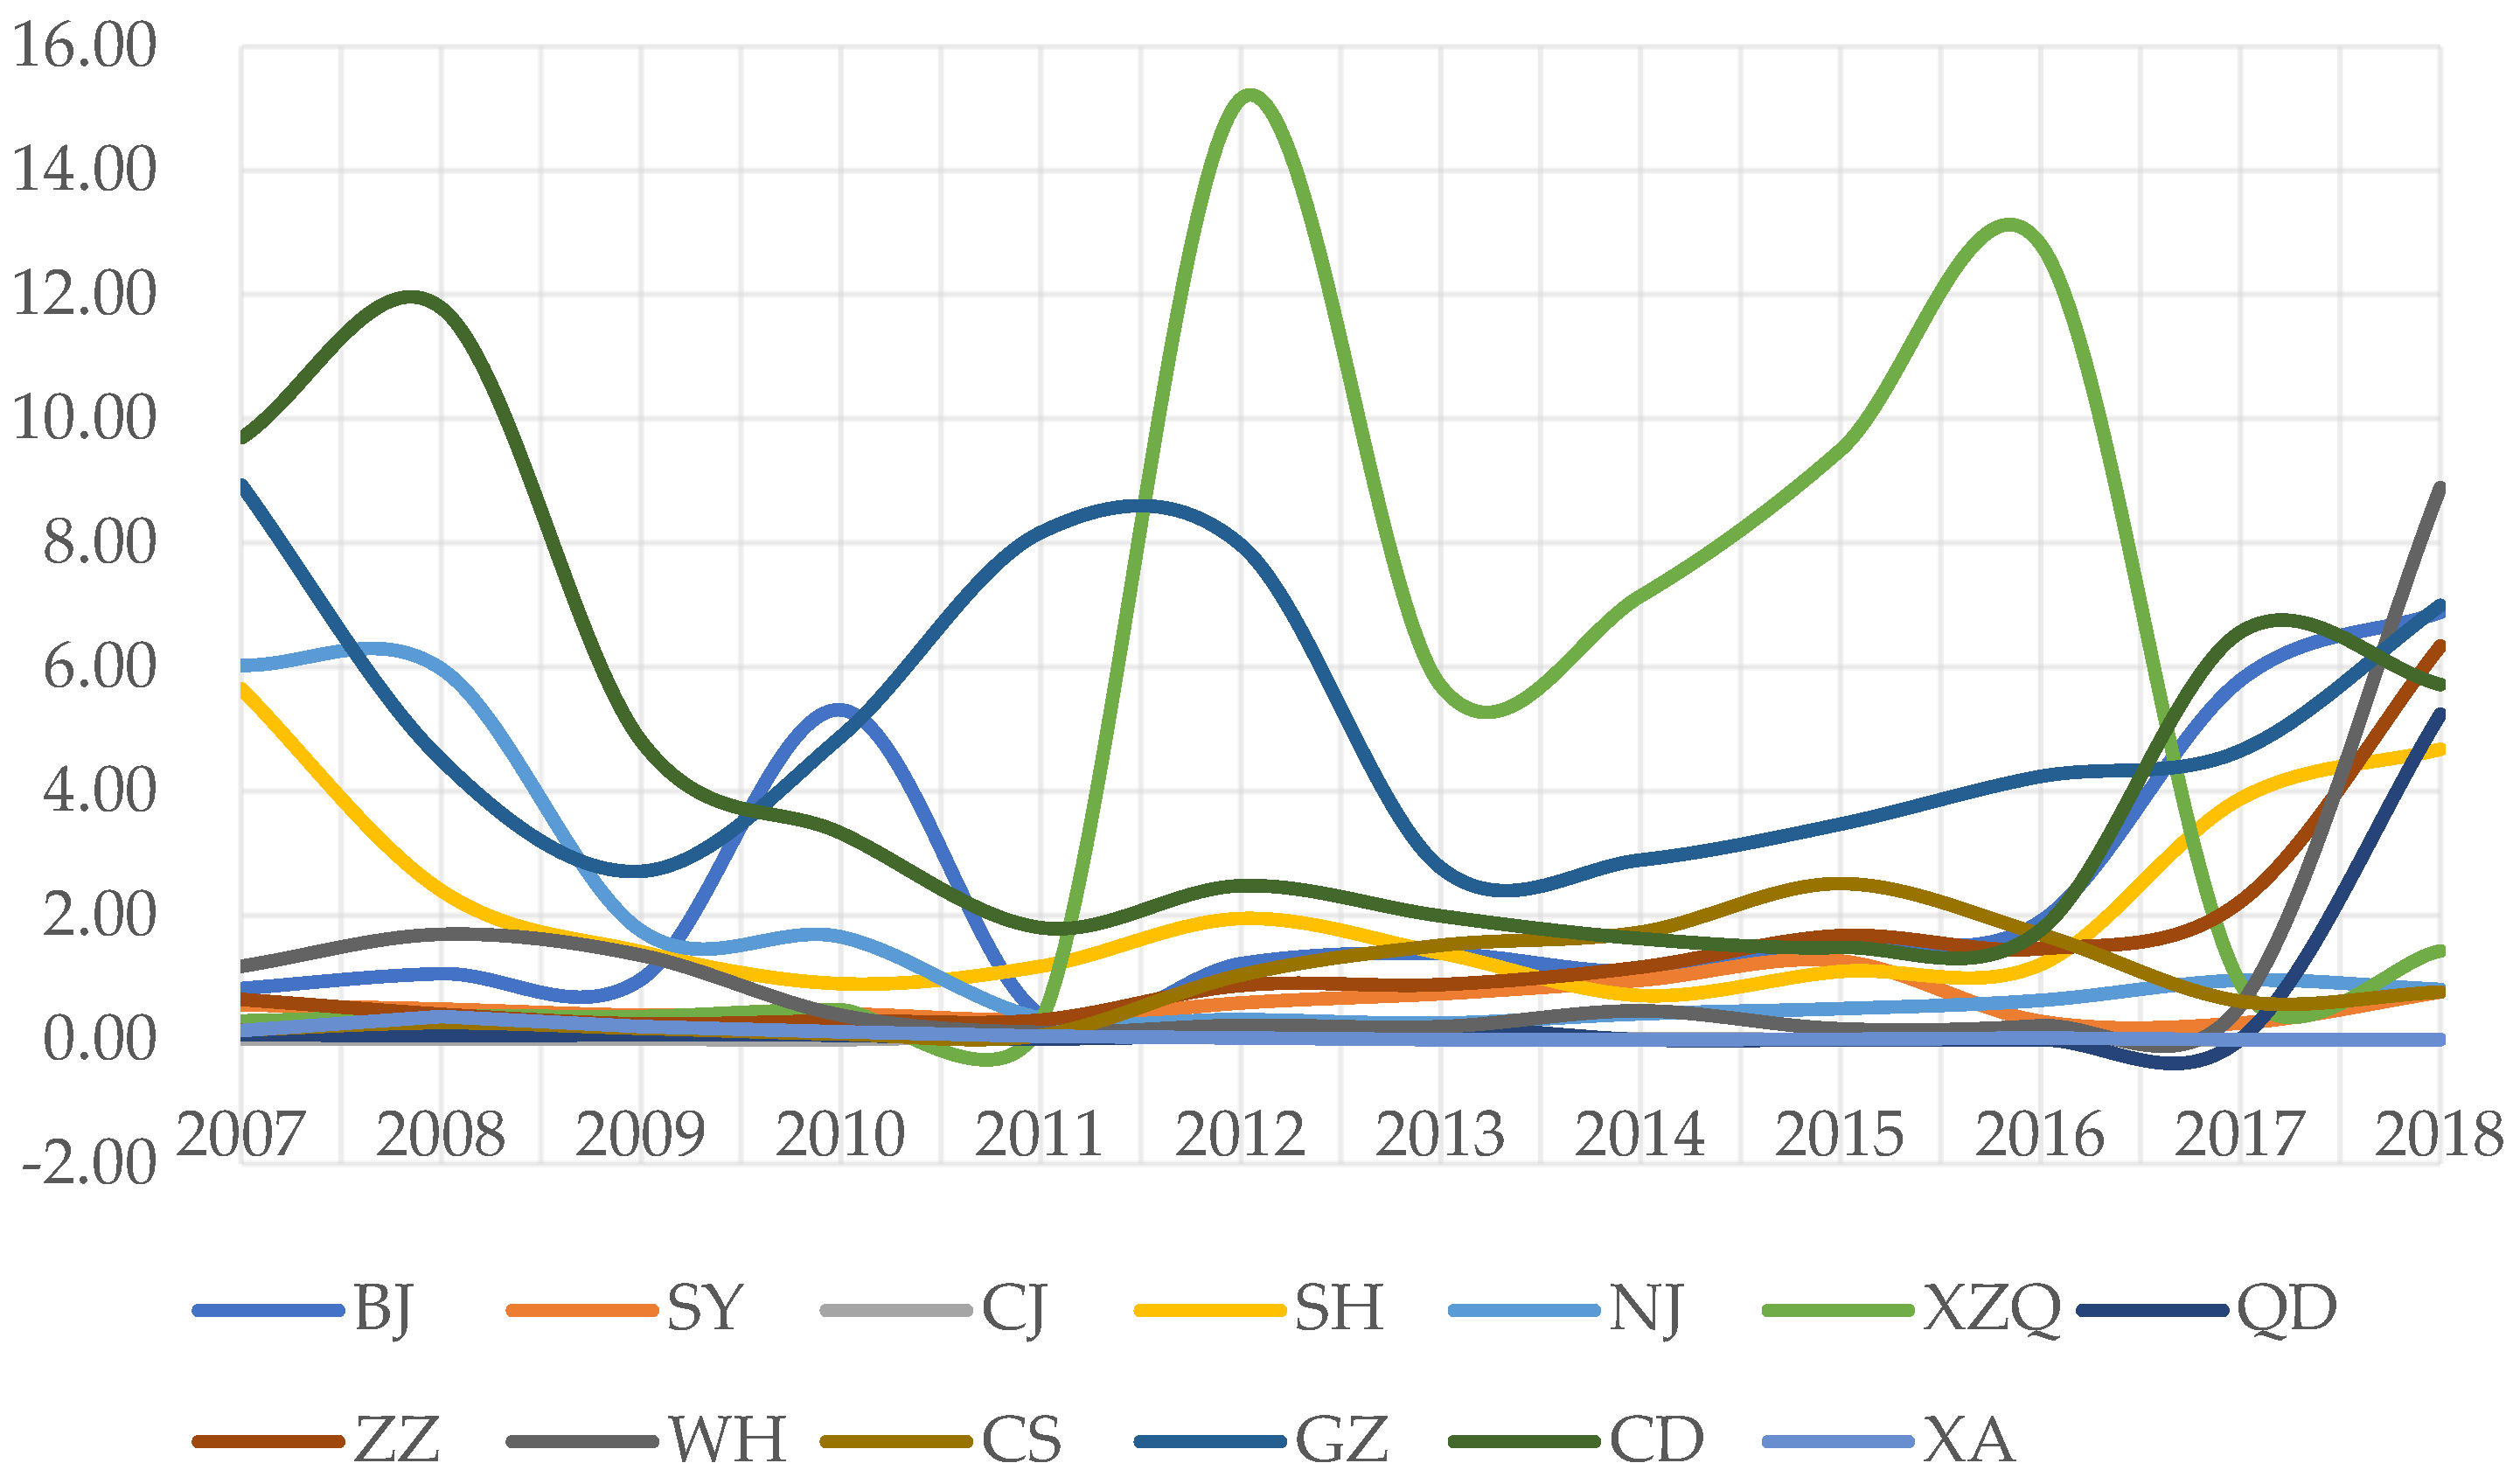
| Year | BJ | SY | CJ | SH | NJ | XZQ | QD | ZZ | WH | CS | GZ | CD | XA |
|---|---|---|---|---|---|---|---|---|---|---|---|---|---|
| 2007 | 0.83 | 0.56 | 0.01 | 5.65 | 6.03 | 0.30 | 0.09 | 0.65 | 1.18 | 0.16 | 8.94 | 9.70 | 0.14 |
| 2008 | 1.06 | 0.49 | 0.01 | 2.40 | 5.98 | 0.39 | 0.06 | 0.41 | 1.70 | 0.27 | 4.51 | 11.8 | 0.37 |
| 2009 | 0.98 | 0.40 | 0.01 | 1.42 | 1.76 | 0.38 | 0.08 | 0.26 | 1.36 | 0.18 | 2.71 | 4.81 | 0.21 |
| 2010 | 5.31 | 0.42 | 0.01 | 0.90 | 1.66 | 0.48 | 0.07 | 0.31 | 0.39 | 0.09 | 4.89 | 3.33 | 0.13 |
| 2011 | 0.39 | 0.33 | 0.07 | 1.18 | 0.35 | 0.29 | 0.01 | 0.32 | 0.12 | 0.07 | 8.17 | 1.81 | 0.06 |
| 2012 | 1.23 | 0.60 | 0.09 | 1.95 | 0.33 | 15.2 | 0.08 | 0.88 | 0.23 | 1.05 | 7.97 | 2.48 | 0.03 |
| 2013 | 1.39 | 0.74 | 0.04 | 1.40 | 0.27 | 5.70 | 0.20 | 0.89 | 0.21 | 1.52 | 2.77 | 1.99 | 0.00 |
| 2014 | 1.10 | 0.96 | 0.02 | 0.71 | 0.42 | 7.15 | 0.00 | 1.17 | 0.47 | 1.74 | 2.90 | 1.63 | 0.00 |
| 2015 | 1.56 | 1.27 | 0.01 | 1.10 | 0.50 | 9.50 | 0.01 | 1.68 | 0.18 | 2.52 | 3.47 | 1.49 | 0.01 |
| 2016 | 1.91 | 0.30 | 0.00 | 1.21 | 0.64 | 12.8 | 0.00 | 1.47 | 0.23 | 1.70 | 4.24 | 1.77 | 0.03 |
| 2017 | 5.79 | 0.27 | 0.00 | 3.88 | 0.96 | 0.90 | 0.01 | 2.23 | 0.56 | 0.62 | 4.66 | 6.57 | 0.00 |
| 2018 | 6.89 | 0.77 | 0.01 | 4.68 | 0.82 | 1.43 | 5.24 | 6.34 | 8.89 | 0.77 | 6.99 | 5.73 | 0.00 |
| Explanatory Variable | Explained Variable: the ECILU | ||||
|---|---|---|---|---|---|
| All Samples | Eastern Zone | Northeastern Zone | Central Zone | Western Zone | |
| gdp | 0.1213337 *** (0.000) | 0.1320097 *** (0.000) | 0.0770858 *** (0.001) | 0.0926126 *** (0.000) | −0.0573272 (0.447) |
| ic | −0.0038424 (0.870) | −0.0825258 ** (0.035) | 0.0622304 (0.124) | 0.0453927 (0.215) | 0.2991415 ** (0.002) |
| rpq | −0.0528232 *** (0.000) | −0.0590623 *** (0.000) | −0.0501857 *** (0.000) | −0.0332701 ** (0.002) | −0.0572474 *** (0.000) |
| drm | −0.0325802 ** (0.021) | −0.0325819 (0.120) | −0.0128263 (0.578) | −0.0378645 * (0.073) | 0.0424439 (0.561) |
| icl | −0.0240317 ** (0.007) | −0.0254135 ** (0.039) | 0.0209241 (0.138) | −0.0972003 *** (0.000) | −0.0121398 (0.758) |
| rg | −0.0053223 (0.427) | 0.0112974 (0.302) | −0.010946 ** (0.073) | 0.0767977 *** (0.000) | −0.0562089 ** (0.049) |
| wp | −0.0019175 (0.692) | −0.0157632 ** (0.025) | −0.0131907 * (0.084) | −0.0221559 ** (0.026) | 0.0305218 (0.129) |
| sp | −0.0245648 *** (0.000) | −0.0253258 *** (0.000) | −0.0245787 ** (0.002) | −0.0136374 * (0.058) | −0.0451033 ** (0.004) |
Publisher’s Note: MDPI stays neutral with regard to jurisdictional claims in published maps and institutional affiliations. |
© 2022 by the authors. Licensee MDPI, Basel, Switzerland. This article is an open access article distributed under the terms and conditions of the Creative Commons Attribution (CC BY) license (https://creativecommons.org/licenses/by/4.0/).
Share and Cite
Li, L.; Pan, C.; Ling, S.; Li, M. Ecological Efficiency of Urban Industrial Land in Metropolitan Areas: Evidence from China. Land 2022, 11, 104. https://doi.org/10.3390/land11010104
Li L, Pan C, Ling S, Li M. Ecological Efficiency of Urban Industrial Land in Metropolitan Areas: Evidence from China. Land. 2022; 11(1):104. https://doi.org/10.3390/land11010104
Chicago/Turabian StyleLi, Lei, Chenzi Pan, Shuai Ling, and Mingqi Li. 2022. "Ecological Efficiency of Urban Industrial Land in Metropolitan Areas: Evidence from China" Land 11, no. 1: 104. https://doi.org/10.3390/land11010104
APA StyleLi, L., Pan, C., Ling, S., & Li, M. (2022). Ecological Efficiency of Urban Industrial Land in Metropolitan Areas: Evidence from China. Land, 11(1), 104. https://doi.org/10.3390/land11010104