
Spatiotemporal Evolution and Driving Forces of Sustainable Development of Urban Human Settlements in China for SDGs

Abstract
1. Introduction
2. Data and Methods
2.1. Overview of Study Area
2.2. Data Source
2.3. Construction of Indicator System for Sustainable Development of Urban Human Settlements Based on SDGs
2.4. Research Methods
- 1.
- Coefficient of variation
- 2.
- Standardization of evaluation indicators
- 3.
- Combination weight determination
- 4.
- Measurement model of sustainable development of urban human settlements
- 5.
- Exploratory spatial data analysis method
- 6.
- GeoDetector
3. Temporal and Spatial Differentiation of Sustainable Development of Urban Human Settlements in China
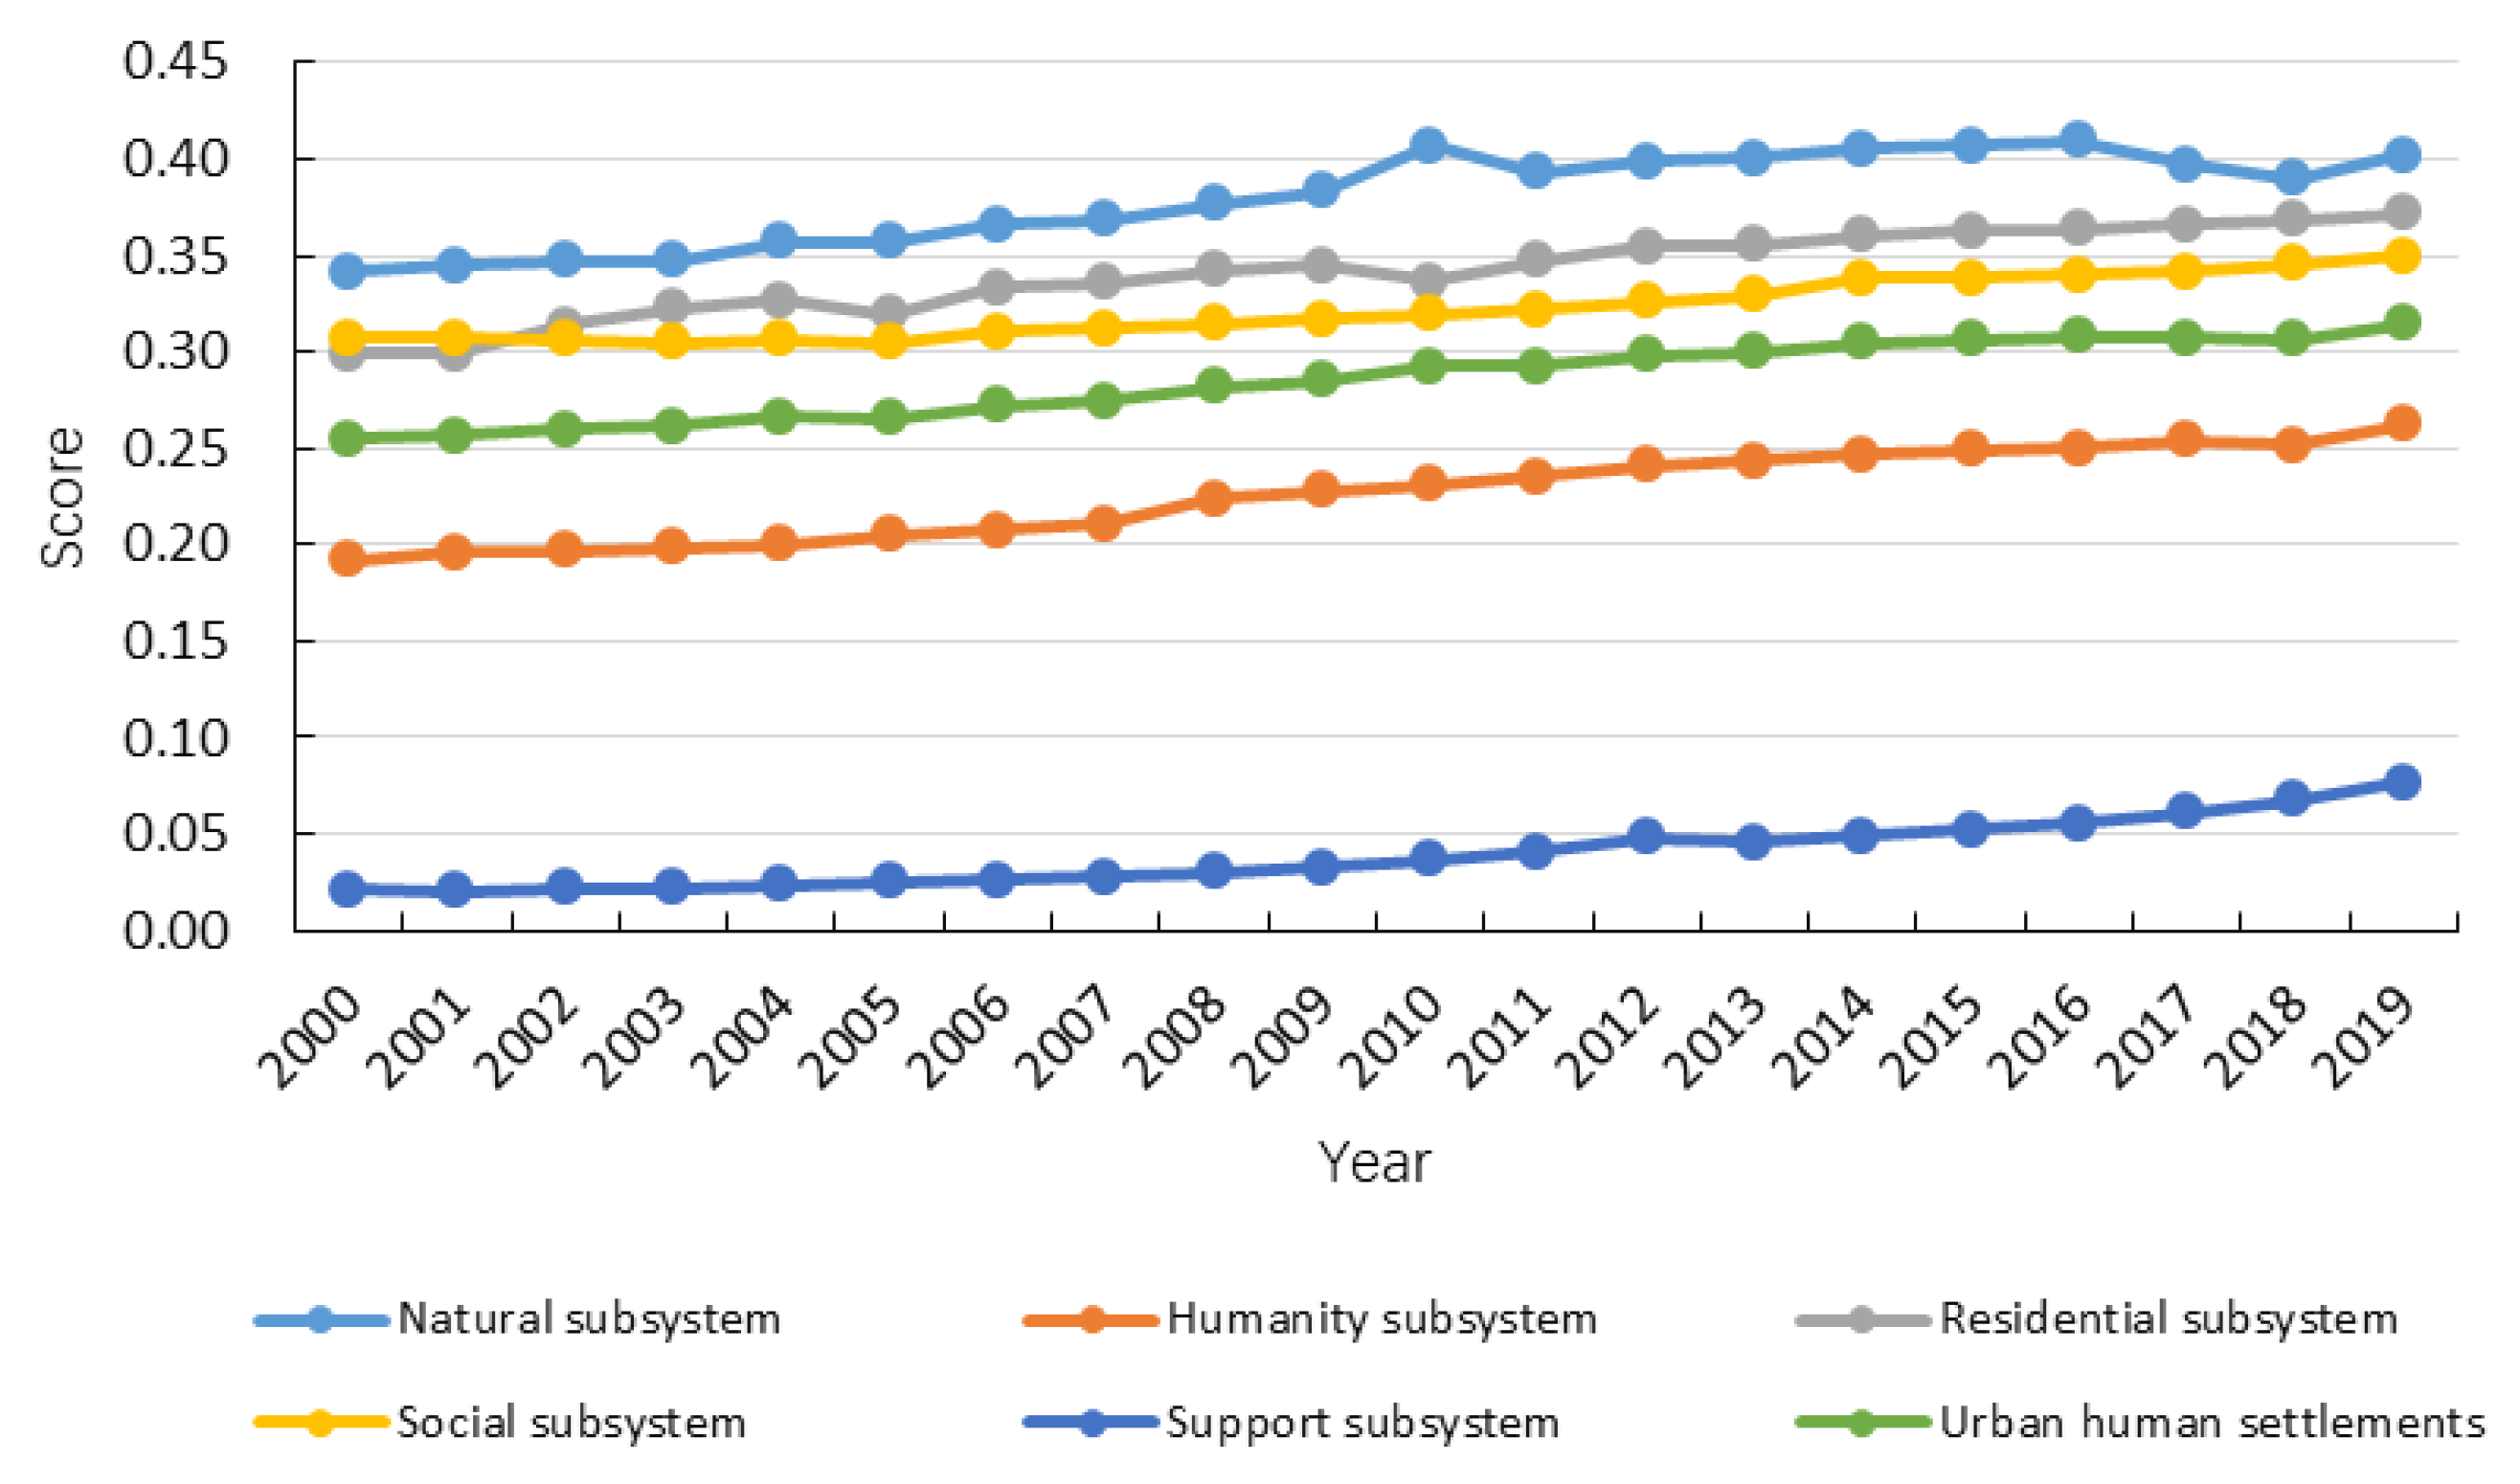
3.1. Development Trend
3.2. Temporal and Spatial Pattern
3.2.1. Spatial Pattern of Sustainable Development Level of Urban Human Settlements Subsystems
- 1.
- Natural system
- 2.
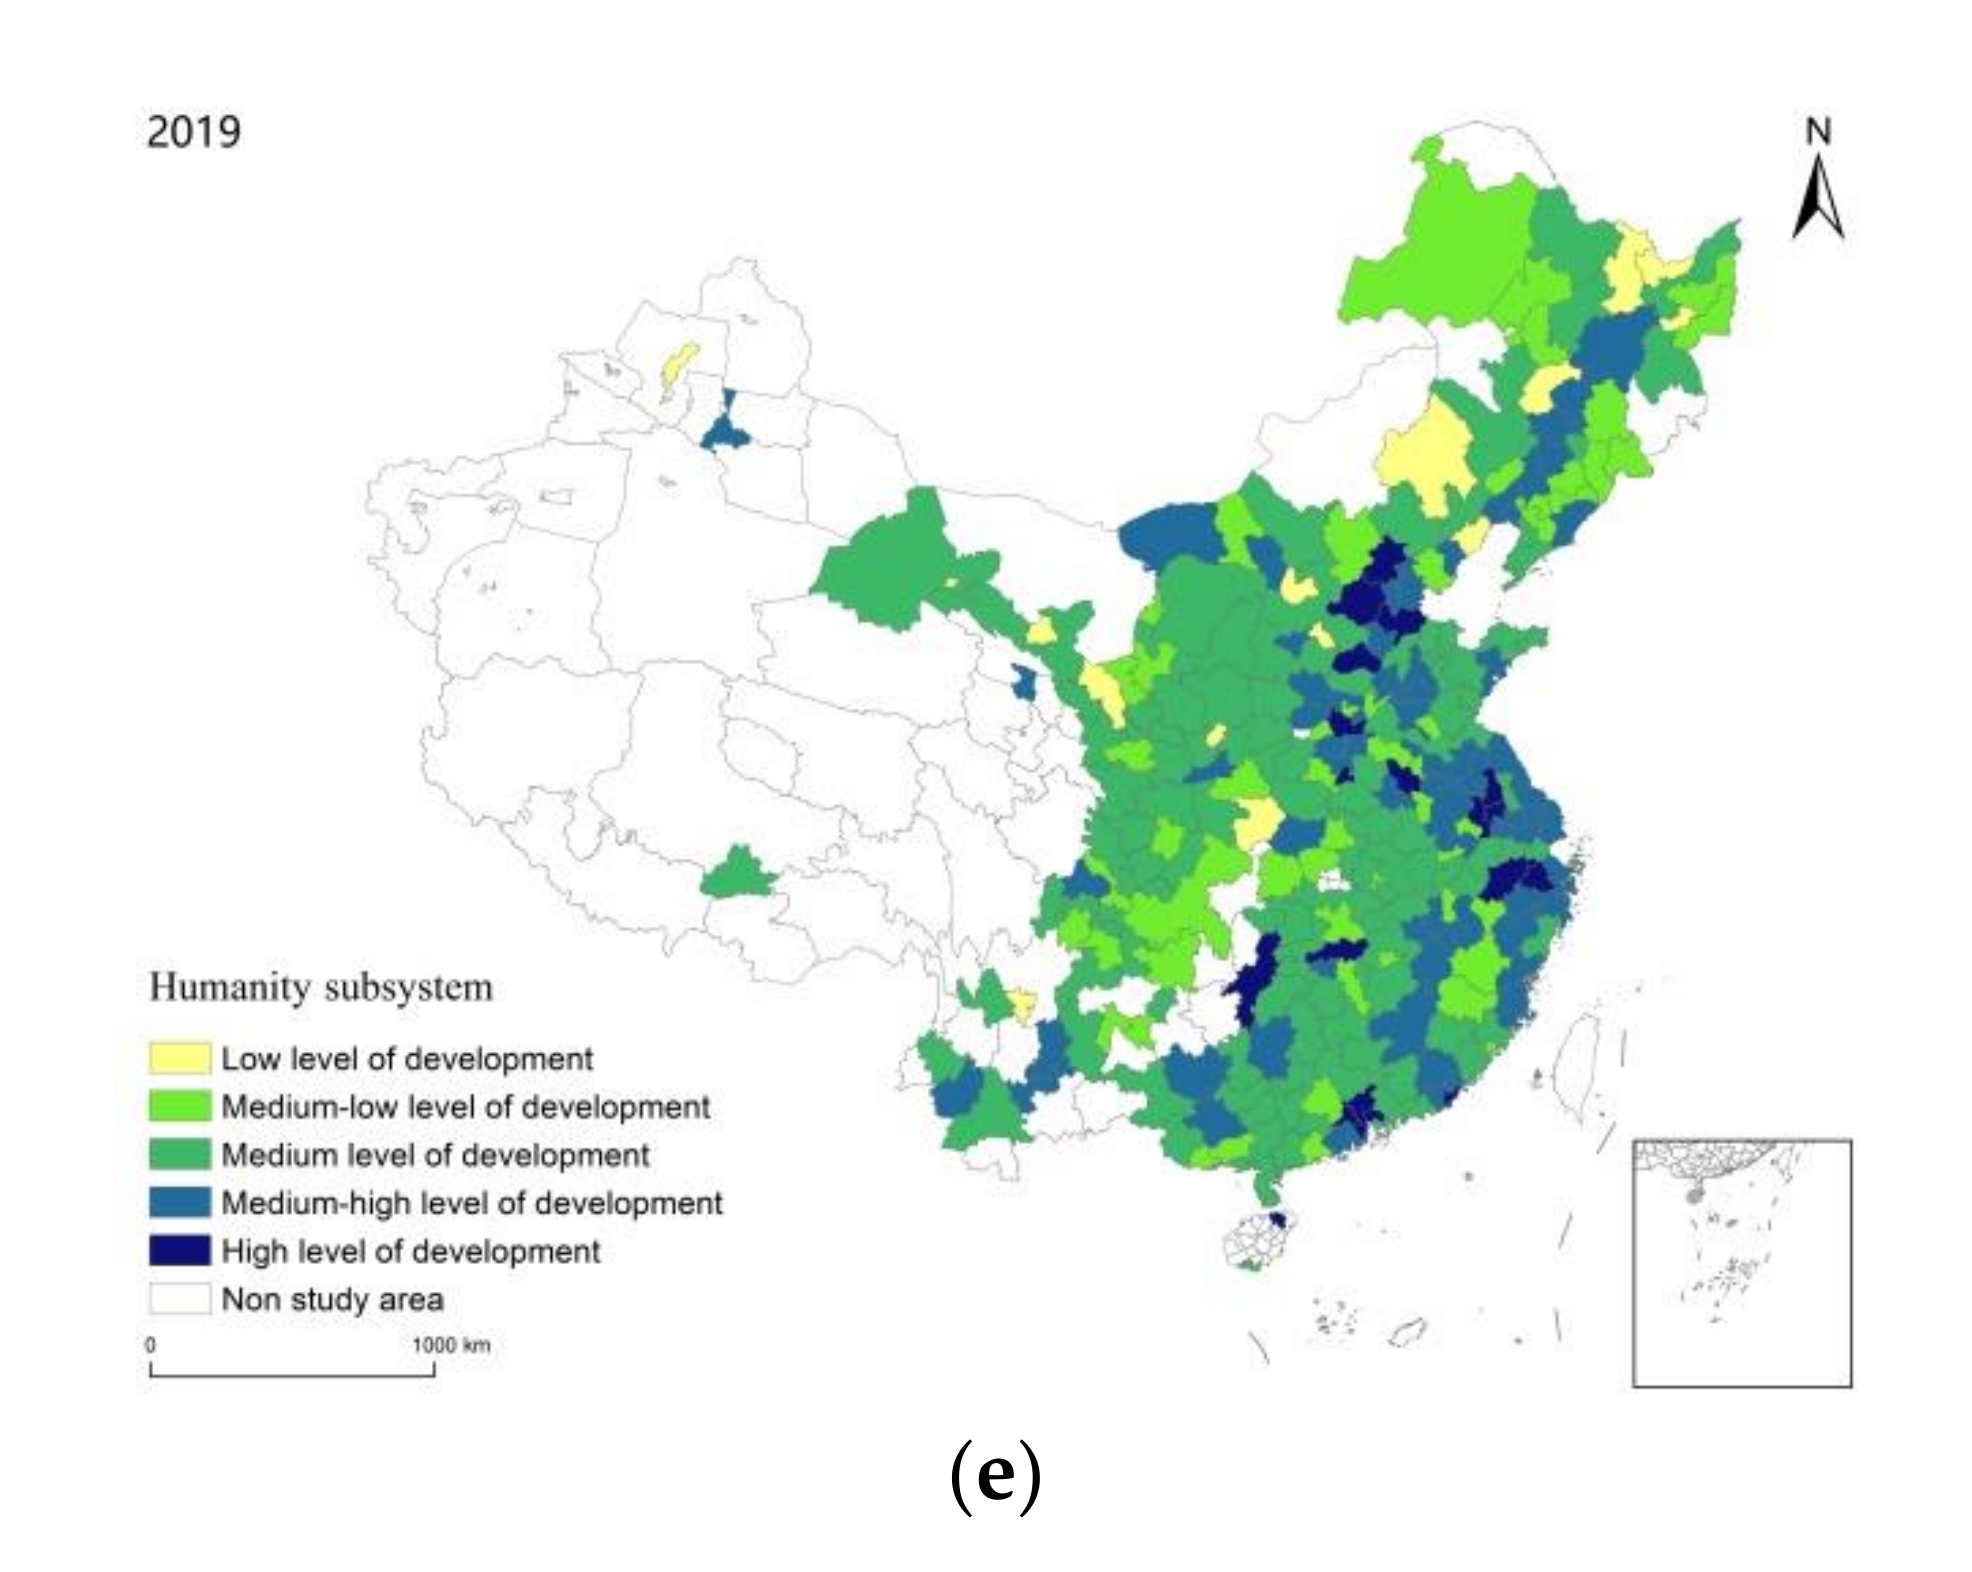
- Humanity system
- 3.
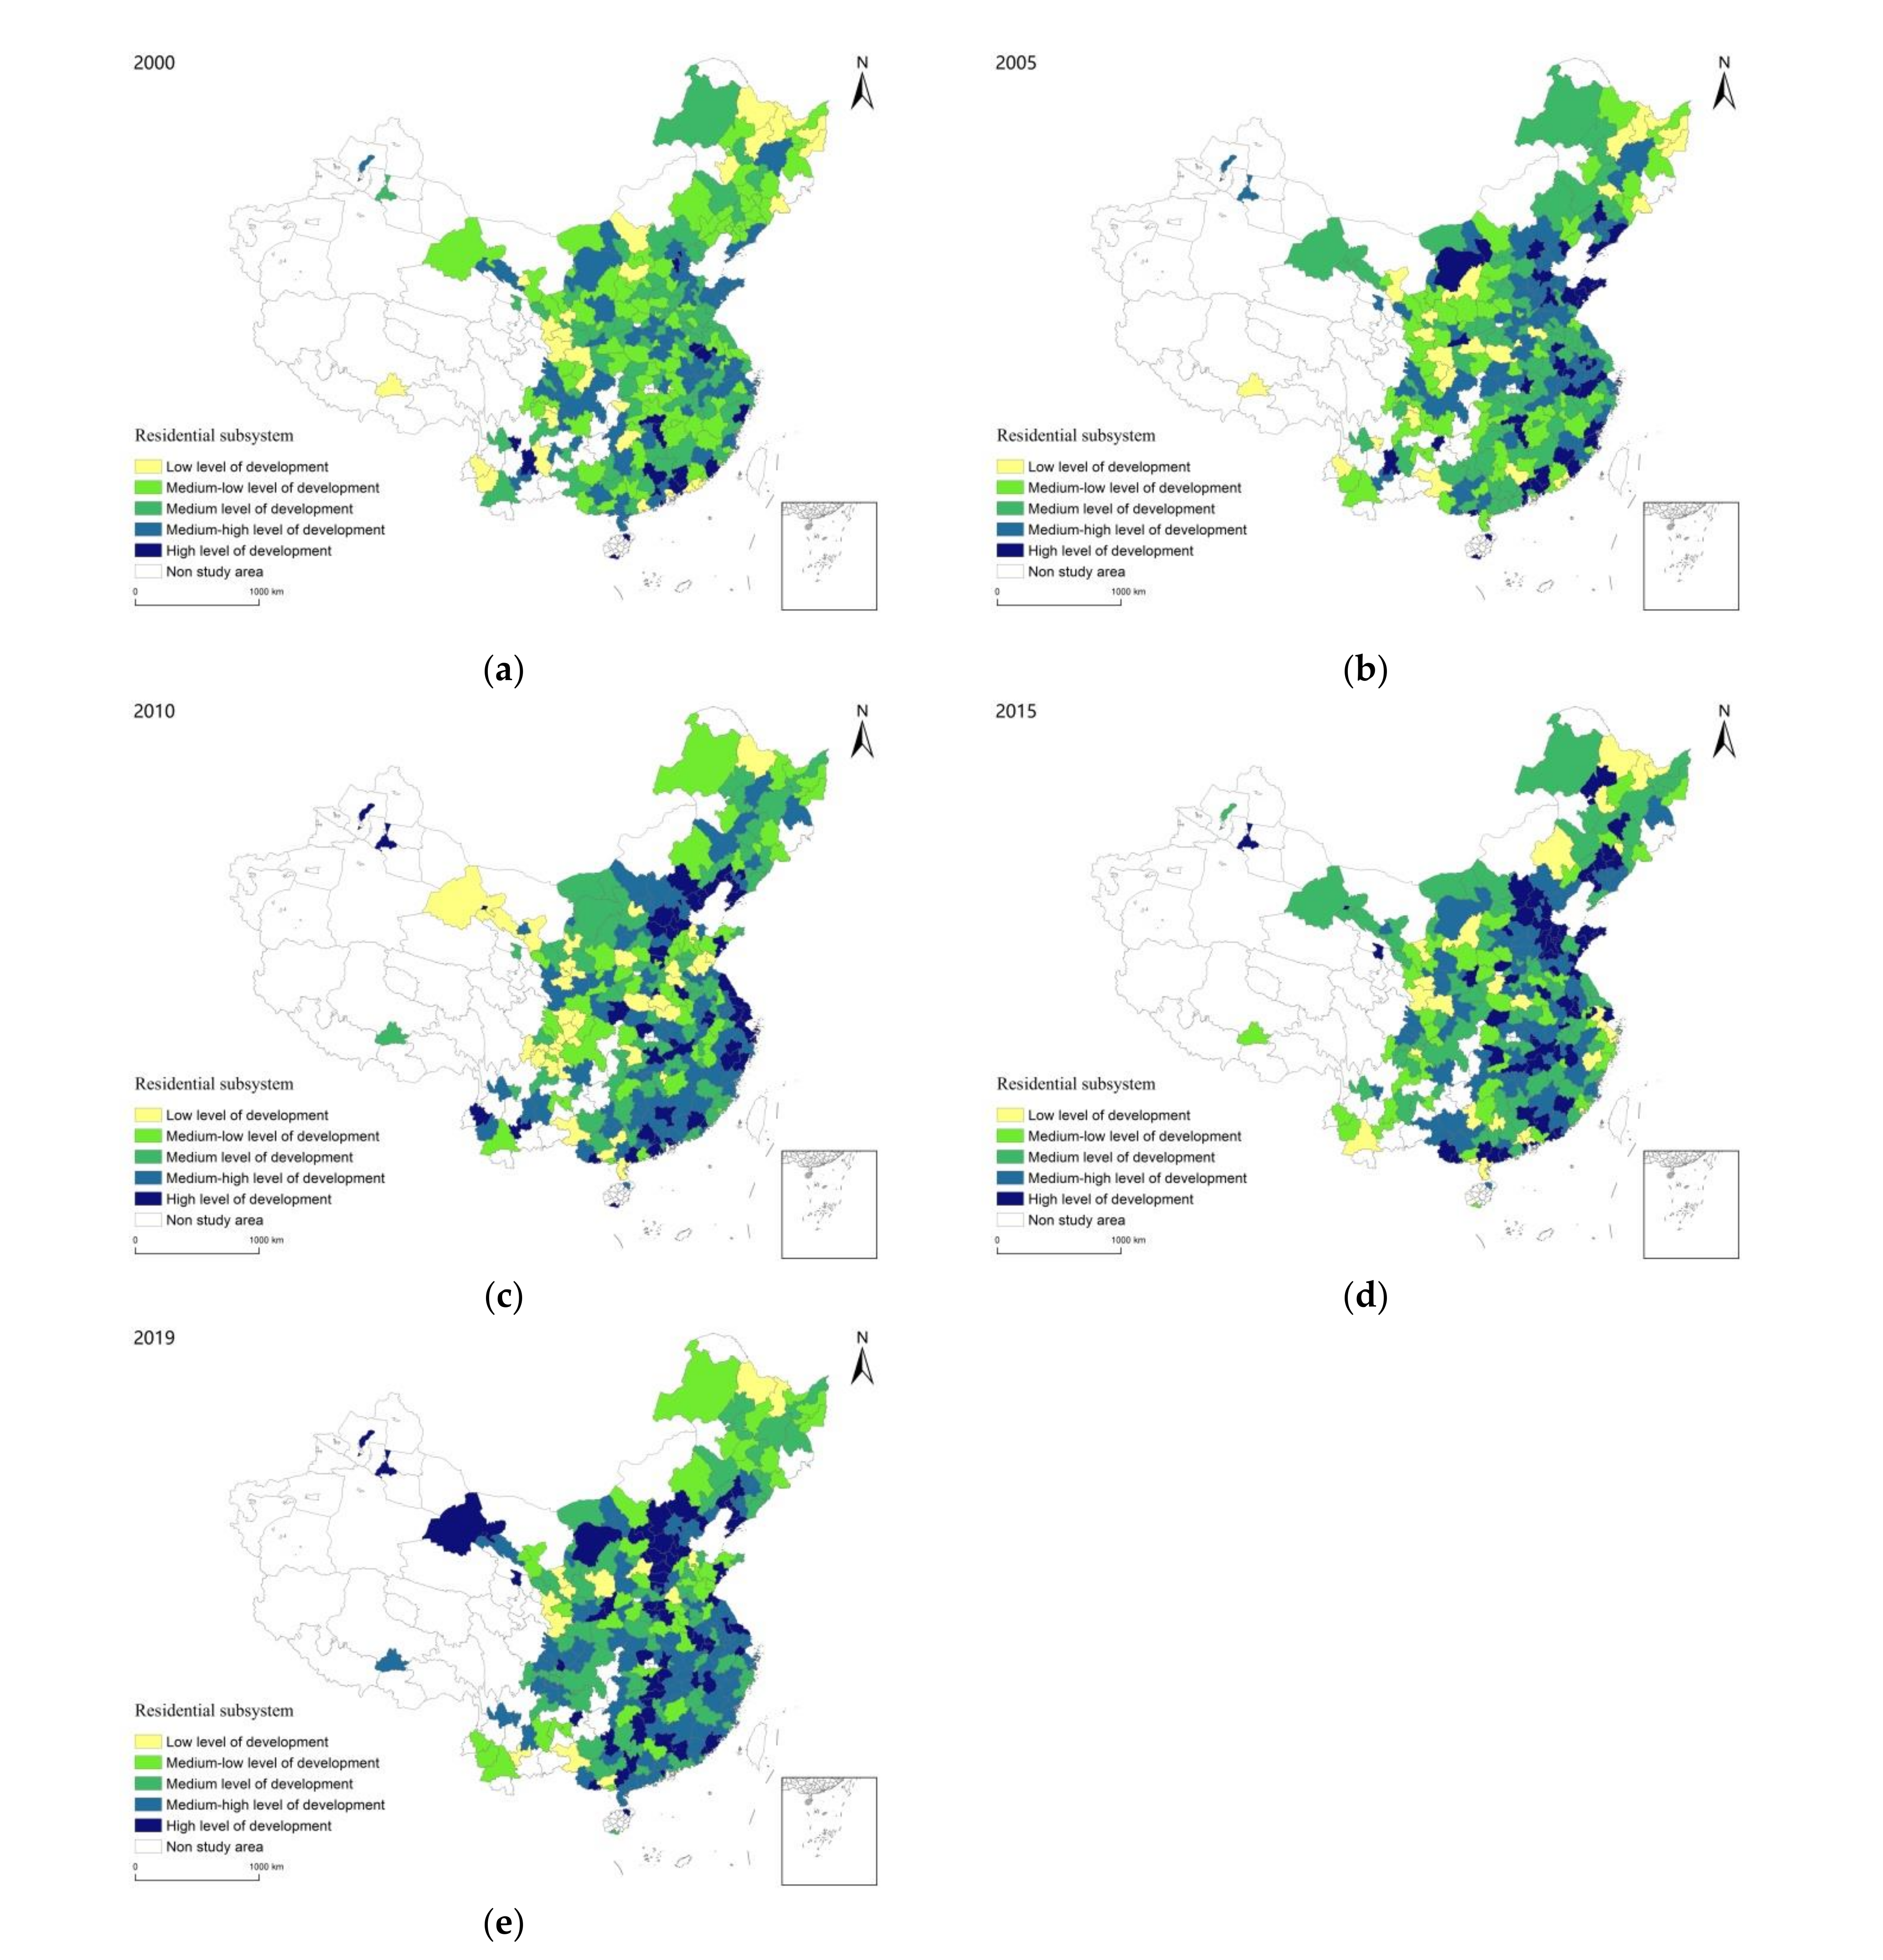
- Residential system
- 4.
- Social system
- 5.
- Support system
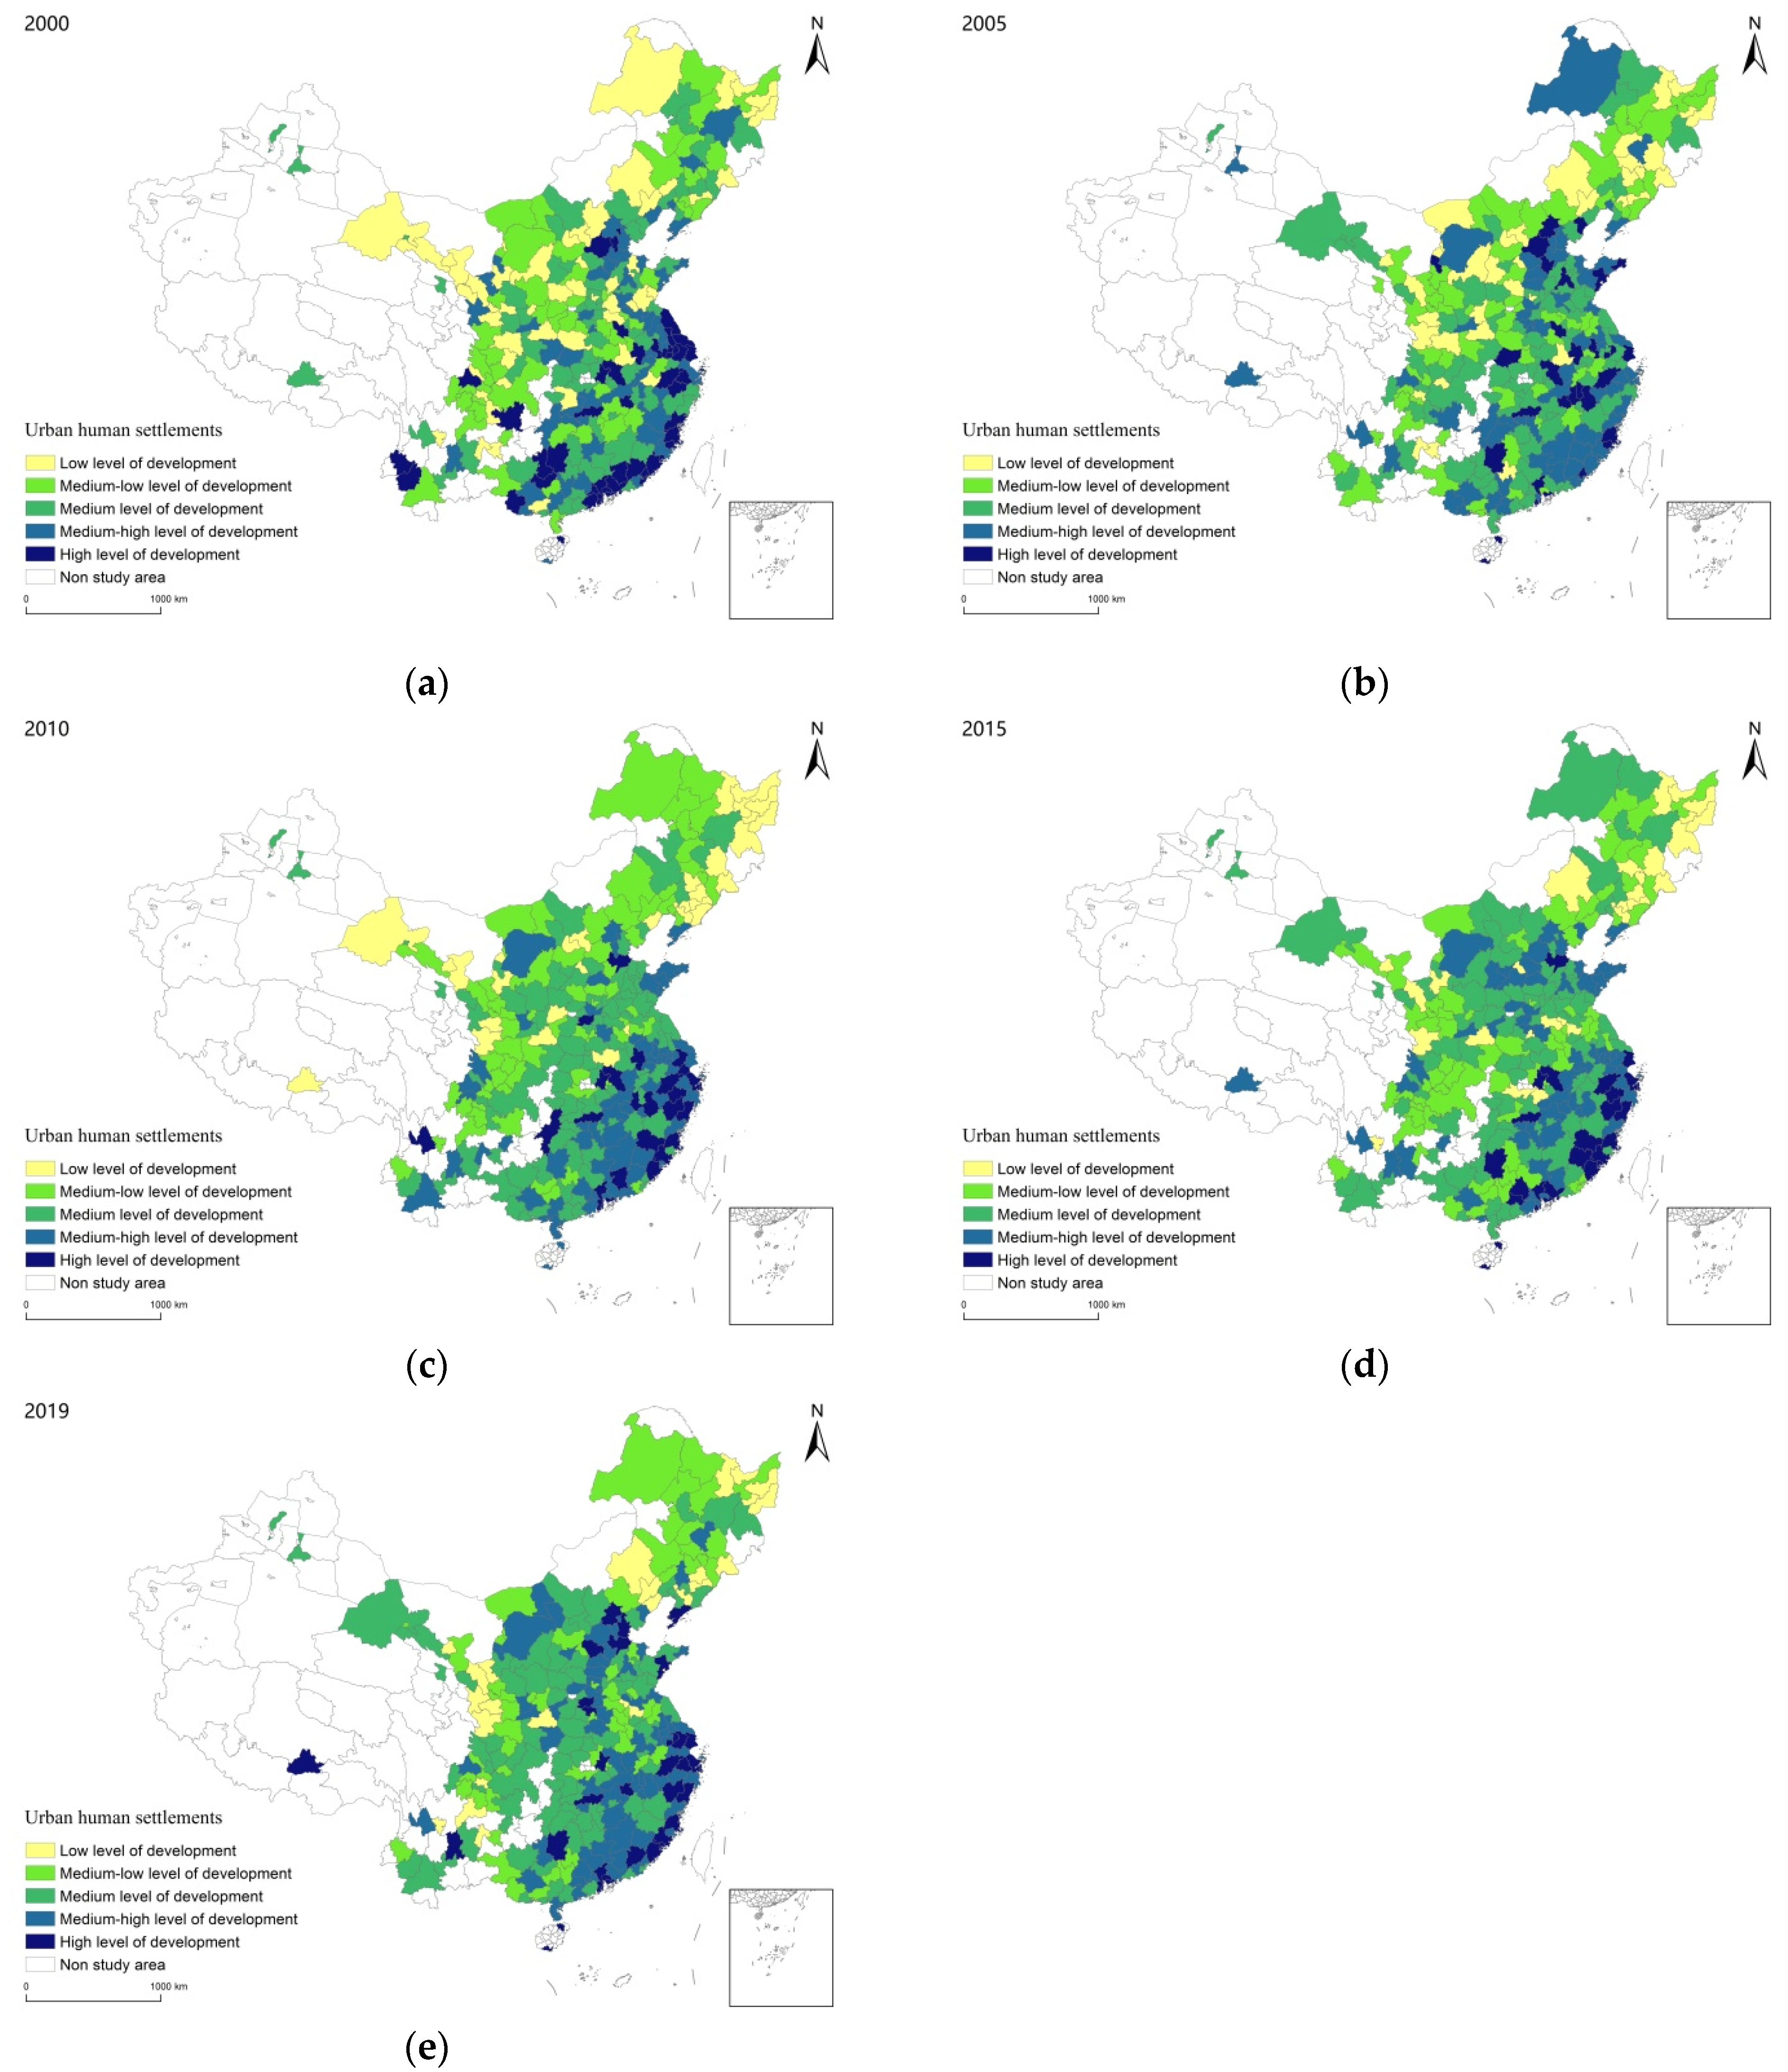
3.2.2. Spatial Pattern of Sustainable Development Level of Urban Human Settlements
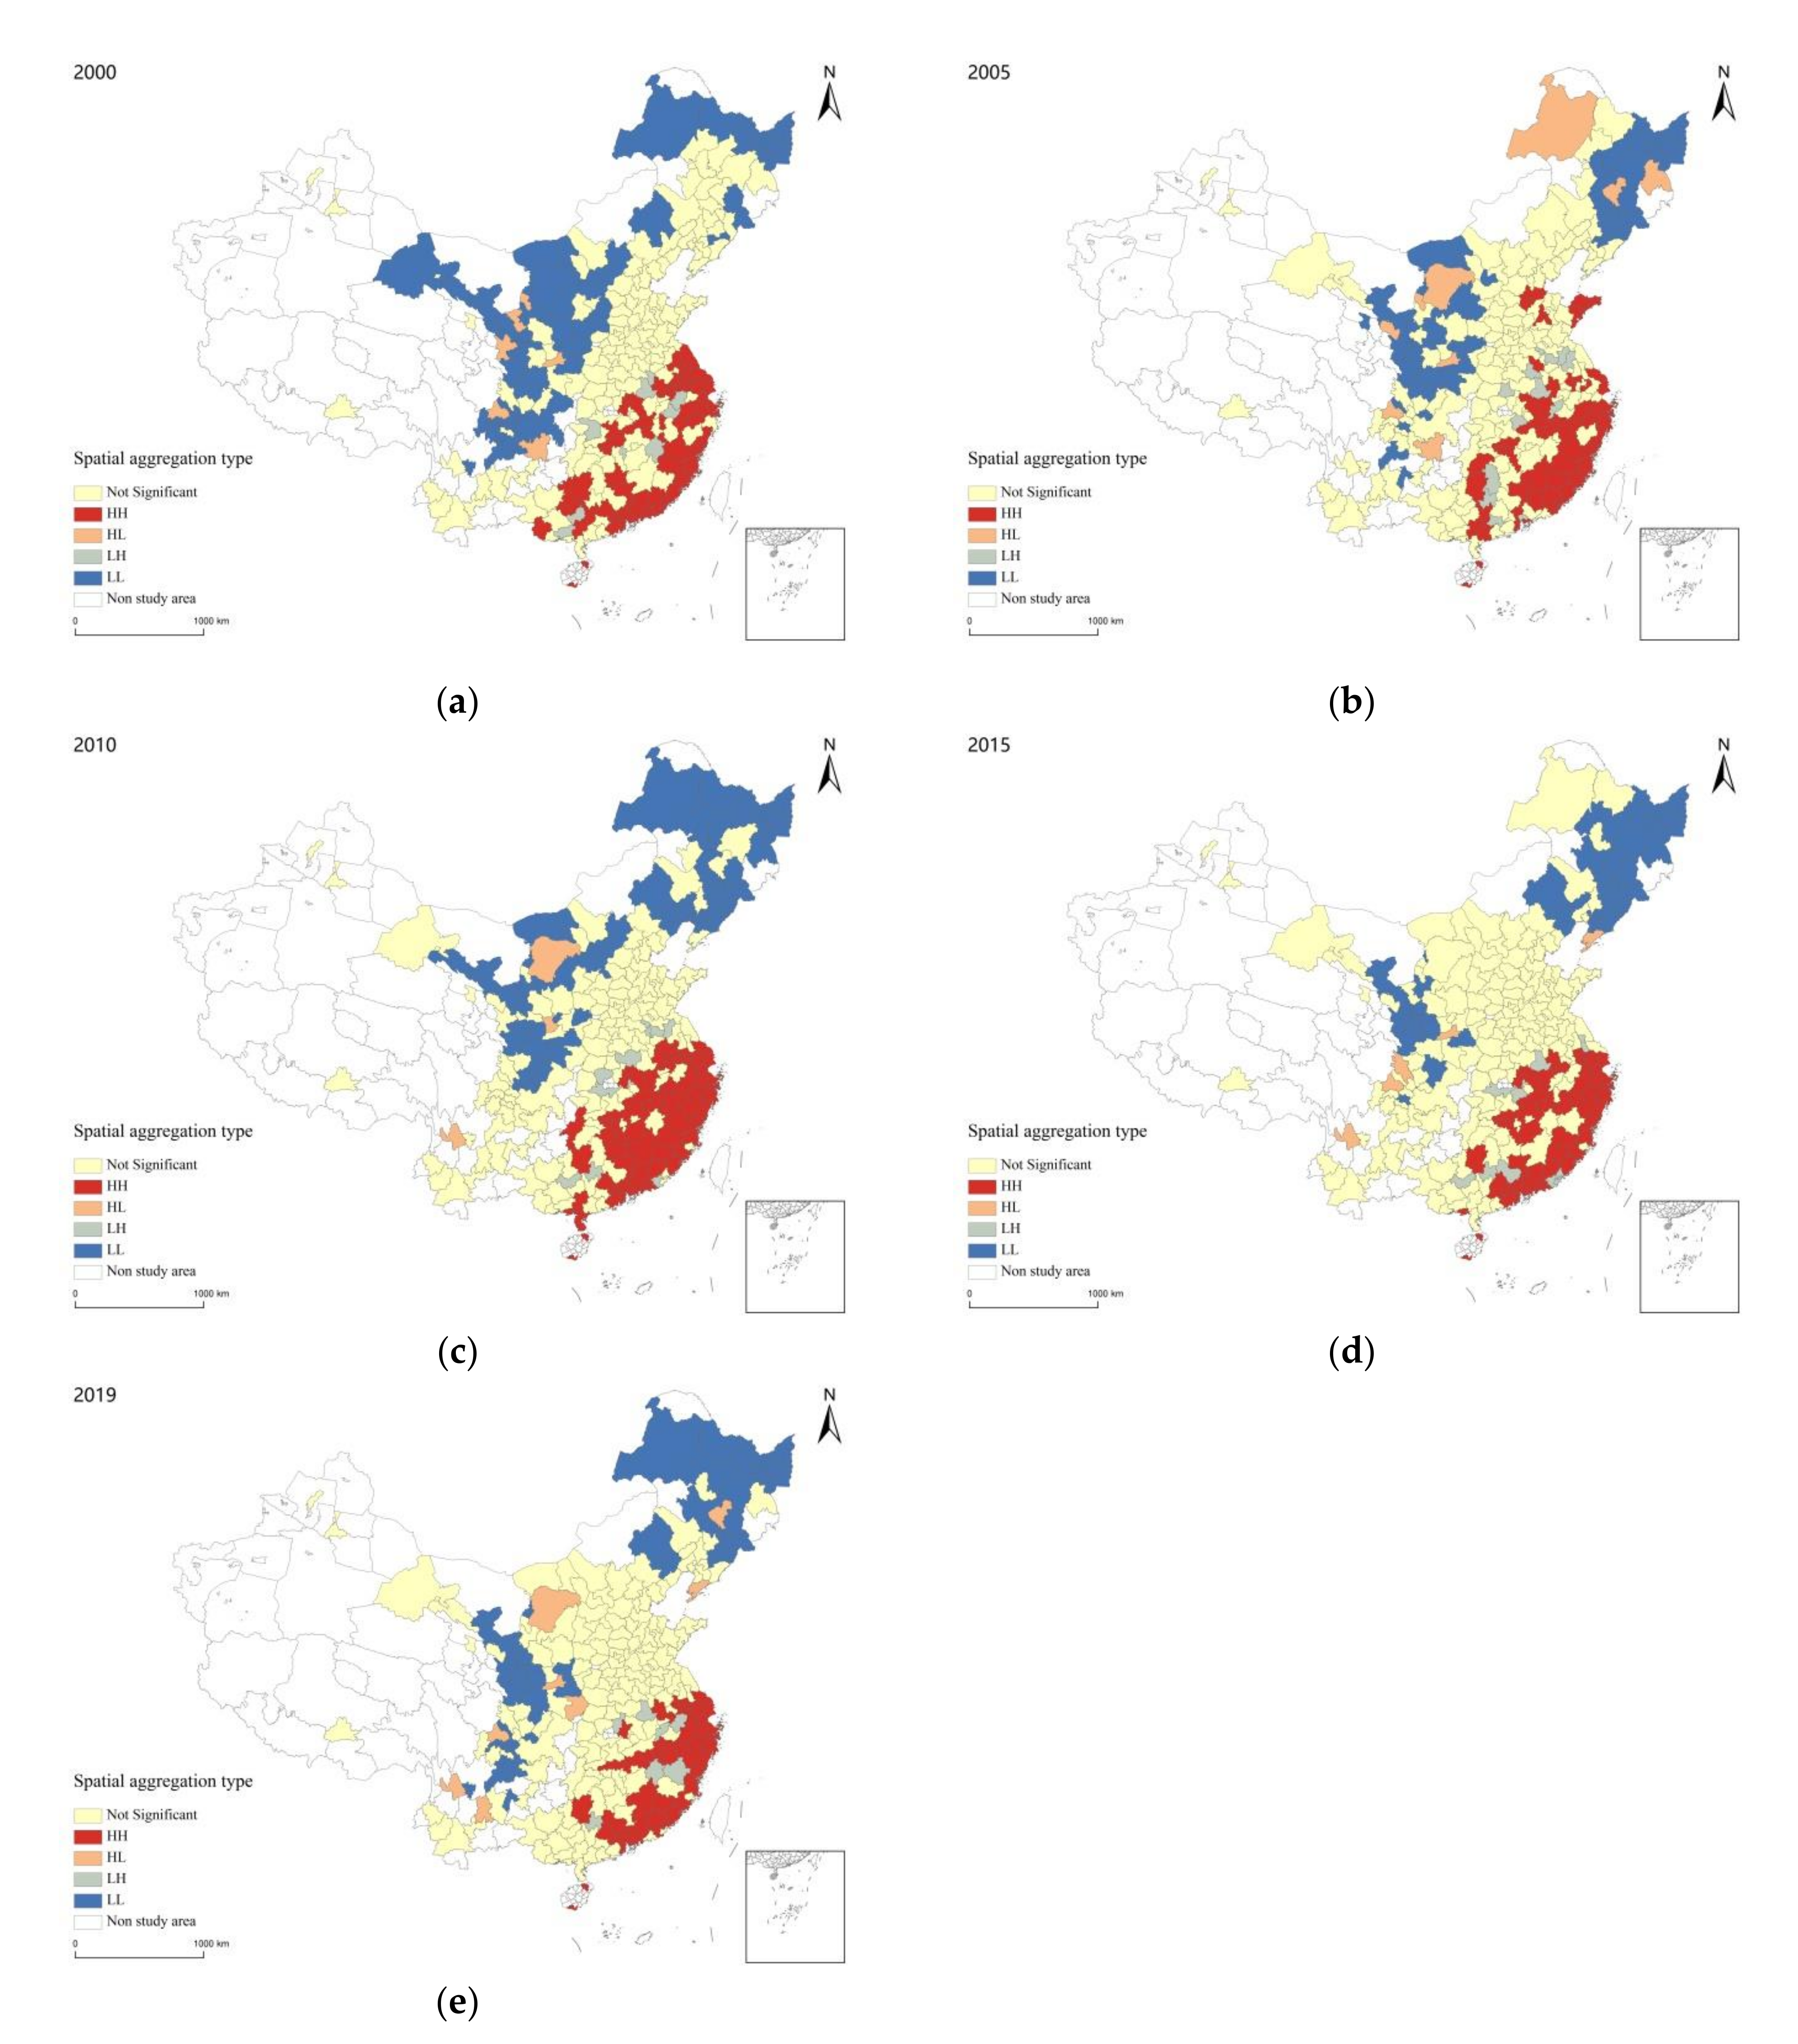
3.2.3. Spatial Correlation Pattern of Sustainable Development Level of Urban Human Settlements
3.3. Development Model
4. Driving Forces for Sustainable Development of Urban Human Settlements in China
- 1.
- Gross domestic product (GDP) per capita
- 2.
- Housing-price-to-income ratio
- 3.
- Investment in education and scientific research
- 4.
- Internet penetration rate
- 5.
- PM2.5 concentration
5. Discussion
6. Conclusions
Author Contributions
Funding
Data Availability Statement
Conflicts of Interest
References
- Chen, R.; Zhao, Z.; Xu, D.; Chen, Y. Progress of research on sustainable development index for cities and urban agglomerations. Prog. Geogr. 2021, 40, 61–72. [Google Scholar] [CrossRef]
- Yang, J.; Wang, Y.; Xiu, C.; Xiao, X.; Xia, J.; Jin, C. Optimizing local climate zones to mitigate urban heat island effect in human settlements. J. Clean. Prod. 2020, 275, 123767. [Google Scholar] [CrossRef]
- Guo, H.D.; Liang, D.; Chen, F.; Sun, Y.C.; Liu, J. Big earth data facilitates sustainable development goals. Bull. Chin. Acad. Sci. 2021, 36, 874–884. [Google Scholar] [CrossRef]
- Mao, Q. Theory and practice of the science of human settlements in China. Urban Plan. Int. 2019, 34, 54–63. [Google Scholar] [CrossRef]
- Brundtland, G.H. Report of the World Commission on Environment and Development: Our Common Future. Available online: https://sustainabledevelopment.un.org/content/documents/5987our-common-future.pdf (accessed on 8 September 2021).
- United Nations Transforming Our World: The 2030 Agenda for Sustainable Development. Available online: https://www.un.org/ga/search/view_doc.asp?symbol=A/RES/70/1&Lang=E (accessed on 8 September 2021).
- China’s Progress Report on Implementation of the 2030 Agenda for Sustainable Development 2019. Available online: https://www.fmprc.gov.cn/web/ziliao_674904/zt_674979/dnzt_674981/qtzt/2030kcxfzyc_686343/P020190924779471821881.pdf (accessed on 8 September 2021).
- Wu, L.Y. Introduction to Sciences of Human Settlements; China Architecture & Building Press: Beijing, China, 2001; ISBN 978-7-112-04506-8. [Google Scholar]
- Gao, F.; Zhao, X.Y.; Song, X.Y.; Wang, B.; Wang, P.L.; Niu, Y.B.; Wang, W.J.; Huang, C.L. Connotation and evaluation index system of beautiful China for SDGs. Adv. Earth Sci. 2019, 34, 295–305. [Google Scholar] [CrossRef]
- Howard, E. Garden Cities of Tomorrow; Jin, J.Y., Ed.; The Commercial Press: Beijing, China, 2017; ISBN 978-7-100-13386-9. [Google Scholar]
- Li, X.M.; Guo, Y.J.; Tian, S.Z.; Bai, Z.Z.; Liu, H. The Spatio-temporal pattern evolution and driving force of the coupling coordination degree of urban human settlements system in Liaoning province. Sci. Geogr. Sin. 2019, 39, 1208–1218. [Google Scholar] [CrossRef]
- Feng, Y.W.; Zhen, J.H.; Tian, Y.T.; Cao, Y.; Zhang, L.; Zhang, S.; Zhang, Y.F. Change in vulnerability of human settlement environment and its mechanism in Hohhot. Econ. Geogr. 2020, 40, 91–99. [Google Scholar] [CrossRef]
- Luo, X.; Yang, J.; Sun, W.; He, B. Suitability of human settlements in mountainous areas from the perspective of ventilation: A case study of the main urban area of Chongqing. J. Clean. Prod. 2021, 310, 127467. [Google Scholar] [CrossRef]
- Shekhar, H.; Schmidt, A.J.; Wehling, H.-W. Exploring wellbeing in human settlements—A spatial planning perspective. Habitat Int. 2019, 87, 66–74. [Google Scholar] [CrossRef]
- Bao, J.; Zhang, Y.; Li, X.; Guo, Q. From survival to self-actualization: Quantitative evaluation of human settlement envi-ronment from the perspective of hierarchy of needs theory: A case study of Anhui province. Urban Stud. 2020, 27, 88–95. [Google Scholar] [CrossRef]
- Ziółkowska-Weiss, K. Satisfaction with selected indicators of the quality of urban space by Polonia in the greater Toronto area. Land 2021, 10, 778. [Google Scholar] [CrossRef]
- Tian, S.Z.; Li, X.M.; Yang, J.; Zhang, W.; Guo, J.K. Spatio-temporal coupling coordination and driving mechanism of urban pseudo and reality human settlements in the three provinces of Northeast China. Acta Geogr. Sin. 2021, 76, 781–798. [Google Scholar] [CrossRef]
- Pierantoni, I.; Pierantozzi, M.; Sargolini, M. COVID 19—A qualitative review for the reorganization of human living environments. Appl. Sci. 2020, 10, 5576. [Google Scholar] [CrossRef]
- Sodiq, A.; Baloch, A.A.B.; Khan, S.A.; Sezer, N.; Mahmoud, S.; Jama, M.; Abdelaal, A. Towards modern sustainable cities: Review of sustainability principles and trends. J. Clean. Prod. 2019, 227, 972–1001. [Google Scholar] [CrossRef]
- Song, R.; Hu, Y.; Li, M. Chinese Pattern of Urban Development Quality Assessment: A Perspective Based on National Territory Spatial Planning Initiatives. Land 2021, 10, 773. [Google Scholar] [CrossRef]
- Yang, J.; You, H.; Zhang, Y.; Jin, C. Research progress on human settlements: From traditional data to big data+. Prog. Geogr. 2020, 39, 166–176. [Google Scholar] [CrossRef]
- Zhang, W.Z.; Xu, J.X.; Ma, R.F.; Ma, S.P. Basic connotation, current situation, and development orientation of high-quality development of Chinese cities: Based on the survey of residents. City. Plan. Rev. 2019, 43, 13–19. [Google Scholar] [CrossRef]
- Mele, C. Human settlements and sustainability: A crucial and open issue. In Proceedings of the E3S Web of Conferences, EDP Science and the Future 2 “Contradictions and Challenges”, Torino, Italy, 12–16 November 2018. [Google Scholar]
- Dahiya, B.; Das, A. New urban agenda in Asia-Pacific: Governance for sustainable and inclusive cities. In New U-Democrban Agenda in Asia-Pacy for Smart Ciftic; Dahiya, B., Daes, A., Eds.; Springer Science and Busingess Media: Berlin, Germany, 2019; pp. 3–36. [Google Scholar]
- Corbane, C.; Martino, P.; Panagiotis, P.; Aneta, F.J.; Michele, M.; Sergio, F.; Marcello, S.; Daniele, E.; Gustavo, N.; Thomas, K. The grey-green divide: Multi-temporal analysis of greenness across 10,000 urban centres derived from the Global Human Settlement Layer (GHSL). Int. J. Digit. Earth 2018, 13, 101–118. [Google Scholar] [CrossRef]
- Reyes Plata, J.A.R.; Elías Orozco, M.E.; Villaseñor, I.Z.J. Green infrastructure and social welfare. lessons for sustainable urban development in the metropolitan zone of Leon, Mexico. In Universitie the World Sustainable Community Series: Meeting the Goals of the Agenda 2030; Leal Filho, W., Tortato, U., Frankenberger, F., Eds.; Springer: Cham, Switzerland, 2019; pp. 71–88. [Google Scholar]
- Rozhenkova, V.; Allmang, S.; Ly, S.; Franken, D.; Heymann, J. The role of comparative city policy data in assessing progress toward the urban SDG targets. Cities 2019, 95, 102357. [Google Scholar] [CrossRef]
- Wang, F.; An, L.Z.; Dang, A.R.; Han, J.Y.; Miao, C.H.; Wang, J.; Zhang, G.H.; Zhao, Y. Human-land coupling and sustainable human settlements in the Yellow river basin. Geogr. Res. 2020, 39, 1707–1724. [Google Scholar] [CrossRef]
- Wang, J.C.; Wu, X.C.; Liu, J.; Zhang, Y.P.; Yu, Q.Y.; Wang, S.; Wang, Q.H. Sustainable innovation and practice based on rural ecological livable construction. Chin. Agric. Sci. Bull. 2020, 36, 159–164. [Google Scholar] [CrossRef]
- Osman, T.; Kenawy, E.; Abdrabo, K.I.; Shaw, D.; Alshamndy, A.; Elsharif, M.; Salem, M.; Alwetaishi, M.; Aly, R.M.; Elboshy, B. Voluntary Local Review Framework to Monitor and Evaluate the Progress towards Achieving Sustainable Development Goals at a City Level: Buraidah City, KSA and SDG11 as A Case Study. Sustainability 2021, 13, 9555. [Google Scholar] [CrossRef]
- Gonçalves, D.K.O.; Masiero, É.; Bragança, L.; Kakuda, F.M. Qualitative and quantitative assessment of urban sustainability in social housing using the Casa Azul label and SBTool urban in Brazil. Appl. Sci. 2020, 10, 6246. [Google Scholar] [CrossRef]
- Xu, X.; Gao, J.; Zhang, Z.; Fu, J. An assessment of Chinese pathways to implement the UN sustainable development goal-11 (SDG-11)—A case study of the Yangtze river delta urban agglomeration. Int. J. Environ. Res. Public Health 2019, 16, 2288. [Google Scholar] [CrossRef]
- Botequilha-Leitão, A.; Díaz-Varela, E.R. Performance based planning of complex urban social-ecological systems: The quest for sustainability through the promotion of resilience. Sustain. Cities Soc. 2020, 56, 102089. [Google Scholar] [CrossRef]
- Qi, X.H.; Chen, Y.; Chen, L.; Chen, J. Review of literatures on human settlements. World Reg. Stud. 2007, 16, 17–24. [Google Scholar] [CrossRef]
- Wüstemann, H.; Kalisch, D.; Kolbe, J. Access to urban green space and environmental inequalities in Germany. Landsc. Urban Plan. 2017, 164, 124–131. [Google Scholar] [CrossRef]
- Aalbers, C.; Kamphorst, D.; Langers, F. Fourteen local governance initiatives in greenspace in urban areas in the Netherlands. Discourses, success and failure factors, and the perspectives of local authorities. Urban For. Urban Green 2019, 42, 82–99. [Google Scholar] [CrossRef]
- Portney, K.E. Taking Sustainable Cities Seriously: Economic Development, The Environment, and Quality of Life in American Cities; MIT Press: Cambridge, MA, USA, 2013; ISBN 978-0-262-51827-7. [Google Scholar]
- Zhan, D.; Zhang, X. Study on construction experiences of world livable cities and its inspiration to Beijing. Urban Plan. Int. 2016, 31, 7–13. [Google Scholar] [CrossRef][Green Version]
- Li, F.; Zhang, X.B.; Liao, B.S.; Qian, A. Capability assessment of DMSP-OLS and NPP-VIIRS nighttime light data estimating statistical indicators:a case of county-level GDP, population and energy consumption in Beijing-Tianjin-Hebei region. Bull. Surv. Map. 2020, 9, 89–93. [Google Scholar] [CrossRef]
- Ciobotaru, A.-M.; Andronache, I.; Dey, N.; Petralli, M.; Daneshvar, M.R.M.; Wang, Q.; Radulovic, M.; Pintilii, R.-D. Temperature-humidity index described by fractal higuchi dimension affects tourism activity in the urban environment of focşani city (Romania). Theor. Appl. Clim. 2019, 136, 1009–1019. [Google Scholar] [CrossRef]
- Kong, F. Multi-temporal scale assessment of climate comfort of habitat environment and spatial differences in China. J. Arid Land Resour. Environ. 2020, 34, 102–111. [Google Scholar] [CrossRef]
- Fradkin, A. Early human settlement and natural formation of the Florida Everglades, USA: The Ichthyoarchaeological evidence. J. Archaeol. Sci. Rep. 2016, 8, 463–469. [Google Scholar] [CrossRef]
- Setioko, B.; Pandelaki, E.E.; Murtini, T.W. Towards Sustainable Urban Growth: The Unaffected Fisherman Settlement Setting (with Case Study Semarang Coastal Area). Procedia Environ. Sci. 2013, 17, 401–407. [Google Scholar] [CrossRef][Green Version]
- Cong, X.; Li, X.; Li, S.; Gong, Y. Research on sustainable development ability and spatial-temporal differentiation of urban human settlements in China and Japan based on SDGs, taking Dalian and Kobe as examples. Complexiry 2021, 1–22. [Google Scholar] [CrossRef]
- Das, J.T. Assessment of Sustainability and Resilience in Transportation Infrastructure Geotechnics. Ph.D. Thesis, The University of Texas at Arlington, Arlington, TX, USA, 2018. [Google Scholar]
- Wang, J.F.; Xu, C.D. Geodetector: Principle and prospective. Acta Geogr. Sin. 2017, 72, 116–134. [Google Scholar] [CrossRef]
- Xu, Z.; Chau, S.N.; Chen, X.; Zhang, J.; Li, Y.; Dietz, T.; Wang, J.; Winkler, J.A.; Fan, F.; Huang, B.; et al. Assessing progress towards sustainable development over space and time. Nat. Cell Biol. 2020, 577, 74–78. [Google Scholar] [CrossRef] [PubMed]
- Meng, W.Q.; Mo, X.Q.; Li, H.Y.; Hu, B.B.; He, M.X. Spatial difference in the sustainable development level based on extended exergy analysis: Based on the data resources of Chinese 31 provinces and cities. Acta Ecol. Sin. 2019, 39, 1701–1714. [Google Scholar] [CrossRef]
- Guo, Z.; Yao, S.M.; Chen, S.; Wu, W.; Liu, W.C. Spatial-temporal evolution of the livability levels in the Yangtze river delta urban agglomerations and its influencing factors. Econ. Geogr. 2020, 40, 79–88. [Google Scholar] [CrossRef]
- Jia, Z.H.; Gu, G.F. Urban livability and influencing factors in Northeast China: An empirical study based on panel data, 2007–2014. Prog. Geogr. 2017, 36, 832–842. [Google Scholar] [CrossRef]
- Luo, Z.F.; Zhang, J.; Liu, Y.T.; Zhu, L.X. Spatiotemporal evolution of urban greening in China and the affecting factors between 2000 and 2017. Arid Land Geogr. 2020, 43, 481–490. [Google Scholar] [CrossRef]
- Zhang, X.M.; Luo, S.; Li, X.M.; Li, Z.F.; Fan, Y.; Sun, J.W. Spatio-temporal variation features of air quality in China. Sci. Geogr. Sin. 2020, 40, 190–199. [Google Scholar] [CrossRef]
- Saleem, H.; Jiandong, W.; Aldakhil, A.M.; Nassani, A.A.; Abro, M.M.Q.; Zaman, K.; Khan, A.; Bin Hassan, Z.; Rameli, M.R.M. Socio-economic and environmental factors influenced the United Nations healthcare sustainable agenda: Evidence from a panel of selected Asian and African countries. Environ. Sci. Pollut. Res. 2019, 26, 14435–14460. [Google Scholar] [CrossRef]
- Yang, J.; Wang, Y.; Xue, B.; Li, Y.; Xiao, X.; Xia, J.C.; He, B. Contribution of urban ventilation to the thermal environment and urban energy demand: Different climate background perspectives. Sci. Total Environ. 2021, 795, 148791. [Google Scholar] [CrossRef] [PubMed]
- Liu, K.W.; Li, Q.C.; Wang, L.; Xiao, C. Coupling and coordination study of livable city and innovative city development in the Yangtze river delta. Geogr. Geoinf. Sci. 2019, 35, 120–126. [Google Scholar] [CrossRef]
- Li, C. Education for Sustainable Development: Global progress and China’s experience. Chin. J. Urban Environ. Stud. 2019, 7, 1–19. [Google Scholar] [CrossRef]
- Cao, Q.F.; Ni, P.F.; Ma, H.F. A Study on the impacts of scientific and technological innovations on the coordinated devel-opment of urban clusters—An analysis based on the urban sustainable competitiveness. J. Beijing Univ. Technol. (Soc. Sci. Ed.) 2020, 20, 51–58. [Google Scholar] [CrossRef]
- Koetter, T.; Sikder, S.K.; Weiss, D. The cooperative urban land development model in Germany—An effective instrument to support affordable housing. Land Use Policy 2021, 107, 105481. [Google Scholar] [CrossRef]
- Chen, Y.; Chen, X.M. Impact of house price and house price-to-income ratio on urbanization of china:empirical analysis based on spatial econometric model. Econ. Geogr. 2021, 41, 57–65. [Google Scholar] [CrossRef]
- Yin, S.; Ma, Z.; Song, W.; Liu, C. Spatial justice of a Chinese metropolis: A perspective on housing price-to-income ratios in Nanjing, China. Sustainability 2019, 11, 1808. [Google Scholar] [CrossRef]
- Han, Z.L.; Zhao, Q.H.; Zhao, D.X.; Guan, D.Y. Population and economic coupling coordinated evolution and spatial differ-ences at county level in Northeast China during 2000–2015: Taking Liaoning province as an example. Geogr. Res. 2019, 38, 3025–3037. [Google Scholar] [CrossRef]
- Zhou, L.; Che, L.; Sun, D.Q. The coupling coordination development between urbanization and economic growth and its influencing factors in China. Econ. Geogr. 2019, 39, 97–107. [Google Scholar] [CrossRef]
- Barkhatov, V. Instability of socio-economic and sustainable development of Ural regions. In Proceedings of the E3S Web of Conferences, Ural Environmental Science Forum “Sustainable Development of Industrial Region” (UESF-2021), Chelyabinsk, Russia, 17–19 February 2021. [Google Scholar]
- Chen, W.; Zhu, K.; Wu, Q.; Cai, Y.; Lu, Y.; Wei, J. Adaptability evaluation of human settlements in Chengdu based on 3S technology. Environ. Sci. Pollut. Res. 2021, 1–12. [Google Scholar] [CrossRef]
- Ren, W.; Xue, B.; Yang, J.; Lu, C. Effects of the Northeast China revitalization strategy on regional economic growth and social development. Chin. Geogr. Sci. 2020, 30, 791–809. [Google Scholar] [CrossRef]
- Du, D.L.; Huang, J.; Wang, J.E. Assessment of smart city development status in China based on multi-source data. J. Geoinf. Sci. 2020, 22, 1294–1306. [Google Scholar] [CrossRef]
- Cioacă, S.-I.; Cristache, S.-E.; Vuță, M.; Marin, E.; Vuță, M. Assessing the impact of ICT sector on sustainable development in the European Union: An empirical analysis using panel data. Sustainability 2020, 12, 592. [Google Scholar] [CrossRef]
- Asongu, S.A.; Odhiambo, N.M. How enhancing information and communication technology has affected inequality in Africa for sustainable development: An empirical investigation. Sustain. Dev. 2019, 27, 647–656. [Google Scholar] [CrossRef]


| System Layer | Index Layer | Corresponding to SDGs | Entropy Method Weight | AHP Weight | Comprehensive Weight |
|---|---|---|---|---|---|
| Natural system | Temperature and humidity index (X1) | SDG 11.6 | 0.0129 | 0.0671 | 0.0325 |
| Wind efficiency index (X2) | SDG 11.6 | 0.0144 | 0.0283 | 0.0223 | |
| PM2.5 concentration (X3) | SDG 11.6 | 0.0292 | 0.0379 | 0.0368 | |
| Green coverage rate in built-up area (X4) | SDG 15.2 | 0.0178 | 0.0528 | 0.0339 | |
| Park green area per capita (X5) | SDG 11.7 | 0.0209 | 0.0196 | 0.0224 | |
| Sewage treatment rate (X6) | SDG 6.3 | 0.0153 | 0.0528 | 0.0314 | |
| Harmless treatment rate of domestic garbage (X7) | SDG 11.6 | 0.0145 | 0.0240 | 0.0206 | |
| Water consumption per unit GDP (X8) | SDG 6.4 | 0.0468 | 0.0501 | 0.0535 | |
| Energy consumption per unit of GDP (X9) | SDG 12.2 | 0.0130 | 0.0125 | 0.0141 | |
| Comprehensive utilization rate of industrial solid waste (X10) | SDG 12.5 | 0.0133 | 0.0691 | 0.0335 | |
| Humanity system | The population density (X11) | SDG 11.3 | 0.0125 | 0.0333 | 0.0225 |
| Natural growth rate (X12) | SDG 11.3 | 0.0113 | 0.0178 | 0.0157 | |
| Sex ratio (X13) | SDG 5.1 | 0.0111 | 0.0096 | 0.0114 | |
| Aging rate (X14) | SDG 11.3 | 0.0151 | 0.0178 | 0.0181 | |
| Number of college students per 10,000 (X15) | SDG 4.3 | 0.0199 | 0.0140 | 0.0185 | |
| Compulsory education teacher-student ratio (X16) | SDG 4.1 | 0.0135 | 0.0124 | 0.0143 | |
| Percentage of education expenditure (X17) | SDG 1.a | 0.0360 | 0.0095 | 0.0204 | |
| R&D investment intensity (X18) | SDG 9.5 | 0.0491 | 0.0295 | 0.0420 | |
| Number of patents granted per 10,000 people (X19) | SDG 9.5 | 0.0139 | 0.0098 | 0.0129 | |
| Residential system | Housing area per capita (X20) | SDG 11.1 | 0.0414 | 0.1014 | 0.0716 |
| House price to income ratio (X21) | SDG 11.1 | 0.0275 | 0.0338 | 0.0337 | |
| Per capita residential investment (X22) | SDG 11.1 | 0.0340 | 0.0338 | 0.0374 | |
| Water supply penetration rate (X23) | SDG 6.1 | 0.0137 | 0.0338 | 0.0238 | |
| Gas penetration rate (X24) | SDG 7.1 | 0.0191 | 0.0113 | 0.0162 | |
| Social system | GDP per capita (X25) | SDG 8.1 | 0.0572 | 0.0236 | 0.0406 |
| The proportion of tertiary industry in GDP (X26) | SDG 8.2 | 0.0279 | 0.0137 | 0.0216 | |
| Public fiscal revenue as a proportion of GDP (X27) | SDG 8.1 | 0.0287 | 0.0087 | 0.0175 | |
| Export dependence (X28) | SDG 17.11 | 0.0261 | 0.0047 | 0.0122 | |
| Urban registered unemployment rate (X29) | SDG 10.2 | 0.0223 | 0.0158 | 0.0207 | |
| Per capita disposable income growth rate (X30) | SDG 8.1 | 0.0229 | 0.0240 | 0.0259 | |
| Per capita food production (X31) | SDG 2.1 | 0.0223 | 0.0129 | 0.0187 | |
| Per capita aquatic product output (X32) | SDG 14.4 | 0.0283 | 0.0042 | 0.0120 | |
| Number of criminal cases per 10,000 people (X33) | SDG 16.1 | 0.0221 | 0.0284 | 0.0277 | |
| Support system | Number of physicians per 10,000 people (X34) | SDG 3.8 | 0.0317 | 0.0249 | 0.0310 |
| Number of stadiums owned by 10,000 people (X35) | SDG 9.1 | 0.0300 | 0.0031 | 0.0107 | |
| Number of cultural centers owned by 10,000 people (X36) | SDG 11.4 | 0.0256 | 0.0031 | 0.0098 | |
| Mobile phone penetration rate (X37) | SDG 9.c | 0.0422 | 0.0132 | 0.0261 | |
| Internet penetration rate (X38) | SDG 9.c | 0.0473 | 0.0132 | 0.0276 | |
| Road network density (X39) | SDG 11.2 | 0.0125 | 0.0068 | 0.0102 | |
| Number of buses owned by 10,000 people (X40) | SDG 11.2 | 0.0368 | 0.0178 | 0.0283 |
| Ranking | 2000 | 2005 | 2010 | 2015 | 2019 | |||||
|---|---|---|---|---|---|---|---|---|---|---|
| Cities | Scores | Cities | Scores | Cities | Scores | Cities | Scores | Cities | Scores | |
| 1 | Shenzhen | 0.330 | Shenzhen | 0.310 | Shenzhen | 0.387 | Shenzhen | 0.361 | Shenzhen | 0.382 |
| 2 | Guangzhou | 0.313 | Hangzhou | 0.305 | Hangzhou | 0.372 | Guangzhou | 0.354 | Shanghai | 0.380 |
| 3 | Hangzhou | 0.306 | Changsha | 0.304 | Guangzhou | 0.370 | Shanghai | 0.354 | Beijing | 0.378 |
| 4 | Shanghai | 0.303 | Shanghai | 0.303 | Suzhou | 0.370 | Hangzhou | 0.353 | Hangzhou | 0.376 |
| 5 | Changsha | 0.300 | Beijing | 0.301 | Changsha | 0.355 | Changsha | 0.346 | Guangzhou | 0.371 |
| 6 | Suzhou | 0.300 | Guangzhou | 0.300 | Wuhan | 0.342 | Wuhan | 0.346 | Changsha | 0.369 |
| 7 | Nanjing | 0.300 | Hefei | 0.299 | Hefei | 0.340 | Fuzhou | 0.345 | Kunming | 0.368 |
| 8 | Fuzhou | 0.298 | Nanjing | 0.298 | Zhuhai | 0.340 | Sanya | 0.345 | Suzhou | 0.366 |
| 9 | Xiamen | 0.297 | Sanya | 0.298 | Fuzhou | 0.339 | Guilin | 0.345 | Qingdao | 0.363 |
| 10 | Wuhan | 0.295 | Fuzhou | 0.297 | Zhengzhou | 0.336 | Xiamen | 0.343 | Sanya | 0.363 |
| Ranking | 2000 | 2005 | 2010 | 2015 | 2019 | |||||
|---|---|---|---|---|---|---|---|---|---|---|
| Cities | Scores | Cities | Scores | Cities | Scores | Cities | Scores | Cities | Scores | |
| 1 | Yichun | 0.196 | Baishan | 0.220 | Yichun | 0.235 | Baishan | 0.253 | Yichun | 0.247 |
| 2 | Baishan | 0.197 | Yichun | 0.220 | Jixi | 0.243 | Yichun | 0.259 | Baiyin | 0.253 |
| 3 | Hegang | 0.210 | Hegang | 0.224 | Fushun | 0.243 | Qitaihe | 0.260 | Qitaihe | 0.259 |
| 4 | Qitaihe | 0.211 | Longnan | 0.225 | Hegang | 0.247 | Jixi | 0.261 | Baishan | 0.261 |
| 5 | Shuozhou | 0.213 | Shuozhou | 0.227 | Longnan | 0.247 | Hegang | 0.265 | Hegang | 0.262 |
| 6 | Jixi | 0.213 | Baiyin | 0.230 | Baishan | 0.251 | Longnan | 0.265 | Jixi | 0.267 |
| 7 | Bazhong | 0.214 | Liaoyuan | 0.230 | Tianshui | 0.252 | Fushun | 0.265 | Dingxi | 0.268 |
| 8 | Tianshui | 0.214 | Jixi | 0.232 | Shuozhou | 0.253 | Liaoyuan | 0.267 | Zhongwei | 0.268 |
| 9 | Liupanshui | 0.215 | Tianshui | 0.233 | Qitaihe | 0.253 | Baiyin | 0.269 | Longnan | 0.270 |
| 10 | Tongchuan | 0.215 | Chaoyang | 0.237 | Wuwei | 0.254 | Wuzhong | 0.270 | Tianshui | 0.273 |
| Year | 2000 | 2005 | 2010 | 2015 | 2019 |
|---|---|---|---|---|---|
| Moran’s I | 0.2092 | 0.1595 | 0.2778 | 0.1819 | 0.1740 |
| Z score | 27.0187 | 20.6973 | 35.7311 | 23.5517 | 22.5954 |
| P value | 0.0000 | 0.0000 | 0.0000 | 0.0000 | 0.0000 |
| 2000 | 2005 | 2010 | 2015 | 2019 | ||||||
|---|---|---|---|---|---|---|---|---|---|---|
| Q-Value | Ranking | Q-Value | Ranking | Q-Value | Ranking | Q-Value | Ranking | Q-Value | Ranking | |
| X3 | 0.352 *** | 1 | 0.271 *** | 5 | 0.365 *** | 4 | 0.194 *** | 13 | 0.315 *** | 9 |
| X5 | 0.290 *** | 4 | 0.168 *** | 10 | 0.100 *** | 15 | 0.114 *** | 15 | 0.227 *** | 12 |
| X8 | 0.149 *** | 12 | 0.122 *** | 13 | 0.052 ** | 17 | 0.041 * | 20 | 0.059 ** | 18 |
| X15 | 0.262 *** | 6 | 0.240 *** | 7 | 0.295 *** | 7 | 0.317 *** | 4 | 0.322 *** | 8 |
| X17 | 0.256 *** | 7 | 0.246 *** | 6 | 0.200 *** | 11 | 0.413 *** | 3 | 0.428 *** | 4 |
| X18 | 0.024 * | 20 | 0.070 * | 17 | 0.434 *** | 3 | 0.294 *** | 6 | 0.517 *** | 2 |
| X20 | 0.092 ** | 16 | 0.073 ** | 16 | 0.064 *** | 16 | 0.067 ** | 16 | 0.084 *** | 17 |
| X21 | 0.228 *** | 8 | 0.371 *** | 1 | 0.534 *** | 2 | 0.458 *** | 1 | 0.433 *** | 3 |
| X22 | 0.214 *** | 10 | 0.160 *** | 11 | 0.180 *** | 12 | 0.201 *** | 10 | 0.151 *** | 13 |
| X25 | 0.338 *** | 2 | 0.329 *** | 2 | 0.583 *** | 1 | 0.438 *** | 2 | 0.572 *** | 1 |
| X26 | 0.326 *** | 3 | 0.280 *** | 4 | 0.332 *** | 5 | 0.196 *** | 12 | 0.292 *** | 10 |
| X28 | 0.055 * | 18 | 0.031 | 20 | 0.043 * | 19 | 0.057 * | 19 | 0.039 ** | 20 |
| X30 | 0.143 *** | 13 | 0.172 *** | 9 | 0.304 *** | 6 | 0.228 *** | 9 | 0.387 *** | 6 |
| X31 | 0.073 ** | 17 | 0.063 * | 18 | 0.048 * | 18 | 0.067 * | 17 | 0.090 *** | 16 |
| X33 | 0.226 *** | 9 | 0.231 *** | 8 | 0.136 *** | 14 | 0.128 *** | 14 | 0.125 *** | 14 |
| X34 | 0.136 *** | 14 | 0.079 ** | 15 | 0.229 *** | 9 | 0.291 *** | 7 | 0.254 *** | 11 |
| X35 | 0.043 * | 19 | 0.051 * | 19 | 0.015 | 20 | 0.061 * | 18 | 0.044 * | 19 |
| X37 | 0.117 *** | 15 | 0.114 *** | 14 | 0.222 *** | 10 | 0.197 *** | 11 | 0.114 *** | 15 |
| X38 | 0.266 *** | 5 | 0.319 *** | 3 | 0.263 *** | 8 | 0.306 *** | 5 | 0.362 *** | 7 |
| X40 | 0.154 *** | 11 | 0.149 *** | 12 | 0.157 *** | 13 | 0.278 *** | 8 | 0.409 *** | 5 |
Publisher’s Note: MDPI stays neutral with regard to jurisdictional claims in published maps and institutional affiliations. |
© 2021 by the authors. Licensee MDPI, Basel, Switzerland. This article is an open access article distributed under the terms and conditions of the Creative Commons Attribution (CC BY) license (https://creativecommons.org/licenses/by/4.0/).
Share and Cite
Cong, X.; Li, X.; Gong, Y. Spatiotemporal Evolution and Driving Forces of Sustainable Development of Urban Human Settlements in China for SDGs. Land 2021, 10, 993. https://doi.org/10.3390/land10090993
Cong X, Li X, Gong Y. Spatiotemporal Evolution and Driving Forces of Sustainable Development of Urban Human Settlements in China for SDGs. Land. 2021; 10(9):993. https://doi.org/10.3390/land10090993
Chicago/Turabian StyleCong, Xueping, Xueming Li, and Yilu Gong. 2021. "Spatiotemporal Evolution and Driving Forces of Sustainable Development of Urban Human Settlements in China for SDGs" Land 10, no. 9: 993. https://doi.org/10.3390/land10090993
APA StyleCong, X., Li, X., & Gong, Y. (2021). Spatiotemporal Evolution and Driving Forces of Sustainable Development of Urban Human Settlements in China for SDGs. Land, 10(9), 993. https://doi.org/10.3390/land10090993