Article

Response of NDVI of Natural Vegetation to Climate Changes and Drought in China

1
School of Urban and Environmental Sciences, Huaiyin Normal University, Huai’an 223300, China
2
Research Institute of Huai River Eco-Economic Belt, Key Research Base of Philosophy and Social Sciences of Colleges & Universities in Jiangsu Province, Huai’an 223300, China
3
State Key Laboratory of Desert and Oasis Ecology, Xinjiang Institute of Ecology and Geography, Chinese Academy of Sciences, Urumchi 830011, China
4
State Key Laboratory of Earth Surface Processes and Resource Ecology, Beijing Normal University, Beijing 100875, China
*
Author to whom correspondence should be addressed.
Land 2021, 10(9), 966; https://doi.org/10.3390/land10090966
Submission received: 9 August 2021 / Revised: 9 September 2021 / Accepted: 10 September 2021 / Published: 13 September 2021
(This article belongs to the Topic Climate Change and Environmental Sustainability)

Abstract

:
Temporal and spatial changes in vegetation and their influencing factors are of great significance for the assessment of climate change and sustainable development of ecosystems. This study applied the Asymmetric Gaussians (AG) fitting method, Mann-Kendall test, and correlation analysis to the Global Inventory Monitoring and Modeling System (GIMMS) third-generation Normalized Difference Vegetation Index and gridded climate and drought data for 1982–2015. The temporal and spatial changes to NDVI for natural grassland and forest during the growing season were analyzed. Relationships among NDVI, climate change, and droughts were also analyzed to reveal the influence of vegetation change. The results showed that: (1) Land use/cover change (LUCC) in China was mainly represented by increases in agricultural land (Agrl) and urban and rural land (Uril), and decreases in unutilized land (Bald), grassland, forest, and permanent glacier and snow (Snga). The increase in agricultural land was mainly distributed in the western northwest arid area (WNW) and northern North China (NNC), whereas regions with severe human activities such as southern South China (SNC), western South China (WSC), and eastern South China (ESC) showed significant decreases in agricultural land due to conversion to urban and rural land. (2) The start of the growing season (SOS) was advanced in WNW, SNC, WSC, and ESC, and the end of growing season (EOS) was delayed in WNW, NNC, and SNC. The growing season length (GSL) of natural vegetation in China has been extended by eight days over the last 34 years. However, the phenology of the Qinghai-Tibet Plateau (TP) was opposite to that of the other regions and the GSL showed an insignificant decreasing trend. (3) The NDVI increased significantly, particularly in the SNC, WSC, ESC, and the grassland of the WNW. Precipitation was found to mainly control the growth of vegetation in the arid and semi-arid regions of northwest China (WNW and ENW), and precipitation had a much greater impact on grassland than on forests. Temperature had an impact on the growth of vegetation throughout China, particularly in SNC, ESC, and WSC. (4) The Standardized Precipitation Evapotranspiration Index (SPEI) showed a downward trend, indicating an aridification trend in China, particularly in ENW, NNC, and WNW. Similar to precipitation, the main areas affected by drought were WNW and ENW and grassland was found to be more sensitive to drought than forest. The results of this study are of great significance for predicting the response of ecosystem productivity to climate change under future climate change scenarios.

1. Introduction

As an important component of the terrestrial ecosystem, vegetation is a natural link connecting soil, atmosphere, and water. Vegetation plays a pivotal role in the ecosystem and can act as an “indicator” within the study of global change. The growth status of vegetation is closely related to environmental factors, such as climate, water quality, and topography [1]. Climate change has altered the growth environment of plants, thereby affecting the growth of vegetation. Global changes have had a significant impact on the structure and function of terrestrial ecosystems [2,3,4]. Understanding the inherent relationship between vegetation and climate can illuminate the role of climate in changes to the terrestrial ecosystem.
The Normalized Difference Vegetation Index (NDVI) is the preferred indicator for analyzing vegetation changes and is widely used in the study of vegetation changes and the responses of vegetation to climate change [5,6]. Song et al. [7] found an increase and decrease in global forest vegetation cover and bare land, respectively, primarily due to human activities, with natural factors, including climate change, playing a secondary role. Chen et al. [8] found a global increase in vegetation of ~518 M ha over the past 20 years, equivalent to the area of the Amazon rainforest. Of this increase, around 33% is due to afforestation projects in China and intensive agricultural management in India. Changes to global vegetation cover from 1982 to 2011 also indicate an increasing trend in vegetation over the past 30 years, with annual changes to vegetation coverage showing an obvious seasonality [9]. Changes to vegetation in Eurasia changed from an increasing to decreasing trend around 1997, with the abrupt change in the NDVI varying from region to region [10]. There have been significant increasing trends in both the NDVI and leaf area index (LAI) in China. However, there have been downward trends in these two indices in the eastern development areas such as the Beijing-Tianjin-Hebei region and the Yangtze River Delta due accelerated urbanization. In addition, afforestation programs implemented in China over the past few decades have played an important role in promoting the greening of vegetation throughout the country [11].
Temperature and precipitation are key climate factors affecting plant growth and development. Previous studies have shown that drought resulting from rising temperatures in the Northern Hemisphere was an important driver of the decline in vegetation cover in some high-latitude regions in the 1980s [12]. Lamchin et al. [13] analyzed the correlation between the seasonal changes to the NDVI and factors such as temperature, precipitation, and evapotranspiration, thereby illustrating that temperature is the most important factor responsible for changes to the NDVI in Asia during 1982–2014. Climate warming over the past 30 years has promoted the restoration of vegetation in the central and southeast regions of the Loess Plateau, whereas it has had an inhibitory effect on the restoration of vegetation in the northwestern region [14]. Around 80% of the area in northeast China is experiencing an increase in the NDVI during the plant growing season, with temperature identified as the primary factor affecting vegetation coverage [15]. Climate factors have been identified as the primary drivers of changes in the NDVI in 46.2% of the area [16]. The NDVI in the Loess Plateau is negatively correlated with atmospheric pressure, whereas it is positively correlated with precipitation, humidity, air temperature, and sunshine hours [17]. Pang et al. [18] found that temperature over different seasons and months is positively correlated with the NDVI. In contrast, no consistent effect of rainfall on the NDVI in the Qinghai-Tibet Plateau from 1982 to 2012 has been identified.
Drought is a natural phenomenon resulting in an imbalance between water supply and water demand due to abnormally little or no precipitation over a long period of time. Drought is a common natural disaster and can occur over a wide spatial range and a long duration. Global warming has been linked with an increasing frequency and degree of drought. Therefore, studying the relationship between drought and vegetation can provide an effective theoretical basis for the management of vegetation as a climate change mitigation measure. Drought is generally quantified using drought indices such as the Palmer Drought Severity Index (PDSI), the Standardized Precipitation Index (SPI), and the Standardized Precipitation Evapotranspiration Index (SPEI) [19]. Among the many drought indices developed, the SPEI not only considers the impact of precipitation on drought, but also combines the sensitivity of the PDSI to potential evapotranspiration changes with the multiple time scales of the SPI. Consequently, the SPEI is widely used to analyze the response of vegetation to drought [20]. Different vegetation types also respond differently to drought, and the SPEI value is not necessarily positively correlated to vegetation growth. For example, the drought in southwest China from 2009 to 2010 resulted in a significant decline in vegetation productivity in this area, and the period of vegetation restoration in some areas exceeded six months [21]. Northern China, and particularly central Inner Mongolia, has been shown to have undergone vegetation decline of between 28.1–68.8% greater than that in the mainland given drought conditions (quantified as SPEI ≤ −1) [22]. Differences in ecosystem resilience to water stress have been attributed to diversities in drought survival traits and strategies, with forests found to have the highest drought resilience, followed by croplands, grasslands, and deserts [23]. Vicente-Serrano et al. [24] found that although semiarid and sub-humid biomes respond to drought at long time-scales due to the ability of plants to withstand water deficits, they lack the rapid response of arid biomes to drought.
Climate change in China is characterized by considerable spatial heterogeneity. Although there has been a significant increase in regional average temperature, there has been no significant change in precipitation [25]. The spatial differences in water and heat conditions and vegetation types have resulted in large spatial differences in vegetation changes and the responses of vegetation to climate change [26]. In addition, human activities have had a great impact on vegetation. In particular, changes in land use have increased uncertainty in the assessment of the impact of climate change. Most previous studies have not distinguished between the effects of human activities and climate change on vegetation, and few studies have explored the contribution of climate independent of meso-scale and large-scale landcover changes [27]. Human disturbance or the heterogeneity of the landscape environment has resulted in differences in the composition of vegetation types among different spatial scales. These different vegetation types show diverse species composition, community structure, and root distribution, resulting in differences in responses to changes in the external environment [28]. Therefore, understanding the differences in the response of the NDVI of different natural vegetation types to climate change is of great significance for the correct understanding of the relationship between regional vegetation cover and climate change. The current study used grid temperature, precipitation, drought, and the GIMMS NDVI3g data from 1982 to 2015 to explore the spatiotemporal changes in growth season of the NDVI for different natural vegetation types in China. The current study also analyzed the correlation between the NDVI and temperature, precipitation, and drought during the vegetation growing season to reveal the response of the NDVI to changes in climate and drought. The result of the current study can provide a theoretical basis for the construction and protection of the terrestrial ecological environment in China.

2. Study Area, Data, and Method

2.1. Study Area and Data

China can be divided into three major geographic regions based on geographic location, natural geography, and human geography: (1) the eastern monsoon region; (2) the northwest arid and semi-arid region, and; (3) the Qinghai-Tibet alpine region (TP). The 400 mm iso-precipitation line constitutes the boundary between the eastern monsoon region and the arid and semi-arid region of northwest China. The 3000-m contour line acts as the boundary between the eastern monsoon region and the Qinghai-Tibet alpine region. The northwest arid and semi-arid region and the Qinghai-Tibet alpine region are separated by Kunlun-Altun-Qilian mountains. The eastern monsoon region is roughly divided into north China and south China by the Qinling-Huaihe line, which roughly coincides with the 0 °C isotherm in January and the 800 mm annual precipitation line. On this basis, the northwest arid and semi-arid regions are divided into the western arid and semi-arid region (WNW) and eastern arid and semi-arid region (ENW). North China is divided into northern north China (NNC) and southern north China (SNC). South China is divided into western south China (WSC) and eastern south China (ESC).
The NDVI dataset used in the current study originated from the Global Inventory Monitoring and Modeling System (GIMMS) third generation NDVI (NDVI3g) (https://ecocast.arc.nasa.gov/data/pub/gimms/, accessed on 20 May 2020) released by the Global Monitoring and Simulation Research Group of the United States National Aeronautics and Space Administration (NASA). The GIMMS NDVI3g data extended from 1982 to 2015 with a spatial resolution of 8 km. This dataset eliminates the effects of volcanic eruptions, angles of solar altitude, and changes to sensor sensitivity over time, and has been widely used in the detection of global vegetation changes. The land use/land cover (LUCC) dataset originated from the Resource and Environment Science and Data Center (https://www.resdc.cn/Default.aspx, accessed on 5 April 2020) and included the years 1980, 1990, 1995, 2000, 2005, 2010, 2015, and 2020. The LUCC dataset was produced based on the Landsat Thematic Mapper/Enhanced Thematic Mapper (TM/ETM) remote sensing image of each phase as the main data source and was generated through manual visual interpretation. The spatial resolution of the LUCC dataset was 1 km, and was resampled to 8 km. Land use types included seven primary types: (1) agricultural land (Agrl); (2) forest land; (3) grassland; (4) water (Watr); (5) urban and rural land (Uril); (6) unutilized land (Bald); and (7) permanent glacier and snow (Snga). These seven primary land use types were further divided into 25 secondary types. The current study mainly focused on natural forest and grassland. Forest land was divided into forested land (Forestl), shrubland (Shrubl), and sparse forest land (Sparsel). Grassland included high-coverage grassland (Hgra), medium-coverage grassland (Mgra), and low-coverage grassland (Lgra). The focus of the current study was on the impact of climate and drought on natural vegetation. The impacts of land use change were excluded by only analyzing vegetation with unchanged forest and grassland types from 1980 to 2015. Under this approach, natural vegetation was identified as vegetation types (Forestl, Shrubl, Sparsel, Hgra, Mgra, and Lgra) that experienced no change in 1980 and 2015 (Figure 1). Figure 1 shows the monthly changes to temperature, precipitation, and the NDVI of natural vegetation in various regions.
Precipitation and temperature data used in the current study originated from a 1-km monthly mean temperature and precipitation dataset for China (https://data.tpdc.ac.cn/zh-hans/, accessed on 22 June 2020). The data are monthly average temperature and precipitation with a spatial resolution of 0.0083333° (~1 km) and a period of January 1901 to December 2017. This dataset is based on the global 0.5° climate dataset released by the Climate Research Unit (CRU) and the global high-resolution climate dataset released by WorldClim. The dataset was downscaled in China through the Delta spatial downscaling scheme and evaluated using observations collected in 1951–2016 by 496 weather stations across China. Compared with the evaluations of the CRU dataset, the mean absolute error of this dataset decreased by 35.4–48.7% for temperature and by 25.7% for precipitation. The root-mean-square error decreased by 32.4–44.9% for temperature and by 25.8% for precipitation. The Nash–Sutcliffe efficiency coefficients increased by 9.6–13.8% for temperature and by 31.6% for precipitation, and correlation coefficients increased by 0.2–0.4% for temperature and by 5.0% for precipitation. The new dataset was reliable, as the downscaling procedure further improved the quality and spatial resolution of the CRU dataset and was concluded to be useful for investigations related to climate change across China. More detailed information about this dataset can be found in [29]. The SPEI grid drought dataset with a spatial resolution of 0.5° and a monthly time resolution originated from the Global SPEI database (https://spei.csic.es/database.html, accessed on 18 May 2020). The SPEI dataset was based on monthly precipitation and potential evapotranspiration from the CRU. The present study used version 4.03 of the CRU timeseries (TS) dataset. We used the precipitation, temperature, and SPEI data reprojected and resampled, using bilinear interpolation, into the GIMMS NDVI projection and resampled to an 8 km resolution. Although this approach created a large number of replicate pixels for the SPEI, with no gain in the dataset spatial resolution, it enabled their comparison by retaining the NDVI resolution. Since the current study focused on the effects of drought on vegetation during the growing season, the SPEI data at a 6-month time scale (SPEI6) was used for analysis. Since the vegetation growing season in China extends roughly from April to September, SPEI6 data for September indicated a drought during the growing season, whereas the data for March indicated a drought during the non-growing season.

2.2. Method

The present study adopted the change in area, rate of change in area, and transfer matrix to analyze the changes among different land uses in different regions of China. The asymmetric Gaussian function fitting method (AG) within the Timesat software was used to reconstruct the NDVI time series and to extract the vegetation phenology index [30]. The three extracted phenological parameters were the start of the growing season (SOS), the end of growing season (EOS), and the growing season length (GSL). The relative importance of SOS and EOS to GSL was analyzed using the Hierarchical Partitioning (HP) algorithm [31]. HP reduces multicollinearity by determining the independent contribution of each explanatory variable to the response variable, thereby allowing the relative importance values of covariates to be ranked when interpreting response variables. In this way, the contribution rates of SOS and EOS to GSL can be obtained. The trend magnitudes of temperature, precipitation, NDVI, and drought during the growing and non-growing seasons were analyzed by Sen’s slope [32] and significance was determined by the Mann-Kendall (M-K) method [33].
The test statistic S of Mann-Kendall test, is calculated by Equation (1):
S = i = 1 n 1 k = i + 1 n sgn ( x k x i )
where xk and xi are the sequential data values, and
sgn ( θ ) = 1 , θ > 0 0 , θ = 0 1 , θ < 0
The variance in S is computed by Equation (3):
var ( S ) = [ n ( n 1 ) ( 2 n + 5 ) t t ( t 1 ) ( 2 t + 5 ) ] / 18
where t is the extent of any given time, and n is the number of values.
Then, the test statistic Z is as follows:
Z = S 1 V a r ( S ) , S > 0 0 , S = 0 S + 1 V a r ( S ) , S < 0
If Z > 1.96 (Z < −1.96), it means that the significant upward (downward) trend is significant at the 0.05 level.
The Sen’s method was used to estimate the trend:
β = M e d i a n ( x i x j i j ) , j < i
where 1 < j < i < n. Since the results of the M-K are heavily affected by time series correlation, the Yue and Pilon method [34], derived from R package “ZYP” [35], was used to remove lag-1 autocorrelation. In addition, the impact of climate change and drought on vegetation was mainly characterized by Pearson correlation analysis [36]:
R = i = 1 n ( x i x ¯ ) ( y i y ¯ ) i = 1 n ( x i x ¯ ) 2 i = 1 n ( y i y ¯ ) 2
where R is correlation coefficient, n is the time series, xi is the NDVI for each grid cell/regional study area, yi is the climate variable (temperature, precipitation, SPEI) for each grid cell/regional study area, x is the average NDVI and y is the average of climate variables. The correlations calculated were tested for statistical validity at 0.05 significance level.

3. Results

3.1. Changes to LUCC from 1980 to 2015

The area of urban and rural land increased by 49% from 1980 to 2015, with the majority due to conversion of other land to farmland (51,085 km2). There were significantly increasing trends in the areas of urban and rural land (Uril.) in all regions of China, with the smallest and largest rates of increase of 17% and 104% in NNC and TP, respectively (Figure 2, Table 1). Agricultural land (Agrl) and water increased by 33% and 20% in WNW, respectively, mainly due to the conversion of unutilized land (Bald) and grassland. This also led to a sharp decline in unutilized land and grassland. There were significant reductions in unutilized land and grassland in ENW, while forested land (Forestl) and sparse forest land (Sparsel) increased by 20% and 17%, respectively. The area of glaciers and permanent snow (Snga) dropped sharply in TP, with most of the decline attributed to conversion to unutilized land (14,222 km2) (Table S1). The major change in land use in NNC was due to an increase of agriculture land through the conversion of unutilized land, forest, and grassland. The area of unutilized land in SNC was reduced by 16,031 km2, with most of this area converted to urban and rural land. Both WSC and ESC showed sharp decreases in agriculture land, with most of this area transformed into urban and rural land.
In China, Forestl decreased by −1.31%, whereas Shrubl and Sparsel increased by 0.11% and 0.21%, respectively. The area of grassland showed a decreasing trend, with grassland area in Hgra, Mgra, and Lgra decreasing by −2.48%, −1.34%, and −1.85%, respectively. An analysis of the grids in which vegetation type did not change from 1980 to 2015 (Figure 3) showed that WNW, ENW, and TP were dominated by grassland, with the three grassland types displaying a wide distribution. Forest accounted for 74% of total natural vegetation in NNC, with forested land the most widely distributed, reaching 62%. Grassland and forest were distributed over large areas in SNC, accounting for 45% and 55% of the total area, respectively. Natural vegetation in WSC and ESC consisted mainly of forest, although the former also contained a large area of grassland.

3.2. Spatial and Temporal Distribution of Growing Season Indices

The growing season in China starts in April (day of year (DOY) 114) and ends in September (DOY 263) (Figure 4, Table 2). Therefore, throughout China, the approximate growing season (GS) period is April to September. The SOS of forest arrives earlier than that of grassland, whereas the EOS of forest extends later than that of grassland. As a result, the GSL of forest exceeded 159 days, whereas that of grassland was less than 140 days. The SOS of forest showed a significantly advancing trend, and the SOSs of Foredl, Shrubl, and Sparsel advanced by 6 d, 10 d, and 14 d over the past 34 years, respectively. In contrast, the EOS of forest showed a trend of delay, leading to extensions of the GSL of Foredl, Shrubl, and Sparsel by 12 d, 7 d, and 13 d, respectively. Although the phenological trend of grassland was consistent with that of forest, only Hgra realized a significant change. The EOS of forest had a relatively large influence on the GSL, whereas the SOS was relatively important for the GSL of grassland (Table 2).
SOS and EOS decreased and increased significantly, in WNW, respectively, leading to a significant extension of the GLS (Figure 4, Table 2). The GSLs of forest and grassland were both extended by more than 15 d, and the advancement of the SOS and the delay of the EOS were equally important to the extension of the GLS. The significant delay in the EOS of forest led to a significant increase in GSL, whereas 96% of regions showed no significant changes in SOS, EOS, and GSL of grassland. This result could be attributed to spatial and regional differences. Taking SOS as an example, the eastern part of ENW showed a decreasing trend in SOS, whereas many grids in the west showed increasing trends (Figure 4d). SOS was particularly important for GLS in ENW, with its contribution rate exceeding 80% in all vegetation types.
The phonological change that occurred in TP was unique, with SOS and EOS delayed and advanced, respectively, although not significantly. The same changes were also evident at the grid scale (Figure 5). The proportion of SOS showing a significant delay (21%) far exceeded that showing a significant advance (10%), particularly for grassland. The EOS of grassland advanced, although this change was not significant. Regional GLS similarly showed no significant changes. The proportion of forest that showed a significant increase in GLS exceeded that showing a significant decrease at the grid scale. However, since grassland accounted for 85% of all natural vegetation, the proportion of the grid with a significant decrease in GLS far exceeded that showing an increase in GLS. Zhang et al. [37] similarly showed delayed, advancing, and shortening trends in SOS, EOS, and GSL for alpine grassland, respectively. The EOS had the greatest influence on the length of forest GLS (60%), whereas the SOS was relatively important for the length of GSL of grassland.
The NNC mainly contained forests and grasslands and showed advances and delays in regional SOS and regional EOS, respectively (Figure 4, Table 2). The same trend was observed at the grid scale, with 35% and 61% the grids showing significantly advanced SOS and significantly delayed EOS, respectively, which resulted in a significant increase in GSL of 60% (Figure 4). Although the EOS was significantly extended for forests and high-coverage grasslands, the start date of the EOS had a greater impact on the GLS (63%).
The phonological parameters of SNC show significant changes, regardless of the region or the grid scale (Table 2, Figure 5). SOS was significantly advanced in the SNC, with 55% of the grids showing a significant advancing trend. EOS and GLS were significantly increased in 37% and 54% of the grids, respectively. The regional EOS values of WSC and ESC showed significant advancing trends, whereas regional EOS did not change significantly. This trend was mirrored at the grid scale. SOS showed a significantly advancing trend in over 30% of the grids, while EOS was delayed in only 10% of the grids. Both SOS and EOS were important to GLS in SNC, WSC, and ESC, with their contributions both between 40–60%.

3.3. Climate Change and Its Relationship with the NDVI

Average precipitation, temperature, and NDVI decreased from southeast to northwest. Precipitation showed no significant change (Table 3). The grids with significant increases in precipitation were mainly located in TP. Among all the grids, 25% showed significant increasing trends in precipitation and mainly contained grassland. The areas with significant decreases in precipitation were mainly located in eastern ENW and NNC. Among the grids in ENW and NNC, 28% and 38% showed significant decreasing trends in precipitation, respectively (Figure 6). Most areas showed significant increasing temperatures, with insignificant changes mostly found in eastern WSC and western ESC. Although there was a significant increasing trend in the NDVI, there were clear regional differences. The grids in ESC and WSC showed significant increases of 70% and 63% in the NDVI, respectively, whereas only 30% of grids in both TP and NNC showed a significant increase. Approximately 10% of the grids in each of TP, NNC, and WNW showed significant decreases in the NDVI, with this area mainly located in the alpine region.
Approximately 17% of gridded NDVI showed a significant positive correlation with precipitation (Figure 7, Table S2), mainly in areas with insufficient precipitation (WNW and ENW). It should be noted that the correlation between the NDVI and forest was much smaller than that between the NDVI and grassland (Table 3). Approximately 28%, 27%, and 23% of grids for high-coverage grasslands, medium-coverage grasslands, and low-coverage grasslands were significantly correlated with rainfall, respectively, whereas 3%, 9%, and 5% of forests, shrub, and sparse forests were significantly correlated with rainfall (Table S2).
The grids in WNW and ENW showed significant positive correlations of 32% and 75% between the NDVI and precipitation, respectively (Figure 7, Table S2). Similarly, the proportion of grassland showing a significant positive correlation between the NDVI and grassland far exceeded that of forest. This result could be attributed to the fact that forests grow in areas with relatively abundant water resources in arid and semi-arid regions. Precipitation during the non-growing season can also have an impact on the NDVI during the growing season. A total of 11% and 17% of grids showed significant positive correlations between precipitation and NDVI in WNW and ENW, respectively. This area falls within an arid and semi-arid zone characterized by low precipitation with an uneven spatiotemporal distribution. Therefore, precipitation remains a control factor that restricts vegetation growth, thereby illustrating that vegetation growth is sensitive to changes in precipitation [24,38]. A total of 31% and 14% of grids showed significant positive correlations between temperature and the NDVI, respectively in WNW and ENW. The increase in temperature was conducive to increasing the NDVI during the growing season. The positive correlation between regional temperature and the NDVI in WNW showed a correlation coefficient of 0.56, mainly since these regions are located in the mid-high latitudes of the Northern Hemisphere and since temperature is a primary factor limiting photosynthesis. At the same time, 18% of the grids in WNW showed significant correlations between temperature of the previous non-growing season and the NDVI. Grassland was the primary natural vegetation type in ENW. The increase in temperature promoted the growth of vegetation and resulted in a water deficit in vegetation to a certain extent, thereby generating an insignificant correlation between regional temperature and the NDVI [39].
A total of 11% of the grids in TP showed a positive correlation between the NDVI and precipitation, whereas 27% of the grids showed a significantly positively correlated between the NDVI and temperature (Figure 7, Table S2). This result indicated that temperature is a key factor controlling the growth of vegetation in TP rather than precipitation. The increase in temperature resulted in plants entering the growth period earlier, thereby extending the growth window. At the same time, the accelerated melting of seasonal snow provided water needed for early growth of plants. The precipitation and temperature of the previous non-growing season also affected the growth of the NDVI. Approximately 12% and 23% of grids showed significantly positive correlations between the NDVI and precipitation and between the NDVI and temperature, respectively. In addition, temperature and precipitation had a greater impact on the growth of the NDVI in grasslands compared to that for forest.
A total of 11% of the grids in NNC showed a significant positive correlation between the NDVI and precipitation, with most of the grids containing grassland (Figure 7, Table S2). Approximately 18% of forested land (accounting for 62% of natural vegetation) showed a significant negative correlation between the NDVI and precipitation, indicating that precipitation is not the main factor controlling forested land. Approximately 24% of grids showed significant positive correlations with temperature, with this proportion in forest far exceeding that in grassland. Precipitation during the previous non-growing season mainly affected medium- and low-coverage grasslands, whereas temperature mainly affected forests. Both precipitation and temperature in the SNC affected vegetation growth, with significant positive correlation ratios of 25% and 34%, respectively. The regional correlation coefficient showed that temperature had a great influence on vegetation in SNC, and all vegetation types showed a significant positive correlation. Precipitation during the non-growing season had little effect on vegetation growth, whereas temperature had a very large impact, with a positive correlation ratio exceeding 49%.
The response of the NDVI to temperature and precipitation was relatively consistent across WSC and ESC (Figure 7, Table S2). The impact of precipitation on the NDVI was minimal, whereas regional temperature was significantly correlated with the NDVI. The study area of the present study is mainly located in the monsoon climate area, with abundant precipitation. A total of 27% and 63% of grids in WSC and ESC showed a significant correlation between the NDVI and temperature, respectively. The temperature of the previous non-growing season also impacted the NDVI, with significant correlations in WSC and EWC evident in 25% and 37% of grids, respectively.

3.4. Effects of Drought on NDVI

There was a significant downward trend in the SPEI, evident in over 20% of the grids (Figure 8, Table 4 and S3). There was a significant downward trend in the SPEI in WNW (especially Mgrs and Lgra), evident in 36% of grids, whereas the significant declining trend fell to 76% in ENW, indicating trends of aridity in the northwest arid and semi-arid regions. There was no significant change in the SPEI in TP, although 14% of the grids (mainly in grassland) showed significant increases, indicating that humidity is increasing in some areas of TP. There was a significant downward trend in the SPEI in NNC, evident in 44% of the grids. There were no significant changes in SNC, WSC, and ESC at the regional scale and the grid scale.
A total of 13% of grids across entire China showed a significant positive correlation between the NDVI and the SPEI, with most of these grids containing grassland (Figure 8, Table 5). The areas showing the most sensitive the SPEI responses were WNW and ENW, with 21% and 56% of grids in these areas showing a significantly positive correlation between the NDVI and the SPEI, respectively. At the same time, the proportion of grids showing a significant positive correlation between the NDVI and the SPEI was higher for grids containing grassland than for grids containing forest, particularly for Mgra in ENW in which 71% of grids showed a positive correlation with the SPEI. Approximately 9% of grids in TP showed a significant positive correlation between the NDVI and the SPEI, mainly distributed in grassland. This significantly positive correlation was evident in 13%, 9%, and 8% of grids containing Hgra, Mgra, and Lgra, respectively. A total of 12% and 11% of grids showed this significantly positive correlation in NNC and SNC, respectively. Similarly, a higher proportion of grids in grassland showed this correlation compared to grids containing forest. Drought had a high impact on vegetation growth of grassland, which could be attributed to the shallow root system of grassland. In contrast, the impact of drought on forest was relatively stable [40]. Xu et al. [41] similarly showed that increasing aridity resulting from drought induced more rapid and significant declines in vegetation photosynthesis. WSC and ESC showed very weak responses to drought, with the proportions of grids showing a significant positive correlation between the NDVI and the SPEI both less than 3% (Table S4). It should be noted that 16% and 14% of grids in NNC and ESC (particularly for forests) showed a significant negative correlation between the NDVI and the SPEI, indicating that drought is not a limiting factor in these areas. This result can mainly be attributed to the roots of forest trees extending to deep soil as a drought mechanism [42]. Therefore, water deficits are less restrictive on the growth of vegetation in this area, with temperature becoming the main factor affecting forest growth [43]. There was a lower number of grids in which the NDVI was significantly correlated with the SPEI during the previous non-growing season (Figure 8, Table S4), which indicates that vegetation responds relatively weakly to droughts on a scale of approximately six months. Zhou et al. [44] similarly showed an absence of a lag effect induced by agriculture on vegetation drought on a monthly scale in most parts of China; they found a significant lag in forests, whereas there tended to be no lag or a lag of less than a month in grassland and agriculture. Zhao et al. [45] highlighted the importance of the role of atmospheric aridity to vegetation activities in grasslands, and the drought scale of six months used in the present study also increased uncertainty in the results.

4. Discussion

The results of the present study showed that the spring phenology of China was significantly advanced by five days during 1982–2015 and the growing season was extended by eight days, basically consistent with the results of previous studies [46]. Past studies have shown that the seasonal spatial distribution of vegetation on a global scale is mainly affected by latitudinal climate, vegetation types, and topographical elements. The mid- and high-latitude regions of the Northern Hemisphere are more strongly affected by heat and light [47]. The length of the vegetation growth season has been increasing in recent years in China, with the phenology of spring and autumn showing an advance and delayed trend, respectively [48]. The increase in temperature during spring will increase the temperature of vegetation germination and leaf expansion, which will advance the vegetation SOS [49]. A rise in temperature will increase the rate of decomposition of soil organic matter. This will more easily mineralize nutrients in the soil, thereby promoting the growth of vegetation [50]. At the same time, the water demand of vegetation will decrease during autumn, and the increase in temperature will increase and decrease the activity of photosynthetic enzymes and the degradation of chlorophyll, respectively, thereby delaying the growing season [51]. The phenology of the Qinghai-Tibet Plateau is affected by its unique environment, and phenological changes show spatial differences to those in other regions. In addition to the effects of temperature and precipitation on the Qinghai-Tibet Plateau, snow affects the phenological changes of alpine grasslands. Snowmelt can result in changes in moisture and temperature, thereby affecting the phenological period of plant species and the dynamics of plant populations. A deep and thick snow cover will delay plant growth and shorten the growth period [52]. The increase in winter temperature can lead to a sub-optimal reduced temperature of plant dormancy, the degradation of grassland, the melting of frozen soil, and an increase in aerosol concentration in the atmosphere, thereby delaying the rejuvenation period [53,54]. After correcting for adverse factors such as spring snow and ice, Zhang et al. [55] found no significant change in the SOS, consistent with the conclusion of the present study.
Vegetation coverage in China has shown a fluctuating upward trend, indicating increasing vegetation activities. The eastern part of China is affected by a monsoon climate and sufficient water and heat conditions for vegetation growth, where the northwestern region of China lacks sufficient water and heat. Therefore, the spatial coverage of vegetation in China is generally high in the southeast and low in the northwest. At the same time, areas with high vegetation coverage are mostly distributed along mountain ranges, with most of these areas containing forest vegetation. Under natural conditions, the physiological processes of plants are affected by changes in temperature. Zhang et al. [56] showed that temperature is the dominant factor affecting vegetation growth in humid temperate and cold temperate regions. The results of the present study showed general upward trends in temperature and vegetation in SNC, WSC, ESC, TP, and WNW. These results indicate that the increase in temperature in these mid-high latitudes is an important factor promoting the increase in vegetation. The results of the present study also showed that rainfall is the dominant driver of changes in vegetation in the arid and semi-arid regions of northwest China (WNW, ENW), consistent with the results of Spano et al. [57]. Although the present study did not consider the impact of human activities, it is undeniable that anthropogenic measures such as ecological engineering are important for promoting improvement in vegetation. Statistical records for China show that 42% and 32% of improved vegetated area is due to afforestation and agriculture, respectively [8]. Climate change not only directly affects the growth rate of vegetation, but also changes the physical and chemical properties of the soil (such as moisture, nutrient element content, etc.), thereby affecting the growth of vegetation. The results of the present study showed that temperature and precipitation during the non-growing season will also have an impact on the vegetation during the growing season.
The impacts of climate change can be observed by the correlation between the NDVI and the SPEI. The areas showing the highest vegetation response to drought were concentrated in WNW and ENW. This result confirms that vegetation growth in these areas is mainly affected by drought and that water is the main factor regulating vegetation growth. The correlation between the SPEI and vegetation was weak in ESC and WSC, characterized by abundant rainfall, and vegetation growth in these areas was weakly affected by drought. Water was found to not be the main factor affecting vegetation growth. Rather, vegetation growth was found to be mainly affected by temperature and sunshine hours. Different vegetation types have different responses to drought. In general, grassland is more sensitive to drought than forest due to the shallow root system of grassland. There is a delay in replenishment of soil moisture after drought, which affects the growth of vegetation. However, the present study did not observe a lagged response of vegetation growth to drought. This discrepancy could possibly be attributed to the current study only analyzing average drought events. In addition, the spatial resolution of the SPEI dataset used in the present study was relatively coarse, and some uncertainty in the results may have been introduced by resampling the SPEI to the same resolution as the NDVI.
In regions of abundant precipitation, such as the monsoon region of China, the relationship between the NDVI and precipitation was alien with that of the NDVI and the SPEI. Regardless of regional or grid scale, the relationship was insignificant, indicating that water deficit is not an environmental factor that restrict vegetation growth in these areas. In areas with abundant precipitation, the results of the SPI calculated on the basis of precipitation, and the SPEI calculated on the basis of precipitation and potential evapotranspiration show that the changes were consistent, which demonstrated that precipitation was the major limiting factor trigger changes in drought index [25]. In the northwestern region (SNC and NNC) where precipitation was scarce, precipitation was significantly correlated with the NDVI both at the regional and grid scale, indicating that precipitation was the main factor limit vegetation growth. The correlation with the SPEI displayed that the basic correlation pattern did not changed compare with precipitation, but the proportion of grids with significant positive correlation decreased significantly. For example, in WNW, the proportion of significant positive correlation with precipitation was 32%, while the SPEI was reduced to 21%; in WNW, the proportion of significant positive correlation between precipitation and the NDVI was 75%, and the proportion of significant positive correlation with the SPEI was 56%. In the WNW and ENW regions, the temperature showed a significant increase trend. The increase in temperature led to increase in potential evapotranspiration and aggravated drought in the region, which would limit the growth of vegetation. With the temperature rising, the melting of accumulated snow and frozen soil contributed to high water availability and slow drought responses. However, the SPEI reflects meteorological drought, and hydrological drought does not respond well. In the arid area of the northwest, the vegetation on the whole shows an increasing trend, which leads to a decrease in the significant correlation ratio compared with precipitation. When used across multiple time scales, the SPEI is an effective drought index that contains information on evapotranspiration in drought monitoring, thereby making it possible to reflect the changes in water demands in arid and semiarid regions, especially under the background of global warming [58,59]. The study focuses on calculations using precipitation and potential evapotranspiration, which reflect the average state of drought, but climate model predictions show that the vegetation impact caused by severe drought is greater [60]. For example, extreme drought decreased the forest biomass by 1.2–1.6 Pg in the Amazon region [61]. The drought that occurred in southwest China from 2009 to 2010 resulted in a significant decline in vegetation productivity, and the restoration period of vegetation in some areas exceeded half a year [21].
It should be noted that the present study only analyzed the impacts of temperature, precipitation, and drought on vegetation, whereas other environmental changes, such as solar radiation [62], soil nutrients [63], topographical factors [64], land use [65], and human activity [66] were not discussed. Future research should consider the impacts of these additional environmental factors.

5. Conclusions

The present study analyzed the spatiotemporal characteristics of temperature, precipitation, drought, and the NDVI during the growing and non-growing seasons of natural vegetation in China as well as the response of the NDVI to temperature, precipitation, and drought during the growing season. The main conclusions of the present study were as follows:
(1)
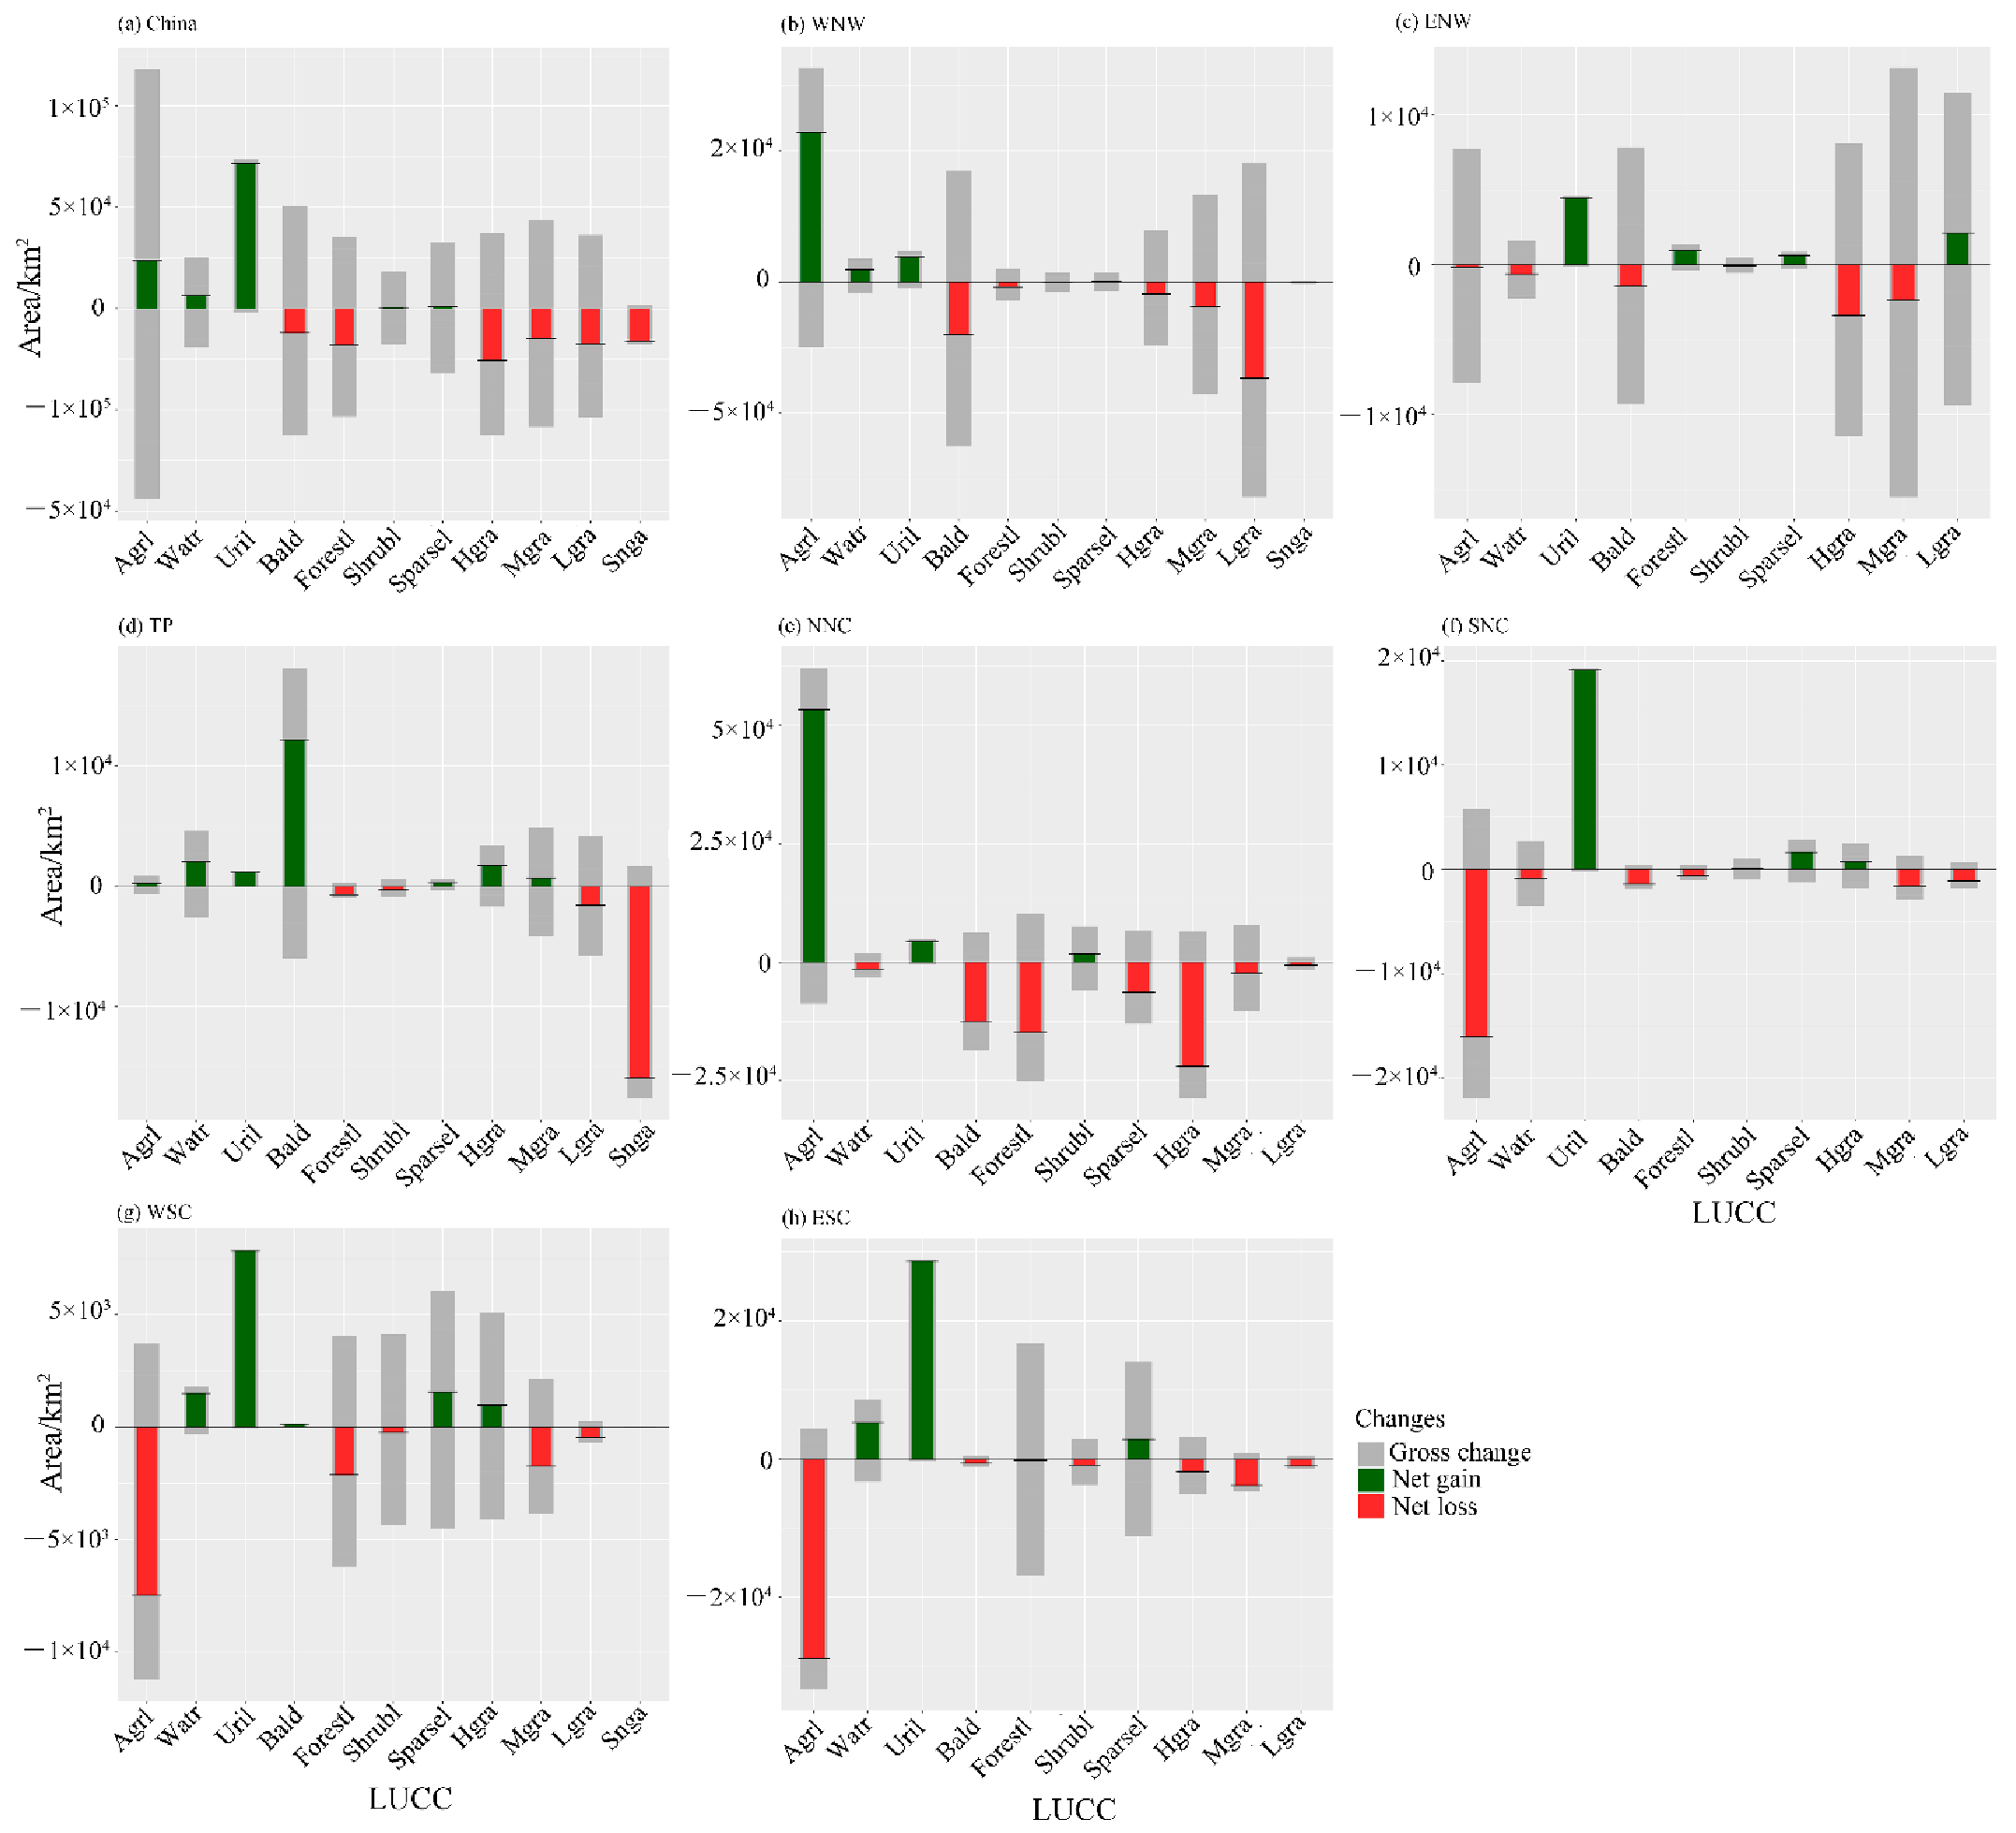
The area of urban and rural land in China increased by 49% from 1980 to 2015, with most of this increase attributed to conversion from agriculture land. Agriculture land and water increased by 33% and 20% in WNW, respectively, mainly through conversion from unutilized land and grassland. The increase in urban and rural land in ENW was mainly manifested as a massive reduction in unutilized land and grassland. Much of the decrease in glaciers and permanent snow on the Qinghai-Tibet Plateau could be attributed to conversion to unutilized land. The conversion of unutilized land, forests, and grasslands to farmland in NNC resulted in a significant increase in agriculture land. There were large reductions in agricultural land in SNC, WSC, and WSC due to conversion to urban and rural land.
(2)
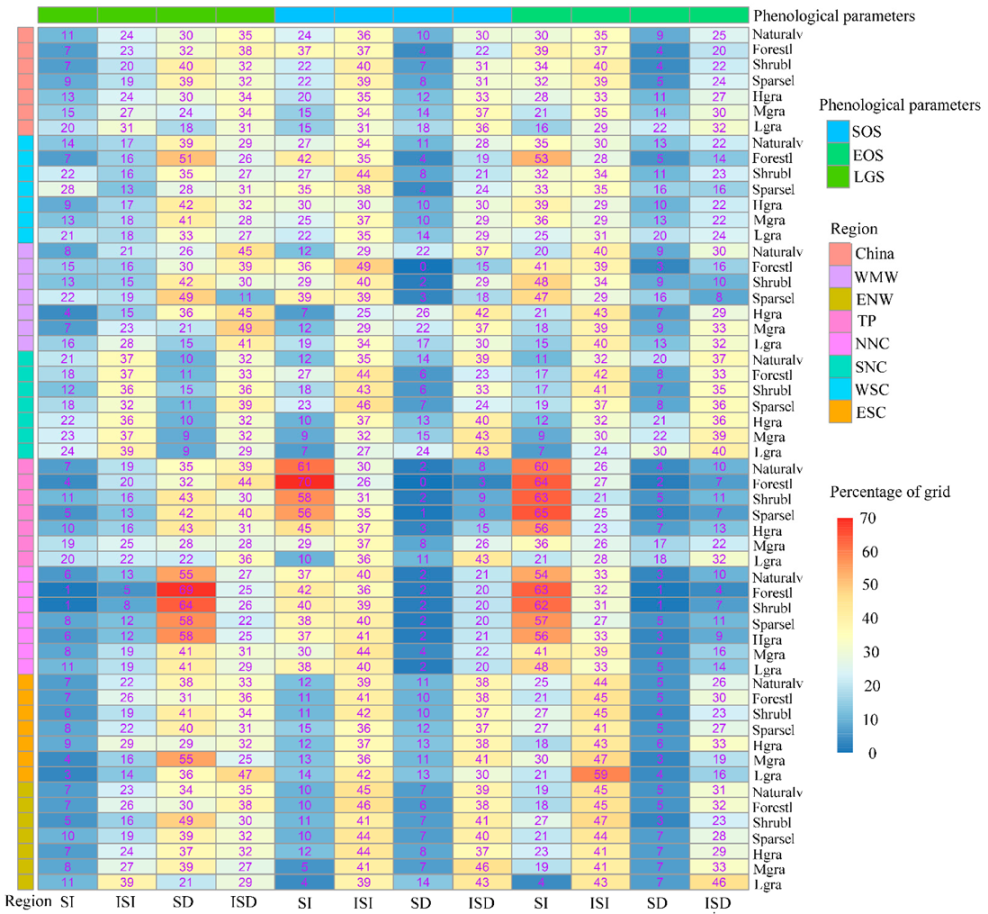
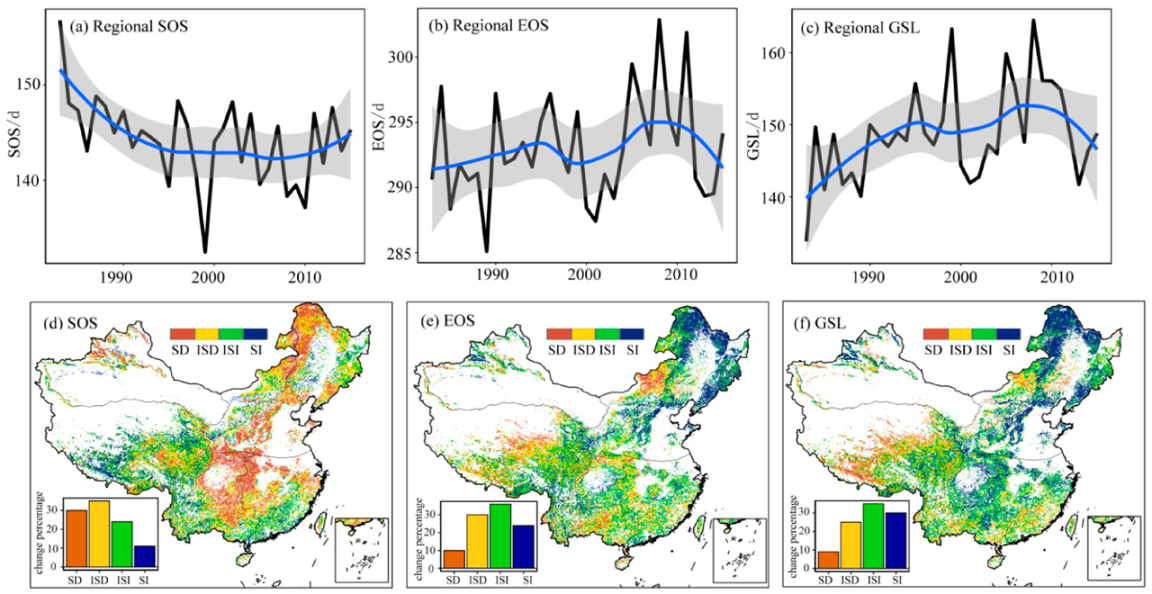
SOS and EOS of natural vegetation in China showed trends of advancing and delay, respectively, during 1982–2015, resulting in GSL being prolonged by approximately eight days. SOS was advanced and EOS was delayed in WNW and ENW, leading to a 21 d and 10 d prolongation of GLS, respectively. Particularly in WNW, there were significant changes in the regional trends of the EOS and SOS. SOS was particularly important to GLS in ENW, with its contribution rate exceeding 80% in almost all vegetation types. Since NNC was dominated by forests and high-coverage grasslands, SOS and EOS were significantly advanced and delayed, respectively. The SOS had a greater impact on GLS than the EOS, with a contribution rate exceeding 71%. SOS was significantly advanced in SNC at both the regional and grid scales, whereas EOS and GLS also showed significant increasing trends. SOS showed a significant advancing trend in WSC and ESC, whereas EOS did not change significantly. TP showed a unique phenological change that was opposite to that in other regions. Although the phenological change in TP was not significant, SOS was delayed and EOS was advanced, resulting in a shortened GSL.
(3)
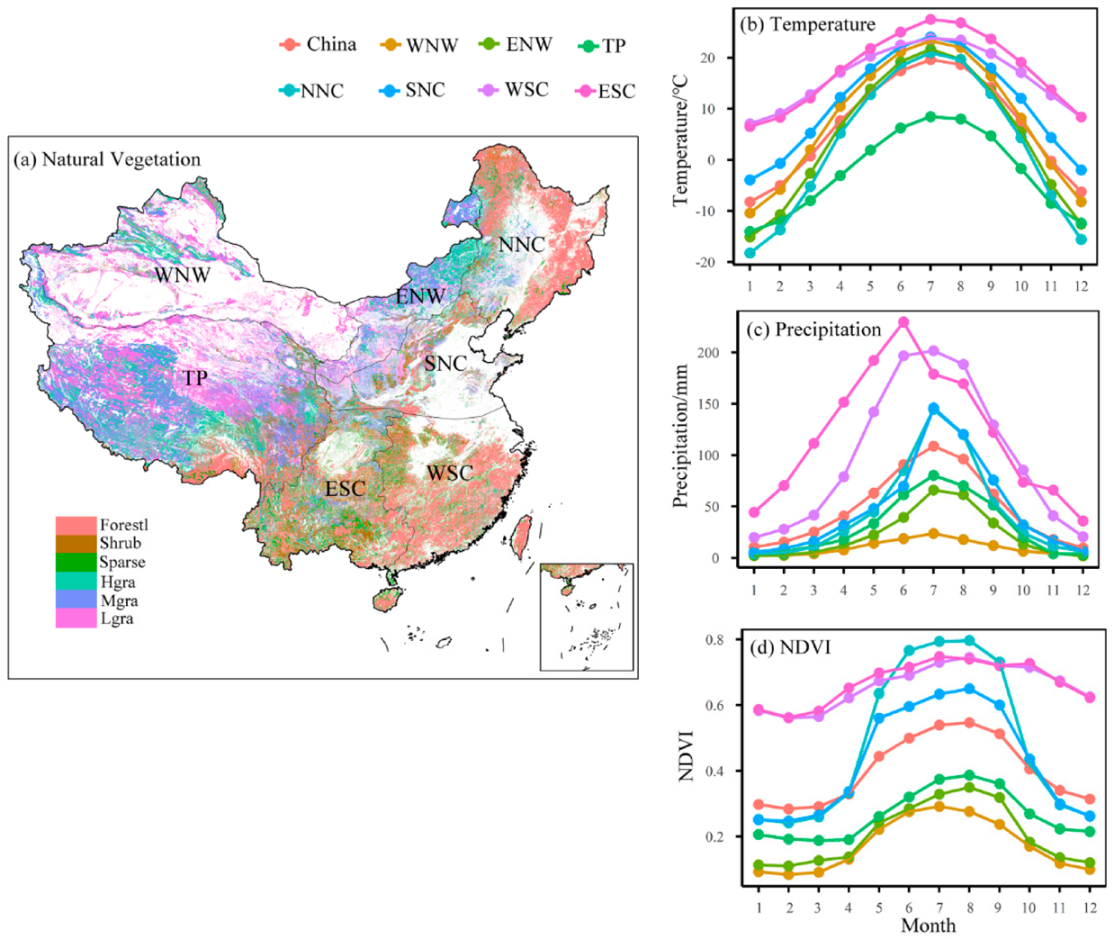
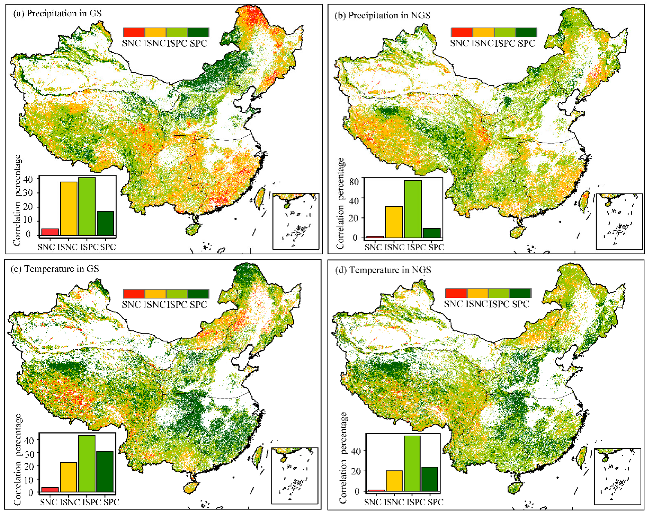
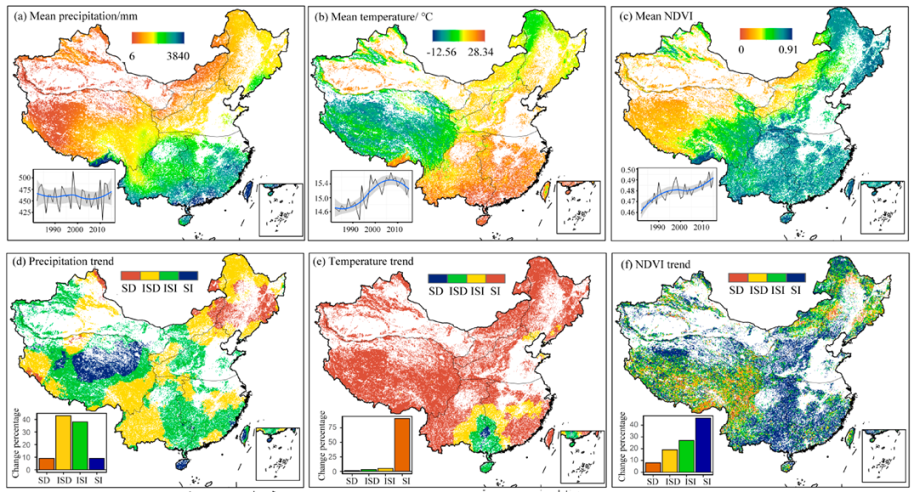
Temperature in China showed a significant increasing trend, whereas there was no significant change in precipitation. Although the NDVI showed a significant increasing trend, there were clear regional differences. The NDVI was positively correlated with precipitation in WNW and ENW, and the proportion of grids showing this correlation was higher for grassland than for forest. Rising air temperature was conducive to increasing the NDVI in WNW. Temperature was shown to be the key factor to controlling the growth of vegetation in TP rather than precipitation. In addition, the NDVI was affected by the temperature of the previous non-growing season. Precipitation is not the main factor affecting forested land in NNC. Rather, temperature had the greatest effect on vegetation, particularly in forests. Precipitation and temperature were both important for vegetation growth in SNC. However, temperature had a greater impact on vegetation in SNC. Temperature was the main environmental factor affecting vegetation dynamics in WSC and ESC, whereas the impact of precipitation was minimal.
(4)
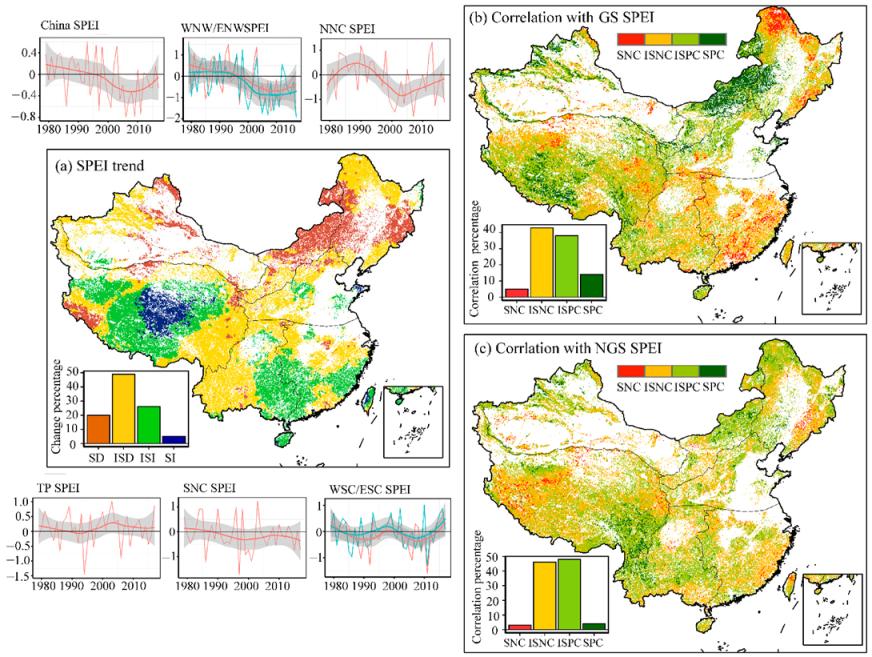
In general, the SPEI showed a significant downward trend, particularly in WNW, ENW, and NNC. Drought had the greatest impact on the NDVI in WNW and ENW, with 21% and 56% of grids in this area showing a significantly positive correlation between the NDVI and the SPEI, with a higher proportion of grids showing this relationship for grassland than for forest. Approximately 10% of grids in TP, NNC, and SNC showed this significantly positive correlation, with this positive correlation much higher in grassland than in forest. The correlation between the NDVI and drought was weak in WSC and ESC, indicating that drought is not the main factor limiting vegetation growth.

Supplementary Materials

The following are available online at https://www.mdpi.com/article/10.3390/land10090966/s1, Table S1: Land Use Transfer matrix between different land use/cover change in different regions of China. Table S2: Percentage of the correlation coefficients between NDVI and climate variables (SNC—Significant negative correlation; ISNC—Insignificant negative correlation; ISPC—Insignificant positive correlation; SPC—Significant positive correlation). Table S3: Percentage of grid with trends for SPEI (SD—Significant decrease trend; ISD—Insignificant decrease trend; ISI—Insignificant increase trend; SI—Significant increase trend). Table S4: Percentage of the correlation coefficients between NDVI and SPEI (SNC—Significant negative correlation; ISNC—Insignificant negative correlation; ISPC—Insignificant positive correlation; SPC—Significant positive correlation).

Author Contributions

H.W. and L.C. contributed to the conception of the study. H.W. and Z.L. performed the data analyses. R.F. and Y.P. wrote the manuscript. All authors have read and agreed to the published version of the manuscript.

Funding

This research was supported by the National Key Research and Development Program of China (2019YFA0606902) and National Natural Science Foundation of China (41830863, 51879162, and 41701034).

Data Availability Statement

The data that support the findings of this study are available from the corresponding author upon reasonable request.

Acknowledgments

The authors thank the National Climate Center, China Meteorological Administration, for providing the meteorological data for this study. The authors would like to thank all the reviewers who participated in the review.

Conflicts of Interest

The authors declare no conflict of interest.

References

  1. Jia, L.; Li, Z.B.; Xu, G.C.; Ren, Z.P.; Li, P.; Cheng, Y.T.; Zhang, Y.X.; Wang, B.; Zhang, J.-X.; Yu, S. Dynamic change of vegetation and its response to climate and topographic factors in the Xijiang River basin, China. Environ. Sci. Pollut. R 2020, 27, 11637–11648. [Google Scholar] [CrossRef]
  2. Thomas, C.D.; Cameron, A.; Green, R.E.; Bakkenes, M.; Beaumont, L.J.; Collingham, Y.C.; Erasmus, B.F.; Siqueira, M.D.; Grainger, A.; Hannah, L. Extinction risk from climate change. Nature 2004, 427, 145. [Google Scholar] [CrossRef]
  3. Maclean, I.M.; Wilson, R.J. Recent ecological responses to climate change support predictions of high extinction risk. Proc. Natl. A Sci. 2011, 108, 12337–12342. [Google Scholar] [CrossRef] [Green Version]
  4. Zheng, H.; Shen, G.; He, X.; Yu, X.; Ren, Z.; Zhang, D. Spatial assessment of vegetation vulnerability to accumulated drought in Northeast China. Reg. Environ. Chang. 2015, 15, 1639–1650. [Google Scholar] [CrossRef]
  5. Kasoro, F.R.; Yan, L.; Zhang, W.; Asante-Badu, B. Spatial and temporal changes of vegetation cover in china based on modis ndvi. Appl. Ecol. Environ. Res. 2021, 19, 1371–1390. [Google Scholar] [CrossRef]
  6. Luo, N.; Mao, D.; Wen, B.; Liu, X. Climate Change Affected Vegetation Dynamics in the Northern Xinjiang of China: Evaluation by SPEI and NDVI. Land 2020, 9, 90. [Google Scholar] [CrossRef] [Green Version]
  7. Song, X.-P.; Hansen, M.C.; Stehman, S.V.; Potapov, P.V.; Tyukavina, A.; Vermote, E.F.; Townshend, J.R. Global land change from 1982 to 2016. Nature 2018, 560, 639–643. [Google Scholar] [CrossRef] [PubMed]
  8. Chen, C.; Park, T.; Wang, X.; Piao, S.; Xu, B.; Chaturvedi, R.K.; Fuchs, R.; Brovkin, V.; Ciais, P.; Fensholt, R. China and India lead in greening of the world through land-use management. Nat. Sustain. 2019, 2, 122–129. [Google Scholar] [CrossRef]
  9. Wu, D.; Wu, H.; Zhao, X.; Zhou, T.; Tang, B.; Zhao, W.; Jia, K. Evaluation of spatiotemporal variations of global fractional vegetation cover based on GIMMS NDVI data from 1982 to 2011. Remote Sens. 2014, 6, 4217–4239. [Google Scholar] [CrossRef] [Green Version]
  10. Piao, S.; Wang, X.; Ciais, P.; Zhu, B.; Wang, T.; Liu, J. Changes in satellite-derived vegetation growth trend in temperate and boreal Eurasia from 1982 to 2006. Global. Chang. Biol. 2011, 17, 3228–3239. [Google Scholar] [CrossRef]
  11. Zheng, K.; Tan, L.; Sun, Y.; Wu, Y.; Duan, Z.; Xu, Y.; Gao, C. Impacts of climate change and anthropogenic activities on vegetation change: Evidence from typical areas in China. Ecol. Indic. 2021, 126, 107648. [Google Scholar] [CrossRef]
  12. Zhou, L.; Tucker, C.J.; Kaufmann, R.K.; Slayback, D.; Shabanov, N.V.; Myneni, R.B. Variations in northern vegetation activity inferred from satellite data of vegetation index during 1981 to 1999. J. Geophys. Res.-Atmos. 2001, 106, 20069–20083. [Google Scholar] [CrossRef]
  13. Lamchin, M.; Lee, W.-K.; Jeon, S.W.; Wang, S.W.; Lim, C.H.; Song, C.; Sung, M. Long-term trend and correlation between vegetation greenness and climate variables in Asia based on satellite data. Sci. Total Environ. 2018, 618, 1089–1095. [Google Scholar] [CrossRef] [PubMed]
  14. Sun, W.; Song, X.; Mu, X.; Gao, P.; Wang, F.; Zhao, G. Spatiotemporal vegetation cover variations associated with climate change and ecological restoration in the Loess Plateau. Agric. Forest Meteorol. 2015, 209, 87–99. [Google Scholar] [CrossRef]
  15. Guo, J.; Hu, Y.; Xiong, Z.; Yan, X.; Ren, B.; Bu, R. Spatiotemporal Variations of Growing-Season NDVI Associated with Climate Change in Northeastern China’s Permafrost Zone. Pol. J. Environ. Stud. 2017, 26, 1521–1530. [Google Scholar] [CrossRef]
  16. Lin, X.; Niu, J.; Berndtsson, R.; Yu, X.; Zhang, L.; Chen, X. NDVI dynamics and its response to climate change and reforestation in Northern China. Remote Sens. 2020, 12, 4138. [Google Scholar] [CrossRef]
  17. Li, P.; Wang, J.; Liu, M.; Xue, Z.; Bagherzadeh, A.; Liu, M. Spatio-temporal variation characteristics of NDVI and its response to climate on the Loess Plateau from 1985 to 2015. Catena 2021, 203, 105331. [Google Scholar] [CrossRef]
  18. Pang, G.; Wang, X.; Yang, M. Using the NDVI to identify variations in, and responses of, vegetation to climate change on the Tibetan Plateau from 1982 to 2012. Quat. Int. 2017, 444, 87–96. [Google Scholar] [CrossRef]
  19. Wang, H.; Pan, Y.; Chen, Y. Comparison of three drought indices and their evolutionary characteristics in the arid region of northwestern China. Atmos. Sci. Lett. 2017, 18, 132–139. [Google Scholar] [CrossRef]
  20. Beguería, S.; Vicente-Serrano, S.M.; Reig, F.; Latorre, B. Standardized precipitation evapotranspiration index (SPEI) revisited: Parameter fitting, evapotranspiration models, tools, datasets and drought monitoring. Int. J. Climatol. 2014, 34, 3001–3023. [Google Scholar] [CrossRef] [Green Version]
  21. Li, X.; Li, Y.; Chen, A.; Gao, M.; Slette, I.J.; Piao, S. The impact of the 2009/2010 drought on vegetation growth and terrestrial carbon balance in Southwest China. Agric. Forest Meteorol. 2019, 269, 239–248. [Google Scholar] [CrossRef]
  22. Fang, W.; Huang, S.; Huang, Q.; Huang, G.; Wang, H.; Leng, G.; Wang, L.; Li, P.; Ma, L. Bivariate probabilistic quantification of drought impacts on terrestrial vegetation dynamics in mainland China. J. Hydrol. 2019, 577, 123980. [Google Scholar] [CrossRef]
  23. Xu, H.J.; Wang, X.P.; Zhao, C.Y.; Zhang, X.X. Responses of ecosystem water use efficiency to meteorological drought under different biomes and drought magnitudes in northern China. Agric. Forest Meteorol. 2019, 278, 107660. [Google Scholar] [CrossRef]
  24. Vicente-Serrano, S.M.; Gouveia, C.; Camarero, J.J.; Beguería, S.; Trigo, R.; López-Moreno, J.I.; Azorín-Molina, C.; Pasho, E.; Lorenzo-Lacruz, J.; Revuelto, J. Response of vegetation to drought time-scales across global land biomes. Proc. Natl. Acad. Sci. USA 2013, 110, 52–57. [Google Scholar] [CrossRef] [PubMed] [Green Version]
  25. Wang, H.; Chen, Y.; Pan, Y.; Chen, Z.; Ren, Z. Assessment of candidate distributions for SPI/SPEI and sensitivity of drought to climatic variables in China. Int. J. Climatol. 2019, 39, 4392–4412. [Google Scholar] [CrossRef]
  26. Wang, H.; Liu, X.; Zhang, X.; Wang, P.; Lin, H.; Yu, L. Spatiotemporal crop NDVI responses to climatic factors in mainland China. Int. J. Remote Sens. 2019, 40, 89–103. [Google Scholar] [CrossRef]
  27. Zhou, Y.; Fu, D.; Lu, C.; Xu, X.; Tang, Q. Positive effects of ecological restoration policies on the vegetation dynamics in a typical ecologically vulnerable area of China. Ecol. Eng. 2021, 159, 106087. [Google Scholar] [CrossRef]
  28. Yu, M.; Gao, Q. Increasing Summer Rainfall and Asymmetrical Diurnal and Seasonal Warming Enhanced Vegetation Greenness in Temperate Deciduous Forests and Grasslands of Northern China. Remote Sens. 2020, 12, 2569. [Google Scholar] [CrossRef]
  29. Peng, S.Z.; Ding, Y.X.; Liu, W.Z.; Li, Z. 1 km monthly temperature and precipitation dataset for China from 1901 to 2017. Earth Syst. Sci. Data 2019, 11, 1931–1946. [Google Scholar] [CrossRef] [Green Version]
  30. Eklundh, L.; Jönsson, P. TIMESAT for processing time-series data from satellite sensors for land surface monitoring. In Multitemporal Remote Sensing; Ban, Y., Ed.; Springer International Publishing: Berlin/Heidelberg, Germany, 2016; pp. 177–194. [Google Scholar]
  31. Nally, R.M. Hierarchical partitioning as an interpretative tool in multivariate inference. Aust. J. Ecol. 1996, 21, 224–228. [Google Scholar] [CrossRef]
  32. Sen, P.K. Estimates of the regression coefficient based on Kendall’s Tau. J. Am. Stat. Assoc. 1968, 63, 1379–1389. [Google Scholar] [CrossRef]
  33. Kendall, M.G. Rank-Correlation Measures; Charles Griffin: London, UK, 1975. [Google Scholar]
  34. Yue, S.; Pilon, P.; Cavadias, G. Power of the Mann–Kendall and Spearman’s rho tests for detecting monotonic trends in hydrological series. J. Hydrol. 2002, 259, 254–271. [Google Scholar] [CrossRef]
  35. Bronaugh, D.; Werner, A. Zyp: Zhang + Yue-Pilon Trends Package. R Package Version 0.10-1. 2013. Available online: https://CRAN.Rproject.org/package=zyp (accessed on 5 October 2018).
  36. Zhao, A.; Zhang, A.; Liu, J.; Feng, L.; Zhao, Y. Assessing the effects of drought and “Grain for Green” Program on vegetation dynamics in China′s Loess Plateau from 2000 to 2014. Catena 2019, 175, 446–455. [Google Scholar] [CrossRef]
  37. Zhang, X.; Du, X.; Hong, J.; Du, Z.; Lu, X.; Wang, X. Effects of climate change on the growing season of alpine grassland in Northern Tibet, China. Glob. Ecol. Conserv. 2020, 23, e01126. [Google Scholar] [CrossRef]
  38. Zhang, Q.; Kong, D.; Singh, V.P.; Shi, P. Response of vegetation to different time-scales drought across China: Spatiotemporal patterns, causes and implications. Glob. Planet. Chang. 2017, 152, 1–11. [Google Scholar] [CrossRef] [Green Version]
  39. Xu, W.; Liu, H.; Zhang, Q.; Liu, P. Response of vegetation ecosystem to climate change based on remote sensing and information entropy: A case study in the arid inland river basin of China. Environ. Earth Sci. 2021, 80, 1–14. [Google Scholar] [CrossRef]
  40. Yu, Y.; Shen, Y.; Wang, J.; Wei, Y.; Nong, L.; Deng, H. Assessing the response of vegetation change to drought during 2009-2018 in Yunnan Province, China. Environ. Sci. Pollut. R 2021, 1–17. [Google Scholar] [CrossRef]
  41. Xu, H.J.; Wang, X.P.; Zhao, C.Y.; Yang, X.M. Assessing the response of vegetation photosynthesis to meteorological drought across northern China. Land Degrad. Dev. 2021, 32, 20–34. [Google Scholar] [CrossRef]
  42. Davidson, E.A.; Verchot, L.V.; Cattânio, J.H.; Ackerman, I.L.; Carvalho, J. Effects of soil water content on soil respiration in forests and cattle pastures of eastern Amazonia. Biogeochemistry 2000, 48, 53–69. [Google Scholar] [CrossRef]
  43. Thavorntam, W.; Tantemsapya, N. Vegetation greenness modeling in response to climate change for Northeast Thailand. J. Geogr. Sci. 2013, 23, 1052–1068. [Google Scholar] [CrossRef]
  44. Zhou, K.; Li, J.; Zhang, T.; Kang, A. The use of combined soil moisture data to characterize agricultural drought conditions and the relationship among different drought types in China. Agric. Water Manag. 2021, 243, 106479. [Google Scholar] [CrossRef]
  45. Zhao, W.; Hu, Z.; Guo, Q.; Wu, G.; Chen, R.; Li, S. Contributions of Climatic Factors to Interannual Variability of the Vegetation Index in Northern China Grasslands. J. Clim. 2020, 33, 175–183. [Google Scholar] [CrossRef]
  46. Xia, J.; Yan, Z.; Jia, G.; Zeng, H.; Jones, P.D.; Zhou, W.; Zhang, A. Projections of the advance in the start of the growing season during the 21st century based on CMIP5 simulations. Adv. Atmos. Sci. 2015, 32, 831–838. [Google Scholar] [CrossRef]
  47. Garonna, I.; De Jong, R.; De Wit, A.J.; Mücher, C.A.; Schmid, B.; Schaepman, M.E. Strong contribution of autumn phenology to changes in satellite-derived growing season length estimates across Europe (1982–2011). Glob. Chang. Biol. 2014, 20, 3457–3470. [Google Scholar] [CrossRef]
  48. Piao, S.; Fang, J.; Zhou, L.; Ciais, P.; Zhu, B. Variations in satellite-derived phenology in China’s temperate vegetation. Glob. Chang. Biol. 2006, 12, 672–685. [Google Scholar] [CrossRef]
  49. He, Z.; Du, J.; Chen, L.; Zhu, X.; Lin, P.; Zhao, M.; Fang, S. Impacts of recent climate extremes on spring phenology in arid-mountain ecosystems in China. Agric. Forest Meteorol. 2018, 260, 31–40. [Google Scholar] [CrossRef]
  50. Toledo, M.; Poorter, L.; Pea-Claros, M.; Alarcón, A.; Bongers, F. Climate is a stronger driver of tree and forest growth rates than soil and disturbance. J. Ecol. 2011, 99, 254–264. [Google Scholar] [CrossRef]
  51. Temperature, precipitation, and insolation effects on autumn vegetation phenology in temperate China. Glob. Chang. Biol. 2016, 22, 644–655. [CrossRef]
  52. Wang, X.; Wu, C.; Peng, D.; Gonsamo, A.; Liu, Z. Snow cover phenology affects alpine vegetation growth dynamics on the Tibetan Plateau: Satellite observed evidence, impacts of different biomes, and climate drivers. Agric. Forest Meteorol. 2018, 256, 61–74. [Google Scholar] [CrossRef]
  53. Chen, H.; Zhu, Q.; Wu, N.; Wang, Y.; Peng, C. Delayed spring phenology on the Tibetan Plateau may also be attributable to other factors than winter and spring warming. Proc. Natl. Acad. Sci. USA 2011, 108, E93. [Google Scholar] [CrossRef] [PubMed] [Green Version]
  54. Yi, S.; Zhou, Z. Increasing contamination might have delayed spring phenology on the Tibetan Plateau. Proc. Natl. Acad. Sci. USA 2011, 108, E94. [Google Scholar] [CrossRef] [Green Version]
  55. Zhang, G.; Zhang, Y.; Dong, J.; Xiao, X. Green-up dates in the Tibetan Plateau have continuously advanced from 1982 to 2011. Proc. Natl. Acad. Sci. USA 2013, 110, 4309–4314. [Google Scholar] [CrossRef] [PubMed] [Green Version]
  56. Zhang, X.; Friedl, M.A.; Schaaf, C.B.; Strahler, A.H. Climate controls on vegetation phenological patterns in northern mid-and high latitudes inferred from MODIS data. Glob. Chang. Biol. 2004, 10, 1133–1145. [Google Scholar] [CrossRef]
  57. Spano, D.; Cesaraccio, C.; Duce, P.; Snyder, R.L. Phenological stages of natural species and their use as climate indicators. Int. J. Biometeorol. 1999, 42, 124–133. [Google Scholar] [CrossRef]
  58. Potop, V.; Možný, M.; Soukup, J. Drought evolution at various time scales in the lowland regions and their impact on vegetable crops in the Czech Republic. Agric. For. Meteorol. 2012, 156, 121–133. [Google Scholar] [CrossRef]
  59. Liu, Z.P.; Wang, Y.Q.; Shao, M.G.; Jia, X.X.; Li, X.L. Spatiotemporal analysis of multiscalar drought characteristics across the Loess Plateau of China. J. Hydrol. 2016, 534, 281–299. [Google Scholar] [CrossRef]
  60. Knapp, A.K.; Carroll, C.J.; Denton, E.M.; La Pierre, K.J.; Collins, S.L.; Smith, M.D. Differential sensitivity to regional-scale drought in six central US grasslands. Oecologia 2015, 177, 949–957. [Google Scholar] [CrossRef] [PubMed] [Green Version]
  61. Phillips, O.L.; Aragão, L.E.O.C.; Lewis, S.L. Drought sensitivity of the Amazon rainfores. Science 2009, 323, 1344–1347. [Google Scholar] [CrossRef] [Green Version]
  62. Yan, M.; Xue, M.; Zhang, L.; Tian, X.; Chen, B.; Dong, Y. A Decade′s Change in Vegetation Productivity and Its Response to Climate Change over Northeast China. Plants-Basel 2021, 10, 821. [Google Scholar] [CrossRef]
  63. Wang, M.; Gong, Y.; Lafleur, P.; Wu, Y. Patterns and drivers of carbon, nitrogen and phosphorus stoichiometry in Southern China’s grasslands. Sci. Total Environ. 2021, 785, 147201. [Google Scholar] [CrossRef]
  64. Wang, H.; Yan, S.; Liang, Z.; Jiao, K.; Li, D.; Wei, F.; Li, S. Strength of association between vegetation greenness and its drivers across China between 1982 and 2015: Regional differences and temporal variations. Ecol. Indic. 2021, 128, 107831. [Google Scholar] [CrossRef]
  65. Jiang, S.; Chen, X.; Smettem, K.; Wang, T. Climate and land use influences on changing spatiotemporal patterns of mountain vegetation cover in southwest China. Ecol. Indic. 2021, 121, 107193. [Google Scholar] [CrossRef]
  66. Peng, J.; Jiang, H.; Liu, Q.; Green, S.M.; Quine, T.A.; Liu, H.; Qiu, S.; Liu, Y.; Meersmans, J. Human activity vs. climate change: Distinguishing dominant drivers on LAI dynamics in karst region of southwest China. Sci. Total Environ. 2021, 769, 144297. [Google Scholar] [CrossRef] [PubMed]
Figure 1. The distributions of natural vegetation (a), monthly temperature (b), precipitation (c), and Normalized Difference Vegetation Index (NDVI) (d) across China. Abbreviations: TP—Qinghai-Tibet alpine region; WNW—Western arid and semi-arid region; ENW—Eastern arid and semi-arid region; SNC—Southern North China; WSC—Western South China; ESC—Eastern South China; NNC—Northern North China; NDVI—Normalized Difference Vegetation Index.
Land 10 00966 g001
Figure 2. Gross change, net gain, and net loss of different land use/land cover (LUCC) in China from 1980 to 2015. (a) Throughout China; (b) WNW—Western arid and semi-arid region; (c) ENW—Eastern arid and semi-arid region; (d) TP—Qinghai-Tibet alpine region; (e) NNC—Northern North China; (f) SNC—Southern North China; (g) WSC—Western South China; (h) ESC—Eastern South China.
Land 10 00966 g002
Figure 3. Areas and proportions of different types of natural forest and grassland in China from 1980 to 2015. (a) China; (b) WNW—Western arid and semi-arid region; (c) ENW—Eastern arid and semi-arid region: (d) TP—Qinghai-Tibet alpine region; (e) NNC—Northern North China; (f) SNC—Southern North China; (g) WSC—Western South China; (h) ESC—Eastern South China.
Land 10 00966 g003
Figure 4. The temporal and spatial changes to the start of the growing season (SOS; (a,d)), end of the growing season (EOS; (b,e)), and growing season length (GSL; (c,f)) in China (SD—Significant decrease trend; ISD—Insignificant decrease trend; ISI—Insignificant increase trend; SI—Significant increase trend).
Land 10 00966 g004
Figure 5. Percentage of grids with trends for phenological parameters (SD—significant decrease trend; ISD—insignificant decrease trend; ISI—insignificant increase trend; SI—significant increase trend. Abbreviations: Agrl—Agricultural land; Watr—Water bodies; Uril—Urban and rural land; Bald—Unutilized land; Forestl—Forest land; Shrubl—Shrubland; Sparsel—Sparse forest land; Hgra—High coverage grassland; Mgra—Medium coverage grassland; Lgra—Low coverage grassland; Snga—Permanent snow and glacier; WNW—Western arid and semi-arid region; ENW—Eastern arid and semi-arid region; TP—Qinghai-Tibet alpine region; NNC—Northern North China; SNC—Southern North China; WSC—Western South China; ESC—Eastern South China).
Land 10 00966 g005
Figure 6. The mean and trends of precipitation (a,d), temperature (b,e), and the Normalized Difference Vegetation Index (NDVI; (c,f)) during the growing season in China (SD—Significant decrease trend; ISD—Insignificant decrease trend; ISI—Insignificant increase trend; SI—Significant increase trend)).
Land 10 00966 g006
Figure 7. The correlation coefficients between the Normalized Difference Vegetation Index (NDVI) and climate variables in China. (a,c): Correlation between the growing season (GS) and the NDVI; (b,d): correlation between the GS NDVI and the previous non-growing season (NGS); SNC—Significant negative correlation; ISNC—Insignificant negative correlation; ISPC—Insignificant positive correlation; SPC—Significant positive correlation.
Land 10 00966 g007
Figure 8. The changes to the Standardized Precipitation Evapotranspiration Index (SPEI) (a) and correlations between the SPEI and the Normalized Difference Vegetation Index (NDVI) in China (b): during the growing season (GS); (c): between the NDVI of the current GS and the SPEI of the previous non growing season (NGS).
Land 10 00966 g008
Table 1. The areas and relative changes to different land use/land cover (LUCC) in China from 1980 to 2015.
AgrlWatrUrilBaldForestlShrublSparselHgraMgraLgraSnga
China19801,762,034202,729148,9451,996,4991,372,015486,377398,4111,020,4301,096,193931,24384,952
20151,786,003211,092221,8631,984,5361,353,990486,920399,242995,1061,081,483913,98769,009
%1.364.1348.96−0.60−1.310.110.21−2.48−1.34−1.85−18.77
WNW198069,257981943961,167,63522,24811,1258445103,70799,511239,76517,319
201592,11811,76183171,159,58821,52111,1198608101,94995,808225,11817,316
%33.0119.7889.20−0.69−3.27−0.051.93−1.70−3.72−6.11−0.02
ENW198078,57412,321720290,230472865583527147,240176,40497,1310
201578,41211,69311,65788,793566164854118143,826174,02699,2430
%−0.21−5.1061.86−1.5919.73−1.1116.76−2.32−1.352.170.00
TP198018,62858,5171132653,283154,99195,67724,977422,809562,793522,59067,206
201518,85260,5652312665,480154,32595,40325,278424,553563,509521,02551,299
%1.203.50104.241.87−0.43−0.291.210.410.13−0.30−23.67
NNC1980320,34027,99226,10074,683420,31044,05752,876141,42853,23111,9440
2015373,66926,67630,54562,293405,57445,92746,562119,51550,92711,3112
%16.65−4.7017.03−16.59−3.514.25−11.94−15.49−4.33−5.300
SNC1980490,43922,41762,113528975,57454,97226,60458,50085,79348,8769
2015474,40821,55581,278387174,97755,06028,25059,22284,22247,7559
%−3.27−3.8530.86−26.81−0.790.166.191.23−1.83−2.290
WSC1980345,23299568874679235,450206,443143,86597,47399,79868309
2015337,74211,50916,723821233,329206,197145,43598,44298,068637512
%−2.1715.6088.4520.91−0.90−0.121.090.99−1.73−6.6633.33
ESC1980436,06751,66337,9792846456,25366,864137,18047,60118,11136950
2015407,20356,98166,7662257456,11666,051140,09145,80614,35127330
%−6.6210.2975.80−20.70−0.03−1.222.12−3.77−20.76−26.040
Abbreviations: Agrl—Agricultural land; Watr—Water bodies; Uril—Urban and rural land; Bald—Unutilized land; Forestl—Forest land; Shrubl—Shrubland; Sparsel—Sparse forest land; Hgra—High coverage grassland; Mgra—Medium coverage grassland; Lgra—Low coverage grassland; Snga—Permanent snow and glacier; WNW—Western arid and semi-arid region; ENW—Eastern arid and semi-arid region; TP—Qinghai-Tibet alpine region; NNC—Northern North China; SNC—Southern North China; WSC—Western South China; ESC—Eastern South China.
Table 2. The mean and trends in the start of growing season (SOS), end of growing season (EOS), and growing season length (GSL) in China (significant trends at 0.05 significance level are indicated in bold).
Growing Season (Day of Year)Trend (Days/34 Years)Contribution Rate for GSL (%)
SOSEOSGSLSOSEOSGSLSOSEOS
ChinaNaturalv114263149−5285346.8
Forestl108267159−65124555.1
Shrubl112274162−10074851.7
Sparsel107281173−14−1134060.2
Hgra119257139−5365544.9
Mgra122258136−4276040.5
Lgra126256130−1125545.2
WNWNaturalv108255147−129215148.9
Forestl109254145−1211235149.1
Shrubl105258152−1210235149.1
Sparsel109254145−511154654.1
Hgra112253141−129215644.5
Mgra105255150−129195049.8
Lgra105255150−129195049.8
ENWNaturalv120255135−8110946.3
Forestl119252133−45106436.3
Shrubl119254136−53108811.8
Sparsel119253134−75126436
Hgra121254133−9010937.5
Mgra120255135−7298416.3
Lgra1202551360348911.5
TPNaturalv1352601252−4−96139.2
Forestl132352219175−123466.3
Shrubl1312661352−5−75545.5
Sparsel1313011707833564.6
Hgra1332591272−3−66238.3
Mgra1332571231−1−26733.3
Lgra1362541171−2−46534.6
NNCNaturalv111253142−1687129
Forestl109254145−2796832.1
Shrubl112252141−1686732.9
Sparsel111253142−37116337.2
Hgra115250135−3477327
Mgra1212521310318019.7
Lgra12625112621−38811.6
SNCNaturalv102263161−98165445.6
Forestl99265166−108185445.9
Shrubl103262159−97165544.8
Sparsel101263162−109195644.2
Hgra103261159−98185743
Mgra103262159−78155445.6
Lgra108260152−79185347.3
WSCNaturalv111311200−23−3165643.6
Forestl109326218−23−5166337.4
Shrubl112310197−22−7165742.9
Sparsel112307195−23−2215644.4
Hgra123319196−18−1116435.8
Mgra103287184−269375247.8
Lgra115283168−235285446.4
ESCNaturalv95312216−263244554.9
Forestl96318221−207215050.2
Shrubl88298210−231273267.6
Sparsel95303207−254283663.6
Hgra94306213−244253465.8
Mgra97304207−313374654.1
Lgra107338231−18−4153862.3
Abbreviations: Agrl—Agricultural land; Watr—Water bodies; Uril—Urban and rural land; Bald—Unutilized land; Forestl—Forest land; Shrubl—Shrubland; Sparsel—Sparse forest land; Hgra—High coverage grassland; Mgra—Medium coverage grassland; Lgra—Low coverage grassland; Snga—Permanent snow and glacier; WNW—Western arid and semi-arid region; ENW—Eastern arid and semi-arid region; TP—Qinghai-Tibet alpine region; NNC—Northern North China; SNC—Southern North China; WSC—Western South China; ESC—Eastern South China.
Table 3. Regional changes to the Normalized Difference Vegetation Index (NDVI) in China and the correlations between the NDVI and precipitation and between the NDVI and temperature during the growing season (significant trends and correlations at the 0.05 significant level are indicated in bold).
RegionVegetationTrendCorrelation Coefficients
Temperature (℃/a)Precipitation (mm/a)NDVIPTSPEI
ChinaNaturalv0.0300.1870.0010.120.65−0.24
Forestl0.0230.3290.001−0.070.42−0.19
Shrubl0.0220.2750.001−0.040.58−0.23
Sparsel0.0220.5870.001−0.050.61−0.23
Hgra0.030−0.0600.0000.400.490.21
Mgra0.0310.0780.0010.290.60−0.03
Lgra0.0350.4180.0010.340.62−0.13
WNWNaturalv0.0420.1840.0000.470.57−0.09
Forestl0.0390.4220.0000.350.560.04
Shrubl0.0400.3830.0000.450.260.11
Sparsel0.0380.3780.0010.360.62−0.15
Hgra0.0400.3550.0000.430.530.13
Mgra0.0390.4290.0010.610.370.22
Lgra0.0420.1710.0000.430.48−0.05
ENWNaturalv0.047−0.4380.0000.660.090.46
Forestl0.043−0.1140.0010.580.120.42
Shrubl0.047−0.2730.0000.580.050.45
Sparsel0.041−0.0200.0010.480.230.33
Hgra0.047−0.8300.0000.71−0.070.59
Mgra0.047−0.4520.0010.620.140.40
Lgra0.046−0.0110.0010.540.250.28
TPNaturalv0.0250.3650.0000.060.48−0.17
Forestl0.016−0.1640.0000.040.010.00
Shrubl0.0190.1300.0000.020.28−0.10
Sparsel0.0180.1750.0000.040.12−0.08
Hgra0.0220.4250.0000.220.320.19
Mgra0.0240.4390.0000.060.45−0.04
Lgra0.0270.6680.0000.120.55−0.09
NNCNaturalv0.031−1.4200.000−0.180.23−0.16
Forestl0.030−1.2290.000−0.330.28−0.33
Shrubl0.032−1.1280.000−0.040.14−0.02
Sparsel0.033−0.9700.001−0.130.32−0.16
Hgra0.036−1.3400.0000.200.060.20
Mgra0.033−1.2240.0010.320.050.32
Lgra0.034−1.0100.0010.390.040.35
SNCNaturalv0.0320.6570.0020.220.390.06
Forestl0.0340.0670.0020.060.43−0.09
Shrubl0.0340.2230.0020.180.360.01
Sparsel0.0330.5920.0020.180.44−0.01
Hgra0.0330.0810.0020.170.400.00
Mgra0.0360.5780.0020.230.400.05
Lgra0.0360.7760.0030.290.370.09
WSCNaturalv0.0130.4930.001−0.060.48−0.17
Forestl0.0110.6260.001−0.040.38−0.13
Shrubl0.0120.5680.001−0.050.42−0.14
Sparsel0.0120.4540.001−0.030.49−0.13
Hgra0.0140.1430.0010.020.41−0.08
Mgra0.017−0.7730.001−0.110.60−0.25
Lgra0.014−0.1610.001−0.030.46−0.16
WSCNaturalv0.0211.3030.001−0.140.59−0.27
Forestl0.0201.6490.001−0.180.56−0.29
Shrubl0.0220.9140.002−0.120.64−0.27
Sparsel0.0190.8930.002−0.060.59−0.18
Hgra0.0221.2000.002−0.100.56−0.23
Mgra0.0231.4240.002−0.020.62−0.16
Lgra0.0203.5530.001−0.150.55−0.22
Abbreviations: Agrl—Agricultural land; Watr—Water bodies; Uril—Urban and rural land; Bald—Unutilized land; Forestl—Forest land; Shrubl—Shrubland; Sparsel—Sparse forest land; Hgra—High coverage grassland; Mgra—Medium coverage grassland; Lgra—Low coverage grassland; Snga—Permanent snow and glacier; WNW—Western arid and semi-arid region; ENW—Eastern arid and semi-arid region; TP—Qinghai-Tibet alpine region; NNC—Northern North China; SNC—Southern North China; WSC—Western South China; ESC—Eastern South China.
Table 4. Regional trends in the Standardized Precipitation Evapotranspiration Index (SPEI) during the growing season in China (significant trends at the 0.05 significant level are indicated in bold).
VegetationChinaWNWENWTPNNCSNCWSCESC
Naturalv−0.01585−0.0304−0.03668−0.0016−0.03574−0.00572−0.00714−0.00314
Forestl−0.01563−0.02704−0.02631−0.01151−0.03644−0.02102−0.001640.000203
Shrubl−0.00944−0.0249−0.03157−0.01286−0.03624−0.01717−0.00451−0.0048
Sparsel−0.00883−0.02735−0.02394−0.00891−0.03733−0.01235−0.00467−0.00383
Hgra−0.01499−0.02528−0.048760.007516−0.04078−0.01909−0.01033−0.00099
Mgra−0.01219−0.0248−0.041270.001576−0.04229−0.01201−0.01124−0.00301
Lgra−0.00978−0.02977−0.031820.003461−0.04378−0.00959−0.01050.009922
Abbreviations: Agrl—Agricultural land; Watr—Water bodies; Uril—Urban and rural land; Bald—Unutilized land; Forestl—Forest land; Shrubl—Shrubland; Sparsel—Sparse forest land; Hgra—High coverage grassland; Mgra—Medium coverage grassland; Lgra—Low coverage grassland; Snga—Permanent snow and glacier; WNW—Western arid and semi-arid region; ENW—Eastern arid and semi-arid region; TP—Qinghai-Tibet alpine region; NNC—Northern North China; SNC—Southern North China; WSC—Western South China; ESC—Eastern South China.
Table 5. Percentage of different correlation types between the Normalized Difference Vegetation Index (NDVI) and the Standardized Precipitation Evapotranspiration Index (SPEI) during the growing season (GS) in China (SNC—Significant negative correlation; ISNC—Insignificant negative correlation; ISPC—Insignificant positive correlation; SPC—Significant positive correlation).
ChinaWNWENWNNC
SPCISPCSNCISNCSPCISPCSNCISNCSPCISPCSNCISNCSPCISPCSNCISNC
Naturalv0.130.380.060.430.210.410.050.330.560.370.000.070.110.260.160.47
Forestl0.020.240.130.610.180.450.040.330.340.470.000.190.020.210.190.58
Shrubl0.060.390.050.500.240.330.030.400.410.500.000.090.200.230.210.36
Sparsel0.030.340.060.560.090.430.060.420.440.440.000.120.080.350.150.42
Hgra0.240.420.040.310.220.450.020.310.710.270.000.020.290.310.110.28
Mgra0.190.470.020.320.300.430.020.240.540.390.000.070.310.450.040.21
Lgra0.140.460.040.350.180.380.070.380.390.470.000.140.320.520.010.14
Abbreviations: Agrl—Agricultural land; Watr—Water bodies; Uril—Urban and rural land; Bald—Unutilized land; Forestl—Forest land; Shrubl—Shrubland; Sparsel—Sparse forest land; Hgra—High coverage grassland; Mgra—Medium coverage grassland; Lgra—Low coverage grassland; Snga—Permanent snow and glacier; WNW—Western arid and semi-arid region; ENW—Eastern arid and semi-arid region; TP—Qinghai-Tibet alpine region; NNC—Northern North China; SNC—Southern North China; WSC—Western South China; ESC—Eastern South China.
Publisher’s Note: MDPI stays neutral with regard to jurisdictional claims in published maps and institutional affiliations.

