Abstract
Increased impervious surfaces due to urbanization have reduced evaporation and infiltration into the soil compared with existing natural water cycle systems, which causes various problems, such as urban floods, landslides, and deterioration of water quality. To effectively solve the urban water cycle issue, green infrastructure using urban green space has emerged to reduce runoff and increase evaporation. It has the advantage of restoring the water cycle system of urban areas by complementing the failure of conventional stormwater treatment systems. However, urban areas under high-density development have limited green space for stormwater treatment. Hence, it is necessary to efficiently utilize street trees and small green spaces to improve the urban water cycle through green space. In this study, we simulated different green space distribution scenarios in the virtual domain to find the optimal strategy of green space planning. Compared to clustered scenarios, dispersed green space distribution scenarios and placing green space downstream were more effective in reducing the runoff amount. The paper provides insights into the considerations for determining green space spatial plan and zoning regulations for stormwater treatment by green infrastructure.
1. Introduction
Stormwater management is a challenge in urban environments. Urbanization with a large amount of land-use change has caused many side effects [1,2]. The frequency and intensity of urban floods has increased [3,4]. The impact of urban floods is enormous since most of the population and infrastructure are centered in urban areas. The failure of infrastructure, including traffic, electricity, and communication, causes incalculable loss [5]. Traditional stormwater treatment systems, which called grey infrastructure, are often inadequate for reducing runoff and flood probability [6]. Additionally, climate change is expected to increase the frequency and intensity of storms [7] and exacerbate existing stormwater systems [8]. The climate models developed by the International Panel on Climate Change (IPCC) predict an increase in average annual precipitation for Midwestern United States of up to 20% by the end of this century [9].
Under natural environment, vegetation balances the water cycle by rainfall interception on tree canopy, storage on leaves or ground, evaporation from stored water, and infiltration by soil [10]. However, land use and cover changes (LUCC) consequences change of the supply and demand on water since the increase of storm runoff by increaser of impervious cover [11]. By deforestation, expand of agricultural land, and expand of urban center, LUCC changes various environmental conditions including regional climate, air quality, forest resources, and freshwater resources [12]. For long term of sustainable society, ecosystem services is essential to keep the quality of environment condition in urban area [13].
The interest of urban sustainability and resilience has grown recently due to the limitation of conventional infrastructure [14]. As disasters occur at a scale and frequency that are out of the predicted range and also getting worth by climate change [15], solution for long term strategy is required. Therefore, in urban and landscape planning, understanding the concept of resilience and the implication is necessary to build the resilience capacity of urban environment [16]. The function of ecosystem services helps to reduce the chance of infrastructure to failure, but also minimize the impact when it fails and make chance to recover from the failure [17]. Street trees, urban parks, bioswales, raingardens, and all other green spaces are functioning as green infrastructure in urban environment [18].
Green infrastructure is recommended for urban planning and green space planning for multi-function [19] including control runoff in urban areas [20]. It reduces stormwater runoff, and pollution directly flows into ecosystems by filtering them using natural systems of collection, storage, and filtering. By treating stormwater on site, in the context of urban hydrological systems, total runoff and pollution are minimized, while the whole system is restored closer to the natural hydrological system [21]. Green infrastructure includes detention ponds, water gardens, bioswales, and green roofs. It facilitates stormwater treatment in several ways and at various scales. The importance of stormwater storage and infiltration into the natural system of green infrastructure is well recognized [22] and has been practiced under the name of low impact development (LID), best management practices (BMPs), and Nature-based solution in many countries [23,24]. It effectively reduces runoff at the watershed scale and effectively complements traditional stormwater treatment systems [25].
To reduce direct runoff and improve the urban water cycle system, urban planners and designers use green infrastructure [26]. However, a green space with a water detention system requires a significant area that is challenging to secure in the middle of dense urban areas and requires incalculable social costs [27]. The risk of a large-scale green infrastructure is when it fails and causes urban floods [28]. To decrease the risk, an in situ stormwater treatment system treats runoff on site where it occurs [29]. A small-scale green infrastructure is effective in treating stormwater on site and can also be installed without large construction using vacant space in urban areas [30]. Rain gardens or bioswales can be installed in parking lots, between buildings, at corners of blocks, or in other vacant lots. These types of bioretention systems collect stormwater runoff generated from impervious areas and store water to lower the peak flow and reduce runoff that produces floods [31]. Most of the previous studies on stormwater treatment and green space planning is focusing on setting size or the facilities capacity assessment [32,33,34]. However, to implement green infrastructures effectively, knowledge of the optimal arrangement of green space to reduce runoff will be important for urban green space planning. In this study, we examine different green space arrangement scenarios to find the optimal green infrastructure placement for runoff reduction.
2. Literature Review
The green space in urban areas as green infrastructure function by mimicking or imitating the natural process of interception, storage, infiltration, and evaporation in water cycle system [35]. Tree canopy intercept rainfall [36,37,38] and evaporate the stored water [39]. Throughfall from tree canopy infiltrates by soil [36,40,41] or be stored in concaved area until it infiltrate into soil or evaporate [42]. This process of natural water cycle system can work independently but could be more effective when it interacts with urban drainage system [43]. Conventional urban stormwater drainage system can be used to store large amount of water by using rainwater tank under extreme storm event to reduce the peak flow and prevent flash flood, while green infrastructure can maximize infiltration and evaporation by using bioinfiltration system [44]. To maximize the efficiency of flood reduction and water cycle restoration, correct design and placement of stormwater treatment system will be vital [45].
By modeling various types of green infrastructure, previous studies discovered the effectiveness of green space and LID facilities. Various implementations of green infrastructure in urban environment also showed different results from 3 to 47% of runoff reduction depending on the level of implementation, land cover, and rainfall intensity [46]. Furthermore, implementation of various combination on green infrastructure reduced more runoff by using both infiltration-based technologies and storage-based technologies. It also shows infiltration-based facilities could be less effective than storage-based facilities on reducing peak flow [47]. These differences in green infrastructure function needs to be consider while design and planning stormwater treatment system. Based on the land cover, placement of social infrastructure, and topography, the selection of green infrastructure size and location can vary.
Placement strategy of green infrastructure can be the key to determine functional effectiveness. The optimal selection of green infrastructure placement in urban area can contribute to up to 9.5% of runoff reduction with limited budget of 25 million dollars in mid-sized city [48]. Optimal selection and placement can reduce not only the efficiency of green infrastructure but also the cost efficiency [49]. Urban center area has high potential impact and priority of green infrastructure placement likelihood on efficiency [50], however urban center has limited space for implementation. To overcome this limitation, small scale green infrastructures, such as small green space, green roof, green wall, and street tree is preferable to install in urban center. Due to the comparatively small amount of green space, finding the optimal placement or arrangement to increase the efficiency of green infrastructure is crucial in urban center area.
3. Materials and Methods
The purpose of this study is to find an optimal landscape planning strategy to reduce runoff in urban areas using green infrastructure. To compare the change in runoff volume according to the distribution of green space of the site, we set a virtual watershed (domain) including green spaces and impervious surfaces to calculate the total runoff on site. Calculation of the exact runoff amount of the watershed requires a large amount of data, time, and workload using the existing lumped hydrological model. Therefore, to compare the runoff amount from different scenarios with limited data, we developed a simplified distributed hydrological model using MATLAB [51,52].
3.1. Model Description
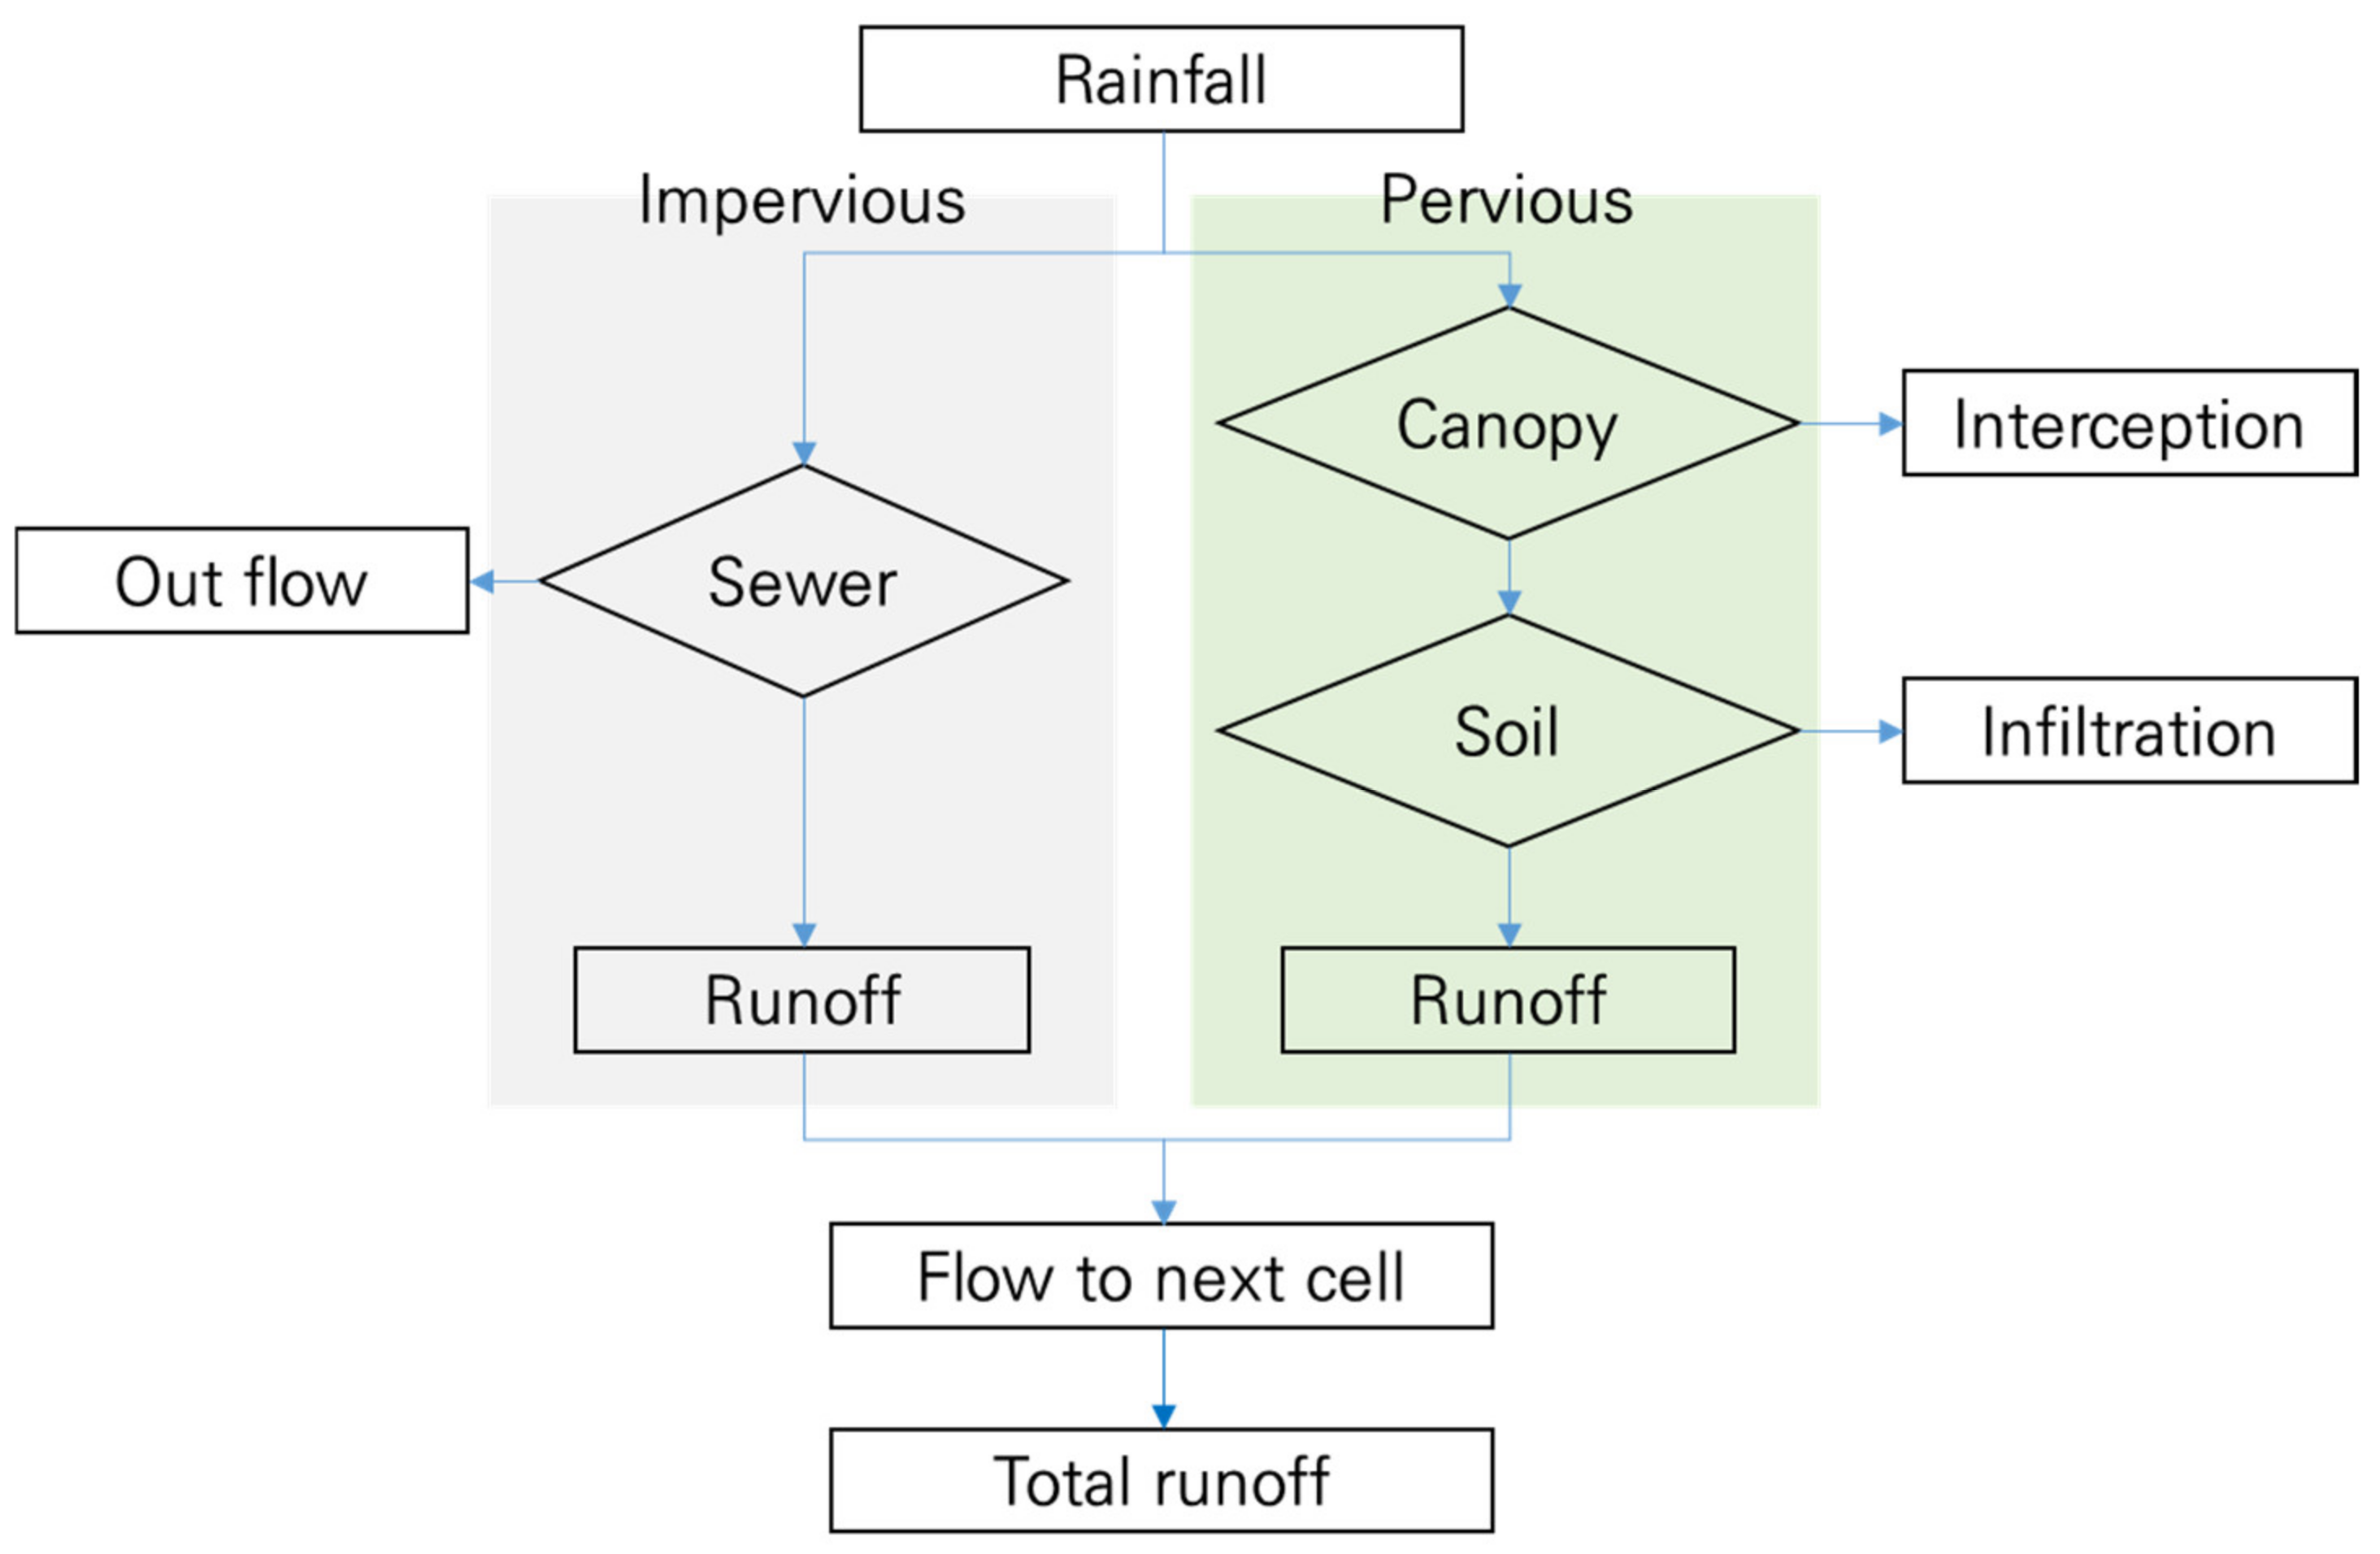
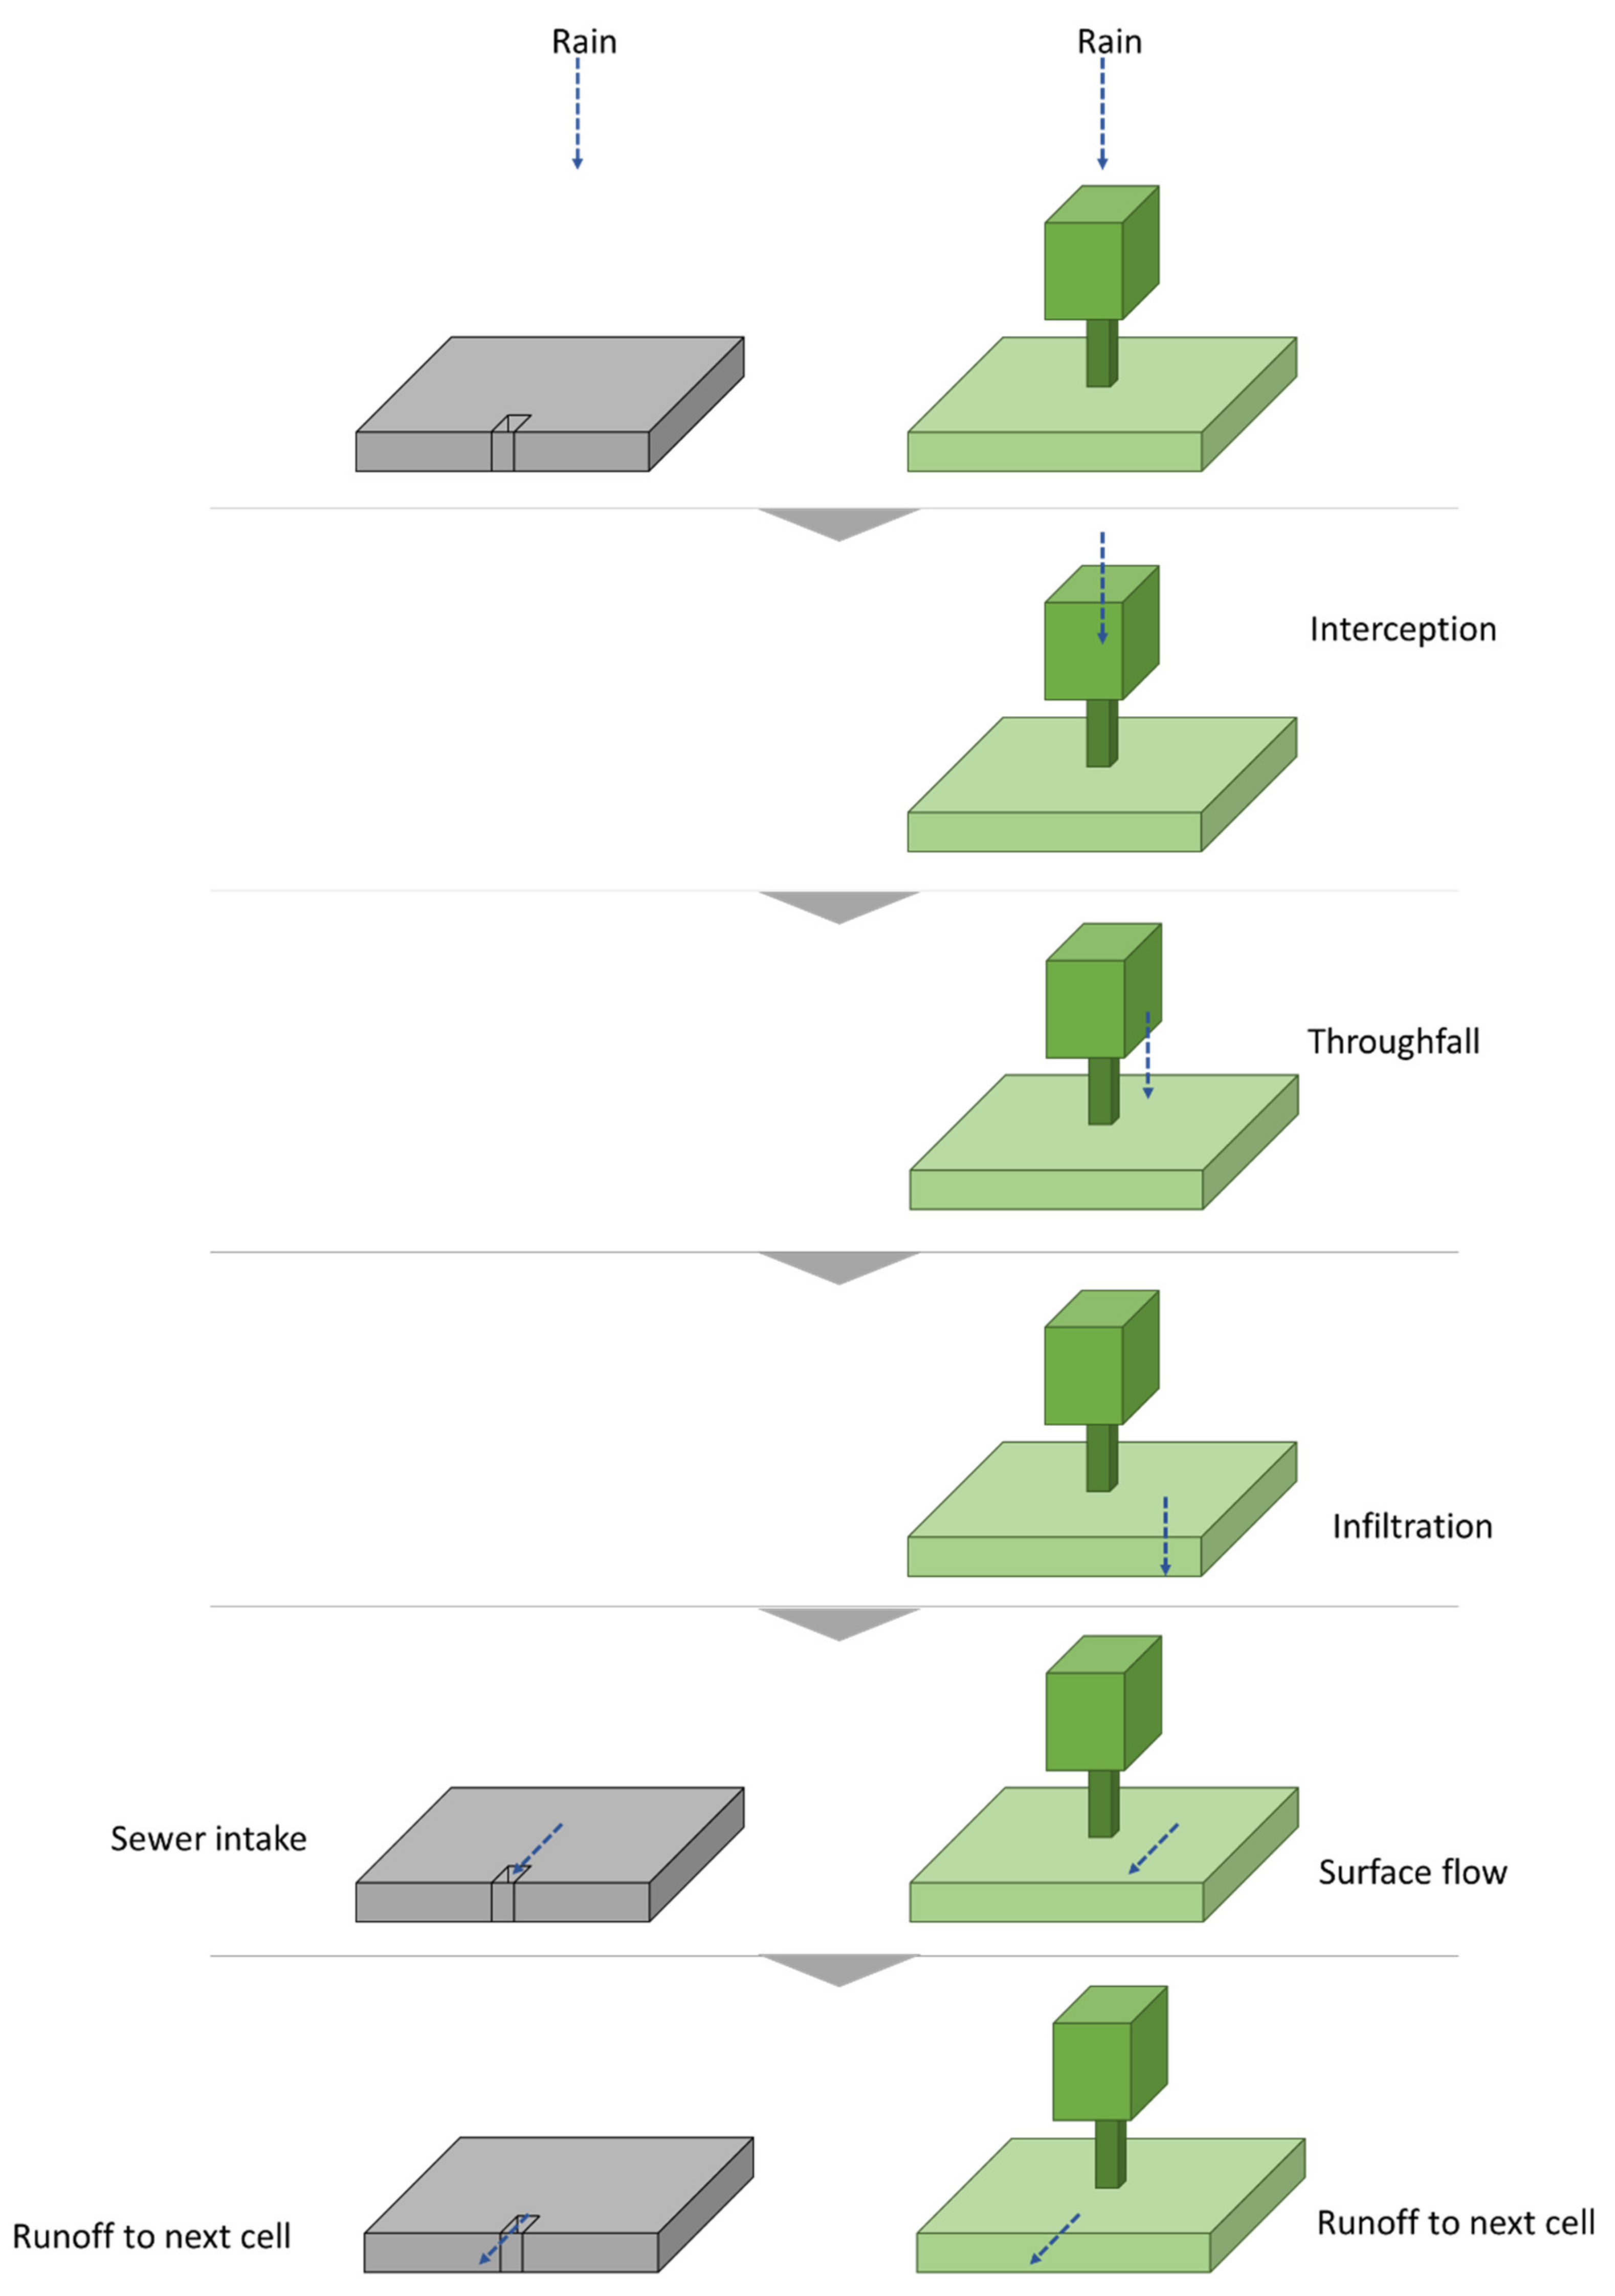
To estimate the total runoff from the domain, the model calculates runoff in three parts (Figure 1). First, by using the parameter setting of each pervious or impervious cell, the runoff amount generated from each cell was calculated. An impervious cell assumes that the runoff generated inside the cell will flow into the stormwater sewer system. Depending on the stormwater sewer capacity, the outflow discharges out of the watershed, and if the runoff exceeds the capacity of the sewer, it overflows to the next cell. A pervious cell with green space calculates rainfall interception and storage by tree canopy and infiltration by the soil after storage on the ground by a modified Green-Ampt model [53]. Each pervious cell with green space was assumed to have the same interception, storage, and infiltration capacity. After the soil is saturated, no more soil infiltration will be calculated, and all the rainfall will be calculated as runoff (Figure 2).

Figure 1.
Model flow used for simulation.

Figure 2.
Water flow and process of each step of simulation.
Second, after calculating the runoff of each cell, the runoff calculated from each cell flows into the next cell according to the slope direction, and runoff from the previous cell will be reflected in the calculation of the next cell. Following the topography, runoff was collected at the lowest cell of the virtual watershed domain, and the total runoff amount of the watershed was calculated.
Finally, after the first and second processes, one time step will be complete, and the total runoff at one time step will be calculated according to each cell sewer capacity, vegetation condition, and soil condition. The time step will be run continuously according to the time setting of the storm event and the runoff will continue to be calculated until no more runoff is generated for all cells after the storm event stops.
3.2. Virtual Domain Setting
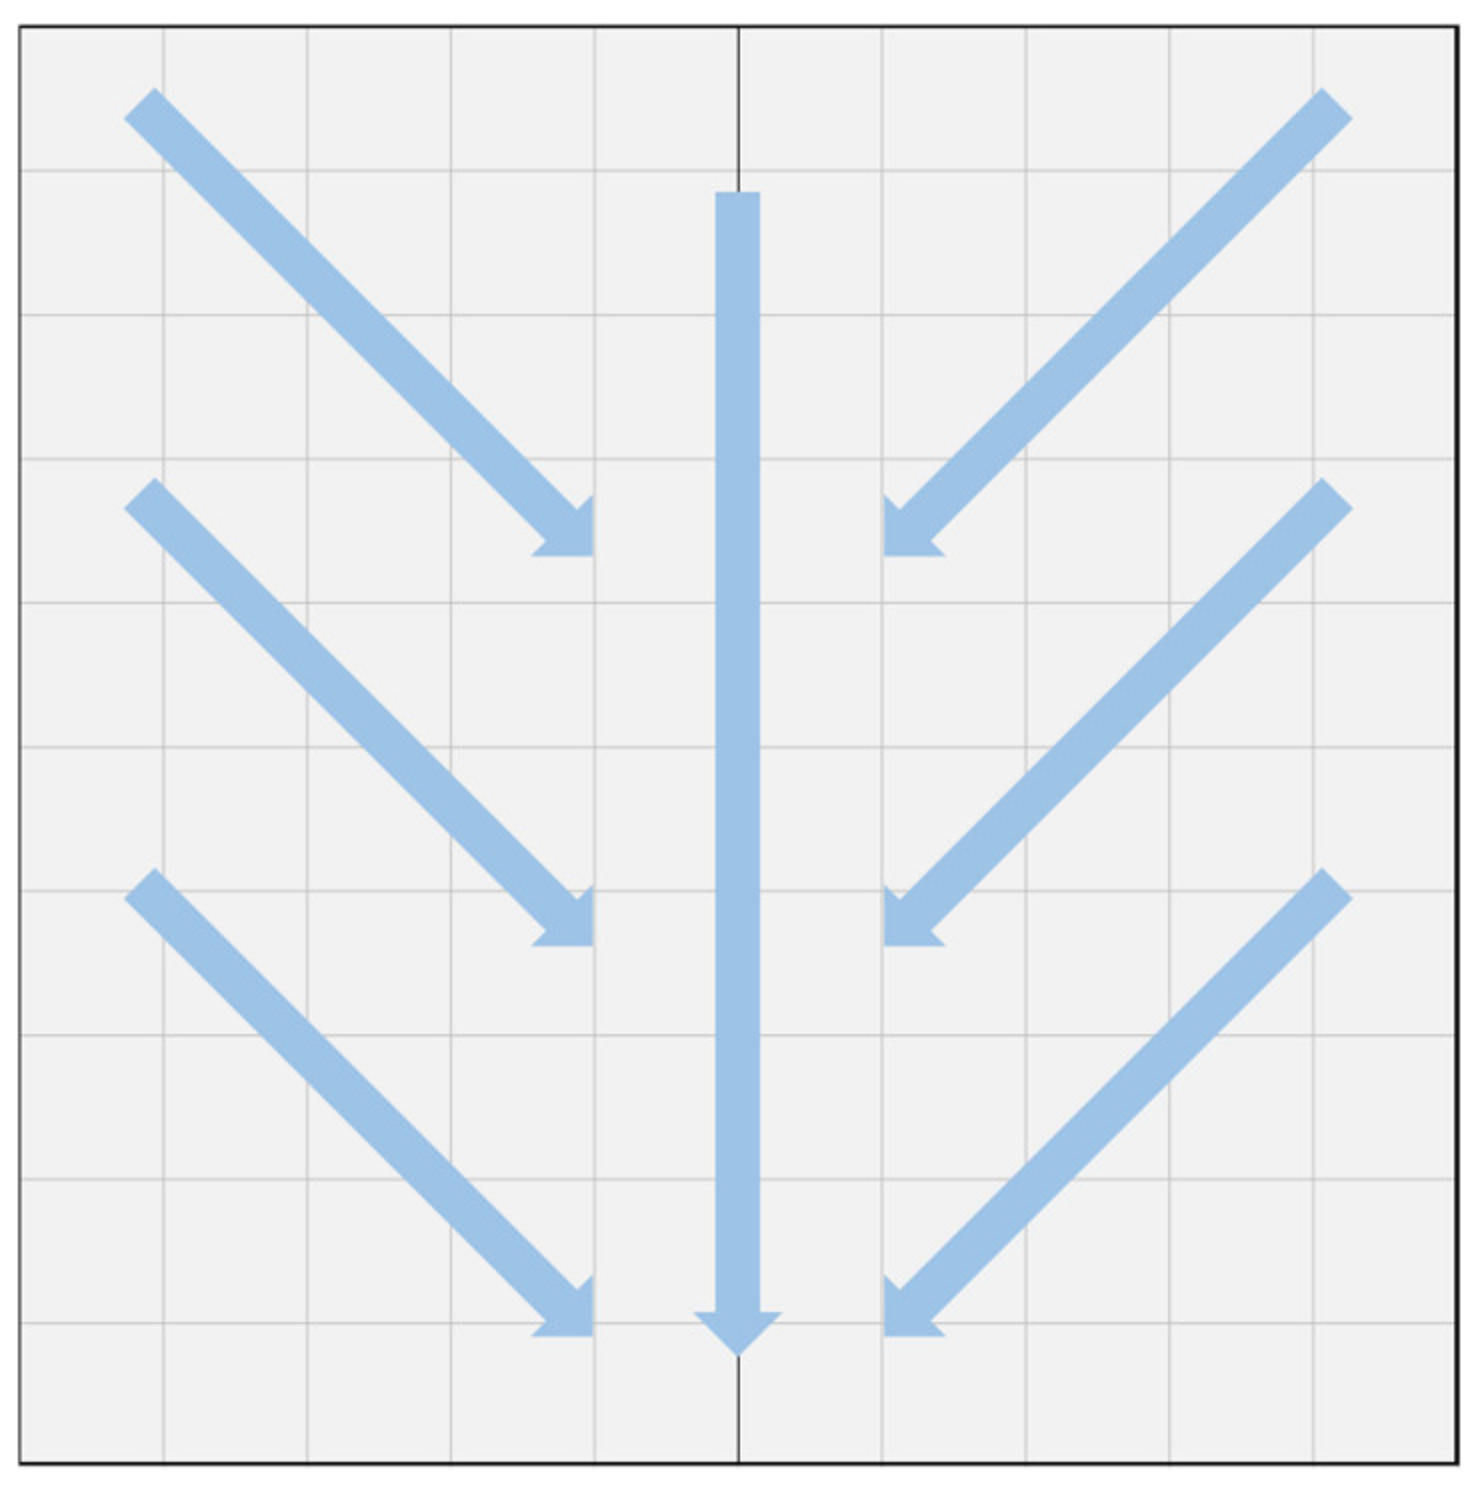
The virtual watershed domain (Table 1) is set as 200 meters by 200 meters to represent urban block size. The typical average urban block size varies depending on the culture or development type from 50 meters to 200. However, most of the recent high-rise urban development areas has blocks with 200 to 300 meters, sometimes up to 500 [54]. Each impervious and pervious cell is a two-meter square to express the trees and streets most effectively Since it matches with the crown of small tree or width of narrow sidewalk which is the basic elements of simulation. The slope of the domain is 2.5% which expresses the relatively flat urban environment where runoff could be issue, and the direction of the slope is planned to flow to the bottom center of the domain (Figure 3). It was assumed that the domain is a single watershed without any flow from outside.

Table 1.
Landscape and parameter settings for the model.
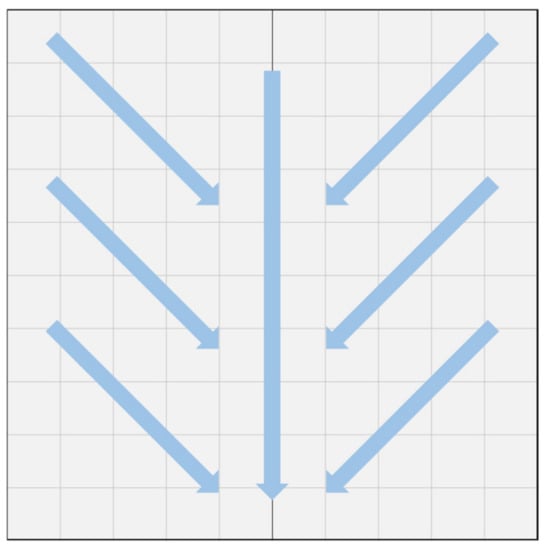
Figure 3.
Slope of the domain.
The capacity of the stormwater sewer in impervious cells was set to 120 liters of storage capacity and 1 m2 of water per second sewer intake capacity. Pervious cells with green space were set to have a 6 mm per hour infiltration rate, which is the rate of NRCS soil group type B since the green space are mostly intentionally constructed in purpose with improved soil condition.
The storm event was set as a 1-h storm event with 60 mm of precipitation (Table 2), which is usually considered to increase the possibility of urban flash floods.
Table 2.
Storm event setting for the model.
3.3. Scenario Setting
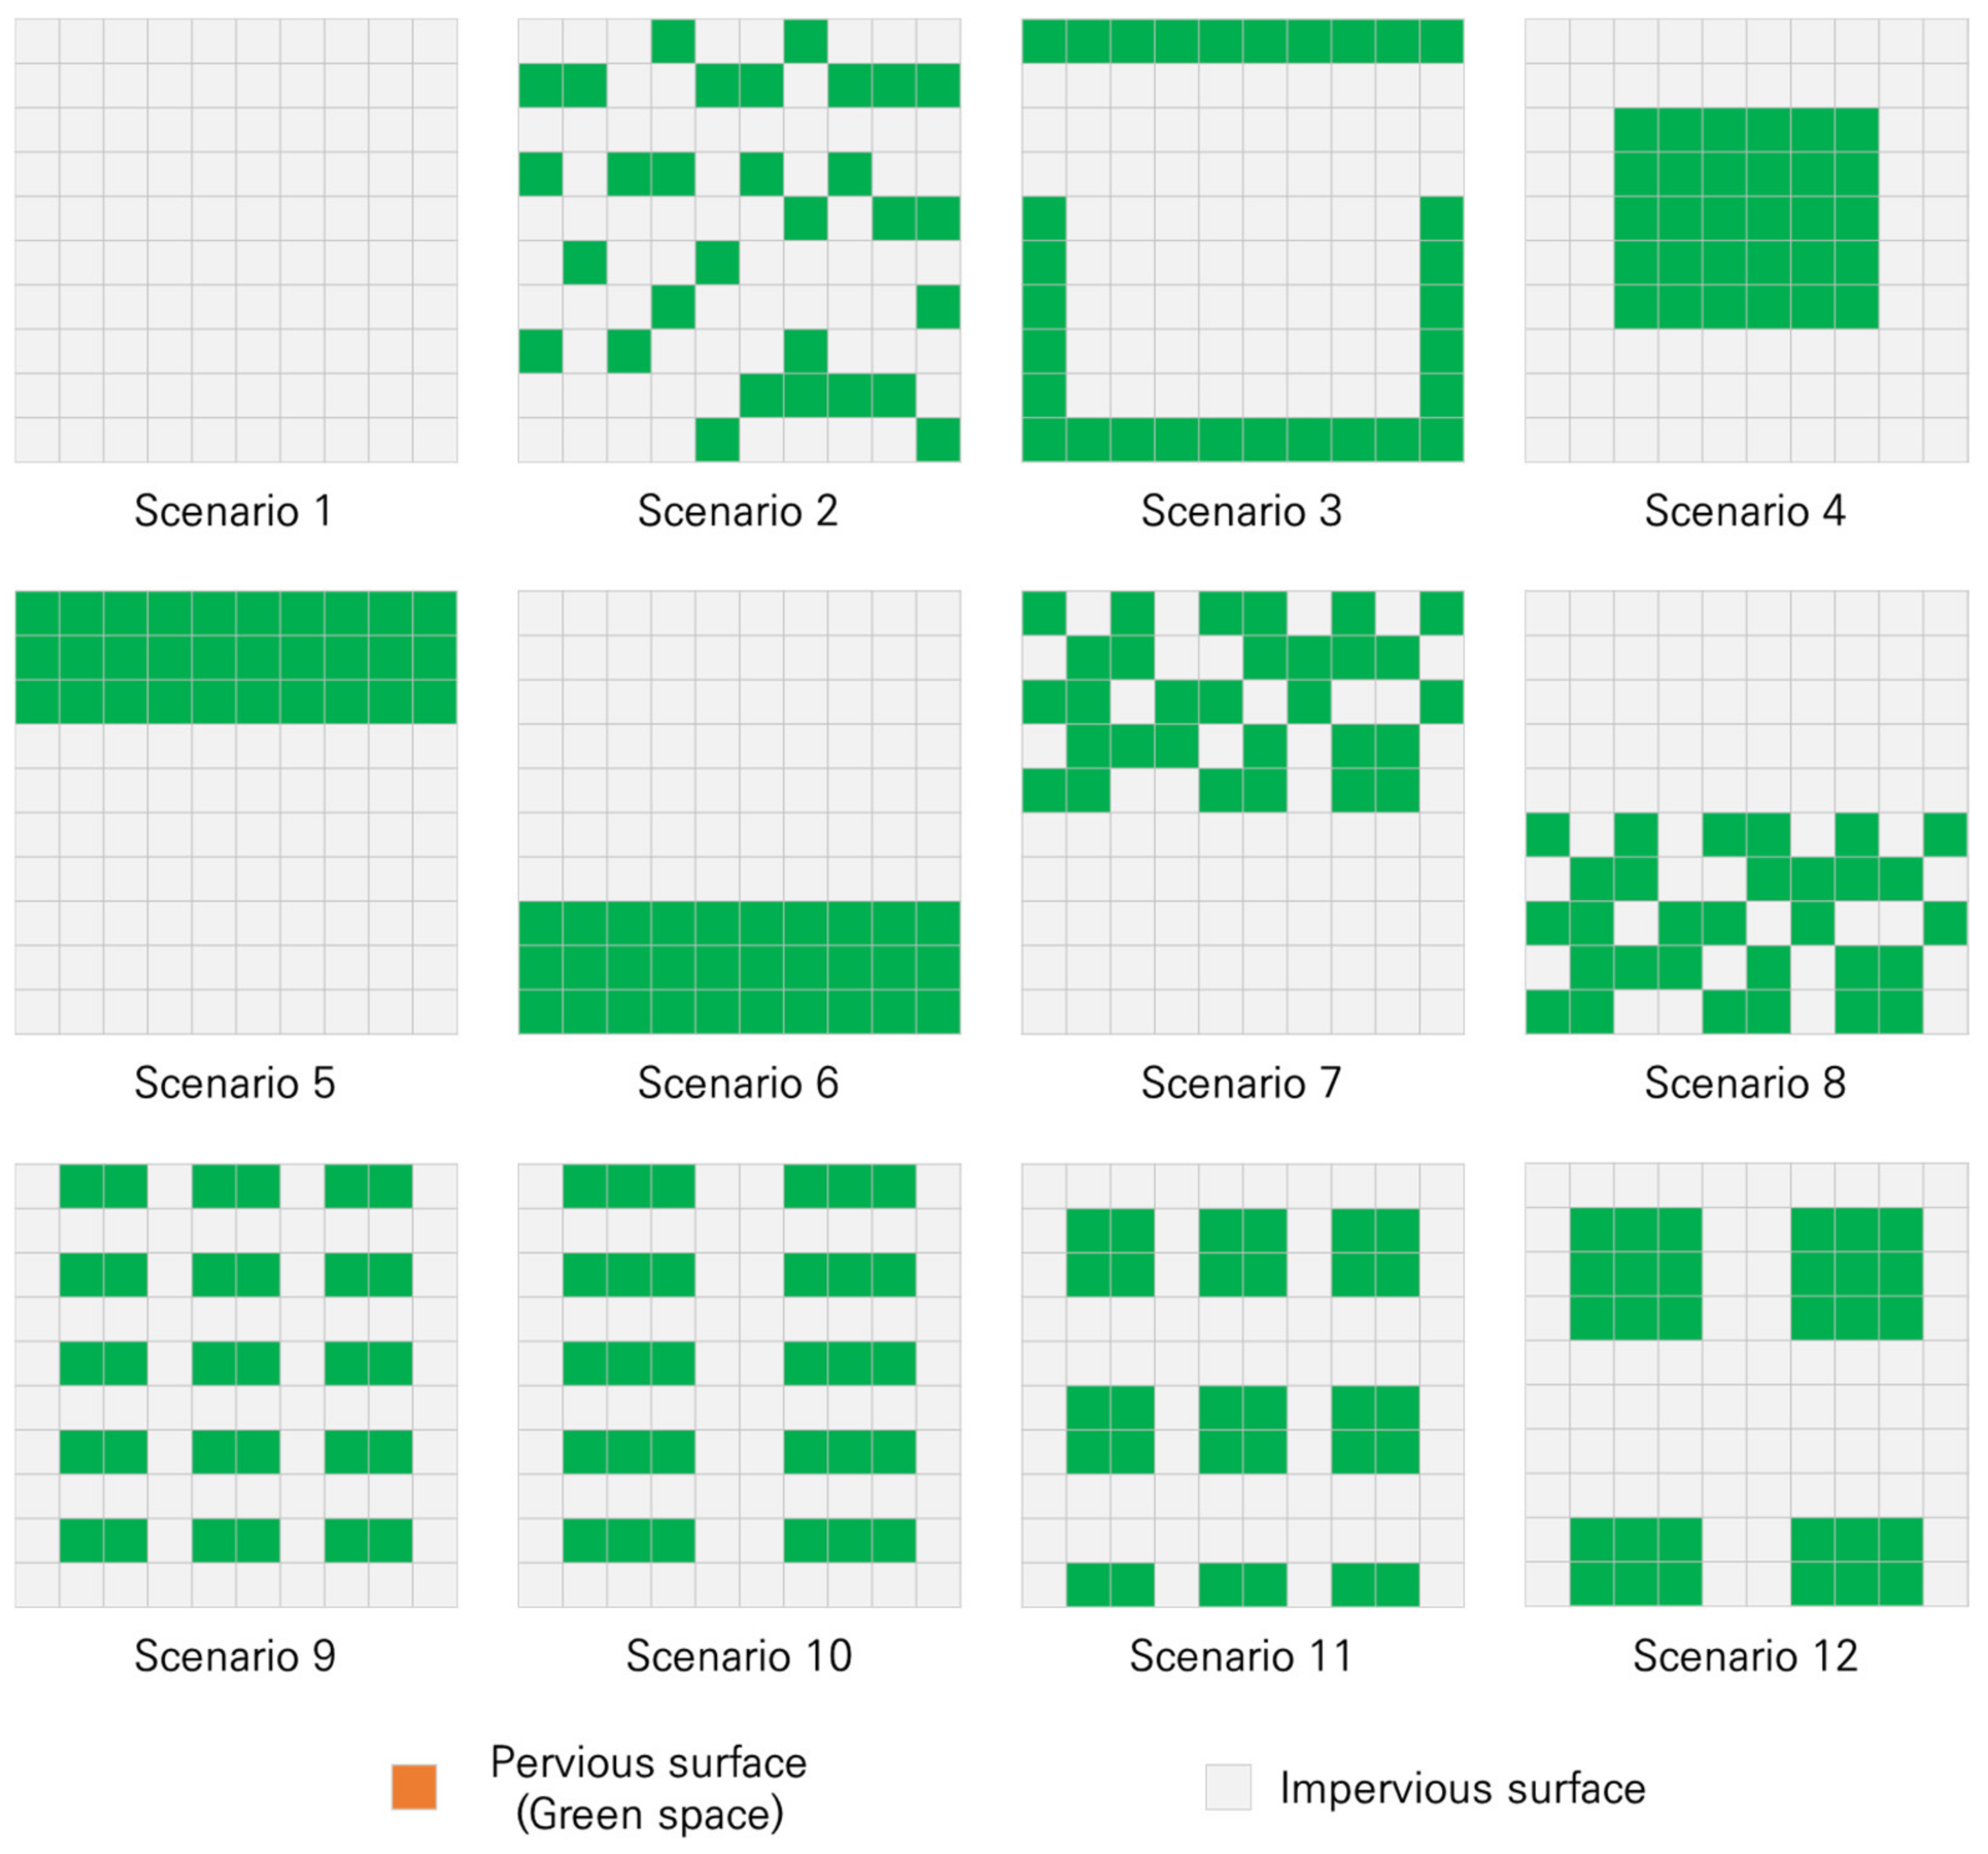
The green space arrangement scenario has a clustered and dispersed layout for the same amount of green space with a ratio of 30% of the total domain area. As a base scenario, scenario 1 is set with all impervious cells which could represent dense urban area with no green space. Scenarios 2 and 3 are set as group 2 with a dispersed green space distribution. Scenario 2 has green space that is randomly dispersed, while scenario 3 has all green space on the outside of the block, which scenario 2 could represent randomly dispersed green spaces between small buildings or paved area and scenario 3 could represent street trees or green spaces surrounding the block. Scenarios 4, 5, and 6 are set as group 3 with a clustered green space distribution. Scenario 4 has clustered green space in the middle of the block which could represent large green space in middle of paved square. Scenarios 5 and 6 have clustered green space upstream and downstream, respectively, which could represent large green space planned to preserve the green space (Table 3). Scenarios 7 and 8 have randomly dispersed green space upstream and downstream, respectively which could represent preserved green space area similarly with scenario 5 and 6 but with some disconnection of previous area. Scenarios 9 to 12 have different sizes of green space dispersed with the same total amount of green space to compare the runoff amount according to the patch size which could represent planned green space between impervious spaces (Figure 4).
Table 3.
Description of green space scenario setting.

Figure 4.
Green space distribution scenario setting.
4. Results
The total runoff amount of each scenario was calculated by simplified model. The base scenario with no green space cell showed 5,567 mm of total runoff (Group 1). In Group 2, total runoff of scenario 2 and 3 was 3180 mm and 3312.6 mm, respectively. Group 3, total runoff of scenario 4, 5, and 6 was 4,198.8 mm, 5,044.4 mm, and 2,211.1 mm, respectively. The dispersed green space scenarios (Group 1, scenarios 2 and 3) showed 34.8% less runoff than the clustered green space scenarios (Group 2, scenarios 4 and 5). However, the scenario that had green space downstream (scenario 6) showed 49.7% less runoff than the scenario that had green space upstream (scenario 5) since scenario 5 treats only the runoff generated upstream, while scenario 6 receives and treats all the runoff generated over the watershed. In Group 4, total runoff of scenario 7 and 8 was 4508.1 mm and 2416.3 mm. scenario 7 and 8, which have the same distribution of green space but different placement on upstream and downstream, also showed a similar pattern of runoff amount which scenario 5 and 6 showed. Scenario 7 showed 9.3% less runoff than scenario 5, and scenario 8 showed 8.7% more runoff than scenario 6. In group 5, total runoff of scenario 9 and 10 was 3030.1 mm and 4573.3 mm, while in group 6, total runoff of scenario 10 and 11 was 2902.5 mm and 4328.9 mm. A smaller patch size in the green space (scenarios 9 and 11) showed less runoff than a larger patch size in the green space (scenarios 10 and 12).
Under the condition of an equal amount of green space, the dispersed green space arrangement scenario was more effective than the clustered green space scenarios in reducing total runoff. In addition, smaller green space patches were more effective than larger green patches in reducing total runoff on site (Figure 5). The results showed that the most influential factor in reducing runoff was the topography of the site and green space, since when the green space was located downstream, it reduced more runoff than when it was located upstream. This is because when green space is located upstream without green space downstream, there is less chance to treat runoff, while when green space is located downstream where surface water will flow and accumulate, the opportunity to treat surface water with green space will maximize.
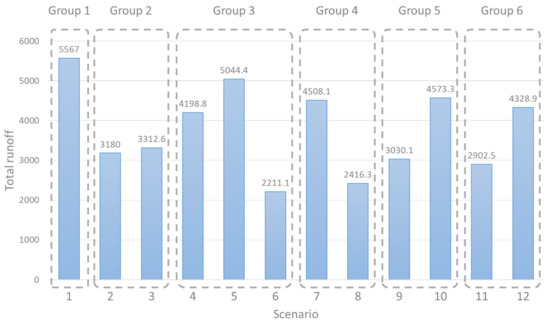
Figure 5.
Total runoff of each green space distribution scenario.
The simulation results agree with previous studies on urban green space placement and distribution [25,55,56,57]. Previous studies have shown the effectiveness of runoff reduction by installing green infrastructures, including swales, green roofs, rain gardens, and detention ponds, in urban environments and how these elements are placed. Dispersed green infrastructure scenarios showed a more effective runoff reduction rate in both small and large rainfall events. However, clustered green infrastructure scenarios showed more effectiveness when placed on the route of runoff flow, such as scenarios 6 and 8 in this study. This can be applied to green space planning for climate change and disaster reduction by placing clustered green infrastructure at lower elevations where runoff flows while placing dispersed green infrastructure overall, which can treat rainfall on site to reduce runoff.
5. Discussion
The result of comparing different urban green space arrangement settings shows that dispersed green space arrangements are more effective in reducing stormwater runoff in general. Rainfall interception by tree canopy and infiltration by soil reduce runoff on each cell. In the case of a dispersed green space setting, the pervious cell can collect runoff from neighboring impervious cells and treat it. However, in the case of a clustered green space setting, a large patch of green space can collect runoff from neighboring impervious cells but would not be able to treat all of it since the accumulated amount of runoff would be larger than the green space treatment capacity and cannot collect the runoff generated from impervious cells downstream. Although when the clustered green space is located downstream of the watershed, even accumulated runoff exceeds the green space’s treatment capacity; all the runoff from the watershed would be collected and stored to have the chance to be treated. This can explain why locating green infrastructure where the water flow passes are important to increase the effectiveness of green infrastructure to reduce runoff. To implement green infrastructures to effectively reduce runoff, a linear form, such as a bioswale and infiltration trench placed on the water flow or a planter box or a rain garden, that is connected to each feature would be the best solution.
The placement of large green spaces needs to consider not only the total runoff amount but also the usage of impervious areas. The total runoff amount is small when placing the green space downstream than when it is placed upstream. However, when the green space is placed downstream, the impervious area upstream will be flooded with runoff flow, while when the green space is placed upstream, the impervious area downstream will have less runoff flowing on the surface even when the total runoff amount is larger. When the area plays an important role in urban mechanisms, for example, main urban infrastructure or infrastructure which is vulnerable on inundation, it would be more important to decrease the risk of floods by placing green space upstream than reducing the total runoff amount. Understanding the urban mechanism is important for urban planning and providing the best solution with suitable decision making [18].
Since most of the population and social and economic infrastructure is concentrated in the central urban area, even small floods can affect human activity and infrastructure [58]. Therefore, considering the tolerance of water by land use in the urban area will be necessary for green space planning. Urban center area with important infrastructure which is vulnerable on the flood, such as subway, electricity infrastructure, and also socially vulnerable area [59] will need to be protected and flow runoff rapidly to reduce the impact. While, an area acceptable to be flooded for a while, such as parks and waterfront designed to be inundated [60] or vacant land [61] can be used as a detention area while large storm event. Parks and plaza are designed to be flooded and function as large rainwater storage when it rains and slowly flow out water to reduce peak flow and possibility of flood. These places are safe and flexible to be flooded and less vulnerable than other urban areas. The approach of water sensitive urban design includes these kind of flexible design and planning solution to minimize the environmental degradation [62]. However, contrary to flexible spaces, critical social and economic infrastructure have to be protected from flood since the impact of failure is crucial [63,64]. Transport, electricity, gas, and communication line infrastructure is critical to maintain urban system. Especially, transportation system is vulnerable and receives immediate impact than other infrastructure since roads are exposed, linear, and impervious which preferentially become a path of water when it floods [63]. Green space placement and arrangement for runoff reduction and flood impact reduction can be various by every case of planning according to vulnerability of each spaces and surrounding condition [65].
There are numbers of guidelines for urban planning and design on enhancing resilience or reducing disaster impact especially focusing on flood [66,67,68]. These guidelines mostly are focusing on urban design to apply facilities which could reduce flood possibility or reduce the impact of flooding. It mostly provides building scale strategy to reduce flood and its impact. Not only understanding capacity of single facility and install strategy is important but understanding how to arrange and place the infrastructure including green infrastructure is important. The result of this simulation could provide starting point of urban design and planning guideline.
The result of this simulation runoff is slightly larger than that of previous studies [57,69,70,71]. This is because the model and domain setting only considers the main direct factors that affect runoff amount reduction by green space, and other external factors are excluded. The model has limitations by using simple slope conditions and binary land cover settings for simulation. However, it is also possible to expand the usage by changing and adding settings of actual specific settings of specific urban environments. Tree canopy interception, soil conditions, sewer capacity and other settings can be changed to extend the usage not only for the runoff amount compared but also for the optimization process of the effect of land-use change.
6. Conclusions
With the simplified distributed hydrological model, this paper simulated the runoff reduction effect of different arrangements to find an optimal strategy for landscape planning for urban stormwater treatment. The simplified model does not provide an accurate amount of runoff amount but provides results of runoff amount data under different situations with limited given data. It is more effective than traditional hydrology models to simulate and compare the results of many other landscape planning scenarios since it requires less data and effort to run, which means that it could be used for land-use optimization for green space allocation and policy making. This model which developed to simulate block size would work most effectively in neighborhood scale, but not limited to it. Since large scale hydrological simulation has more complex process and variable, to use this model for large and complex hydrological modeling it will need more input and process development. Though, since this model has potential to be developed as the user needs, it could be used in different environment.
Although placing green infrastructure on the runoff flow path is optimal for reducing the total runoff amount, it is more important to understand the mechanism of the urban environment for landscape planning. Considering the importance of not only the ecological function but also the social factor of urban morphology, the placement of green infrastructure needs to be planned discreetly. Urban system complexity and vulnerability of urban infrastructure is also critical factor for green infrastructure planning. Large constructions to install green infrastructures in the middle of high dense urban areas for stormwater treatment are impractical but placing small green spaces to treat as much as they can and make it flow into large infrastructures outside the dense areas will be more effective and practical.
Author Contributions
Conceptualization, B.Y. and D.L.; methodology, B.Y. and D.L.; formal analysis, B.Y. and D.L.; data curation, B.Y.; writing—original draft preparation, B.Y.; writing—review and editing, D.L. All authors have read and agreed to the published version of the manuscript.
Funding
This work is supported by the Korea Agency for Infrastructure Technology Advancement (KAIA) grant funded by the Ministry of Land, Infrastructure and Transport (Grant 21UMRG-B158194-02).
Conflicts of Interest
The authors declare no conflict of interest.
References
- Fiedler, P.; Zannin, P. Noise Mapping as a Tool for the Development. J. Sci. Ind. Res. 2015, 74, 114–116. [Google Scholar]
- Panichelli, L.; Gnansounou, E. Estimating greenhouse gas emissions from indirect land-use change in biofuels production: Concepts and exploratory analysis for soybean-based biodiesel production. J. Sci. Ind. Res. 2008, 67, 1017–1030. [Google Scholar]
- Hammond, M.J.; Chen, A.S.; Djordjević, S.; Butler, D.; Mark, O. Urban flood impact assessment: A state-of-the-art review. Urban Water J. 2015, 12, 14–29. [Google Scholar] [CrossRef] [Green Version]
- Kim, H.; Lee, D.K.; Sung, S. Effect of urban green spaces and flooded area type on flooding probability. Sustainability 2016, 8, 134. [Google Scholar] [CrossRef] [Green Version]
- Brody, S.; Kim, H.; Gunn, J. Examining the Impacts of Development Patterns on Flooding on the Gulf of Mexico Coast. Urban Stud. 2013, 50, 789–806. [Google Scholar] [CrossRef]
- Hood, M.J.; Clausen, J.C.; Warner, G.S. Comparison of stormwater lag times for low impact and traditional residential development. J. Am. Water Resour. Assoc. 2007, 43, 1036–1046. [Google Scholar] [CrossRef]
- Bonebrake, T.C.; Mastrandrea, M.D. Tolerance adaptation and precipitation changes complicate latitudinal patterns of climate change impacts. Proc. Natl. Acad. Sci. USA 2010, 107, 12581–12586. [Google Scholar] [CrossRef] [Green Version]
- Carter, J.G.; Handley, J.; Butlin, T.; Gill, S. Adapting cities to climate change—Exploring the flood risk management role of green infrastructure landscapes. J. Environ. Plan. Manag. 2018, 61, 1535–1552. [Google Scholar] [CrossRef] [Green Version]
- Intergovernmental Panel on Climate Change. Workshop Report of the Intergovernmental Panel on Climate Change Workshop on Socio-Economic Scenarios; IPCC Working Group III Technical Support Unit, Potsdam Institute for Climate Impact Research: Potsdam, Germany, 2010; pp. 1–51. [Google Scholar]
- Oki, T.; Kanae, S. Global Hydrological Cycles and Word Water Resources. Science 2006, 313, 1068–1072. [Google Scholar] [CrossRef] [Green Version]
- Miller, J.D.; Kim, H.; Kjeldsen, T.R.; Packman, J.; Grebby, S.; Dearden, R. Assessing the impact of urbanization on storm runoff in a peri-urban catchment using historical change in impervious cover. J. Hydrol. 2014, 515, 59–70. [Google Scholar] [CrossRef] [Green Version]
- Foley, J.A.; Defries, R.; Asner, G.P.; Barford, C.; Bonan, G.; Carpenter, S.R.; Chapin, F.S.; Coe, M.T.; Daily, G.C.; Gibbs, H.K.; et al. Review Global Consequences of Land Use. Science 2005, 8, 570–574. [Google Scholar] [CrossRef] [Green Version]
- La Rosa, D.; Privitera, R. Characterization of non-urbanized areas for land-use planning of agricultural and green infrastructure in urban contexts. Landsc. Urban Plan. 2013, 109, 94–106. [Google Scholar] [CrossRef]
- Dong, X.; Guo, H.; Zeng, S. Enhancing future resilience in urban drainage system: Green versus grey infrastructure. Water Res. 2017, 124, 280–289. [Google Scholar] [CrossRef] [PubMed]
- Torresan, S.; Critto, A.; Rizzi, J.; Marcomini, A. Assessment of coastal vulnerability to climate change hazards at the regional scale: The case study of the North Adriatic Sea. Nat. Hazards Earth Syst. Sci. 2012, 12, 2347–2368. [Google Scholar] [CrossRef]
- Ahern, J. Urban landscape sustainability and resilience: The promise and challenges of integrating ecology with urban planning and design. Landsc. Ecol. 2013, 28, 1203–1212. [Google Scholar] [CrossRef]
- Elmqvist, T.; Andersson, E.; Frantzeskaki, N.; McPhearson, T.; Olsson, P.; Gaffney, O.; Takeuchi, K.; Folke, C. Sustainability and resilience for transformation in the urban century. Nat. Sustain. 2019, 2, 267–273. [Google Scholar] [CrossRef]
- Elderbrock, E.; Enright, C.; Lynch, K.A.; Rempel, A.R. A guide to public green space planning for urban ecosystem services. Land 2020, 9, 391. [Google Scholar] [CrossRef]
- Arnold, J.; Kleemann, J.; Fürst, C. A differentiated spatial assessment of urban ecosystem services based on land use data in Halle, Germany. Land 2018, 7, 101. [Google Scholar] [CrossRef]
- Jaffe, M. Environmental Reviews & Case Studies: Reflections on Green Infrastructure Economics. Environ. Pract. 2010, 12, 357–365. [Google Scholar] [CrossRef]
- Montalto, F.; Behr, C.; Alfredo, K.; Wolf, M.; Arye, M.; Walsh, M. Rapid assessment of the cost-effectiveness of low impact development for CSO control. Landsc. Urban Plan. 2007, 82, 117–131. [Google Scholar] [CrossRef]
- Dunne, T.; Leopold, L.B. Water in Environmental Planning; Macmillan: New York City, NY, USA, 1978. [Google Scholar]
- Cortinovis, C.; Zulian, G.; Geneletti, D. Assessing nature-based recreation to support urban green infrastructure planning in Trento (Italy). Land 2018, 7, 112. [Google Scholar] [CrossRef] [Green Version]
- Guo, R.; Bai, Y. Simulation of an urban-rural spatial structure on the basis of green infrastructure assessment: The case of Harbin, China. Land 2019, 8, 196. [Google Scholar] [CrossRef] [Green Version]
- Zellner, M.; Massey, D.; Minor, E.; Gonzalez-Meler, M. Exploring the effects of green infrastructure placement on neighborhood-level flooding via spatially explicit simulations. Comput. Environ. Urban Syst. 2016, 59, 116–128. [Google Scholar] [CrossRef] [Green Version]
- Lennon, M.; Scott, M.; O’Neill, E. Urban Design and Adapting to Flood Risk: The Role of Green Infrastructure. J. Urban Des. 2014, 19, 745–758. [Google Scholar] [CrossRef]
- Kozak, D.; Henderson, H.; de Castro Mazarro, A.; Rotbart, D.; Aradas, R. Blue-green infrastructure (BGI) in dense urban watersheds. The case of the Medrano stream basin (MSB) in Buenos Aires. Sustainability 2020, 12, 163. [Google Scholar] [CrossRef] [Green Version]
- Shi, L. Beyond flood risk reduction: How can green infrastructure advance both social justice and regional impact? Socio-Ecological Pract. Res. 2020, 2, 311–320. [Google Scholar] [CrossRef]
- Lee, H.; Song, K.; Kim, G.W.; Chon, J. Flood-adaptive green infrastructure planning for urban resilience. Landsc. Ecol. Eng. 2021, in press. [Google Scholar] [CrossRef]
- Benton-Short, L.; Keeley, M.; Rowland, J. Green infrastructure, green space, and sustainable urbanism: Geography’s important role. Urban Geogr. 2019, 40, 330–351. [Google Scholar] [CrossRef]
- Hong, Y.M. Experimental evaluation of design methods for in-site detention ponds. Int. J. Sediment Res. 2010, 25, 52–63. [Google Scholar] [CrossRef]
- Berggren, K.; Packman, J.; Ashley, R.; Viklander, M. Climate changed rainfalls for urban drainage capacity assessment. Urban Water J. 2014, 11, 543–556. [Google Scholar] [CrossRef]
- Liu, W.; Chen, W.; Peng, C. Influences of setting sizes and combination of green infrastructures on community’s stormwater runoff reduction. Ecol. Model. 2015, 318, 236–244. [Google Scholar] [CrossRef]
- Baek, S.S.; Choi, D.H.; Jung, J.W.; Lee, H.J.; Lee, H.; Yoon, K.S.; Cho, K.H. Optimizing low impact development (LID) for stormwater runoff treatment in urban area, Korea: Experimental and modeling approach. Water Res. 2015, 86, 122–131. [Google Scholar] [CrossRef]
- Jia, Z.; Tang, S.; Luo, W.; Li, S.; Zhou, M. Small scale green infrastructure design to meet different urban hydrological criteria. J. Environ. Manag. 2016, 171, 92–100. [Google Scholar] [CrossRef]
- Berland, A.; Shiflett, S.A.; Shuster, W.D.; Garmestani, A.S.; Goddard, H.C.; Herrmann, D.L.; Hopton, M.E. The role of trees in urban stormwater management. Landsc. Urban Plan. 2017, 162, 167–177. [Google Scholar] [CrossRef] [PubMed] [Green Version]
- Ghimire, C.P.; Bruijnzeel, L.A.; Lubczynski, M.W.; Bonell, M. Rainfall interception by natural and planted forests in the Middle Mountains of Central Nepal. J. Hydrol. 2012, 475, 270–280. [Google Scholar] [CrossRef]
- Alves, P.L.; Formiga, K.T.M.; Traldi, M.A.B. Rainfall interception capacity of tree species used in urban afforestation. Urban Ecosyst. 2018, 21, 697–706. [Google Scholar] [CrossRef]
- Pereira, F.L.; Gash, J.H.C.; David, J.S.; Valente, F. Evaporation of intercepted rainfall from isolated evergreen oak trees: Do the crowns behave as wet bulbs? Agric. For. Meteorol. 2009, 149, 667–679. [Google Scholar] [CrossRef] [Green Version]
- Ekwue, E.I.; Harrilal, A. Effect of soil type, peat, slope, compaction effort and their interactions on infiltration, runoff and raindrop erosion of some Trinidadian soils. Biosyst. Eng. 2010, 105, 112–118. [Google Scholar] [CrossRef]
- Gregory, J.; Dukes, M.; Jones, P.; Miller, G. Effect of urban soil compaction on infiltration rate. J. Soil Water Conserv. 2006, 61, 117–124. [Google Scholar]
- Armson, D.; Stringer, P.; Ennos, A.R. The effect of street trees and amenity grass on urban surface water runoff in Manchester, UK. Urban For. Urban Green. 2013, 12, 282–286. [Google Scholar] [CrossRef]
- Hoang, L.; Fenner, R.A. System interactions of stormwater management using sustainable urban drainage systems and green infrastructure. Urban Water J. 2016, 13, 739–758. [Google Scholar] [CrossRef] [Green Version]
- Burns, M.J.; Fletcher, T.D.; Walsh, C.J.; Ladson, A.R.; Hatt, B.E. Hydrologic shortcomings of conventional urban stormwater management and opportunities for reform. Landsc. Urban Plan. 2012, 105, 230–240. [Google Scholar] [CrossRef]
- Jato-Espino, D.; Charlesworth, S.M.; Bayon, J.R.; Warwick, F. Rainfall-runoff simulations to assess the potential of suds for mitigating flooding in highly urbanized catchments. Int. J. Environ. Res. Public Health 2016, 13, 149. [Google Scholar] [CrossRef]
- Ahiablame, L.; Shakya, R. Modeling flood reduction effects of low impact development at a watershed scale. J. Environ. Manag. 2016, 171, 81–91. [Google Scholar] [CrossRef]
- Damodaram, C.; Giacomoni, M.H.; Prakash Khedun, C.; Holmes, H.; Ryan, A.; Saour, W.; Zechman, E.M. Simulation of combined best management practices and low impact development for sustainable stormwater management. J. Am. Water Resour. Assoc. 2010, 46, 907–918. [Google Scholar] [CrossRef]
- Barah, M.; Khojandi, A.; Li, X.; Hathaway, J.; Omitaomu, O.F. Optimizing green infrastructure placement under precipitation uncertainty. Omega 2021, 100, 102196. [Google Scholar] [CrossRef]
- Liu, Y.; Theller, L.O.; Pijanowski, B.C.; Engel, B.A. Optimal selection and placement of green infrastructure to reduce impacts of land use change and climate change on hydrology and water quality: An application to the Trail Creek Watershed, Indiana. Sci. Total Environ. 2016, 553, 149–163. [Google Scholar] [CrossRef] [PubMed]
- Omitaomu, O.A.; Kotikot, S.M.; Parish, E.S. Planning green infrastructure placement based on projected precipitation data. J. Environ. Manag. 2021, 279, 111718. [Google Scholar] [CrossRef]
- Yang, B.; Lee, D.K. Planning strategy for the reduction of runoff using urban green space. Sustainability 2021, 13, 238. [Google Scholar] [CrossRef]
- Yang, B. Assessment of Runoff Reduction Effect Considering Rainfall Interception and Infiltration of Urban Green Space. Ph.D. Thisis, Seoul National University, Seoul, Korea, August 2019. [Google Scholar]
- Mein, R.G.; Larson, C.L. Modeling infiltration during a steady rain. Water Resour. Res. 1973, 9, 384–394. [Google Scholar] [CrossRef] [Green Version]
- ESMAP. Planning Energy Efficient and Livable Cities; Mayoral Guidance Note; World Bank: Washington, DC, USA, 2014; pp. 1–30. [Google Scholar]
- Ahiablame, L.M.; Engel, B.A.; Chaubey, I. Effectiveness of low impact development practices in two urbanized watersheds: Retrofitting with rain barrel/cistern and porous pavement. J. Environ. Manag. 2013, 119, 151–161. [Google Scholar] [CrossRef]
- Qin, H.p.; Li, Z.x.; Fu, G. The effects of low impact development on urban flooding under different rainfall characteristics. J. Environ. Manag. 2013, 129, 577–585. [Google Scholar] [CrossRef] [Green Version]
- Martin-Mikle, C.J.; de Beurs, K.M.; Julian, J.P.; Mayer, P.M. Identifying priority sites for low impact development (LID) in a mixed-use watershed. Landsc. Urban Plan. 2015, 140, 29–41. [Google Scholar] [CrossRef] [Green Version]
- Acosta, F.; Haroon, S. Memorial parking trees: Resilient modular design with nature-based solutions in vulnerable urban areas. Land 2021, 10, 298. [Google Scholar] [CrossRef]
- Tauhid, F.A.; Zawani, H. Mitigating climate change related floods in urban poor areas: Green infrastructure approach. J. Reg. City Plan. 2018, 29, 98–112. [Google Scholar] [CrossRef]
- Syahirani, T.N.T.; Ellisa, E. Public space as water infrastructure strategy in achieving runoff flood resilience on a neighborhood scale. IOP Conf. Ser. Earth Environ. Sci. 2021, 716. [Google Scholar] [CrossRef]
- Kim, G.; Miller, P.A.; Nowak, D.J. Assessing urban vacant land ecosystem services: Urban vacant land as green infrastructure in the City of Roanoke, Virginia. Urban For. Urban Green. 2015, 14, 519–526. [Google Scholar] [CrossRef]
- Waldhoff, A.; Ziegler, J.; Bischoff, G.; Rabe, S. Multifunctional Spaces for Flood Management—An Approach for the City of Hamburg, Germany. GWF Wasser Abwasser 2012, 84–88. [Google Scholar]
- Singh, P.; Sinha, V.S.P.; Vijhani, A.; Pahuja, N. Vulnerability assessment of urban road network from urban flood. Int. J. Disaster Risk Reduct. 2018, 28, 237–250. [Google Scholar] [CrossRef]
- Biging, G.; Radke, J.; Lee, J.H. Impacts of Predicted Sea Level Rise and Extreme Storm Events on the Transportation Infrastructure in the San Francisco Bay Region; California Energy Commission: Sacramento, CA, USA, 2012; Volume 80. [Google Scholar]
- Nowogoński, I. Runoff volume reduction using green infrastructure. Land 2021, 10, 297. [Google Scholar] [CrossRef]
- The Port Authority of New York and New Jersey. Climate Resilience Design Guidelines; The Port Authority of New York and New Jersey: New York, NY, USA, 2015; pp. 1–10. [Google Scholar]
- Boston Planning & Development Agency (BPDA). Coastal Flood Resilience Design Guidelines; Boston Planning & Development Agency (BPDA): Boston, MA, USA, 2019. [Google Scholar]
- Marana, P.; Eden, C.; Eriksson, H.; Grimes, C.; Hernantes, J.; Howick, S.; Labaka, L.; Latinos, V.; Lindner, R.; Majchrzak, T.A.; et al. Towards a resilience management guideline—Cities as a starting point for societal resilience. Sustain. Cities Soc. 2019, 48, 101531. [Google Scholar] [CrossRef] [Green Version]
- Zhang, B.; Xie, G.d.; Li, N.; Wang, S. Effect of urban green space changes on the role of rainwater runoff reduction in Beijing, China. Landsc. Urban Plan. 2015, 140, 8–16. [Google Scholar] [CrossRef]
- Liu, W.; Chen, W.; Peng, C. Assessing the effectiveness of green infrastructures on urban flooding reduction: A community scale study. Ecol. Model. 2014, 291, 6–14. [Google Scholar] [CrossRef]
- Loperfido, J.V.; Noe, G.B.; Jarnagin, S.T.; Hogan, D.M. Effects of distributed and centralized stormwater best management practices and land cover on urban stream hydrology at the catchment scale. J. Hydrol. 2014, 519, 2584–2595. [Google Scholar] [CrossRef]

Publisher’s Note: MDPI stays neutral with regard to jurisdictional claims in published maps and institutional affiliations. |
© 2021 by the authors. Licensee MDPI, Basel, Switzerland. This article is an open access article distributed under the terms and conditions of the Creative Commons Attribution (CC BY) license (https://creativecommons.org/licenses/by/4.0/).