Abstract
Agriculture is a major driver of the ongoing biodiversity decline, demanding an urgent transition towards a system that reconciles productivity and profitability with nature conservation; however, where public policies promoting such transitions are in place, their design often poorly fits the relevant biogeophysical systems, decreasing the policies’ expected effectiveness. Spatial scale mismatches are a primary example in this regard. The literature reviewed in this paper, drawing from both ecology and policy studies, suggests to foster policy implementation at the landscape scale, where most functional ecological processes—and the delivery of related ecosystem services—occur on farmland. Two strategies are identified for coordinating policy implementation at the landscape scale: the promotion of farmers’ collective action and the partition of space on an ecologically sound basis through spatial planning. As the new European Union Common Agricultural Policy (CAP) post-2023 is currently being defined, we assess if and how the draft agri-biodiversity legislation includes any of the strategies above. We find no comprehensive uptake of the landscape-scale perspective at the EU level, thereby suggesting that a powerful tool to overcome the CAP underperformance on biodiversity is being overlooked.
1. Introduction
Agriculture is the major land use on Earth. It covers about 40% of ice-free land and its extent is expected to increase to meet the growing global demand for food [1]. Since the mid-twentieth century, intensive industrial agriculture has allowed cultivation in low-productivity areas and increased food production rates to levels that are unprecedented in human history. On the other hand, land conversion, monoculture, mechanization and the use of chemical inputs exert a considerable pressure on natural assets, substantially contributing to soil degradation, depletion of water resources and disruption of the agroecosystems’ functionality [2,3,4,5]. The agricultural landscape itself changed, as the new techniques led to larger farmed areas, decreased natural and seminatural areas in the vicinity or intermixed with crops, removal of landscape elements and the consequent fragmentation of habitats for many species associated with the agricultural landscape [6,7].
The expansion of agriculture came at the expense of biodiversity, including those species that positively contribute to agricultural production [8,9,10]. To date, agriculture is considered a major driver of biodiversity decline around the globe [11,12]. This also entails significant side effects for human communities. As biological diversity provides key ecosystem services, its decline in human-dominated landscapes involves, over time, reduced benefits in terms of a wide range of providing, regulating and cultural services such as the provision of raw materials, air-quality regulation or recreation and aesthetic values [13,14].
The awareness of these side effects has spurred in the last decades a growing interest in developing agricultural policy settings that allow us to combine productivity and profitability with increased support for biodiversity conservation in farmland. In the European Union, the Common Agricultural Policy (CAP) is the primary policy tool in this regard. For the 2014–2020 programming period, the EU Commission agreed to spend 86 billion Euro on biodiversity, 77% of which coming from the CAP [15]. Nevertheless, a number of studies—notably including an EU Court of Auditors assessment released in 2020—[15,16,17,18,19,20] showed that its effectiveness to halt the biodiversity decline is hindered by factors including the concentration of the EU spending on large farms, the lack of coordination between policies and the EU strategy on biodiversity, the availability of low-impact options and the lack of a market remuneration mechanism for the production of public goods [15,21]; however, the effectiveness of the policies is also hampered by features that are specific to conservation interventions, as the dynamics in time and space of the ecological processes targeted by the policies are not easily matched by the governance and implementation scope of public policy measures.
The (in)compatibilities of policy regimes with the biogeophysical systems with which they interact are known in environmental governance studies as “problems of fit” and are acknowledged as a main source of policy ineffectiveness [22]. Particularly prominent in this regard are spatial scale mismatches (SSMs) between the level(s) at which policy decisions are implemented and perform their effects—e.g., private holdings, administrative levels and other partitions of space delimited by legal boundaries—and those relevant to the ecological processes that they aim to preserve and enhance [23,24,25,26,27,28].
The ecological literature deals extensively with scale issues in biodiversity conservation and offers insights as to possible arrangements to minimize the negative effects of SSMs [29,30,31]. Most prominent in this regard is the adoption of a landscape-scale perspective to effectively enhance habitat quality and availability for the largest number of species. Shaping conservation actions across multiple scales encompassing entire landscapes has been suggested as a particularly valuable strategy for farmland species, including those providing ecosystem services that directly benefit agricultural production—also called functional agri-biodiversity or FAB [32,33,34]; however, this approach is only rarely or poorly retained in policy design, which is still significantly affected by SSMs with their consequent negative implication for policy effectiveness and, ultimately, sound allocation of public funds.
This paper provides an overview of this issue based on a multi-disciplinary conceptual framework that integrates the environmental governance theory of SSMs with the ecological evidence supporting a landscape-scale perspective for FAB conservation. To this end, in Section 2 we define SSMs, building on the theory of problems of fit and the analysis of the different roles played by spatial scale in environmental governance and ecology. In Section 3, we highlight how a landscape-scale approach seems to adequately and efficiently ensure both FAB conservation and the provision of the related ecosystem services.
Two policy strategies are then identified in Section 4 to overcome scale mismatches in farmland: collective action and spatial planning interventions relying on the partition of space on an ecologically sound basis.
Finally, Section 5 and Section 6 are dedicated to the assessment of the proposed regulatory setting of the new EU CAP programming period post-2020—not yet in force—against these two strategies. Following on the many criticisms addressed to the previous CAP regarding its limited success in mitigating biodiversity loss and the degradation of ecological processes, we explore to what extent the proposed regulation addresses these issues by tackling SSMs and integrating a landscape-scale perspective. This is particularly timely and relevant as the EU Green Deal, the Farm to Fork Strategy and, in particular, the EU Biodiversity Strategy 2030 provide unique momentum towards the creation of a multi-functional, more resilient and sustainable agri-food system. It is indeed critical to shape the CAP policy measures as to align with the macro-strategies of the Union and optimize their effectiveness on FAB conservation, including through careful tuning of their spatial implementation.
2. Defining Spatial Scale Mismatches
2.1. Problems of Fit
The effectiveness of environmental policy regimes—their capacity to prevent and solve environmental problems—is determined to a large extent by the degree to which they are compatible with the biogeophysical systems with which they interact. The closer the fit, the better performance is expected [22,35,36,37].
Discrepancies occur in relation to several properties of the ecological systems so that multiple layers of poor fit might overlap. For example, ecological systems present different levels of dynamism. Some fluctuate around an equilibrium while others easily shift from one state to another. The same holds true for resilience to shocks, as they may react to changes on a gradient from quick rebound to slow recovery. Different properties require different policy approaches in order to preserve the targeted ecological system by preventing unwanted shocks, anticipating future changes and tackling ongoing variations. When policy arrangements fail to adapt to crucial properties unintended and undesirable changes might occur and the policy effectiveness could be impaired [22]. It is the case, for instance, of fishing quotas unfit to the recovery pattern of the fish stock [38], or forest conservation policies overlooking the speed of regeneration after wildfires [39].
The problems of fit involve a systemic shortage of knowledge—or “information pathologies”, after Gottfried [40]—as pieces of information that critically influence the targeted ecological outcomes are ignored in the policy design. This entails the poor coherence of policy action, which not only has consequences in terms of policy performance but can also have adverse effects on the ecosystems’ stability in unexpected ways, potentially requiring lengthy restoration [23,41].
A major example of problems of fit is the issue of spatial scale mismatches between environmental policy settings and the relevant ecological systems. Following Cash and Moser (2000), we define spatial scale as any specific geographically bounded level at which a particular ecological phenomenon is recognizable. On the governance side, spatial scale refers instead to a level of organization or a functional unit [42].
We explore in the next sections how spatial scale is conceptualized in both environmental governance and ecology, in order to better understand the problematic interface between the two.
2.2. Spatial Scale in Environmental Governance
Environmental governance refers to the interactions among institutions, structures and processes that determine how power and responsibilities are exercised and decisions are taken with regard to the development and implementation of environmental policy, towards the goals set by a government or an international organization for the management of natural resources and the protection of the environment [43,44,45].
Environmental governance—and governance in general—is intrinsically scalar, as the management of natural resources is entrusted to many institutions across levels of power and space. Space is apportioned and allocated to the sphere of influence of institutions, as determined in political arrangements outlined in international treaties, national constitutions, laws and contracts that organize human common action in contexts of space and time. Consequently, administrative and political boundaries are artificial, rooted in historical and social processes and only poorly related to the properties of the physical space. Similarly, the extent of private holdings such as farms is the result of social and economic interactions and negotiations over private property, another human construct.
Scalar institutions are usually multi-purposed and accumulate different environmental governance functions. Municipalities might be entrusted with implementing powers regarding waste management or fine urban planning while higher administrative units often govern air quality, water protection and coordinate spatial planning. When new environmental policies are advanced, their implementation usually adapts to such existing institutions. In many legal systems, including the European Union, the vertical power sharing is regulated by the principle of subsidiarity, which requires that action is taken at the lowest effective scale of governance [46,47]. More rarely, a new administrative level is created to better fit the management requirements of a particular environmental resource, such as the water basins authorities introduced by the EU Water Framework Directive, mentioned below in Section 2.4.
In the specific case of the European Union agri-biodiversity policy, the governance setting includes an international level—the EU—the national and sub-national level—the Member States and regions entrusted with implementing responsibilities for rural development, environmental and agricultural policy—and a local level composed of entities in charge of territorial planning as well as farm holdings and their aggregations. As shown in the following sections, this local level is the one directly interacting with the ecological processes in the agri-ecosystem and should thus be finely tuned in order to avoid scale mismatches and the consequent impairment of policy performance.
2.3. Spatial Scale in Ecology
The concept of scale in classical ecological sciences has been commonly identified with the conventional hierarchy of biological organization—organism, population, community, ecosystem, landscape, biome and biosphere. Such a classification system is generally conceived as a scale-based tool for grouping types of ecological systems according to an approximation of their size; however, ecologists are aware that such organizational hierarchy is an abstraction, a simplification that posits the existence of closed systems, which is hardly the case in ecology [48]. Allen and Hoekstra [49] push forward this criticism by denying the scalar character of the conventional classification system altogether. As they argue, conventional levels are “unscaled entities”. The same vegetation on the same soil may be studied as an ecosystem or as a community with no spatial implications, depending on how the observer slices the ecological pie.
Scale in ecology has nevertheless an uncontested epistemological value, as a tool to observe and identify patterns in the physical world, a construct that allows us to make sense of the human perceptions of the natural continuum [36,50,51]. Ecologists distinguish between two components of scale—extent and grain, which define the upper and lower limits of resolution of a study. In landscape studies, for example, the extent is the overall area encompassed by the ecological investigation, i.e., the landscape itself, while grain refers to the size of the individual unit of observation or measurement, the smallest areas on which data are available for the study [52,53].
As natural phenomena reveal themselves across physical space, the observer must thus choose the appropriate scale in order to engage the observation; however, most natural phenomena are multi-layered and do not enjoy a univocal correspondence with a specific spatial scale so that the patterns identified inevitably depend on the choices of the observer. This entails an important complication as the more complex a phenomenon is, the more difficult it is to choose one or few spatial levels that allow a satisfactory representation of the object of study and to develop sound predictions. The number of levels that might be considered is potentially very large for issues such as climate change or biodiversity loss, to the extent that they approximate the untreatable sheer complexity of the natural continuum.
Ecological studies have nevertheless shown that nature does not operate in a seamless web. Even complex natural phenomena might be apprehended by focusing on some particularly meaningful or revealing spatial scales. At these scales, the main drivers are understood and the phenomena of interest appear cohesive, explicable and predictable relative to the questions that the observer asks [49,50]. These attributes are not only crucial for fruitful scientific investigation but also for developing informed and effective policy frameworks, planning their implementation and conducting ex-post assessment. The capability of the environmental governance system to exploit meaningful scales is thus key to effective policy implementation.
2.4. Spatial Scale Mismatches—SSMs
According to Cumming et al. [23], SSMs occur when the scale of environmental variation and the scale of the social organization responsible for management are aligned in such a way that one or more functions of the social–ecological system are disrupted, inefficiencies occur and/or important components of the system are lost.
In modern environmental governance systems, an evident case of SSM is that of natural phenomena that cross jurisdictional boundaries. Atmospheric pollution and collapsing fisheries are clear examples of cross-border environmental issues that are best understood by focusing on a wide spatial scale [36,38]. Coherently, the need emerged for shifting policy action from the national to the international level to match the scale at which a positive influence is more likely to be achieved [14,54].
SSMs may also emerge when the scope of a regulatory framework is too broad to effectively manage the drivers of ecological change. For instance, setting the limit values for water discharges at the national or regional level might accommodate power structures and economic forces over water resource exploitation [55] but it overlooks the specific conditions of the receiving water basin, which is indeed a crucial variable for improving water quality. This specific SSM has been tackled in the European Union through the Water Framework Directive (WFD), which explicitly states in its preamble that “The objective of achieving good water status should be pursued for each river basin, so that measures in respect of surface water and groundwater belonging to the same ecological, hydrological and hydrogeological system are coordinated”1. The WFD consequently introduced a system of river basin quality assessment and a new scalar institution—the basin authority—to set differentiated standards.
In conclusion, SSMs occur when the grid of the environmental governance structure—driven by the rationales of governance and politics—is either too fine or too broad to effectively manage a natural phenomenon. As meaningful scales of observation and prediction are identified in the scientific fora, new tools are available to policy-makers to adjust policy design accordingly and intervene on the environment at the spatial scale that allows the most informed and effective action.
We thus explore, in the next sections, the ecological literature on functional agri-biodiversity and the spatial scales emerging as particularly effective for observing and understanding the relevant processes and dynamics, in view of assessing how policy-makers in the European Union are integrating such knowledge in agri-biodiversity policy design.
3. The Landscape-Scale Perspective and FAB Conservation
3.1. Functional Agri-Biodiversity (FAB)
As agriculture is a major land use on Earth—occupying about 40% of the land surface [4]—farmland holds a substantial portion of the world’s biodiversity. It thus appears that no strategy can successfully tackle the ongoing decline of biological diversity without including agricultural areas within its scope [8,56]. On the other hand, the main purpose of farmland is to provide food for the growing human population and income to farmers, which makes it crucial to ensure that conservation actions do not impair the achievement of such goals. In this regard, it is worth noting that many species among the worst affected by the current biodiversity crisis—such as carabid beetles, lady beetles or bumblebees—are also those involved in the provision of crucial ecosystem services on which agricultural production and, consequently, the livelihood of rural communities rely on [20].
In the last decades, the relationship between biological diversity and the functionality of agricultural systems has generated considerable interest and many studies pointed out how proper conservation can lead to agroecosystems capable of sponsoring their own soil fertility, crop protection and yield productivity while reducing the impact of invasive species [57,58]. The diversity of species, traits and genotypes could improve the magnitude and efficiency of many ecosystem processes that substantially contribute to agricultural production, such as pollination, pest control and soil formation [13,14,59,60,61].
Vitousek and Hooper [62], focusing on plant biodiversity, hypothesized three possible relationships between species richness and ecosystem functions and suggested that curve Type 2 in Figure 1 offers the most accurate pattern, on the basis of the available evidence. In their view, a minimum level of species richness is necessary to maximize the ecosystem’s functionality. Although this prediction is still debated, over the years a number of studies corroborated it with evidence and extended to other subsystems [63].
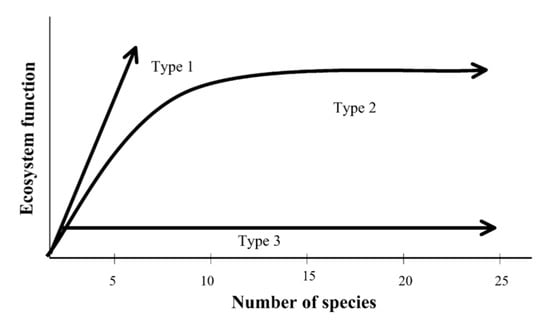
Figure 1.
Possible relationships between biological diversity and ecosystem functions. Type 2 curve has been suggested to be the most accurate pattern (reproduced from [62]).
A valuable interpretation of this relationship identifies the minimum level of diversity required to maximize the ecosystem functions as an essential set of functional groups, i.e., groups of species associated by similar responses to external factors and effects on ecosystem processes, such as pollinators [63,64]. Since the exact pathways of interference between each species and the functioning of ecosystems are beyond current modeling capabilities, focusing on functional groups is a useful simplifying assessment tool [65,66,67].
With specific regard to agroecosystems, the notion of Functional Agri-Biodiversity—or FAB—has gained momentum to indicate the functional groups of species—such as pollinators—that provide core ecosystem services to agricultural production [32]. Building on Vitousek and Hooper’s insight, FAB conservation strategies can ensure adequate diversity and a satisfying level of ecosystem services’ provision, balancing at best conservation and production needs.
Evidence emerging from the studies in this field suggest that many relevant ecosystem services are delivered by FAB depending on habitats spatially segregated from the location where services are provided—this is typically the case of mobile organisms whose feeding or breeding areas do not overlap with the fields that benefits from their services [33]. For this reason, the management of such species requires careful spatial consideration.
3.2. The Landscape Scale
Although ecosystem services supporting agricultural production are ultimately perceived by farmers at the farm or field scale, the resources and habitat structures on which many FAB service providers rely are found in a wider spatial scale, one that comprises their foraging ranges, the extent of dispersal movements as well as other population and meta-population dynamics [8,68].
A widely used definition of landscape scale in agricultural studies is “an area of coherent landscape character or a sub-unit of a natural region, above the field- and farm-scales” [69]. While its actual extent might change depending on the physical and agricultural characteristics of the studied area, it must be wide enough to cover a number of neighboring farms and encompass both cultivated, natural elements and their interactions [8,29,68,70]. The European Landscape Convention also focuses on such interaction defining landscape as “the area, as perceived by people, whose character is the result of action and interaction of natural and/or human factors” [71]. A landscape can also be further identified by its structure, generally defined by its composition and configuration. Composition refers to the proportion of different land cover types on the landscape while configuration informs on the spatial arrangement of the different patches, as well as their size and shape. The interplay of these structural characteristics shapes the ecological properties of the landscape and its suitability for different biodiversity components [72].
The extent of the landscape scale for ecological study purposes thus depends on the study subject and should match between the observable ecosystem processes and the distribution and use of the habitat of the targeted species of investigation. With specific regard to FAB, several studies found that their status and dynamics are best understood and predicted combining the traditional field- and farm-scale observation with a landscape scale spanning at least a few kilometers squared [20,27,57,69,73,74].
In this regard, Figure 2 offers a coarse representation of the spatial scales at which ecological processes modulating biodiversity and multiple ecosystem services operate, including those specific to farmland. The actual extent of the landscape scale can then be further fine-tuned based on the characteristics of the agricultural area under investigation, such as the average size of farm holdings, as well as the local geographical features.
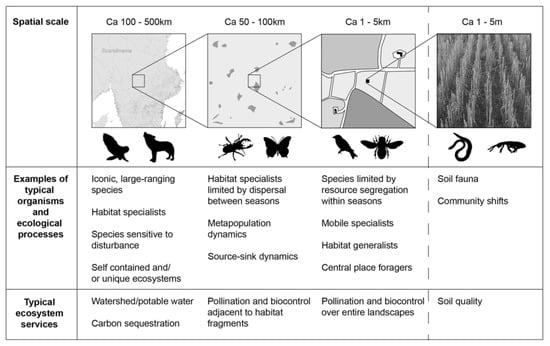
Figure 2.
A simplistic representation of spatial scales at which ecological processes modulating biodiversity and multiple ecosystem services operate. Besides soil quality, functional groups involved in food and fibers production mostly benefit from resource patches integrated across landscape mosaics spanning a few kilometers (reproduced from [33]).
The focus on the landscape scale in agroecosystems emerged in the scientific literature in the 1990s, when ecologists observed that species distribution and abundance are affected by the landscape mosaic structure, the presence and fragmentation of field margins and the management of different parts of the agroecosystems within the wider landscape. The landscape started to be conceived not only as an ecological matrix or an aesthetic entity but, critically, as a level of observation and analysis for consequent management and policy action [75,76]. As research developed on this path, more detailed data became available on the importance of a landscape-scale perspective when assessing the dynamics of key farmland species [8]. For instance, Gonthier et al. [25] showed in their meta-analysis that the assessment of how organisms respond to habitat heterogeneity in farmland is better at a large spatial scale as this allows to include population performance that may not be reflected by individual performance. The majority of observations on vertebrates, invertebrates and plants showed positive correlations between species richness in farms and the agricultural landscape structure. Other studies focusing on butterflies, farmland birds and invertebrates reached the same conclusion, some also highlighting that the landscape structure was a more decisive variable than the farming system in itself [77,78,79,80]. On this basis, some authors also refer to “landscape services” instead of ecosystem services, as to acknowledge the important role of the landscape spatial structure in their provision [81,82].
As the brief literature review below suggests, this is particularly true for FAB delivering two core ecosystem services for agricultural production, i.e., pollination and pest control. To a lesser extent, it can also benefit the soil biota, including those organisms involved in soil production and the provision of nitrogen fixation, other crucial services in agriculture. Moreover, the landscape-scale approach appears as preferable also for farmland birds, which are widely used as indicators of the general agroecosystem’s quality.2
3.2.1. Pollination
Pollination is a crucial service provided by a functional group including both wild species of bees, butterflies, moths, flies, wasps and beetles, and commercially managed bee species. Pollination directly contributes to the production of valuable crops and also assists reproduction of wild plants on which other services or service-providing organisms depend, delivering an indispensable service to 60–90% of plant species [68]. It has been estimated that 84% of the European crops rely on pollination with an economic value around 14 billion Euro per year in the EU [84].
Pollinators are mobile agents. They deliver the pollination service locally but are particularly sensitive to ecological factors operating across spatial levels as their individual behavior, population biology and community dynamics are affected by the spatial distribution of resources at a larger scale. Notwithstanding the significant variety in bees’ ecological traits [33], Kremen [68] shows in her thorough review how the response of bee individuals, populations and communities to land-use changes is largely driven by the spatial distribution of floral, nesting and over-wintering resources dispersed across the landscape, as well as by the landscape composition with regard, for example, to structures such as corridors of vegetation, edges and habitat boundaries, as well as the matrix heterogeneity and fragmentation. Goulson [85] also notes that bumblebees have a foraging range larger than the average farm boundaries so that their nest growth is better determined by the management of a large number of neighboring farms, rather than just that in which the nest is located. On the same line, syrphid flies providing pollination and biological control services in intensive agricultural fields have been shown to be positively influenced by the landscape composition, with particular regard to the presence of connected hedgerows and mass-flowering crops within an area of at least 1 km radius [9].
It follows that, while management practices at the field and farm levels—e.g., the choice of crops or the management of field margins—could deliver good results in maximizing the provision of the pollination service on site in the short term, they constitute only a partial, incomplete strategy if the aim is to enhance the overall conservation status of pollinators, ensure their populations’ persistence and thus preserve their capacity to deliver the service in the long run. This has profound policy implications as directing resources only to narrow-level interventions is likely to deliver unsatisfactory results. For instance, a farm-level action promoting the establishment of patches of flowers to attract pollinators to nest may prove useless if the location cannot sustain offspring production over time due to unsuitable conditions of the wider landscape [86]. A landscape-scale perspective is thus needed to integrate non-crop habitat patches across the production area on a larger scale and ensure that the targeted crops are located within the foraging area of a healthy community of pollinators [33].
3.2.2. Pest Control
Pest control is another core ecosystem service for agriculture, as many unwanted organisms are actually still controlled by natural enemies rather than chemical biocides [8]. In addition, the general trend towards a stricter regulation of chemicals in agriculture is drawing growing attention on the role and dynamics of biological control [87,88].
Pest control by natural enemies allows to keep the numbers of unwanted organisms below damaging levels by relying on other organisms which regulate their population densities through predation, competition or parasitism. As with pollination, many natural enemies are mobile organisms such as lady beetles, syrphid flies and wasps [89]. These species’ use of the habitat and dispersal abilities respond to the presence of suitable areas—e.g., the proportion of non-crop habitat—at a scale ranging from a couple of hundreds of meters to few kilometers [90]. The same reasoning mentioned above thus applies: for any point in the landscape, the delivery of the ecosystem service provided by mobile agents depends on the conditions of the region within foraging and dispersing distance of the point of delivery, which suggests adopting a landscape-scale perspective. The dynamics of both pests and control agents are indeed affected by the degree of disturbance at the landscape-scale. A study by Thies and Tscharntke [91] provided evidence that complex landscapes with a high density and habitat connectivity present a higher level of beneficial parasitism and lower crop damage, as populations of natural enemies immigrate into cultivated fields to attack pest insects. A further study by Thies et al. [92] regarding cereal aphid–parasitoid interactions showed that the correlation between the percentage of arable land in the landscape and the densities of parasitoids was significant on landscape sectors of 0.5–2 km diameter. Within this reach, landscape complexity is beneficial for populations of pest control agents; however, at a larger landscape spatial scale (1–6 km), also the density of certain pest species increased with landscape complexity, thereby possibly counterbalancing biological control. Understanding the difference in the way the targeted species experience the local environment at the landscape scale allows us to better tune land management practices and maximize the benefits for pest control agents.
In addition, the diversity of the associated vegetation cover—which is crucial to decrease rates of pest attacks as it allows for a larger and more diverse reservoir of control agents [63]—is also best observed at the landscape scale as the vegetation composition of a patch is co-determined by the surrounding mosaic. An effective strategy for maximizing the benefits of native vegetation for pest control shall thus reflect the spatial structure of the plants’ habitat network, as well as the dynamics in the network [7]. This again supports the idea that a coordinated management of entire agricultural landscapes is preferable than focusing only on the field or farm levels or on individual landscape elements.
3.2.3. Soil Production and Nitrogen Fixation
Many invertebrates and microorganisms that contribute to soil production and nitrogen fixation are mobile—either actively or carried by vectors—and can thus recolonize degraded areas from patches of the landscape mosaic, if the latter provides suitable reservoirs [63]. The assessment of the potential for ecosystem functions of the soil biota over time might thus also benefit from integrating the wider landscape scale in which such reservoirs are located. This is also advisable as the provision of soil regulating and supporting services discloses its own specificities at the landscape scale, whose dynamics shall not be overlooked in land use management decisions, thus suggesting a multi-scale perspective [93]. With specific regard to agricultural ecosystems, the processes related to nutrient cycling in the soil seem primarily dependent on the management of the production area. Enhancing soil biodiversity for maintaining fertility for agricultural purposes is thus likely to rely on management actions occurring primarily at the field or farm scale [33,94].
3.2.4. Farmland Birds
Farmland birds are among the most threatened bird groups in Europe, down a staggering 34% between 1990 and 20173.
Further, farmland birds are primary indicators of the agroecosystem’s quality and its suitability for wildlife as they are particularly responsive and sensitive to changes in the ecosystem as well as in other animal and plant populations, and their response to changes is widely studied. For this reason, a specific indicator of population trends of farmland birds is used in the monitoring framework the EU Common Agricultural Policy as a barometer of change for the biodiversity of agricultural landscapes in Europe4 [95,96].
The traditional strategy for enhancing farmland birds’ conservation aims at maintaining hedges and boundaries at the field scale; however, although this measure is certainly important for birds nesting, it is of only limited effectiveness if the birds’ nutritional resources are not present close-by. The manipulation of the availability of such resources at the field and farm levels, also, does not appear to deliver significant results on bird populations [97,98]; however, when a UK study tested resource provision on areas wider than 1 km2, further significant relationships were identified, suggesting that conservation effects may only become apparent at the larger landscape-scale that comprises both nesting and feeding areas. For most farmland bird species, such an area extends well beyond the single farm level [99].
4. Two Policy Strategies: Collective Action and Spatial Planning Intervention
The literature reviewed above confirms that FAB conservation is better achieved when farmland management interventions integrate a landscape-scale perspective, thus minimizing the risk of SSMs. From a policy design point of view, this can be achieved by means of two main strategies.
The first strategy focuses on promoting the collective action of farmers in order to “amplify” the spatial effects of interventions by covering wider patches of farmland and coordinating the otherwise scattered farmers’ actions [100,101,102]. This strategy introduces a new collective management level that can be more or less institutionalized—a cooperative of farmers, an existing production district or even just a minimum threshold of contracts through which farmers engage in environmental commitments. These differences can be seen as lying on the coordination–collaboration spectrum identified by Prager [102]. The common feature is that the level of governance is made up of one or few actors bearing legal responsibilities for the management of the farmed landscape.
The policy setting shall thus explicitly target such level and promote farmers’ agglomeration through specific incentive mechanisms and bonuses, which are increasingly showing their cost-effectiveness and conservation efficacy [103]. Financial support is a decisive variable as the transaction costs involved in setting up and animating the collective structure might be high enough to discourage the farmers. This is a crucial aspect as farmers’ holdouts would fragment the spatial coverage of the collective structure and prevent coherently addressing the landscape scale; however, in the medium and long term, agglomeration is supposed to reduce the individual investment required for complying with the measures’ commitments. For instance, specialized machines for the maintenance of hedges might be too costly for individual farmers but instead acceptable for a group [27,104]. Further, from the point of view of the public authority that manages public funds, collective action is expected to decrease the administrative burden, given the reduction of the number of beneficiaries.
The second strategy—spatial planning—focuses less on actors and more on space partitioning, in line with the traditional conservation practice of protected areas. Conservation measures would apply to portions of the agricultural space delimited according to sound ecological considerations rather than property boundaries. This is the case, for instance, of farmed areas within the EU Natura 2000 network. Natura 2000 sites are chosen on the basis of their relevance for the conservation of a set of species and habitats of European interest, and specific restrictions apply to farmers operating within their borders. The same approach could also, irrespective of previously existing protected areas, create an additional formal planning and administrative layer, extending beyond the single farm holdings. All actors falling within such areas are bound to comply with coordinated requirements for landscape-scale conservation.
The recently developed concept of OECMs—Other Effective Area-based Conservation Measures5—offers a suitable definition in this regard. OECMs are areas—other than protected areas—which are not primarily dedicated to biodiversity conservation but are nevertheless governed and managed in ways that achieve positive and sustained long-term outcomes for the in situ conservation of biodiversity. It is a multi-functional approach where conservation is pursued as by-products of another management, such as agricultural production.
Compared to the collective approach, spatial planning interventions require farmers to work towards the same conservation objective independently, with no specific need to interact and collaborate with each other, which puts this strategy at one extreme of the coordination/collaboration spectrum. The focus on spatial coordination makes this strategy a more top-down approach, potentially less permeable to the farmers’ contributions and experiences, unless measures for ensuring an adequate stakeholders’ participation are also integrated in the policy design.
As per the extent of the landscape to be covered by such aggregative strategies, it should at least encompass the above-mentioned minimum relevant scale of few hundreds ha for FAB conservation. On the other hand, it could extend well beyond, in order to create new land management levels up to 10–50 thousands ha of farmed land, as in the case of the Netherlands’ agri-environmental cooperatives [104,105]. The decision on the physical size of collective units or areas under spatial planning for FAB conservation would depend on various factors including the heterogeneity of the concerned territory in terms of farming types or geographic properties, the focus on the conservation of certain FAB species and their distribution area, the local average farm size and the existing local institutional arrangements.
From a comparative perspective, collective action could be more suitable for species-specific conservation measures over relatively small and homogeneous landscapes, where the farmers’ experience and participation add a considerable value to the design and implementation of the measure. On the other hand, spatial partition can be a more effective strategy when the aim is to apply basic conservation standards extending over large areas; however, as mentioned above, the regional and local characteristics as well as the institutional context are expected to be prominent drivers of the choice.
5. The European Union Agri-Biodiversity Conservation Policy
The EU Common Agricultural Policy system is currently in a regulatory transition period. In this section and the next one we investigate the extent to which the main measures for agri-biodiversity conservation in the European Union include a landscape-scale perspective under any of the two strategies outlined above, focusing in particular on the draft legislation for the post-2020 CAP programming period, whose entry into force has been delayed to 2023.
Assessments of the biodiversity-related measures available under the previous CAP settings found poor ecological outcomes and identified the lack of coordination of biodiversity management as an important source of ineffectiveness driven by the measures’ farm-scale targeting [15,20,24,99,106,107,108,109,110,111].
This clearly resonates also in the 2011 report of the European Court of Auditors on the EU agri-environmental schemes in place at that time, which stated that “in certain cases it might be necessary to have, in a particular geographical area, a minimum number of farmers signing a contract. Such cases can be to maintain (...) local landscape, (...) or protect certain species. Expenditure for a few individual contracts may not be effective in such cases. One way to ensure that a sufficiently large group of farmers delivers the necessary environmental benefits is through collective approaches” [112].
5.1. Overview of the EU Common Agricultural Policy
The CAP was established in 1962, when the six founding countries of the European Union agreed to create a common market of agricultural products. Along with competition rules, production support was initially introduced through price regulation, which incentivized the intensification of agriculture, leading to a sharp increase in crop yields. On the other hand, it greatly affected the European landscape and led to permanent surpluses of food production that were dealt with through subsidized export, storage or even disposal.
In 1992, the so-called MacSharry reform transformed the CAP from a production support system towards an income support system in the form of direct payments. Schemes were also made available to farmers to maintain the countryside landscape and support production methods with a lower environmental impact [27]. However, being the support still linked to production quantities and prices, EU farmers were indirectly incentivized to increase production and cost-efficiency through further intensification, enlargement of farms and fields and the abandonment of marginal areas [81], leading in many cases to the homogenization of the agricultural landscape, albeit with differences across the European territory.
This changed in 2003 with the “decoupling” reform (Fishler reform), which converted the CAP income support into a payment scheme largely unrelated to production. The new payment to farmers was based on the average of payments received during a historic reference period (2000–2002) and the average area of farmed land, which gave rise to the payments in the same period. Consequently the EU agricultural sector moved towards the free market, giving farmers more freedom to produce according to market demand. From an environmental point of view, the 2003 reform is a pivotal shift as it introduced the concept of “cross-compliance”, which conditions the issuance of the payment on the compliance with requirements on food safety, animal and plant health, climate, environment and the protection of water resources. In parallel, the Agenda 2000 reform introduced the concept of first and second pillars of the CAP, highlighting the link of goals and strategy between the CAP payment scheme for farmers (the first pillar) and the Rural Development Policy—RDP (the second pillar) aimed at promoting the economic, social and environmental development of the countryside.
Each CAP programming period lasts seven years. The last reform covered the years 2014–2020. It improved the integration of environmental requirements, simplified the policy setting and moved to a more land-based approach for the delivery of direct payments, which are now issued per hectare and on the basis of historic parameters. In 2018, the EU Commission presented a proposal Regulation for the next programming period 2021–2027 (the Commission Proposal) outlining the measures that shall or can be included by Member States in their Strategic Plans for national implementation. The length of the negotiations over the Commission Proposal between the co-legislating European Parliament and Council—which only reached an agreement in June 2021—delayed the new CAP starting date to 2023.
As per the CAP structure, the first pillar represents the core agricultural policy which provides direct payments for income support to European farmers and is entirely financed by the EU budget through the European Agricultural Guarantee Fund (EAGF). The allocation for 2021–2027 amounts to 258.6 billion Euro. Direct payments are mostly decoupled from production and are conditional on compliance with environmental requirements. The second pillar for Rural Development Policy is co-funded by the EU budget—the European Agricultural Fund for Rural Development (EAFRD), with an allocation of 85.3 billion Euro—and national and regional funds. Interventions aiming specifically at the protection and enhancement of biodiversity are mainly provided under this second pillar6
5.2. The Proposed CAP Measures Relevant for FAB Conservation: Scope and Spatial Perspective
The Commission Proposal provides different measures that, directly or indirectly, aim at protecting FAB through both pillars, some newly introduced and others already in place in the last CAP programming period.7
With regard to the first pillar, the Commission Proposal provides an “enhanced conditionality”, which replaces the previous cross-compliance and greening mechanisms by extending the baseline environmental requirements to all recipients of the CAP direct payments. Compared to the last programming period, this shifts the implementation of some biodiversity-supporting practices from voluntary to mandatory for all farmers. In addition, a new set of voluntary incentive schemes supported by annual payments per hectares—so-called “eco-schemes”—shall be introduced and defined by Member States in their CAP Strategic Plans.
The second pillar on Rural Development is mostly maintained in its core structure. Two main interventions contribute to FAB conservation by providing financial incentives to farmers. First, agri-environment-climate measures (AECM) remunerate voluntary practices—such as organic farming or site-specific landscape management—undertaken by farmers that go beyond the conditionality obligations. Second, the Natura 2000 payments compensate for the practices undertaken because of the farm’s inclusion within the network of protected Natura 2000 sites or another area that contributes to the network’s connectivity. In addition, a cooperation measure provides general funding for establishing aggregations of farmers and/or other operators.
It is worth noting that Article 3 (a) of the Commission Proposal—as the previous legislation in place—defines the farmer as “a natural or legal person, or a group of natural or legal persons, regardless of the legal status granted to such group and its members by national law [...] who exercises an agricultural activity [...]”. Groups of farmers are thus formally always allowed to coordinate their activity; however, the analysis of the different available policy tools shows that coordinated action is never requested and only seldom actively promoted.
5.2.1. Enhanced Conditionality
The enhanced conditionality mechanism is the basic layer of compulsory environmental obligations to be met by all farmers that receive the CAP income support. These requirements are divided into two categories: statutory management requirements (SMR) and standards for good agricultural and environmental condition of land (GAEC). SMRs are existing EU legal provisions that farmers must comply with, while the GAECs have been specifically designed in the CAP context.
The Commission Proposal lists SMRs and GAECs in its Annex III and clusters them according to the area and the main issue affected. Under the area “Climate and environment”, SMRs and GAECs are grouped around the issues of climate change, water, soil and biodiversity and landscape. Although FAB may be indirectly affected by various other measures, we focus here specifically on the last issue, outlined in Table 1.

Table 1.
Enhanced conditionality relevant for FAB—Adapted from Annex III, Commission Proposal.
From a spatial perspective, it is worth noting that obligations under SMR 3, SMR 4 and GAEC 10 only concern areas falling within the Natura 2000 protected sites for the conservation of wild birds and natural habitats. Only GAEC 9 requires compliance with landscape management obligations that actually apply to all direct payments’ recipients.
The provisions on conditionality in the Commission Proposal do not include nor promote any specific coordination mechanism among farmers. All measures are intended for farm-scale implementation and each farmer is only requested to ensure the compliance of his/her holding with the set of obligations outlined above. On the other hand, the effects on biodiversity are expected to manifest at the landscape scale, thus creating a high potential for spatial scale mismatches to arise and impair policy effectiveness.
This, however, might vary greatly among the measures depending on their specific spatial features, which could actually contribute to curb the SSMs negative effects.
First, the obligations applying to farm holdings within the Natura 2000 sites (SMR 3 and 4, and GAEC 10) are expected to benefit from the spatial planning approach that grounds the Natura Directives, which we identified as one of the available strategies for minimizing the effects of SSMs. Since the Natura 2000 sites are geographically delimited on the basis of ecological considerations, the relevant obligations for farmers are expected to suit the local conservation needs and to be coherent across the landscapes included in the sites. This corrective effect largely depends on how the Natura Directives are actually implemented at the national, regional and site level. A number of possible variables interact in determining the actual effectiveness of the spatial planning approach on-site, such as the existence of a site management plan, which is not mandatory for Member States to enact. Further, it is worth highlighting the limited scope of these measures, as only a relatively small share of the total EU agricultural area—around 10.6%—falls under the Natura 2000 network.
Second, with regard to GAEC 9, a mitigating factor of the negative SSM effects could be the high number of farmers subject to the same measure as recipients of CAP payments. Cross-compliance now applies to 7 million beneficiaries of CAP support, which account for about 66% of all farm holdings8. The enhanced conditionality obligations post-2020, which will enter into force as of 2023, is likely to cover a similarly wide share of holdings, possibly avoiding significant gaps and fragmentation in the spatial implementation of beneficial practices.
This makes sense as long as the conditionality measures are mandatory basic standards that benefit from the widest spatial application without the need of local targeting. It can be the case of low-demanding practices such as the retention of landscape features or the ban on cutting hedges and trees during the birds’ breeding and rearing seasons. On the other hand, the wide coverage as such—without further provisions for spatial coordination—does not seem enough in case of more demanding requirements such as the maintenance of non-productive features and areas. This issue recalls the debate around the Ecological Focus Areas (EFAs) provided under the greening mechanism in the previous CAP programming period, where different options for non-productive areas, including also ineffective options for biodiversity conservation, were available to farmers with no spatial mechanism [110,113]. The effectiveness of set-aside areas is expected to depend significantly on the local landscape composition which, in turn, they contribute to shape. This requires coordination in the way different types of non-productive features and areas are chosen and located on the landscape, in order to avoid a fragmented implementation and impaired effectiveness. Below a critical spatial threshold of implementation, the positive landscape-scale effects for FAB might not be triggered. Evidence shows that this is what happened with EFAs [110,114]. In lack of any regulatory improvement, the same is likely to happen for the GAEC 9 set-aside measures under the CAP post-2020.
As Member States are allowed to specify and integrate the conditionality measures in the CAP Strategic Plans, it is ultimately their responsibility—in the absence of specific guidance by the EU regulatory framework in this regard—to ensure that more demanding measures are locally tailored and coherently implemented across the landscapes.
5.2.2. Eco-Schemes
The new eco-schemes for climate and environment are also financed through the CAP first pillar. According to the Commission proposal, these are voluntary schemes for farmers willing to implement practices beneficial for the environment beyond the minimum requirements imposed by the enhanced conditionality mentioned above.
The inclusion of eco-schemes in the CAP Strategic Plans is compulsory for Member States, which are also responsible for identifying the practices covered by the economic incentive. A minimum spending on eco-schemes has been set at 25% of the direct payments’ budget as from 2025, after a two years “learning period” where the minimum spending will be 20%.
Their main feature is the structure as “one-year-at-a-time” commitments. This would allow farmers to test new practices such as organic farming or integrated pest management without any long-term commitment and decide to keep those that worked best for them, and possibly extend or convert them into more ambitious rural development schemes.
Similarly to the set-aside conditionality measure mentioned above, eco-schemes for biodiversity conservation are likely to require actions beyond the mere preservation of the status-quo, which increases the risk of proving ineffective if not implemented coherently at the landscape scale.
The Commission Proposal does not include a list of agricultural practices that can be supported through the eco-schemes (only an indicative, non-binding list is available), leaving this task to Member States. Moreover, besides setting the general objectives—including the protection of biodiversity and enhancement of ecosystem services—and the options for the financing mechanism, the Proposal does not provide any additional guidance, which could also be added in the future through specific delegated acts. This also entails that no departure from the farm-scale approach is provided in the EU legislation so far. Since no consideration of a larger landscape scale is either imposed or suggested, we could expect a fragmented spatial implementation unless Member States independently introduce corrections such as a minimum threshold for the covered area or farmers’ participation.
5.2.3. Agri-Environmental-Climate Measures—AECMs
AECMs were the main environmental tool of the CAP second pillar in the 2014–2020 programming period, drawing almost 16.8% of all Rural Development expenditure9. For the post-2020 period, the Commission Proposal confirms this instrument as the backbone of rural environmental policy, now also incorporating previously separated measures such as payments for organic farming (6.4% of the 2014–2020 expenditure).
Under Article 65 of the Commission Proposal, AECMs provide annual payments for long-term voluntary management commitments lasting five to seven years—or beyond, if duly justified—that benefit the environment and climate beyond the baseline set by the conditionality requirements. Among other objectives, they shall aim to restore, preserve and enhance ecosystems and contribute to biodiversity conservation. The specific options available to farmers are to be included in the Member States’ Strategic Plans and could cover, for instance, the management of landscape features, agro-ecology, organic farming and other environmentally friendly production systems.
AECMs are mandatory for Member States to include in their Strategic Plans but, as with eco-schemes, they are voluntary for farmers to join. At least 30% of the rural development budget must be dedicated to this kind of measures.
As for their spatial scope, the Commission Proposal shows here a stronger uptake of the concept of multi-scale intervention compared to conditionality and eco-schemes. Article 65(7) of the Proposal states that “Member States may promote and support collective schemes and result-based payment schemes to encourage farmers to deliver a significant enhancement of the quality of the environment at a larger scale and in a measurable way”.
It is worth noting that this possibility—not a mandatory requirement—was already present in the previous programming period legislation. The latter also explicitly provided an additional payment covering the transaction costs of collective undertakings, which has not been included in the new Commission Proposal.
Despite these provisions, in the last CAP period only the Netherlands—where farmers’ cooperatives were already well established in the institutional panorama—fully implemented collective AECMs for FAB conservation [105]. This suggests that the mere possibility to introduce collective arrangements, even coupled with transaction costs’ compensation, was not sufficient to trigger their uptake by Member States.
This is not likely to change in the post-2020 CAP as the Commission Proposal relies even more on subsidiarity, leaving more flexibility to Member States to shape the CAP interventions. Thus, as with eco-schemes, the spatial fitness of FAB-related AECMs becomes entirely a national responsibility, increasing the risk of perpetuating the SSMs and the consequent policy ineffectiveness on biodiversity indicators.
5.2.4. Natura 2000 and Water Framework Directive Payments
As part of the CAP second pillar, Article 67 of the Commission proposal states that Member States may provide annual payments per hectare as compensation to farmers or other land managers whose activities are restrained by the Water Framework Directive or due to inclusion in Natura 2000 sites and connected areas.
The payment would cover in particular all or part of the additional costs and income foregone due to constrains imposed within the area concerned that exceed the requirements of the enhanced conditionality. Eligible obligations in the past included for instance the maintenance of certain practices or land cover within the protected areas, restrictions on livestock grazing densities or the obligation not to collect a portion of the agricultural production.
As mentioned above with regard to SMR 3 and 4, the design of the Natura 2000 payments in the Commission Proposal could allow to cover the landscape-scale processes crucial for effective FAB conservation. Natura 2000 sites are geographically delimited to match ecological requirements and farmers’ obligations are expected to apply coherently over these areas. The sites’ management plans or equivalent planning instruments could operate as an additional institutional layer offering spatial planning coordination, thus preventing scattered management interventions on the landscape and avoiding SMSs.
The limitations due to the non-mandatory provision of management plans and the small share of agricultural area included in the Natura 2000 network equally apply.
5.2.5. Cooperation Measure
The cooperation measure established by Article 71 of the Commission Proposal—also voluntary for Member States to include in their Strategic Plans—aims expressly at supporting agglomeration of farmers and other operators. Since 2013, the original economic/social scope of the measure has been extended to cover also joint approaches that contribute to the protection of biodiversity, enhance ecosystem services and preserve habitats and landscapes. Collective AECMs are expressly mentioned and enjoy a longer support period over seven years, if justified. This measure offers potential support for the establishment and running of cooperation activities, covering all aspects of the cooperation of groups and projects.
In line with the goal of increased subsidiarity, the Commission Proposal does not provide detailed guidance on how Member States shall implement the measure; however, an important novelty in its scope is introduced with regard to the previous programming period. Under the previous legislation, the threshold for its use was particularly high, as it only covered interventions of rural development. The text of the Commission Proposal for the post-2020 CAP seems instead to allow a larger scope, possibly covering also the collective execution of the mandatory activities under the first pillar provisions (e.g., GAEC 9 on non-productive areas an features). In fact, Article 71 lists some specific options and “other forms of cooperation” with no further specification.
The wider scope of the cooperation measure would allow its use to incentivize spatial coordination for the enhanced conditionality obligations, for AECMs such as agri-ecology or organic farming schemes, and conservation activities in Natura 2000 sites. This would make it a potentially very useful tool to shift the FAB-related intervention towards a landscape-scale approach and increased effectiveness, which would nevertheless depend on the capacity of the measure’s design to minimize farmers’ holdouts and promote a non-fragmented spatial application.
The introduction of this measure in the national Strategic Plans is not mandatory and all decisions regarding its actual scope and design are entirely devolved to Member States, thus paving the way to a highly differentiated panorama across the EU territory.
6. The Landscape-Scale Perspective in the Post-2020 CAP Proposal
In Section 4, we identified two main strategies that allow a coordinated management of the agroecosystem encompassing the landscape scale: the collective action of farmers and spatial planning intervention relying on the partition of space on an ecologically sound basis. The analysis of the use of these tools in the relevant EU CAP measures post-2020 exposes a complex situation, summarized in Table 2 below.
Table 2.
Inclusion of the landscape-scale perspective in the Commission Proposal.
As per the first strategy, in a Communication on the Future of Food and Farming in 2017 the EU Commission stated that “the overall performance of the new green architecture [of the CAP] should encourage the promotion of co-operative/collective approaches, involving Farmers and Stakeholders in a result-oriented delivery of environmental and climate public goods (…)” [115]. With regard to the Commission Proposal, it seems that such an objective has only been tentatively addressed, without major changes compared to the 2014–2017 CAP period. Collective action is not set by the Commission Proposal as the standard or priority implementation method for any of the FAB-related measures. On the other hand, a legal basis exists that always allows groups of farmers to participate in the CAP measures collectively on a voluntary basis, as the definition of “farmer” is not restricted to individual holdings. Under the previous CAP, this same setting did not spur a strong uptake of the collective approach in Member States. Indeed, besides some spatially limited projects [116], only the Netherlands provided a standard collective implementation of agri-environmental measures on the whole national territory—albeit with limited regard to AECMs. After some years of pilot projects, the Dutch collective model formally entered into force in 2016 [105]. In addition, the Commission Proposal expressly mentions collective schemes only with regard to AECMs, which does not seem coherent with the goal of encouraging their broader promotion. Compared to the last CAP programming period, this is actually a step back, as the CAP 2014–2020 legislation also explicitly mentioned collective action with regard to EFAs—a “greening” measure of the first pillar—and organic farming, which was then supported through a separate measure under the second pillar. From the point of view of the financial support available for collective action, the post-2020 Commission Proposal confirms the provision of a general cooperation measure whose implementation is only voluntary for Member States to include in their Strategic Plans. Differently from the previous programming period, it seems to allow support for collective action in the first pillar as well. On the other hand, the Commission Proposal does not mention anymore the specific reimbursement of transaction costs for AECMs and organic farming that was available under the CAP 2014–2020.
Regarding the second mechanism for landscape-scale action, i.e., spatial planning, some measures (SMR 3 and 4, GAEC 10 and the Natura 2000 payments) rely on multi-functional delimited areas—the Natura 2000 protected sites—which could encourage a comprehensive approach to farmland biodiversity needs, encompassing the landscape scale; however, the Natura 2000 network covers only 10.6% of the EU agricultural land and does not specifically target farmland biodiversity. For this spatial partition to actually create the conditions for coordinated landscape-scale action, site-specific management plans or equivalent instruments should be enacted, which is not a mandatory requirement. Lacking such plans, only the general rules stemming from the EU Natura Directives apply, thus highly limiting the local adaptation potential.
No other arrangements of spatial partition for biodiversity conservation has been included in the Commission Proposal. With an admittedly quite radical departure from the current arrangement, biodiversity measures could, for instance, have been linked to delimited “priority” areas such as those estimated under High Nature Value farming—about 41% of the total agricultural land, encompassing Natura 2000 [117,118]—or the organic districts and similar clusters present in many Member States, in order to facilitate some extent of coordination within these areas. Conservation action is also expected to be more cost-effective when implemented in farmed areas that still support high levels of biodiversity [119].
The shift to a landscape-scale perspective for FAB-related measures would require a significant change of mindset and innovative administrative arrangement. These are lacking in the Commission Proposal, thereby suggesting that a powerful tool to overcome the CAP underperformance on biodiversity is being overlooked. Since the scale issue has not been addressed in the negotiations between the Parliament and Council, the current farm-scale approach will likely remain in the final CAP legislation whose approval is expected in fall 2021. The national level, enjoying a wider flexibility of implementation compared to the previous CAP periods, is thus the last chance of introducing corrective measures to limit the negative effects of SSMs.
7. Conclusions
In line with the governance literature that identifies SSMs as a source of biodiversity policy ineffectiveness, a vast ecological literature suggests that the performance of FAB conservation measures depends significantly on their spatial implementation. Specifically, the landscape scale is the spatial level where the properties and dynamics of the relevant ecosystems are best protected. Such convergence between social and biological sciences’ insights provides a powerful way forward to optimize conservation policy design in farmland and the consequent better allocation of public funds.
However, as seen in the case of the EU CAP, the uptake of the landscape-scale perspective in the agri-biodiversity policy realm and the consequent design of multi-scale measures for FAB conservation is still limited.
A lever to promote such perspective as a policy design principle, in the EU and elsewhere, could be the availability of rigorous policy effectiveness analyses in this regard. Although ample ecological research highlights the link between landscape-scale management and FAB conservation status, there are still very few ex post empirical evaluations of the performance of landscape-scale conservation measures on farmland biodiversity, i.e., measures applying on at least a few hundred ha, beyond the average farm size in the EU10. The poor use of such measures is clearly a decisive limiting factor; however, empirical evaluations are needed to improve the toolbox against SSMs and better understand the main variables of policy design or implementation context that contribute to the measures’ performance.
So far, very few empirical evaluations of the biodiversity impact of collective programs are available, relying on qualitative analysis [120] or modeling simulation [121]. In this regard, it is worth noting that the Dutch collective application of AECMs on the whole national territory will likely provide valuable data allowing for future policy analysis, in particular if the collective approach will be confirmed in the national Strategic Plan post-2020. Other examples and pilot projects of collective action in biodiversity conservation should be systematically assessed against the ecological situation before their implementation and/or outside their spatial extent of application.
As per the second strategy, spatial planning interventions for farmland biodiversity conservation have been only indirectly assessed by experimentally increasing the area covered by conservation measures [107]. No empirical study, to our knowledge, directly assesses space partition as a variable of policy effectiveness on FAB, although this kind of analysis is largely used in conservation studies on the impacts of protected areas [122,123,124]. Future research should aim at filling this gap. For example by empirically assessing FAB dynamics, directly or through relevant proxies, within coherently managed protected areas that include a significant share of farmland. Although designated sites for nature conservation do not usually target FAB as their main conservation objective, a counterfactual assessment of the spill-over effect of their management design on farmland biodiversity could nevertheless provide useful data on the spatial planning strategy for FAB conservation. Again, the analysis should allow to infer the added value of space partition, for example by comparing FAB-specific outcomes before/after and inside/outside designated areas for conservation that include a majority of agricultural land. Such research path would require a combination of inputs from spatial ecology and land management policy, highlighting once again the importance of an interdisciplinary approach to tackle current environmental issues.
Author Contributions
Conceptualization, F.L.F.; writing—original draft preparation, F.L.F.; writing—review and editing, F.L.F., E.F. and T.D.; supervision, E.F. and T.D.; funding acquisition, T.D. All authors have read and agreed to the published version of the manuscript.
Funding
This research received no external funding. The APC was funded by T.D.
Conflicts of Interest
The authors declare no conflict of interest.
Abbreviations
The following abbreviations are used in this manuscript:
| CAP | Common Agricultural Policy |
| SSM | Spatial Scale Mismatch |
| FAB | Functional Agri-Biodiversity |
| AECM | Agri-Environmental Climate Measure |
| SMR | Statutory Management Requirements |
| GAEC | Good Agricultural and Environmental Condition of land |
Notes
| 1 | Directive 2000/60/EC of the European Parliament and of the Council of 23 October 2000 establishing a framework for Community action in the field of water policy, Preamble, n. 33. |
| 2 | It is worth noting that this also applies beyond services related to food and fibers provision. Indeed, a wide range of services in agriculture are best understood from a landscape perspective, notably cultural services such as educational, aesthetic and other non-material benefits that originate from the particular interplay between humans and the biological community occurring on farmland [14,83]. |
| 3 | Common farmland birds in EU and UK—Common bird—population index 1990–2017, available at https://www.eea.europa.eu/data-and-maps/daviz/common-birds-in-europe-population-index-6#tab-googlechartid_googlechartid_googlechartid_chart_4121 (accessed on 1 March 2021). |
| 4 | Eurostat Farmland Bird Index, available at http://appsso.eurostat.ec.europa.eu/nui/show.do?dataset=env_bio2&lang=en (accessed on 1 May 2021). |
| 5 | Conference of the Parties of the Convention of Biological Diversity—Decision 14/8 of 30 November 2018. |
| 6 | More information available at https://www.europarl.europa.eu/factsheets/en/sheet/104/the-common-agricultural-policy-in-figures (accessed on 1 June 2021). |
| 7 | EU Commission Regulation proposal COM/2018/392 final— 2018/0216 (COD), available at https://eur-lex.europa.eu/legal-content/EN/TXT/?uri=COM%3A2018%3A392%3AFIN (accessed on 1 May 2021). |
| 8 | Total farm holdings in 2016 were 10.5 million. Eurostat, 2018. Available at: https://ec.europa.eu/eurostat/documents/3217494/9455154/KS-FK-18-001-EN-N.pdf/a9ddd7db-c40c-48c9-8ed5-a8a90f4faa3f?t=1558692068000 (accessed on 1 June 2021). |
| 9 | See Overview of the rural development programmes 2014–2020, available at https://ec.europa.eu/info/sites/default/files/food-farming-fisheries/key_policies/documents/rdp-2014-20-list_en.pdf (accessed on 1 June 2021). |
| 10 | For data on the physical size of farms in the EU, see https://ec.europa.eu/eurostat/statistics-explained/index.php?title=Small_and_large_farms_in_the_EU_-_statistics_from_the_farm_structure_survey&oldid=406560 (accessed on 1 July 2021). |
References
- Tanentzap, A.J.; Lamb, A.; Walker, S.; Farmer, A. Resolving Conflicts between Agriculture and the Natural Environment. PLoS Biol. 2015, 13, e1002242. [Google Scholar] [CrossRef] [PubMed]
- Altieri, M.A.; Toledo, V.M. The Agroecological Revolution in Latin America: Rescuing Nature, Ensuring Food Sovereignty and Empowering Peasants. J. Peasant. Stud. 2011, 38, 587–612. [Google Scholar] [CrossRef]
- Godfray, H.C.J.; Beddington, J.R.; Crute, I.R.; Haddad, L.; Lawrence, D.; Muir, J.F.; Pretty, J.; Robinson, S.; Thomas, S.M.; Toulmin, C. Food Security: The Challenge of Feeding 9 Billion People. Science 2010, 327, 812–818. [Google Scholar] [CrossRef]
- Foley, J.A.; Ramankutty, N.; Brauman, K.A.; Cassidy, E.S.; Gerber, J.S.; Johnston, M.; Mueller, N.D.; O’Connell, C.; Ray, D.K.; West, P.C.; et al. Solutions for a Cultivated Planet. Nature 2011, 478, 337–342. [Google Scholar] [CrossRef] [PubMed]
- Lechenet, M.; Dessaint, F.; Py, G.; Makowski, D.; Munier-Jolain, N. Reducing Pesticide Use While Preserving Crop Productivity and Profitability on Arable Farms. Nat. Plants 2017, 3, 1–6. [Google Scholar] [CrossRef]
- Vos, C.C.; Zonneveld, J.I.S. Patterns and Processes in a Landscape under Stress: The Study Area. In Landscape Ecology of a Stressed Environment; Vos, C.C., Opdam, P., Eds.; Springer: Dordrecht, The Netherlands, 1993; pp. 1–27. [Google Scholar] [CrossRef]
- Geertsema, W.; Opdam, P.; Kropff, M. Plant Strategies and Agricultural Landscapes: Survival in Spatially and Temporally Fragmented Habitat. Landsc. Ecol. 2002, 17, 263–279. [Google Scholar] [CrossRef]
- Tscharntke, T.; Klein, A.M.; Kruess, A.; Steffan-Dewenter, I.; Thies, C. Landscape Perspectives on Agricultural Intensification and Biodiversity – Ecosystem Service Management. Ecol. Lett. 2005, 8, 857–874. [Google Scholar] [CrossRef]
- Haenke, S.; Kovács-Hostyánszki, A.; Fründ, J.; Batáry, P.; Jauker, B.; Tscharntke, T.; Holzschuh, A. Landscape Configuration of Crops and Hedgerows Drives Local Syrphid Fly Abundance. J. Appl. Ecol. 2014, 51, 505–513. [Google Scholar] [CrossRef]
- Weissteiner, C.J.; García-Feced, C.; Paracchini, M.L. A New View on EU Agricultural Landscapes: Quantifying Patchiness to Assess Farmland Heterogeneity. Ecol. Indic. 2016, 61, 317–327. [Google Scholar] [CrossRef]
- European Commission. EU Biodiversity Strategy for 2030—COM(2020) 380 Final; Brussels. 2020. Available online: https://eur-lex.europa.eu/legal-content/EN/TXT/?qid=1590574123338&uri=CELEX:52020DC0380 (accessed on 1 June 2021).
- WWF. Living Planet Report 2020: Bending the Curve of Biodiversity Loss; WWF: Gland, Switzerland, 2020. [Google Scholar]
- Ehrlich, P.R.; Wilson, E. Biodiversity Studies: Science and Policy. Science 1991, 253, 758–762. [Google Scholar] [CrossRef]
- Millennium Ecosystem Assessment; Technical Report; World Resources Institute, Island Press: Washington, DC, USA, 2005.
- European Court of Auditors. Biodiversity on Farmland: CAP Contribution Has Not Halted the Decline; Technical Report; Publications Office: Luxembourg, 2020. [Google Scholar]
- Lakner, S.; Holst, C.; Dittrich, A.; Hoyer, C.; Pe’er, G. Impacts of the EU’s Common Agricultural Policy on Biodiversity and Ecosystem Services: Drivers, Risks, and Societal Responses. In Atlas of Ecosystem Services: Drivers, Risks, and Societal Responses; Springer International Publishing: Berlin/Heidelberg, Germany, 2019; pp. 383–389. [Google Scholar] [CrossRef]
- Pe’er, G.; Dicks, L.V.; Visconti, P.; Arlettaz, R.; Báldi, A.; Benton, T.G.; Collins, S.; Dieterich, M.; Gregory, R.D.; Hartig, F.; et al. EU Agricultural Reform Fails on Biodiversity. Science 2014, 344, 1090–1092. [Google Scholar] [CrossRef] [PubMed]
- Pe’er, G.; Lakner, S.; Müller, R.; Passoni, G.; Bontzorlos, V.; Moreira, F.; Azam, C.; Berger, J.; Bezak, P.; Bonn, A.; et al. Is the CAP Fit for Purpose? An Evidence-Based Fitness Check Assessment; Technical Report; German Centre for Integrative Biodiversity Research (iDiv), Halle-Jena-Leipzig: Leipzig, Germany, 2017. [Google Scholar]
- Kleijn, D.; Berendse, F.; Smit, R.; Gilissen, N. Agri-Environment Schemes Do Not Effectively Protect Biodiversity in Dutch Agricultural Landscapes. Nature 2001, 413, 723–725. [Google Scholar] [CrossRef] [PubMed]
- Kleijn, D.; Rundlöf, M.; Scheper, J.; Smith, H.G.; Tscharntke, T. Does Conservation on Farmland Contribute to Halting the Biodiversity Decline? Trends Ecol. Evol. 2011, 26, 474–481. [Google Scholar] [CrossRef] [PubMed]
- Peeters, A.; Lefebvre, O.; Balogh, L. A Green Deal for Implementing Agroecological Systems: Reforming the Common Agricultural Policy of the European Union. Landbauforschung 2021, 70, 83–93. [Google Scholar] [CrossRef]
- Young, O.R. The Institutional Dimensions of Environmental Change: Fit, Interplay, and Scale; The MIT Press: Cambridge, MA, USA, 2002. [Google Scholar] [CrossRef]
- Cumming, G.S.; Cumming, D.H.M.; Redman, C. Scale mismatches in social-ecological systems: Causes, consequences, and solutions. Ecol. Soc. 2006, 11, 14. [Google Scholar] [CrossRef]
- Pelosi, C.; Goulard, M.; Balent, G. The Spatial Scale Mismatch between Ecological Processes and Agricultural Management: Do Difficulties Come from Underlying Theoretical Frameworks? Agric. Ecosyst. Environ. 2010, 139, 455–462. [Google Scholar] [CrossRef]
- Gonthier, D.J.; Ennis, K.K.; Farinas, S.; Hsieh, H.Y.; Iverson, A.L.; Batary, P.; Rudolphi, J.; Tscharntke, T.; Cardinale, B.J.; Perfecto, I. Biodiversity Conservation in Agriculture Requires a Multi-Scale Approach. Proc. R. Soc. B Biol. Sci. 2014, 281, 20141358. [Google Scholar] [CrossRef] [PubMed]
- Paloniemi, R.; Apostolopoulou, E.; Primmer, E.; Grodzinska-Jurcak, M.; Henle, K.; Ring, I.; Kettunen, M.; Tzanopoulos, J.; Potts, S.; van den Hove, S.; et al. Biodiversity Conservation across Scales: Lessons from a Science–Policy Dialogue. Nat. Conserv. 2012, 2, 7–19. [Google Scholar] [CrossRef]
- Lefebvre, M.; Espinosa, M.; y Paloma, S.G.; Paracchini, M.L.; Piorr, A.; Zasada, I. Agricultural Landscapes as Multi-Scale Public Good and the Role of the Common Agricultural Policy. J. Environ. Plan. Manag. 2015, 58, 2088–2112. [Google Scholar] [CrossRef]
- Sayles, J.S.; Baggio, J.A. Social–Ecological Network Analysis of Scale Mismatches in Estuary Watershed Restoration. Proc. Natl. Acad. Sci. USA 2017, 114, E1776–E1785. [Google Scholar] [CrossRef] [PubMed]
- Benton, T.G.; Vickery, J.A.; Wilson, J.D. Farmland Biodiversity: Is Habitat Heterogeneity the Key? Trends Ecol. Evol. 2003, 18, 182–188. [Google Scholar] [CrossRef]
- Oliver, T.; Roy, D.B.; Hill, J.K.; Brereton, T.; Thomas, C.D. Heterogeneous Landscapes Promote Population Stability. Ecol. Lett. 2010, 13, 473–484. [Google Scholar] [CrossRef] [PubMed]
- Donaldson, L.; Wilson, R.J.; Maclean, I.M.D. Old Concepts, New Challenges: Adapting Landscape-Scale Conservation to the Twenty-First Century. Biodivers. Conserv. 2017, 26, 527–552. [Google Scholar] [CrossRef]
- Bàrberi, P.; Moonen, A. Reconciling Agricultural Production with Biodiversity Conservation; Burleigh Dodds Science Publishing: Cambridge, UK, 2020. [Google Scholar] [CrossRef]
- Ekroos, J.; Ödman, A.M.; Andersson, G.K.S.; Birkhofer, K.; Herbertsson, L.; Klatt, B.K.; Olsson, O.; Olsson, P.A.; Persson, A.S.; Prentice, H.C.; et al. Sparing Land for Biodiversity at Multiple Spatial Scales. Front. Ecol. Evol. 2016, 3, 145. [Google Scholar] [CrossRef]
- Martin, D.; Gaston, K.J.; Skinner, A.M.J.; Nick, H.; Acs, S.; Armsworth, P.R. Field-Level Bird Abundances Are Enhanced by Landscape-Scale Agri-Environment Scheme Uptake. Biol. Lett. 2010, 6, 643–646. [Google Scholar] [CrossRef]
- Ostrom, E. A General Framework for Analyzing Sustainability of Social-Ecological Systems. Science 2009, 325, 419–422. [Google Scholar] [CrossRef]
- Cash, D.W.; Adger, W.N.; Berkes, F.; Garden, P.; Lebel, L.; Olsson, P.; Pritchard, L.; Young, O. Scale and Cross-Scale Dynamics: Governance and Information in a Multilevel World. Ecol. Soc. 2006, 11, 8. [Google Scholar] [CrossRef]
- Cleveland, C.; Costanza, R.; Eggertsson, T.; Fortmann, L.; Low, B.; McKean, M.; Ostrom, E.; Wilson, J.; Young, O. A Framework for Modeling the Linkages between Ecosystems and Human Systems. Beijer Discuss. Pap. Ser. 1996, 76, 51. [Google Scholar]
- Pauly, D.; Christensen, V.; Guénette, S.; Pitcher, T.J.; Sumaila, U.R.; Walters, C.J.; Watson, R.; Zeller, D. Towards Sustainability in World Fisheries. Nature 2002, 418, 689–695. [Google Scholar] [CrossRef]
- Baskin, Y. Yellowstone Fires: A Decade Later: Ecological Lessons Learned in the Wake of the Conflagration. BioScience 1999, 49, 93–97. [Google Scholar] [CrossRef][Green Version]
- Gottfried, R.; Wear, D.; Lee, R. Institutional Solutions to Market Failure on the Landscape Scale. Ecol. Econ. 1996, 18, 133–140. [Google Scholar] [CrossRef]
- Springer, A.M.; Estes, J.A.; van Vliet, G.B.; Williams, T.M.; Doak, D.F.; Danner, E.M.; Forney, K.A.; Pfister, B. Sequential Megafaunal Collapse in the North Pacific Ocean: An Ongoing Legacy of Industrial Whaling? Proc. Natl. Acad. Sci. USA 2003, 100, 12223–12228. [Google Scholar] [CrossRef] [PubMed]
- Cash, D.W.; Moser, S.C. Linking Global and Local Scales: Designing Dynamic Assessment and Management Processes. Glob. Environ. Chang. 2000, 10, 109–120. [Google Scholar] [CrossRef]
- Graham, J.; Amos, B.; Plumptre, T. Governance Principles for Protected Areas in the 21st Century. In Proceedings of the Fifth World Parks Congress Durban, Durban, South Africa, 12–13 September 2003; Available online: https://www.files.ethz.ch/isn/122197/pa_governance2.pdf (accessed on 1 June 2021).
- Lockwood, M.; Davidson, J.; Curtis, A.; Stratford, E.; Griffith, R. Governance Principles for Natural Resource Management. Soc. Nat. Resour. 2010, 23, 986–1001. [Google Scholar] [CrossRef]
- Bennett, N.J.; Satterfield, T. Environmental Governance: A Practical Framework to Guide Design, Evaluation, and Analysis. Conserv. Lett. 2018, 11, e12600. [Google Scholar] [CrossRef]
- de Sadeleer, N. Principle of Subsidiarity and the EU Environmental Policy. J. Eur. Environ. Plan. Law 2012, 9, 63–70. [Google Scholar] [CrossRef]
- Jordan, A.; Jeppesen, T. EU Environmental Policy: Adapting to the Principle of Subsidiarity? Eur. Environ. 2000, 10, 64–74. [Google Scholar] [CrossRef]
- Sayre, N.F. Ecological and Geographical Scale: Parallels and Potential for Integration. Prog. Hum. Geogr. 2005, 29, 276–290. [Google Scholar] [CrossRef]
- Allen, T.F.H.; Hoekstra, T. Toward a Unified Ecology, 2nd ed.; Columbia University Press: New York, NY, USA, 2015. [Google Scholar]
- Gibson, C.C.; Ostrom, E.; Ahn, T.K. The Concept of Scale and the Human Dimensions of Global Change: A Survey. Ecol. Econ. 2000, 32, 217–239. [Google Scholar] [CrossRef]
- Buizer, M.; Arts, B.; Kok, K. Governance, Scale and the Environment: The Importance of Recognizing Knowledge Claims in Transdisciplinary Arenas. Ecol. Soc. 2011, 16. [Google Scholar] [CrossRef]
- Wiens, J.A. Spatial Scaling in Ecology. Funct. Ecol. 1989, 3, 385–397. [Google Scholar] [CrossRef]
- Mayer, A.L.; Cameron, G.N. Consideration of Grain and Extent in Landscape Studies of Terrestrial Vertebrate Ecology. Landsc. Urban Plan. 2003, 65, 201–217. [Google Scholar] [CrossRef]
- Hooghe, L.; Marks, G. Multi-Level Governance and European Integration; Governance in Europe, Rowman & Littlefield Publishers: Lanham, MD, USA, 2001. [Google Scholar]
- Feitelson, E.; Fischhendler, I. Spaces of Water Governance: The Case of Israel and Its Neighbors. Ann. Assoc. Am. Geogr. 2009, 99, 728–745. [Google Scholar] [CrossRef]
- Collins, W.W.; Qualset, C.O. (Eds.) Biodiversity in Agroecosystems; Advances in Agroecology; CRC Press: Boca Raton, FL, USA, 1999. [Google Scholar]
- Altieri, M.A. The Ecological Role of Biodiversity in Agroecosystems. Agric. Ecosyst. Environ. 1999, 74, 19–31. [Google Scholar] [CrossRef]
- Lohbeck, M.; Winowiecki, L.; Aynekulu, E.; Okia, C.; Vågen, T.G. Trait-Based Approaches for Guiding the Restoration of Degraded Agricultural Landscapes in East Africa. J. Appl. Ecol. 2018, 55, 59–68. [Google Scholar] [CrossRef]
- Sinclair, A.R.E.; Fryxell, J.M.; Caughley, G.; Caughley, G. Wildlife Ecology, Conservation, and Management, 2nd ed.; Blackwell Pub: Malden, MA, USA; Oxford, UK, 2006. [Google Scholar]
- Gamfeldt, L.; Hillebrand, H.; Jonsson, P.R. Multiple Functions Increase the Importance of Biodiversity for Overall Ecosystem Functioning. Ecology 2008, 89, 1223–1231. [Google Scholar] [CrossRef]
- Brussaard, L. Biodiversity and Ecosystem Functioning in Soil. Ambio 1997, 26, 563–570. [Google Scholar]
- Vitousek, P.M.; Hooper, D.U. Biological Diversity and Terrestrial Ecosystem Biogeochemistry. In Biodiversity and Ecosystem Function; Schulze, E.D., Mooney, H.A., Eds.; Springer: Berlin/Heidelberg, Germany, 1994; pp. 3–14. [Google Scholar] [CrossRef]
- Swift, M.J.; Izac, A.M.N.; van Noordwijk, M. Biodiversity and Ecosystem Services in Agricultural Landscapes—Are We Asking the Right Questions? Agric. Ecosyst. Environ. 2004, 104, 113–134. [Google Scholar] [CrossRef]
- Schulze, E.D.; Chapin, F.S. Plant Specialization to Environments of Different Resource Availability. In Potentials and Limitations of Ecosystem Analysis; Schulze, E.D., Zwölfer, H., Eds.; Springer: Berlin/Heidelberg, Germany, 1987; pp. 120–148. [Google Scholar] [CrossRef]
- de Bello, F.; Lavorel, S.; Díaz, S.; Harrington, R.; Cornelissen, J.H.C.; Bardgett, R.D.; Berg, M.P.; Cipriotti, P.; Feld, C.K.; Hering, D.; et al. Towards an Assessment of Multiple Ecosystem Processes and Services via Functional Traits. Biodivers. Conserv. 2010, 19, 2873–2893. [Google Scholar] [CrossRef]
- Garnier, E.; Navas, M.L. A Trait-Based Approach to Comparative Functional Plant Ecology: Concepts, Methods and Applications for Agroecology. A Review. Agron. Sustain. Dev. 2012, 32, 365–399. [Google Scholar] [CrossRef]
- Martin, A.R.; Isaac, M.E. Functional Traits in Agroecology: Advancing Description and Prediction in Agroecosystems. J. Appl. Ecol. 2018, 55, 5–11. [Google Scholar] [CrossRef]
- Kremen, C.; Williams, N.M.; Aizen, M.A.; Gemmill-Herren, B.; LeBuhn, G.; Minckley, R.; Packer, L.; Potts, S.G.; Roulston, T.; Steffan-Dewenter, I.; et al. Pollination and Other Ecosystem Services Produced by Mobile Organisms: A Conceptual Framework for the Effects of Land-Use Change. Ecol. Lett. 2007, 10, 299–314. [Google Scholar] [CrossRef] [PubMed]
- Prager, K.; Reed, M.; Scott, A. Encouraging Collaboration for the Provision of Ecosystem Services at a Landscape Scale—Rethinking Agri-Environmental Payments. Land Use Policy 2012, 29, 244–249. [Google Scholar] [CrossRef]
- Goldman, R.L.; Thompson, B.H.; Daily, G.C. Institutional Incentives for Managing the Landscape: Inducing Cooperation for the Production of Ecosystem Services. Ecol. Econ. 2007, 64, 333–343. [Google Scholar] [CrossRef]
- European Landscape Convention, Council of Europe. 2000. Available online: https://www.coe.int/en/web/conventions/full-list/-/conventions/treaty/176?module=treaty-detail&treatynum=176 (accessed on 1 August 2021).
- Martin, E.A.; Dainese, M.; Clough, Y.; Báldi, A.; Bommarco, R.; Gagic, V.; Garratt, M.P.D.; Holzschuh, A.; Kleijn, D.; Kovács-Hostyánszki, A.; et al. The Interplay of Landscape Composition and Configuration: New Pathways to Manage Functional Biodiversity and Agroecosystem Services across Europe. Ecol. Lett. 2019, 22, 1083–1094. [Google Scholar] [CrossRef]
- Burel, F.; Baudry, J.; Butet, A.; Clergeau, P.; Delettre, Y.; Le Coeur, D.; Dubs, F.; Morvan, N.; Paillat, G.; Petit, S.; et al. Comparative Biodiversity along a Gradient of Agricultural Landscapes. Acta Oecologica 1998, 19, 47–60. [Google Scholar] [CrossRef]
- McKenzie, A.J.; Emery, S.B.; Franks, J.R.; Whittingham, M.J. Landscape-Scale Conservation: Collaborative Agri-Environment Schemes Could Benefit Both Biodiversity and Ecosystem Services, but Will Farmers Be Willing to Participate? J. Appl. Ecol. 2013, 50, 1274–1280. [Google Scholar] [CrossRef]
- Macfarlane, R. Building Blocks or Stumbling Blocks? Landscape Ecology and Farm-Level Participation in Agri-Environmental Policy. Landsc. Res. 2000, 25, 321–331. [Google Scholar] [CrossRef]
- Altieri, M. Agroecology: The Science of Sustainable Agriculture; CLC Press: Boca Raton, FL, USA, 2018; p. 433. [Google Scholar] [CrossRef]
- Weibull, A.C.; Bengtsson, J.; Nohlgren, E. Diversity of Butterflies in the Agricultural Landscape: The Role of Farming System and Landscape Heterogeneity. Ecography 2000, 23, 743–750. [Google Scholar] [CrossRef]
- Zingg, S.; Grenz, J.; Humbert, J.Y. Landscape-Scale Effects of Land Use Intensity on Birds and Butterflies. Agric. Ecosyst. Environ. 2018, 267, 119–128. [Google Scholar] [CrossRef]
- Jonsen, I.D.; Fahrig, L. Response of Generalist and Specialist Insect Herbivores to Landscape Spatial Structure. Landsc. Ecol. 1997, 12, 185–197. [Google Scholar] [CrossRef]
- Holland, J.; Fahrig, L. Effect of Woody Borders on Insect Density and Diversity in Crop Fields: A Landscape-Scale Analysis. Agric. Ecosyst. Environ. 2000, 78, 115–122. [Google Scholar] [CrossRef]
- van Zanten, B.T.; Verburg, P.H.; Espinosa, M.; Gomez-y-Paloma, S.; Galimberti, G.; Kantelhardt, J.; Kapfer, M.; Lefebvre, M.; Manrique, R.; Piorr, A.; et al. European Agricultural Landscapes, Common Agricultural Policy and Ecosystem Services: A Review. Agron. Sustain. Dev. 2014, 34, 309–325. [Google Scholar] [CrossRef]
- Willemen, L.; Verburg, P.H.; Hein, L.; van Mensvoort, M.E.F. Spatial Characterization of Landscape Functions. Landsc. Urban Plan. 2008, 88, 34–43. [Google Scholar] [CrossRef]
- Iverson Nassauer, J. Culture and Changing Landscape Structure. Landsc. Ecol. 1995, 10, 229–237. [Google Scholar] [CrossRef]
- Potts, S.; Biesmeijer, K.; Bommarco, R.; Breeze, T.; Carvalheiro, L.; Franzén, M.; González-Varo, J.P.; Holzschuh, A.; Kleijn, D.; Klein, A.M.; et al. Status and Trends of European Pollinators: Key Findings of the STEP Project; Pensoft Publishers: Sofia, Bulgaria, 2015; p. 72. [Google Scholar]
- Goulson, D.; Hughes, W.; Derwent, L.; Stout, J. Colony Growth of the Bumblebee, Bombus Terrestris, in Improved and Conventional Agricultural and Suburban Habitats. Oecologia 2002, 130, 267–273. [Google Scholar] [CrossRef] [PubMed]
- Williams, N.M.; Kremen, C. Resource Distributions Among Habitats Determine Solitary Bee Offspring Production in a Mosaic Landscape. Ecol. Appl. 2007, 17, 910–921. [Google Scholar] [CrossRef] [PubMed]
- van Lenteren, J.C.; Bolckmans, K.; Köhl, J.; Ravensberg, W.J.; Urbaneja, A. Biological Control Using Invertebrates and Microorganisms: Plenty of New Opportunities. BioControl 2018, 63, 39–59. [Google Scholar] [CrossRef]
- Geiger, F.; Bengtsson, J.; Berendse, F.; Weisser, W.W.; Emmerson, M.; Morales, M.B.; Ceryngier, P.; Liira, J.; Tscharntke, T.; Winqvist, C.; et al. Persistent Negative Effects of Pesticides on Biodiversity and Biological Control Potential on European Farmland. Basic Appl. Ecol. 2010, 11, 97–105. [Google Scholar] [CrossRef]
- DeBach, P.; Paul DeBach, D.; David Rosen, E.; Rosen, D. Biological Control by Natural Enemies; Cambridge University Press: Cambridge, UK, 1991. [Google Scholar]
- Bianchi, F.; Booij, C.; Tscharntke, T. Sustainable Pest Regulation in Agricultural Landscapes: A Review on Landscape Composition, Biodiversity and Natural Pest Control. Proc. R. Soc. B Biol. Sci. 2006, 273, 1715–1727. [Google Scholar] [CrossRef]
- Thies, C.; Tscharntke, T. Landscape Structure and Biological Control in Agroecosystems. Science 1999, 285, 893–895. [Google Scholar] [CrossRef] [PubMed]
- Thies, C.; Roschewitz, I.; Tscharntke, T. The Landscape Context of Cereal Aphid–Parasitoid Interactions. Proc. R. Soc. B Biol. Sci. 2005, 272, 203–210. [Google Scholar] [CrossRef] [PubMed]
- Lavelle, P.; Decaëns, T.; Aubert, M.; Barot, S.; Blouin, M.; Bureau, F.; Margerie, P.; Mora, P.; Rossi, J.P. Soil Invertebrates and Ecosystem Services. Eur. J. Soil Biol. 2006, 42, S3–S15. [Google Scholar] [CrossRef]
- Tscharntke, T.; Tylianakis, J.M.; Rand, T.A.; Didham, R.K.; Fahrig, L.; Batáry, P.; Bengtsson, J.; Clough, Y.; Crist, T.O.; Dormann, C.F.; et al. Landscape Moderation of Biodiversity Patterns and Processes—Eight Hypotheses. Biol. Rev. 2012, 87, 661–685. [Google Scholar] [CrossRef] [PubMed]
- Butler, S.J.; Vickery, J.A.; Norris, K. Farmland Biodiversity and the Footprint of Agriculture. Science 2007, 315, 381–384. [Google Scholar] [CrossRef] [PubMed]
- Biodiversity: Farmland Bird Populations and Agricultural Land Cover. In OECD Compendium of Agri-Environmental Indicators; OECD Publishing: Paris, France, 2013; pp. 157–169. [CrossRef]
- Whittingham, M.J. Will Agri-Environment Schemes Deliver Substantial Biodiversity Gain, and If Not Why Not? J. Appl. Ecol. 2007, 44, 1–5. [Google Scholar] [CrossRef]
- Marja, R.; Herzon, I.; Viik, E.; Elts, J.; Mänd, M.; Tscharntke, T.; Batáry, P. Environmentally Friendly Management as an Intermediate Strategy between Organic and Conventional Agriculture to Support Biodiversity. Biol. Conserv. 2014, 178, 146–154. [Google Scholar] [CrossRef]
- Davey, C.M.; Vickery, J.A.; Boatman, N.D.; Chamberlain, D.E.; Parry, H.R.; Siriwardena, G.M. Assessing the Impact of Entry Level Stewardship on Lowland Farmland Birds in England. Ibis 2010, 152, 459–474. [Google Scholar] [CrossRef]
- Young, J.C.; Jordan, A.; Searle, K.R.; Butler, A.; Simmons, P.; Watt, A.D. Framing Scale in Participatory Biodiversity Management May Contribute to More Sustainable Solutions. Conserv. Lett. 2013, 6, 333–340. [Google Scholar] [CrossRef]
- Vanni, F. The Role of Collective Action. In Agriculture and Public Goods: The Role of Collective Action; Vanni, F., Ed.; Springer: Dordrecht, The Netherlands, 2014; pp. 21–37. [Google Scholar] [CrossRef]
- Prager, K. Agri-Environmental Collaboratives for Landscape Management in Europe. Curr. Opin. Environ. Sustain. 2015, 12, 59–66. [Google Scholar] [CrossRef]
- Liu, Z.; Xu, J.; Yang, X.; Tu, Q.; Hanley, N.; Kontoleon, A. Performance of Agglomeration Bonuses in Conservation Auctions: Lessons from a Framed Field Experiment. Environ. Resour. Econ. 2019, 73, 843–869. [Google Scholar] [CrossRef]
- OECD. Providing Agri-Environmental Public Goods through Collective Action; OECD Publishing: Paris, France, 2013. [Google Scholar]
- Terwan, P.; Deelen, J.G.; Mulders, A.; Peeters, E. The Cooperative Approach under the New Dutch Agri-Environment- Climate Scheme; Technical Report; Ministry of Economic Affairs: The Hague, The Netherlands, 2016. [Google Scholar]
- Kleijn, D.; Sutherland, W.J. How Effective Are European Agri-Environment Schemes in Conserving and Promoting Biodiversity? J. Appl. Ecol. 2003, 40, 947–969. [Google Scholar] [CrossRef]
- Merckx, T.; Feber, R.E.; Riordan, P.; Townsend, M.C.; Bourn, N.A.; Parsons, M.S.; Macdonald, D.W. Optimizing the Biodiversity Gain from Agri-Environment Schemes. Agric. Ecosyst. Environ. 2009, 130, 177–182. [Google Scholar] [CrossRef]
- Siriwardena, G.M. The Importance of Spatial and Temporal Scale for Agri-Environment Scheme Delivery: Spatial and Temporal Scale of AES Delivery. Ibis 2010, 152, 515–529. [Google Scholar] [CrossRef]
- Leventon, J.; Schaal, T.; Velten, S.; Dänhardt, J.; Fischer, J.; Abson, D.J.; Newig, J. Collaboration or Fragmentation? Biodiversity Management through the Common Agricultural Policy. Land Use Policy 2017, 64, 1–12. [Google Scholar] [CrossRef]
- Pe’er, G.; Zinngrebe, Y.; Hauck, J.; Schindler, S.; Dittrich, A.; Zingg, S.; Tscharntke, T.; Oppermann, R.; Sutcliffe, L.M.E.; Hoyer, C.; et al. Adding Some Green to the Greening: Improving the EU’s Ecological Focus Areas for Biodiversity and Farmers. Conserv. Lett. 2017, 10, 517–530. [Google Scholar] [CrossRef]
- Früh-Müller, A.; Bach, M.; Breuer, L.; Hotes, S.; Koellner, T.; Krippes, C.; Wolters, V. The Use of Agri-Environmental Measures to Address Environmental Pressures in Germany: Spatial Mismatches and Options for Improvement. Land Use Policy 2019, 84, 347–362. [Google Scholar] [CrossRef]
- European Court of Auditors. Is Agri-Environment Support Well Designed and Managed? Technical Report; Publications Office: Luxembourg, 2011. [Google Scholar]
- Pardo, A.; Rolo, V.; Concepción, E.D.; Díaz, M.; Kazakova, Y.; Stefanova, V.; Marsden, K.; Brandt, K.; Jay, M.; Piskol, S.; et al. To What Extent Does the European Common Agricultural Policy Affect Key Landscape Determinants of Biodiversity? Environ. Sci. Policy 2020, 114, 595–605. [Google Scholar] [CrossRef]
- Nilsson, L.; Clough, Y.; Smith, H.G.; Alkan Olsson, J.; Brady, M.V.; Hristov, J.; Olsson, P.; Skantze, K.; Ståhlberg, D.; Dänhardt, J. A Suboptimal Array of Options Erodes the Value of CAP Ecological Focus Areas. Land Use Policy 2019, 85, 407–418. [Google Scholar] [CrossRef]
- European Commission The Future of Food and Farming—COM(2017) 713. 2017. Available online: https://eur-lex.europa.eu/legal-content/EN/TXT/?uri=CELEX%3A52017DC0713 (accessed on 1 June 2021).
- Franks, J.R. An Assessment of the Landscape-Scale Dimensions of Land Based Environmental Management Schemes Offered to Farmers in England. Land Use Policy 2019, 83, 147–159. [Google Scholar] [CrossRef]
- Paracchini, M.L.; Petersen, J.E.; Hoogeveen, Y.; European Environment Agency; European Commission; Joint Research Centre; Institute for Environment and Sustainability. High Nature Value Farmland in Europe an Estimate of the Distribution Patterns on the Basis of Land Cover and Biodiversity Data; Publications Office: Luxembourg, 2008. [Google Scholar]
- Lomba, A.; Alves, P.; Jongman, R.H.G.; McCracken, D.I. Reconciling Nature Conservation and Traditional Farming Practices: A Spatially Explicit Framework to Assess the Extent of High Nature Value Farmlands in the European Countryside. Ecol. Evol. 2015, 5, 1031–1044. [Google Scholar] [CrossRef] [PubMed]
- Kleijn, D.; Kohler, F.; Báldi, A.; Batáry, P.; Concepción, E.; Clough, Y.; Díaz, M.; Gabriel, D.; Holzschuh, A.; Knop, E.; et al. On the Relationship between Farmland Biodiversity and Land-Use Intensity in Europe. Proc. R. Soc. B Biol. Sci. 2009, 276, 903–909. [Google Scholar] [CrossRef] [PubMed]
- Franks, J.R.; Mc Gloin, A. Environmental Co-Operatives as Instruments for Delivering across-Farm Environmental and Rural Policy Objectives: Lessons for the UK. J. Rural. Stud. 2007, 23, 472–489. [Google Scholar] [CrossRef]
- Dänhardt, J.; Nilsson, L.; Hristov, J.; Olsson, J.A.; Brady, M.; Olsson, P.; Smith, H.G.; Clough, Y. Collective Implementation of Ecological Focus Areas; Technical Report 6816; The Swedish Environmental Protection Agency: Stockholm, Sweden, 2018. [Google Scholar]
- Andam, K.S.; Ferraro, P.J.; Pfaff, A.; Sanchez-Azofeifa, G.A.; Robalino, J.A. Measuring the Effectiveness of Protected Area Networks in Reducing Deforestation. Proc. Natl. Acad. Sci. USA 2008, 105, 16089–16094. [Google Scholar] [CrossRef] [PubMed]
- Blankespoor, B.; Dasgupta, S.; Wheeler, D. Protected Areas and Deforestation: New Results from High Resolution Panel Data; SSRN Scholarly Paper ID 2519851; Social Science Research Network: Rochester, NY, USA, 2014. [Google Scholar]
- Geldmann, J.; Manica, A.; Burgess, N.D.; Coad, L.; Balmford, A. A Global-Level Assessment of the Effectiveness of Protected Areas at Resisting Anthropogenic Pressures. Proc. Natl. Acad. Sci. USA 2019, 116, 23209–23215. [Google Scholar] [CrossRef] [PubMed]
Publisher’s Note: MDPI stays neutral with regard to jurisdictional claims in published maps and institutional affiliations. |
© 2021 by the authors. Licensee MDPI, Basel, Switzerland. This article is an open access article distributed under the terms and conditions of the Creative Commons Attribution (CC BY) license (https://creativecommons.org/licenses/by/4.0/).