
Forest Transition and Its Dynamics in Subtropical Chongqing, China since 1990s


Abstract
:1. Introduction
2. Research Method
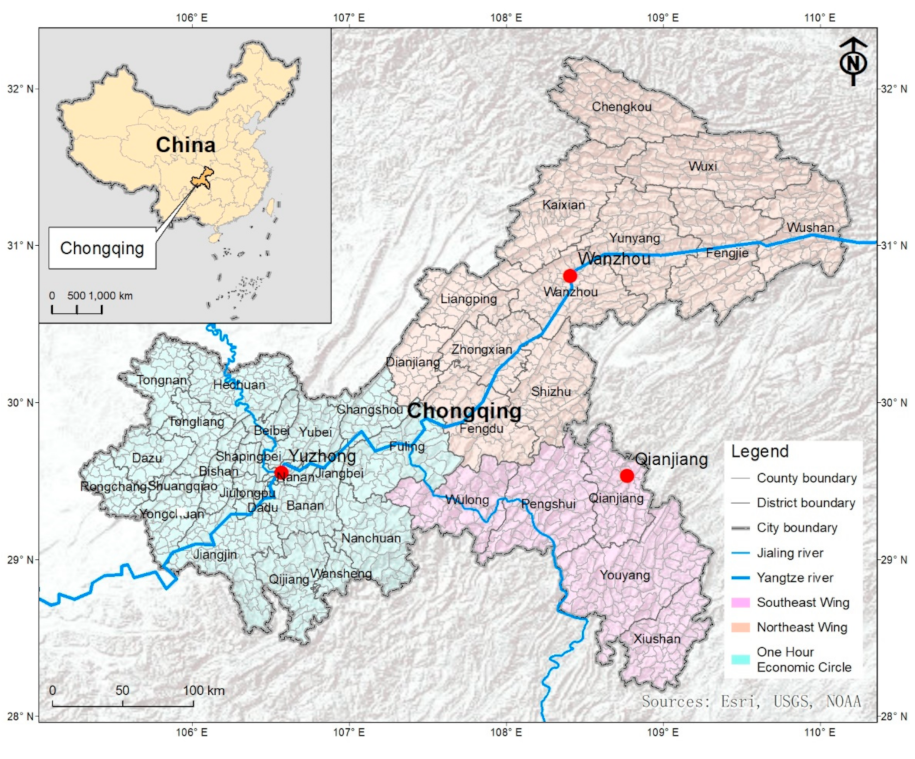
2.1. Site for Study
2.2. Data Analysis
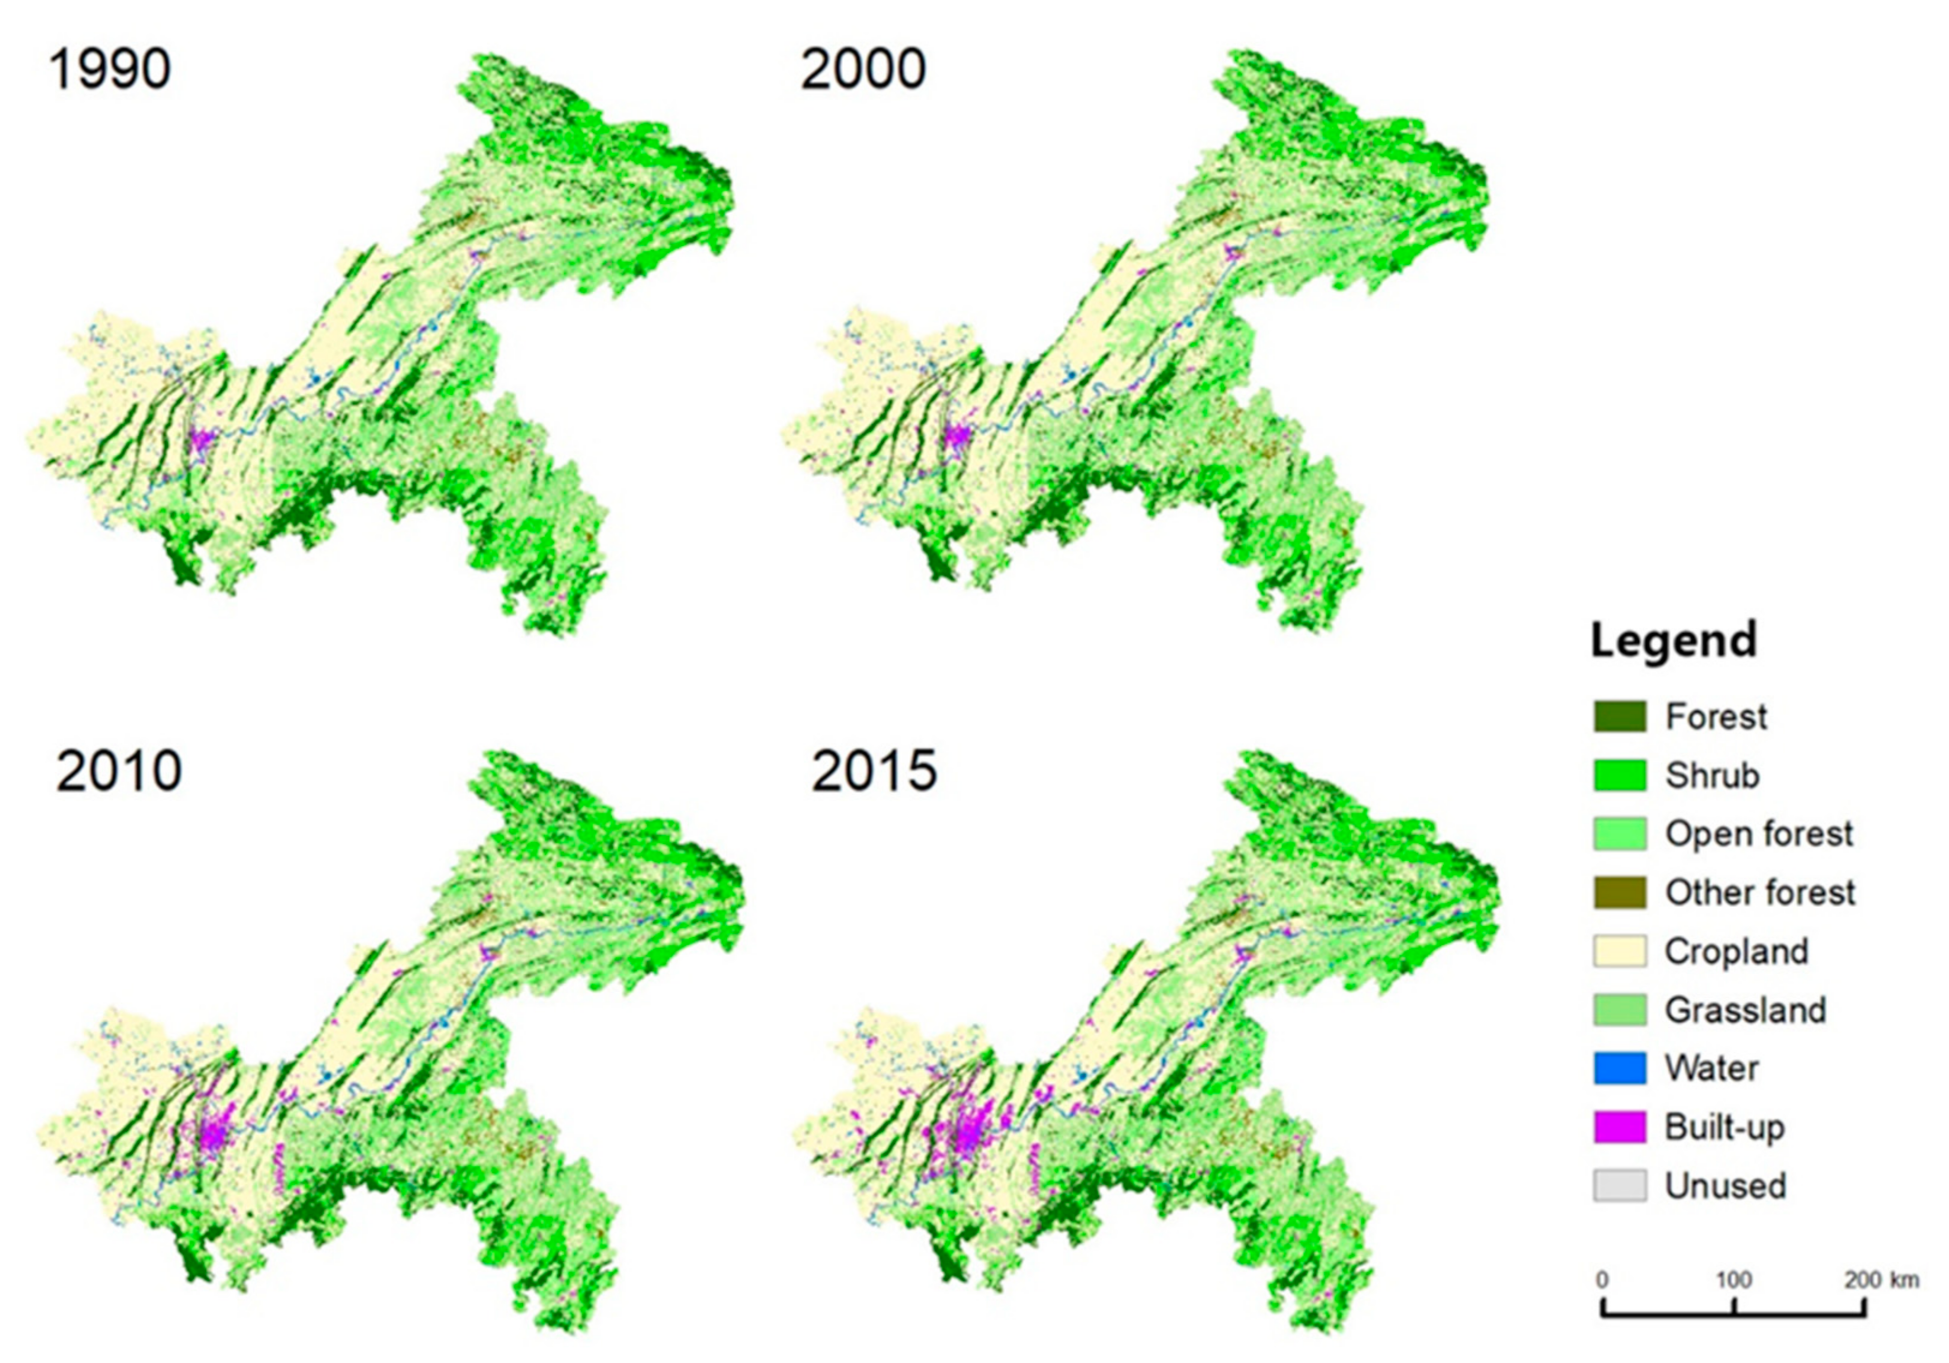
2.2.1. Forest Land Data
2.2.2. Characterizing Forest Transition
2.2.3. Analyzing Forest Transition Dynamics
3. Results and Discussions
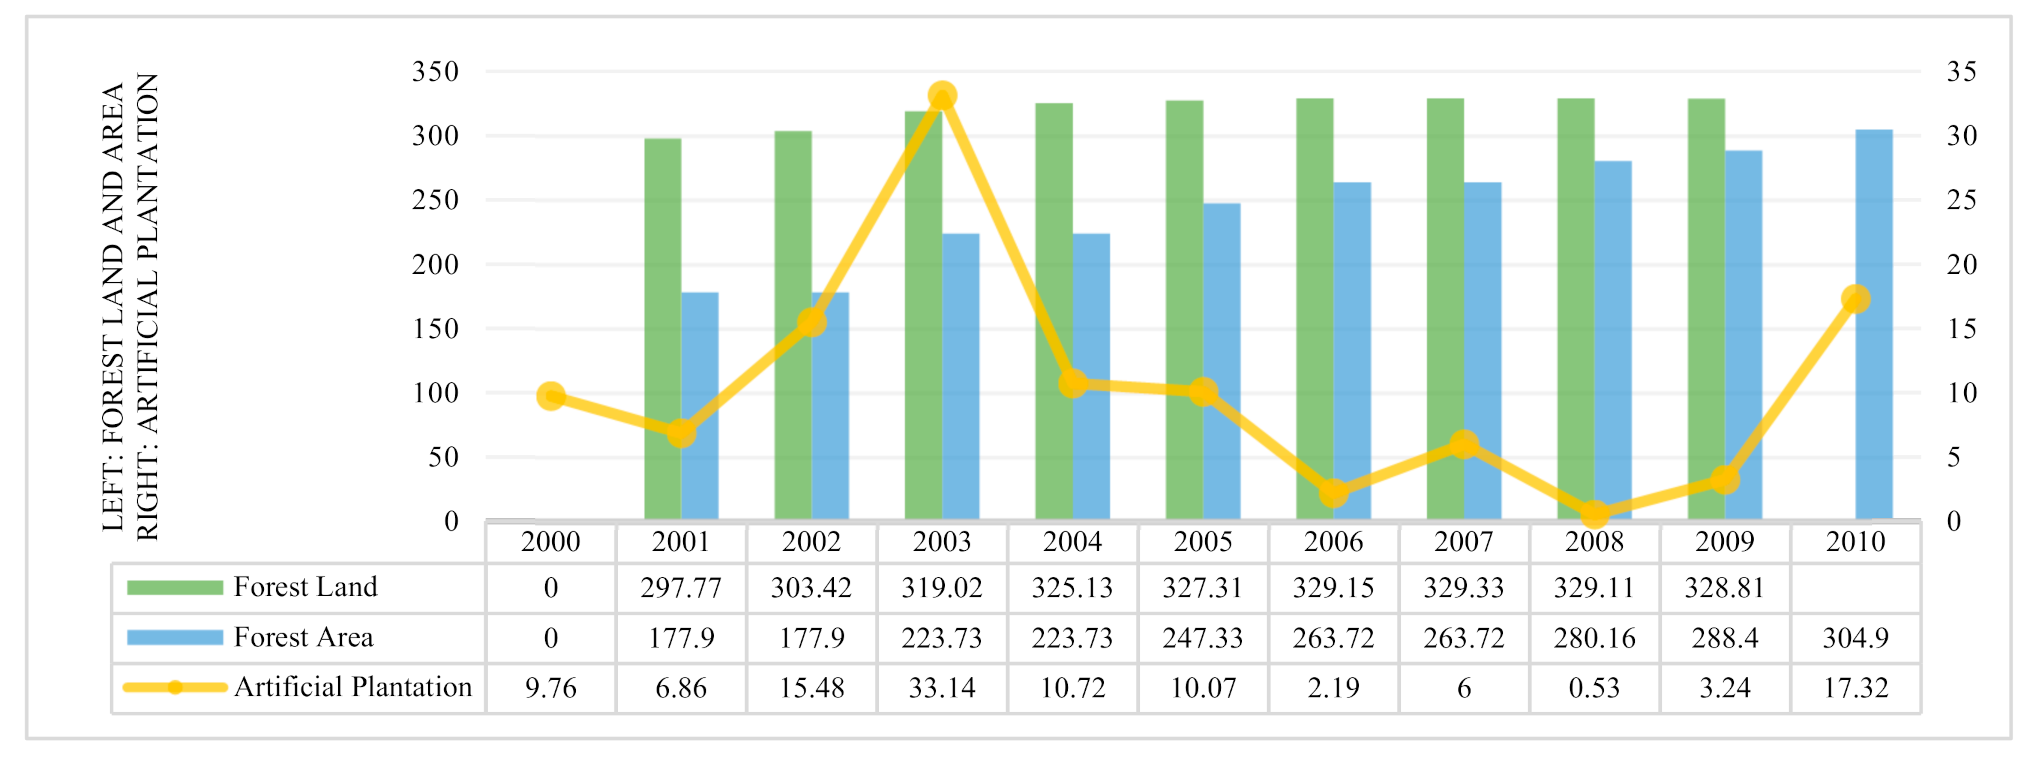
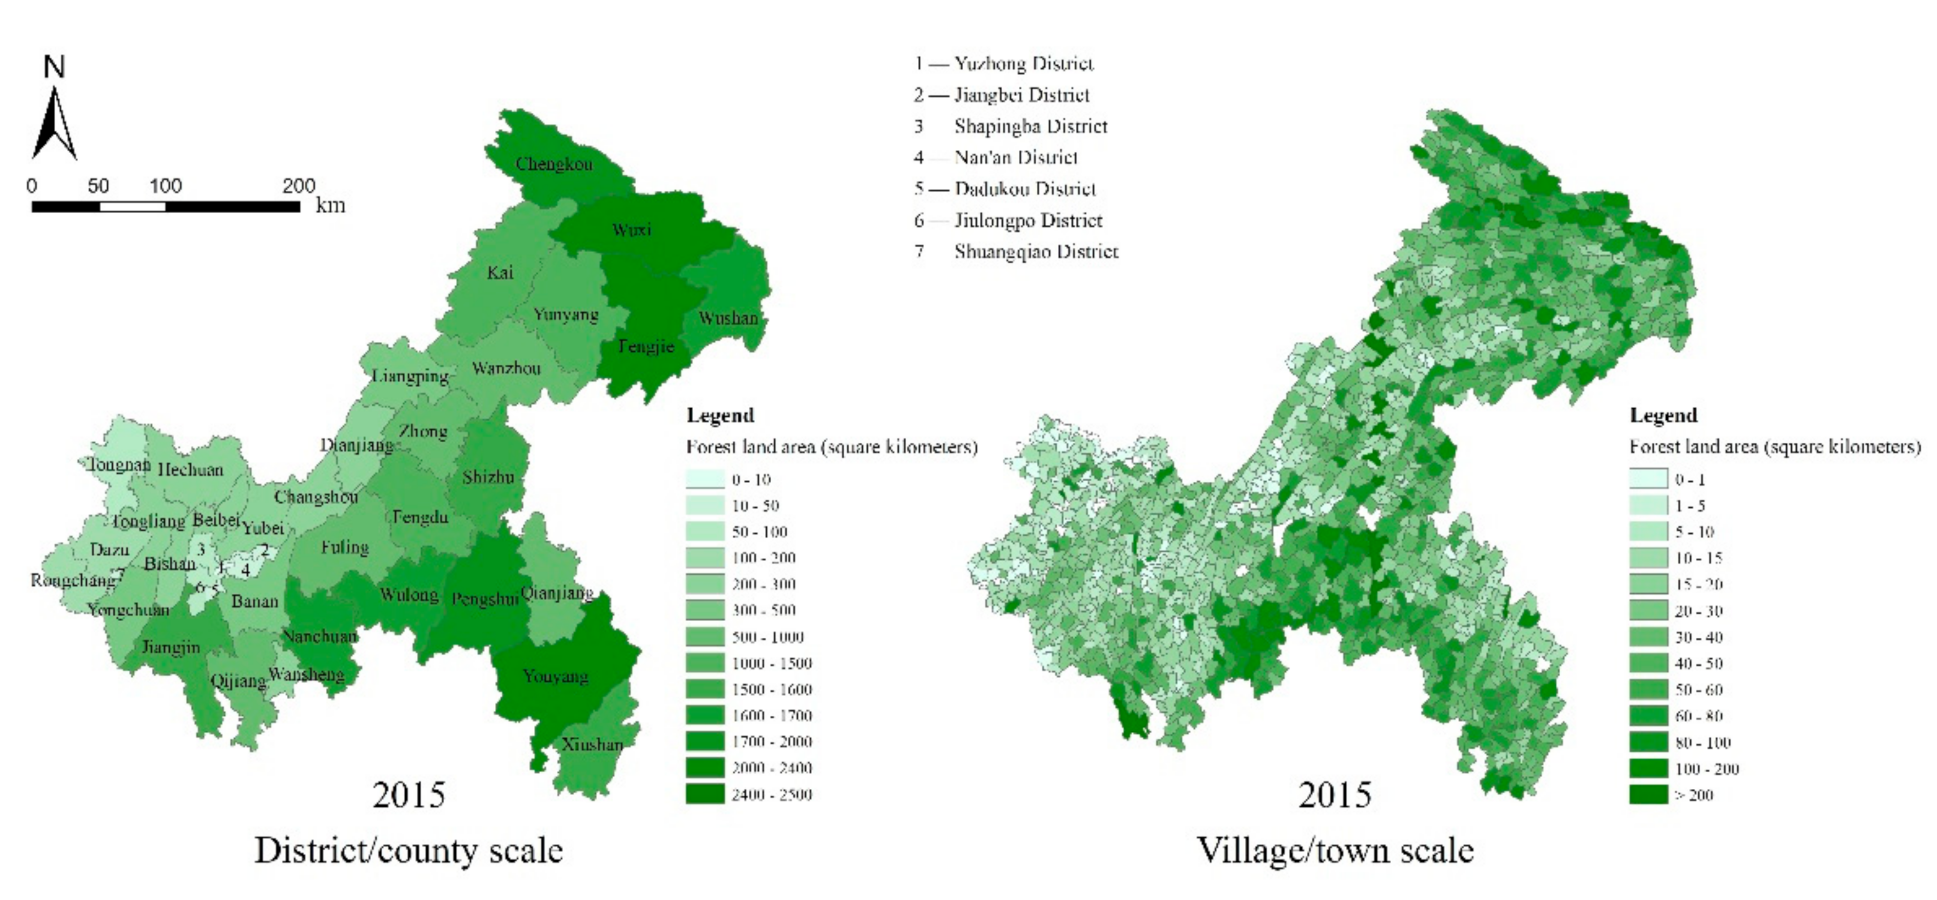
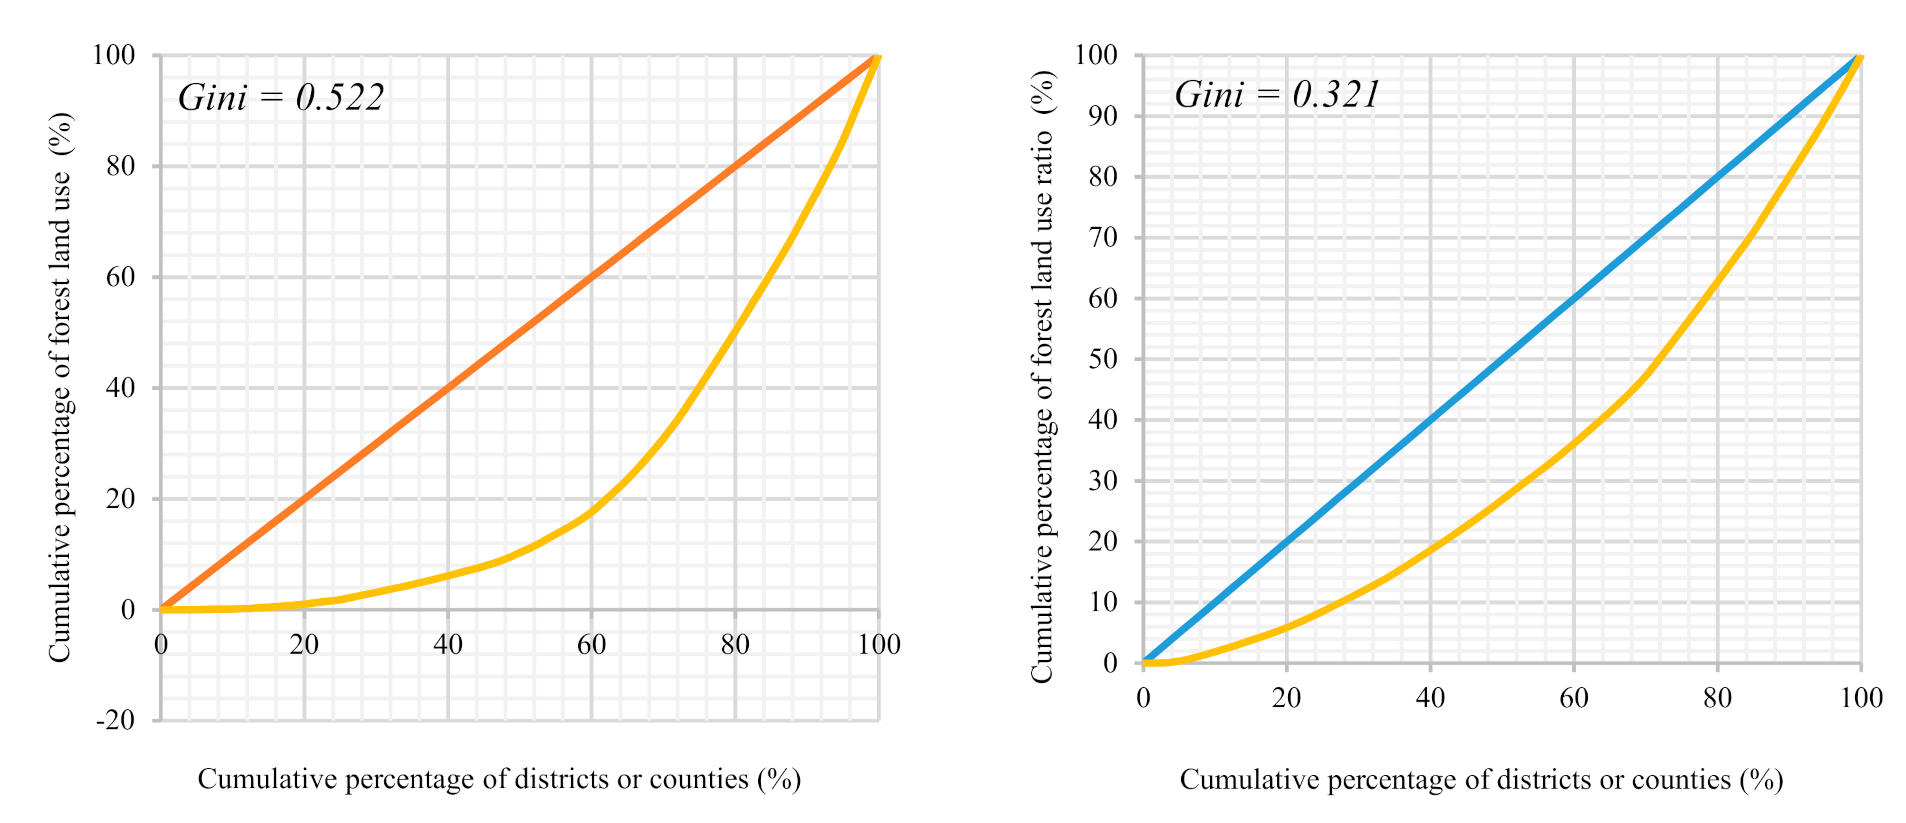
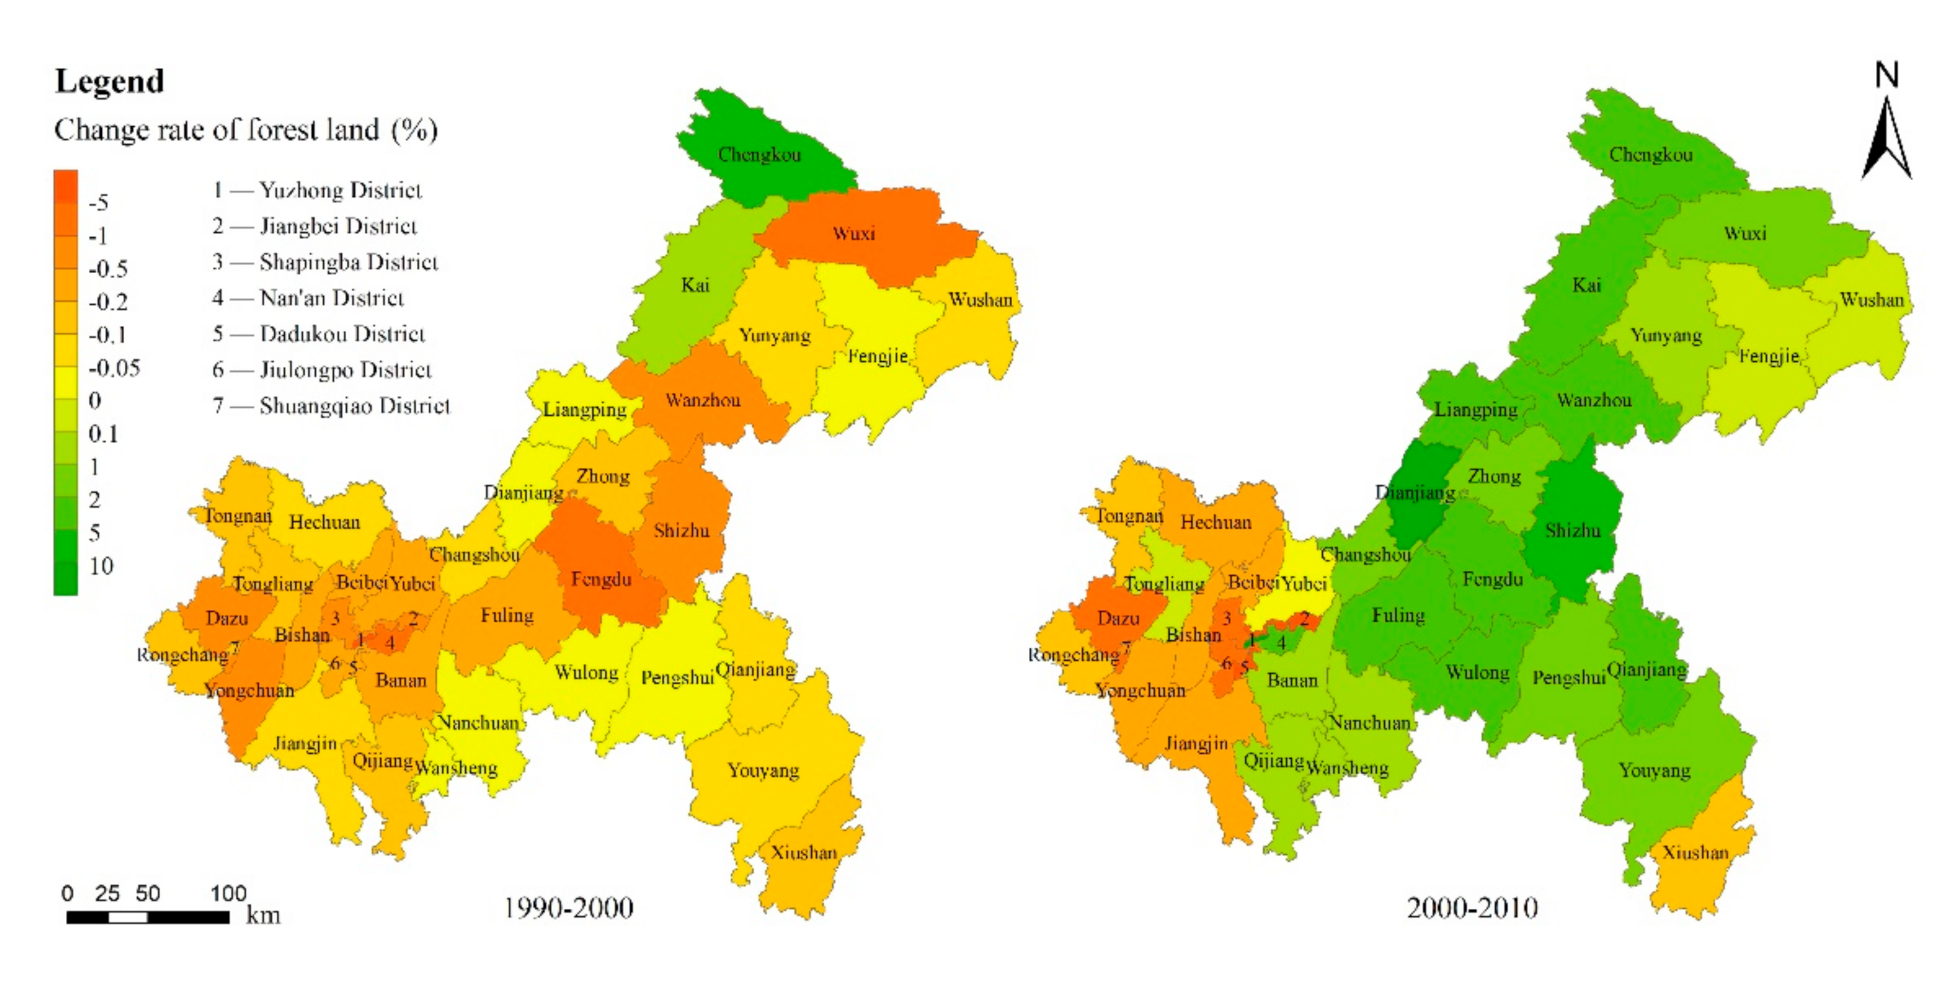
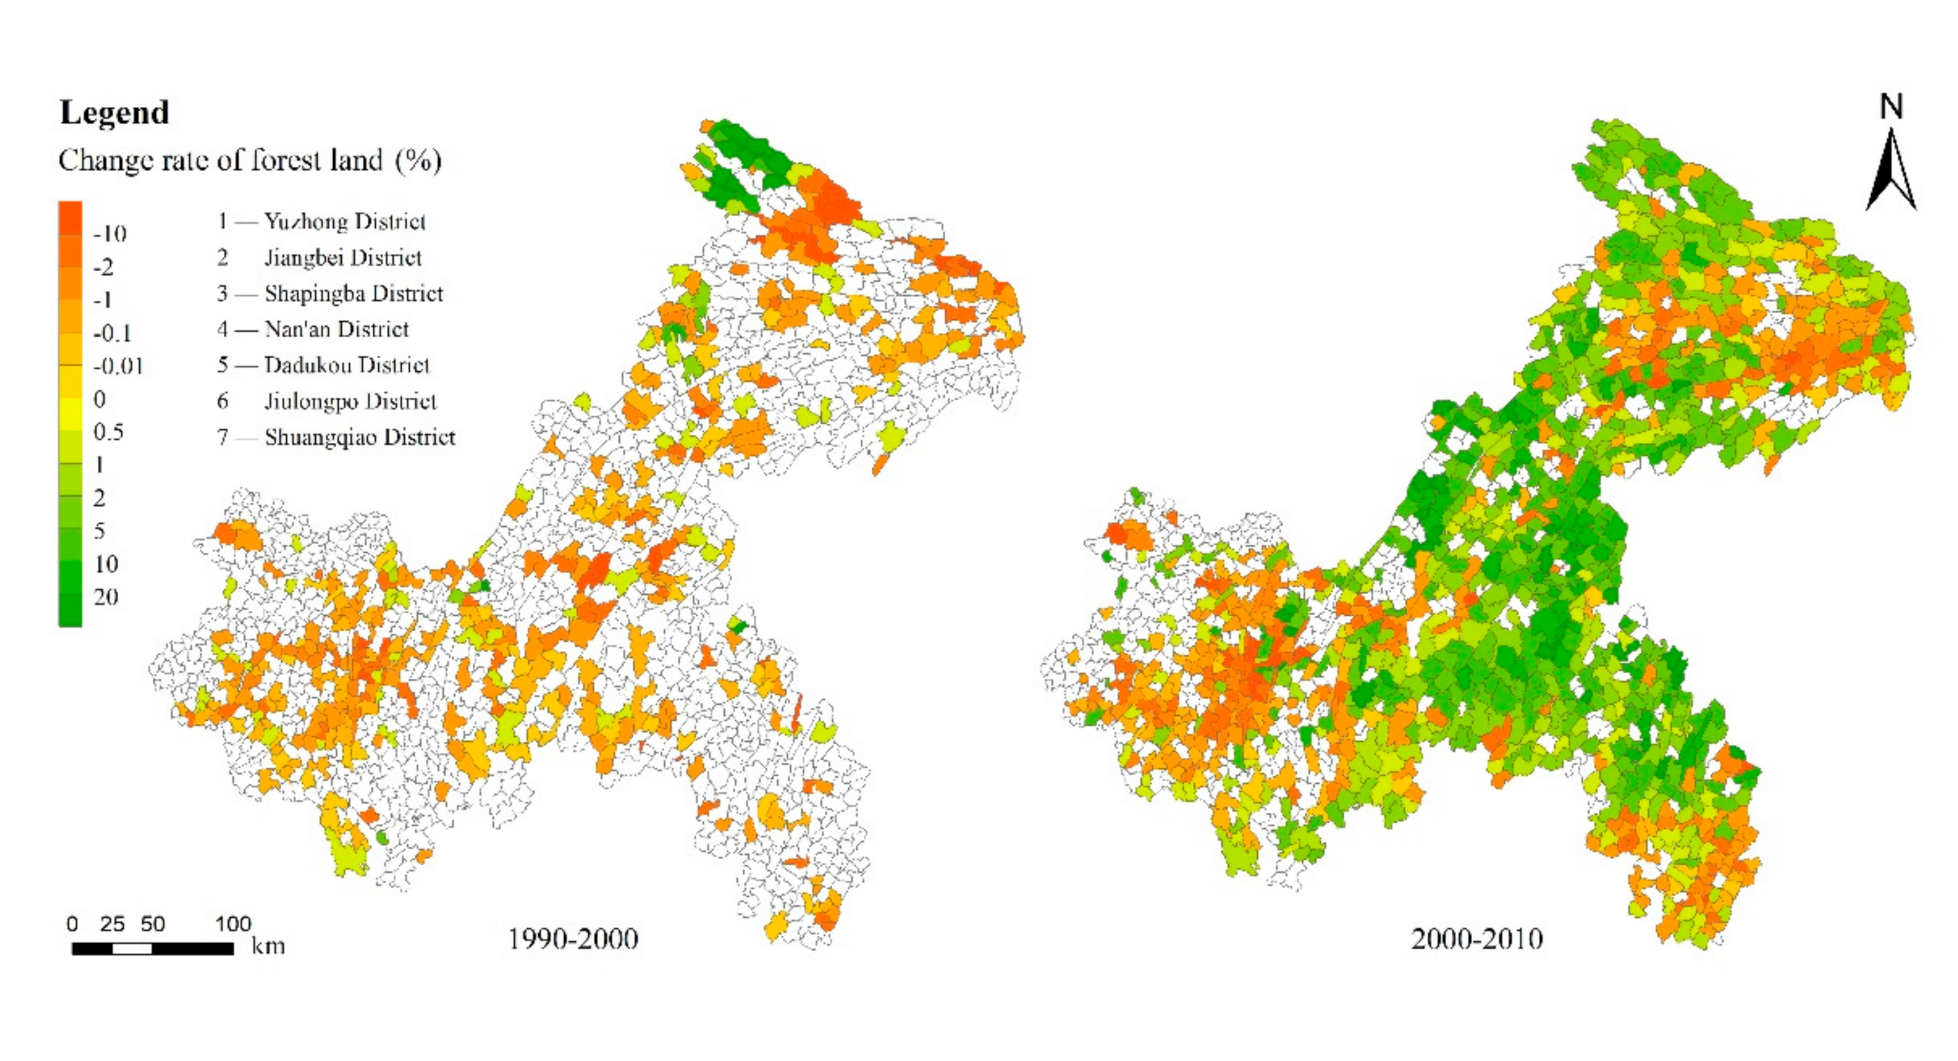
3.1. Characteristics of Forest Transition in Chongqing
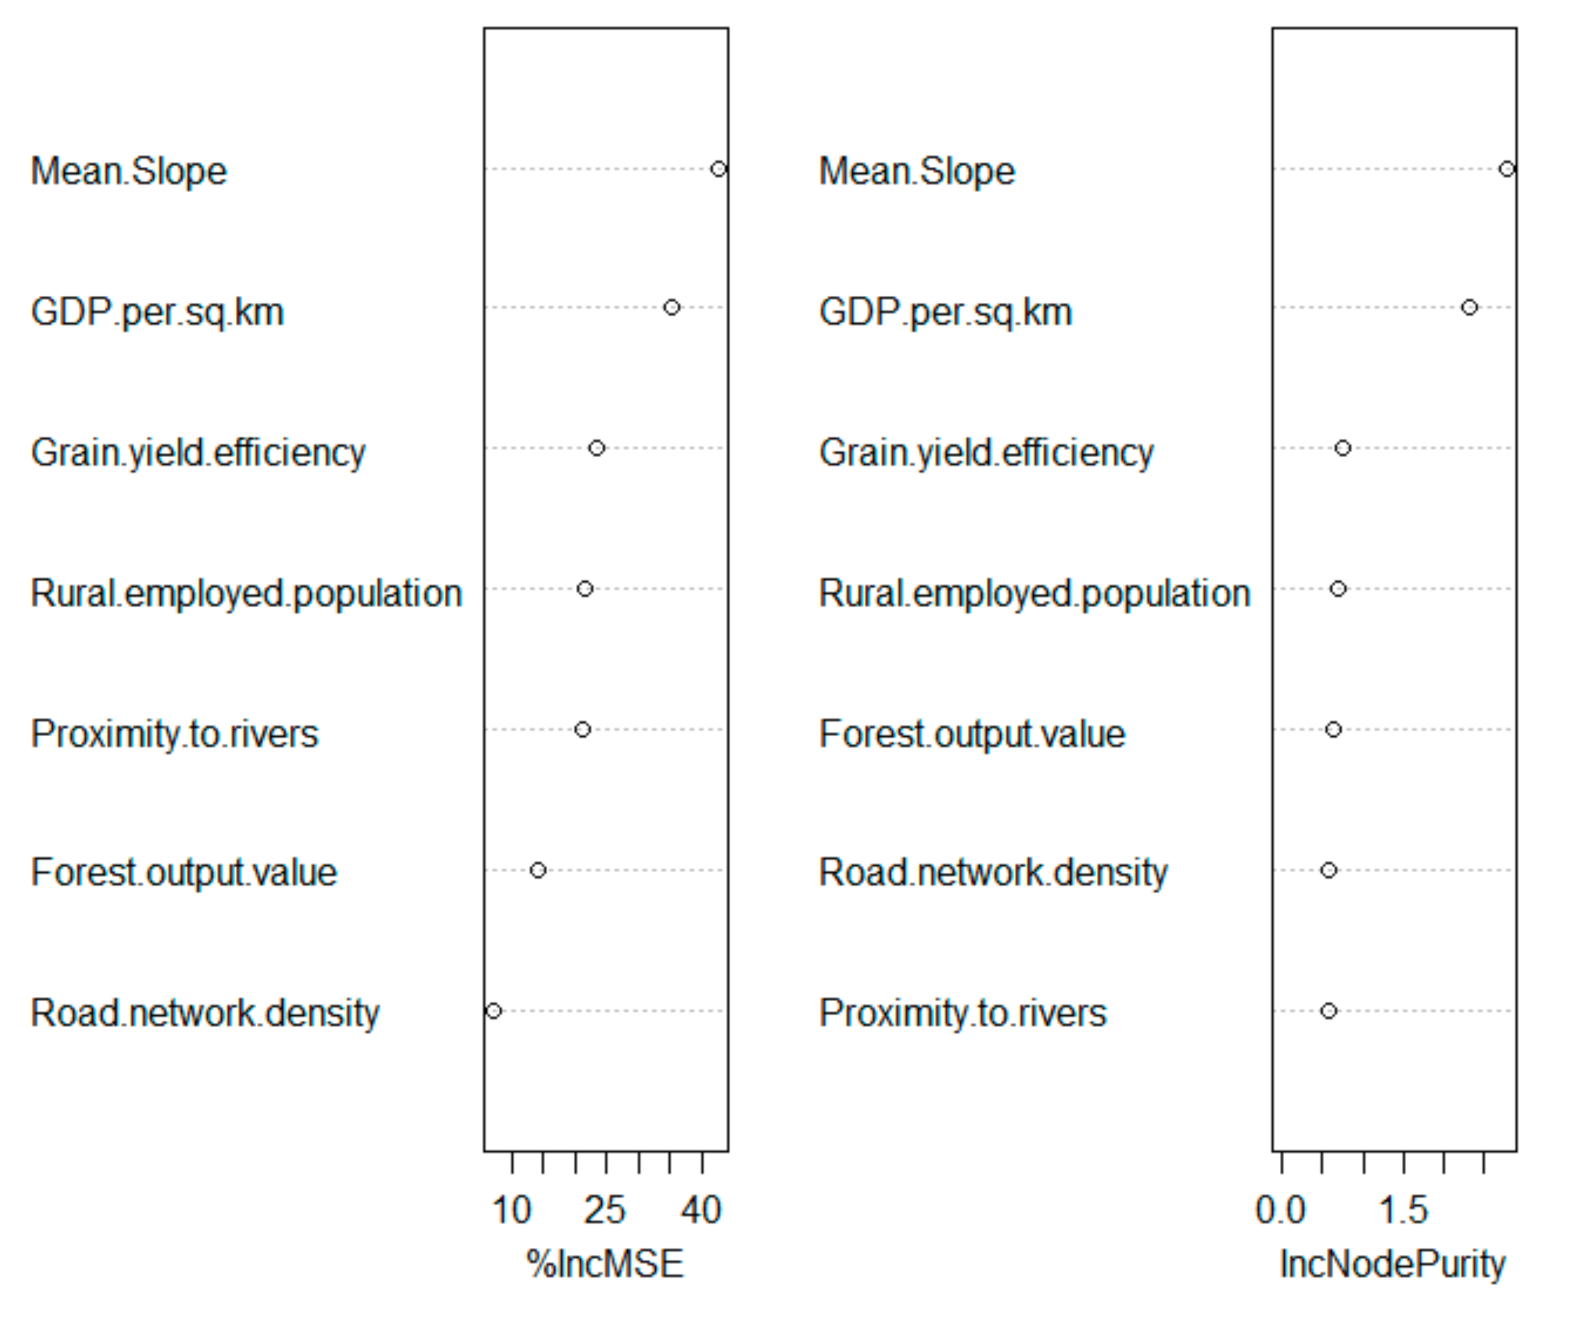
3.2. The Significance Degree of Forest Transition Factors in Chongqing
4. Conclusions
Author Contributions
Funding
Institutional Review Board Statement
Informed Consent Statement
Data Availability Statement
Conflicts of Interest
| 1. | Noteworthy, if a market is highly controlled, things would be different. For instance, before the market reform, shortage of forest products did not lead to the price increase of forest products or forestry output value under China’s planned economy. |
References
- Meyfroidt, P.; Lambin, E.F. Global forest transition: Prospects for an end to deforestation. Annu. Rev. Environ. Resour. 2011, 36, 343–371. [Google Scholar] [CrossRef]
- Mather, A.S.; Needle, C. The forest transition: A theoretical basis. Area 1998, 30, 117–124. [Google Scholar] [CrossRef]
- Grainger, A. The forest transition: An alternative approach. Area 1995, 27, 242–251. [Google Scholar]
- Drummond, M.A.; Loveland, T.R. Land-use pressure and a transition to forest-cover loss in the eastern United States. BioScience 2010, 60, 286–298. [Google Scholar] [CrossRef]
- Mather, A.S.; Fairbairn, J.; Needle, C.L. The course and drivers of the forest transition: The case of France. J. Rural Stud. 1999, 15, 65–90. [Google Scholar] [CrossRef]
- Yeo, I.-Y.; Huang, C. Revisiting the forest transition theory with historical records and geospatial data: A case study from Mississippi (USA). Land Use Policy 2013, 32, 1–13. [Google Scholar] [CrossRef]
- Foster, D.R.; Motzkin, G.; Slater, B. Land-use history as long-term broad-scale disturbance: Regional forest dynamics in central New England. Ecosystems 1998, 1, 96–119. [Google Scholar] [CrossRef]
- Mather, A.S. The forest transition. Area 1992, 24, 367–379. [Google Scholar]
- Dewi, S.; van Noordwijk, M.; Zulkarnain, M.T.; Dwiputra, A.; Hyman, G.; Prabhu, R.; Nasi, R. Tropical forest-transition landscapes: A portfolio for studying people, tree crops and agro-ecological change in context. Int. J. Biodivers. Sci. Ecosyst. Serv. Manag. 2017, 13, 312–329. [Google Scholar] [CrossRef]
- Singh, M.; Bhojvaid, P.; de Jong, W.; Ashraf, J.; Reddy, S. Forest transition and socio-economic development in India and their implications for forest transition theory. For. Policy Econ. 2017, 76, 65–71. [Google Scholar] [CrossRef]
- Calaboni, A.; Tambosi, L.R.; Igari, A.T.; Farinaci, J.S.; Metzger, J.P.; Uriarte, M. The forest transition in São Paulo, Brazil. Ecol. Soc. 2018, 23, 7. [Google Scholar] [CrossRef]
- Keenan, R.J.; Reams, G.A.; Achard, F.; de Freitas, J.V.; Grainger, A.; Lindquist, E. Dynamics of global forest area: Results from the FAO Global Forest Resources Assessment. For. Ecol. Manag. 2015, 352, 9–20. [Google Scholar] [CrossRef]
- Wang, J.; Xin, L.; Wang, Y. Economic growth, government policies, and forest transition in China. Reg. Environ. Chang. 2019, 19, 1023–1033. [Google Scholar] [CrossRef]
- Mather, A.S. Recent Asian Forest transitions in relation to forest transition theory. Int. For. Rev. 2007, 9, 491–502. [Google Scholar]
- Meyfroidt, P.; Rudel, T.K.; Lambin, E.F. Forest transitions, trade, and the global displacement of land use. Proc. Natl. Acad. Sci. USA 2010, 107, 20917–20922. [Google Scholar] [CrossRef] [PubMed] [Green Version]
- Wang, S.; Liu, C.; Wilson, B. Is China in a later stage of a U-shaped forest resource curve?—A re-examination of empirical evidence. For. Policy Econ. 2007, 10, 1–6. [Google Scholar] [CrossRef]
- Hu, A.G.; Shen, R.M.; Lang, X.J. Verification of the environmental Kuznets curve relationship between changes in China’s forest resources and economic development: Based on provincial panel data from the second to the seventh national forest statistics. China Public Admin. Rev. 2013, 15, 61–75. [Google Scholar]
- Batty, M. Thinking about Cities as Spatial Events. Environ. Plan. B Plan. Des. 2002, 29, 1–2. [Google Scholar] [CrossRef]
- Li, X.; Yeh, A.G.-O. Analyzing spatial restructuring of land use patterns in a fast growing region using remote sensing and GIS. Landsc. Urban Plan. 2004, 69, 335–354. [Google Scholar] [CrossRef]
- He, C.Y.; Li, J.W.; Zhang, X.L.; Liu, Z.F.; Zhang, D. Will rapid urban expansion in the drylands of northern China continue: A scenario analysis based on the Land Use Scenario Dynamics-urban model and the Shared Socioeconomic Pathways. J. Clean. Prod. 2017, 165, 57–69. [Google Scholar] [CrossRef]
- Sun, Y.; Zhao, S.; Qu, W. Quantifying spatiotemporal patterns of urban expansion in three capital cities in Northeast China over the past three decades using satellite data sets. Environ. Earth Sci. 2015, 73, 7221–7235. [Google Scholar] [CrossRef]
- Hassan, M. Mehedy, Monitoring land use/ land cover change, urban growth dynamics and landscape pattern analysis in five fastest urbanized cities in Bangladesh. Remote Sens. Appl. Soc. Environ. 2017, 7, 69–83. [Google Scholar]
- Zhang, T.; Chen, S.S.; Li, G. Exploring the relationships between urban form metrics and the vegetation biomass loss under urban expansion in China. Environ. Plan. B 2020, 47, 363–380. [Google Scholar] [CrossRef]
- Tang, J.; Wang, X. Analysis of the land use structure changes based on Lorenz curves. Environ. Monit. Assess. 2009, 151, 175–180. [Google Scholar] [CrossRef]
- Gibbs, H.K.; Ruesch, A.S.; Achard, F.; Clayton, M.K.; Holmgren, P.; Ramankutty, N.; Foley, J.A. Tropical forests were the primary sources of new agricultural land in the 1980s and 1990s. Proc. Natl. Acad. Sci. USA 2010, 107, 16732–16737. [Google Scholar] [CrossRef] [Green Version]
- Hansen, M.C.; Stehman, S.V.; Potapov, P.V. Quantification of global gross forest cover loss. Proc. Natl. Acad. Sci. USA 2010, 107, 8650–8655. [Google Scholar] [CrossRef] [PubMed] [Green Version]
- Zhang, Y.; Shen, W.; Li, M.; Lv, Y. Assessing spatio-temporal changes in forest cover and fragmentation under urban expansion in Nanjing, eastern China, from long-term Landsat observations (1987–2017). Appl. Geogr. 2020, 117, 102190. [Google Scholar] [CrossRef]
- Bonilla-Bedoya, S.; Mora, A.; Vaca, A.; Estrella, A.; Herrera, M.Á. Modelling the relationship between urban expansion processes and urban forest characteristics: An application to the Metropolitan District of Quito. Comput. Environ. Urban Syst. 2020, 79, 101420. [Google Scholar] [CrossRef]
- Zhai, D.; Xu, J.; Dai, Z.; Schmidt-Vogt, D. Lost in transition: Forest transition and natural forest loss in tropical China. Plant Divers. 2017, 39, 149–153. [Google Scholar] [CrossRef]
- Hall, J.M.; van Holt, T.; Daniels, A.E.; Balthazar, V.; Lambin, E.F. Trade-offs between tree cover, carbon storage and floristic biodiversity in reforesting landscapes. Landsc. Ecol. 2012, 27, 1135–1147. [Google Scholar] [CrossRef]
- Sasaki, N.; Putz, F.E. Critical need for new definitions of “forest” and “forest degradation” in global climate change agreements. Conserv. Lett. 2009, 2, 226–232. [Google Scholar] [CrossRef]
- Rudel, T.K.; Coomes, O.T.; Moran, E.; Achard, F.; Angelsen, A.; Xu, J.; Lambin, E. Forest transitions: Towards a global understanding of land use change. Glob. Environ. Chang. 2005, 15, 23–31. [Google Scholar] [CrossRef]
- Redo, D.J.; Grau, H.R.; Aide, T.M.; Clark, M.L. Asymmetric forest transition driven by the interaction of socioeconomic development and environmental heterogeneity in Central America. Proc. Natl. Acad. Sci. USA 2012, 109, 8839–8844. [Google Scholar] [CrossRef] [Green Version]
- Lambin, E.F.; Meyfroidt, P. Land use transitions: Socio-ecological feedback versus socio-economic change. Land Use Policy 2010, 27, 108–118. [Google Scholar] [CrossRef]
- Michon, G.; de Foresta, H.; Levang, P.; Verdeaux, F. Domestic forests: A new paradigm for integrating local communities’ forestry into tropical forest science. Ecol. Soc. 2007, 12. Available online: http://www.ecologyandsociety.org/vol12/iss2/art1/ (accessed on 20 May 2021). [CrossRef]
- Foster, A.D.; Rosenzweig, M.R. Econoimc growth and the riese of forests. Q. J. Econ. 2003, 118, 601–637. [Google Scholar] [CrossRef]
- Angelsen, A. Forest Cover Change in Space and Time: Combining the Von Thunen and Forest Transition Theories; The World Bank: Washington, DC, USA, 2007. [Google Scholar]
- Klooster, D. Forest transitions in Mexico: Institutions and forests in a globalized countryside. Prof. Geogr. 2003, 55, 227–237. [Google Scholar]
- Bakker, M.M.; Govers, G.; van Doorn, A.; Quetier, F.; Chouvardas, D.; Rounsevell, M. The response of soil erosion and sediment export to land-use change in four areas of Europe: The importance of landscape pattern. Geomorphology 2008, 98, 213–226. [Google Scholar] [CrossRef]
- Simwanda, M.; Murayama, Y. Spatiotemporal patterns of urban land use change in the rapidly growing city of Lusaka, Zambia: Implications for sustainable urban development. Sustain. Cities Soc. 2018, 39, 262–274. [Google Scholar] [CrossRef]
- Jia, L.; Ma, Q.; Du, C.; Hu, G.; Shang, C. Rapid urbanization in a mountainous landscape: Patterns, drivers, and planning implications. Landsc. Ecol. 2020, 35, 2449–2469. [Google Scholar] [CrossRef]
- Xu, Y.; Yu, L.; Peng, D.; Zhao, J.; Cheng, Y.; Liu, X.; Li, W.; Meng, R.; Xu, X.; Gong, P. Annual 30-m land use/land cover maps of China for 1980–2015 from the integration of AVHRR, MODIS and Landsat data using the BFAST. Sci. China Earth Sci. 2020, 63, 1390–1407. [Google Scholar] [CrossRef]
- Liu, X.; Xun, L.; Xia, L.; Xu, X.; Wang, S. A future land use simulation model (FLUS) for simulating multiple land use scenarios by coupling human and natural effects. Landsc. Urban Plan. 2017, 168, 94–116. [Google Scholar] [CrossRef]
- Huang, Z.; Wei, Y.D.; He, C.; Li, H. Urban land expansion under economic transition in China: A multi-level modeling analysis. Habitat Int. 2015, 47, 69–82. [Google Scholar] [CrossRef]
- Xian, S.; Li, L.; Qi, Z. Toward a sustainable urban expansion: A case study of Zhuhai, China. J. Clean. Prod. 2019, 230, 276–285. [Google Scholar] [CrossRef]
- Iannace, G.; Ciaburro, G.; Trematerra, A. Wind Turbine Noise Prediction Using Random Forest Regression. Machines 2019, 7, 69. [Google Scholar] [CrossRef] [Green Version]
- Rodriguez-Galiano, V.; Sanchez-Castillo, M.; Chica-Olmo, M.; Chica-Rivas, M. Machine learning predictive models for mineral prospectivity: An evaluation of neural networks, random forest, regression trees and support vector machines. Ore Geol. Rev. 2015, 71, 804–818. [Google Scholar] [CrossRef]
- Niu, W.-J.; Feng, Z.-K.; Feng, B.-F.; Xu, Y.-S.; Min, Y.-W. Parallel computing and swarm intelligence based artificial intelligence model for multi-step-ahead hydrological time series prediction. Sustain. Cities Soc. 2021, 66, 102686. [Google Scholar] [CrossRef]
- Rozelle, S.; Huang, J.; Benziger, V. Forest Exploitation and Protection in Reform China: Assessing the Impact of Policy, Tenure, and Economic Growth. Working Paper; Unpublished work. 2003. [Google Scholar]
- Wang, S.; Cornelis van Kooten, G.; Wilson, B. Mosaic of reform: Forest policy in post-1978 China. Policy Econ 2004, 6, 71–83. [Google Scholar] [CrossRef]
- Wenhua, L. Degradation and restoration of forest ecosystems in China. Ecol. Manag. 2004, 201, 33–41. [Google Scholar] [CrossRef]

| Description | Units | Min | Max | Median | Mean | SD | |
|---|---|---|---|---|---|---|---|
| Dependent Variables–Forest Land (Ratio) | |||||||
| 1 Ratio of forest land | % | 0.43 | 64.31 | 27.13 | 30.37 | 17.14 | |
| 2 Forest land area | Sq.km | 0.18 | 2390.40 | 444.76 | 773.82 | 739.89 | |
| Independent Variables | |||||||
| Variable 1 | Proximity to rivers | km | 0.18 | 113.11 | 7.76 | 24.39 | 26.22 |
| Variable 2 | Mean slope | - | 3.70 | 28.10 | 11.26 | 12.94 | 6.13 |
| Variable 3 | GDP intensity | 10,000 Yuan/sq.km | 113.27 | 226,783.29 | 703.93 | 6429.77 | 25107.65 |
| Variable 4 | Forestry output value | 10,000 Yuan | 0 | 40,278.27 | 6399.00 | 9715.68 | 9234.01 |
| Variable 5 | Road network density | km/sq. km | 0 | 3.88 | 1.54 | 1.42 | 0.74 |
| Variable 6 | Rural employed population | 10,000 persons | 0 | 82.42 | 34.90 | 33.94 | 19.80 |
| Variable 7 | Grain yield efficiency | ton/sq. km | 0 | 568.29 | 294.63 | 283.34 | 113.86 |
| Period | Flow of Conversion | Total | Farmland | Grassland | Waters | Built-Up Land | Unused Land | |
|---|---|---|---|---|---|---|---|---|
| 1990–2000 | Conversion to forest | Value (km2) | 173.169 | 6.151 | 166.586 | 0.432 | 0.000 | 0.000 |
| (%) | 100.000 | 3.552 | 96.198 | 0.249 | 0.000 | 0.000 | ||
| Conversion from forest | Value (km2) | 202.896 | 22.739 | 169.141 | 0.011 | 11.006 | 0.000 | |
| (%) | 100.000 | 11.207 | 83.363 | 0.005 | 5.424 | 0.000 | ||
| Net conversion | Value (km2) | −29.727 | −16.588 | −2.555 | 0.421 | −11.006 | 0.000 | |
| (%) | 100.000 | −55.801 | −8.594 | 1.416 | −37.022 | 0.000 | ||
| 2000–2010 | Conversion to forest | Value (km2) | 686.148 | 361.727 | 323.585 | 0.305 | 0.302 | 0.230 |
| (%) | 100.000 | 52.718 | 47.160 | 0.044 | 0.044 | 0.034 | ||
| Conversion from forest | Value (km2) | 144.439 | 37.821 | 25.760 | 35.448 | 45.411 | 0.000 | |
| (%) | 100.000 | 26.185 | 17.834 | 24.541 | 31.440 | 0.000 | ||
| Net conversion | Value (km2) | 541.709 | 323.906 | 297.825 | −35.143 | −45.110 | 0.230 | |
| (%) | 100.000 | 59.793 | 54.979 | −6.487 | −8.327 | 0.042 | ||
| 2010–2015 | Conversion to forest | Value (km2) | 0.030 | 0.000 | 0.030 | 0.000 | 0.000 | 0.000 |
| (%) | 100.000 | 0.000 | 100.000 | 0.000 | 0.000 | 0.000 | ||
| Conversion from forest | Value (km2) | 103.620 | 0.005 | 3.031 | 17.494 | 83.089 | 0.000 | |
| (%) | 100.000 | 0.005 | 2.925 | 16.88. | 80.186 | 0.000 | ||
| Net conversion | Value (km2) | −103.589 | −0.005 | −3.001 | −17.494 | −83.089 | 0.000 | |
| (%) | 100.000 | −0.005 | −2.897 | −16.888 | −80.210 | 0.000 | ||
| Method | Multiple Linear Regression | Random Forest | ||||
|---|---|---|---|---|---|---|
| Dependent Variables | Ratio of Forest Land | Ratio of Forest Land | ||||
| Results | Coeff. | s.e. | t Stat | IncMSE | IncNode Purity | |
| Variables | ||||||
| Proximity to rivers | −0.118 | 0.061 | −1.925 | 0.2111 | 0.5791 | |
| Mean Slope | 0.812 *** | 0.063 | 12.921 | 0.4283 | 2.7930 | |
| GDP per sq.km | −0.271 ** | 0.099 | −2.723 | 0.3533 | 2.3066 | |
| Forest output value | 0.041 | 0.066 | 0.616 | 0.1405 | 0.6392 | |
| Road network density | −0.116 | 0.079 | −1.483 | 0.0727 | 0.5817 | |
| Rural employed population | −0.353 *** | 0.075 | −4.693 | 0.2148 | 0.6874 | |
| Grain yield efficiency | 0.507 *** | 0.082 | 6.216 | 0.2348 | 0.7607 | |
| R Square | 0.7378 | |||||
| % Var explained | 0.8466 | |||||
Publisher’s Note: MDPI stays neutral with regard to jurisdictional claims in published maps and institutional affiliations. |
© 2021 by the authors. Licensee MDPI, Basel, Switzerland. This article is an open access article distributed under the terms and conditions of the Creative Commons Attribution (CC BY) license (https://creativecommons.org/licenses/by/4.0/).
Share and Cite
Li, L.; Qi, Z.; Zhong, T. Forest Transition and Its Dynamics in Subtropical Chongqing, China since 1990s. Land 2021, 10, 777. https://doi.org/10.3390/land10080777
Li L, Qi Z, Zhong T. Forest Transition and Its Dynamics in Subtropical Chongqing, China since 1990s. Land. 2021; 10(8):777. https://doi.org/10.3390/land10080777
Chicago/Turabian StyleLi, Lingyue, Zhixin Qi, and Teng Zhong. 2021. "Forest Transition and Its Dynamics in Subtropical Chongqing, China since 1990s" Land 10, no. 8: 777. https://doi.org/10.3390/land10080777
APA StyleLi, L., Qi, Z., & Zhong, T. (2021). Forest Transition and Its Dynamics in Subtropical Chongqing, China since 1990s. Land, 10(8), 777. https://doi.org/10.3390/land10080777