Article

Does Pastoral Land-Use Legacy Influence Topsoil Carbon and Nitrogen Accrual Rates in Tallgrass Prairie Restorations?

by
Nicholas Glass
1,
Brenda Molano-Flores
2,
Eduardo Dias de Oliveira
1,
Erika Meraz
1,
Samira Umar
1,
Christopher J. Whelan
1,3 and
Miquel A. Gonzalez-Meler
1,*
1
Department of Biological Sciences, University of Illinois at Chicago, Chicago, IL 60607, USA
2
Illinois Natural History Survey, Champaign, IL 61920, USA
3
Cancer Physiology, Moffitt Cancer Center and Research Institute, Tampa, FL 33612, USA
*
Author to whom correspondence should be addressed.
Land 2021, 10(7), 735; https://doi.org/10.3390/land10070735
Submission received: 9 June 2021 / Revised: 8 July 2021 / Accepted: 9 July 2021 / Published: 13 July 2021
(This article belongs to the Special Issue Grassland Restoration)

Abstract

:
Restoration can recover degraded ecosystems and ecosystem services. However, effects of restoration on soil nutrient accrual are difficult to predict, partly because prior land use affects rates of soil nutrient recovery. In tallgrass prairie restorations, land-use legacy effects have not yet been quantified. We investigated topsoil carbon and nitrogen accrual within seven land-use histories: (1) row crop agriculture, (2) pasture, (3) pasture converted from row crops, (4) prairie restored from row crop, (5) prairie restored from old pasture, (6) bison prairie restored from pasture and row crops, and (7) remnant prairie. Soil samples were collected in 2008 and again in 2018 at Midewin National Tallgrass Prairie in Will County, IL. Soil samples were analyzed for bulk density, root chemistry, macro- and micronutrients, and carbon. Restored prairies contained similar soil bulk densities and rates of topsoil carbon accrual compared to each other in 2018. However, restorations from row cropping accrued nitrogen more slowly than restorations from pastures. Additionally, pastures converted from crop fields exhibited fewer legacy effects than restorations converted from crop fields. This research illustrates land-use legacy effects on soil and nutrients during grassland restorations, with implications for potential restoration trajectories and their role in carbon sequestration and ecosystem functioning.

1. Introduction

Tallgrass prairie is one of the most vulnerable grassland ecosystems in North America due to its widespread land-use conversion to mainly agriculture [1,2,3]. Prairies provide many ecosystem services including erosion control and soil carbon (C) storage [4,5]. Soil functioning in mature tallgrass prairies facilitates steady rates of nutrient accrual; for example, slow rates of root litter decomposition promote the accumulation of large stocks of soil organic carbon (SOC). However, tallgrass prairie conversion to conventional agriculture reduced the stability of soil macro-aggregates [6,7], thereby reducing soil organic matter (SOM) content and soil moisture retention [8,9]. Furthermore, many common crop cultivars lack extensive or perennial root systems, and thus the potential for plant–soil feedbacks that could maintain or increase soil function and biodiversity is limited in row crop systems. Additionally, some tallgrass prairies were converted to grazing lands (e.g., cow pasture), which involved a different type of disturbance to soil structure than row cropping but still impacted soil physical (e.g., compaction) and chemical properties (pH, nutrient loss). Restoration back into tallgrass prairie can restore functionality in degraded or altered prairie ecosystems [10,11] and promote, among other things, soil C sequestration, with the potential to help mitigate global climate change [12]. However, the impacts of land-use history on soil nutrient recovery in tallgrass prairie restorations have not been thoroughly studied.
Overall, soil nutrient accrual rates in a given location result from the amount of nutrient inputs into the soil, the amount of nutrient outputs from the soil, and time [13]. Soil C and nitrogen (N) accrual slows as soil nutrient contents approach saturation levels, and thus the amount of soil C and N an area can contain (i.e., carrying capacity) is an important factor for the rates at which nutrients accrue. In topsoil, the rate at which nutrients accumulate depends on a combination of biotic factors, such as root turnover rate, root biomass, and soil community structure [14,15,16], and abiotic factors such as soil chemistry and weathering, which influence the physical and chemical stabilization of SOM in soil aggregates [17,18,19,20,21]. Availability of soil N, as well as the forms of N compounds, greatly influence soil functioning and the accrual of soil C [22] as N availability can promote microbial activity and trigger C decomposition in soil [23]. Soil C and N accrual may vary greatly within a given area. Variations in soil type, microtopography, and vegetation cover affect rates of soil nutrient inputs regardless of land use [24,25]. When land management practices change, impacts on soil functioning can interact with environmental properties to produce large variation in soil nutrient accrual across landscapes.
Management practices, which vary by land use, can impact soil processes and functioning and can alter the rate at which nutrients accrue in topsoil for years or decades. For example, in no-till agricultural land, the use of heavy farming equipment for planting and harvest compacts soil, and recovery may take decades [26,27,28,29]. Soil compaction reduces porosity and limits water and oxygen availability for plant roots, but it also inhibits root growth and the movement of soil organisms [29,30,31,32]. Fertilization application also alters soil nutrient cycling [33] and promotes chemical leaching into waterways that can affect nearby areas [34]. Fertilizers directly alter soil pH and cation content [35]: important determinants of soil organic carbon (SOC) accrual [36]. Pastoral land use leads to increased soil compaction through grazing [37,38]; but, unlike row crop fields, pastures do not always experience fertilizer applications. Although defoliation of grass is known to increase root turnover in upper soil layers [39,40], little evidence suggests that grazers have any direct effects on root decomposition [41], and grazer effects on microbial biomass are variable [40,42,43,44]. In contrast, pastures with legacies of row crop agriculture have been shown to exhibit increased root decomposition and reduced microbial biomass relative to other pastures for at least 3 years after land-use conversion [45].
Several studies have examined soil C and N accrual rates in prairie restorations but estimates for the recovery time of soil nutrients differ. Matamala et al. [46] utilized a chronosequence (a set of sites formed from the same parent material or substrate that differ in the time since they were formed [47]) to map C and N accrual in a series of restored prairies. They found that soil C accrued at an average of 43 g C m−2 yr−1 for soil masses of 0.16 Mg m−2 while soil N accrued at 3 g N m−2 yr−1. Baer et al. [48] published an innovative comparison of a North American tallgrass prairie restoration and a South African highveld restoration which showed that belowground C and N accrual can vary widely even between ecosystems with similar plant communities, soil clay content, and precipitation. Using soil masses of approximately 0.12 Mg m−2, they calculated nutrient accrual rates of 21 g C m−2 yr−1 and 2 g N m−2 yr−1 in tallgrass prairie and 62 g C m−2 yr−1 and 5 g N m−2 yr−1 in highveld. The predicted recovery time of soil C stocks to pre-conversion levels ranged from 42 years for highveld to 149 years for tallgrass prairie, but Matamala et al. [46] predicted a total recovery time of over 400 years. The relative importance of factors that contribute to recovery of soil nutrient stocks and reasons why accrual rates vary so widely remain unclear, although factors such as soil texture, initial soil C stocks, the frequency and duration of rainfall events, and grazing intensity have been considered as important determinants of soil C accrual rates [4,36,46,48]. However, most research on prairie restoration involves land-use histories of row crop agriculture, and the impacts of pastoral land-use history are less known.
Land-use history can create legacy effects that impact ecosystem response to environmental changes [49]. For soil, stochastic climatic events such as droughts affect nutrient cycling via plant-soil interactions [50], and some land-use legacies may interact more strongly with climatic disturbance than others. Drought periods facilitate drying in areas that are normally saturated, such as wet-mesic prairie, which can experience accelerated rates of SOC decomposition as oxygen re-enters soil [51,52,53]. In contrast, increased precipitation contributes to further losses of soil nutrients via erosion in land-use legacies involving soil structure destabilization, such as legacy effects present in land-use histories involving row cropping [54]. Some land-use legacies facilitate increased nutrient stocks in topsoil but increased vulnerability for soil nutrient loss. For example, constant but moderate grazing has been shown to continually increase stocks of soil C across many grassland ecosystems [55], but soil C is often concentrated in upper soil layers and is easily accessible by the microbial community. Higher quality forms of C input into soil can explain why pastures typically contain greater abundances of labile forms of soil C and microbial biomass than other agricultural land uses [56]. However, upon rewetting after drought, moisture in pastures can leach soil nutrients that subsequently are lost from the system [57]. Because of their impacts on soil processes, land-use legacies can be powerful tools for predicting the response of ecosystems not only to climate change but also to restoration and the rate at which nutrients accrue within restored soils.
In this study, we investigated the effects of land-use legacy on belowground C and N accrual in tallgrass prairie restorations at the USDA Forest Service Midewin National Tallgrass Prairie in northeast Illinois. We compared soil properties in restorations to row crop fields, pastures, and remnant prairie in the 0–10 cm soil layer. Our objectives were to: (1) evaluate the effects of land-use legacy on topsoil carbon and nutrient dynamics during tallgrass prairie restoration, (2) determine if patterns of land-use legacy in prairie restorations also occur in grazed pastures, and (3) evaluate the state of topsoil carbon and nutrients in unconverted land uses (i.e., remnant prairie, row crop fields, old pasture). We used measurements from samples taken in 2008 and 2018 to quantify changes in soil bulk density, root chemistry, and nutrients in topsoil over 10 years. We hypothesized that legacy impacts on topsoil properties results in a decrease in nutrient accrual rates in restorations with histories involving row crop agriculture relative to restorations with pastoral land use history. We show that land-use legacy does affect topsoil nutrient accrual during prairie restorations, but it remains unclear if legacy effects lead to differences in topsoil carbon accrual at Midewin. We explore how climate and management practices interact to continue to impact soil properties after agricultural disturbances to soil have ceased.

2. Materials and Methods

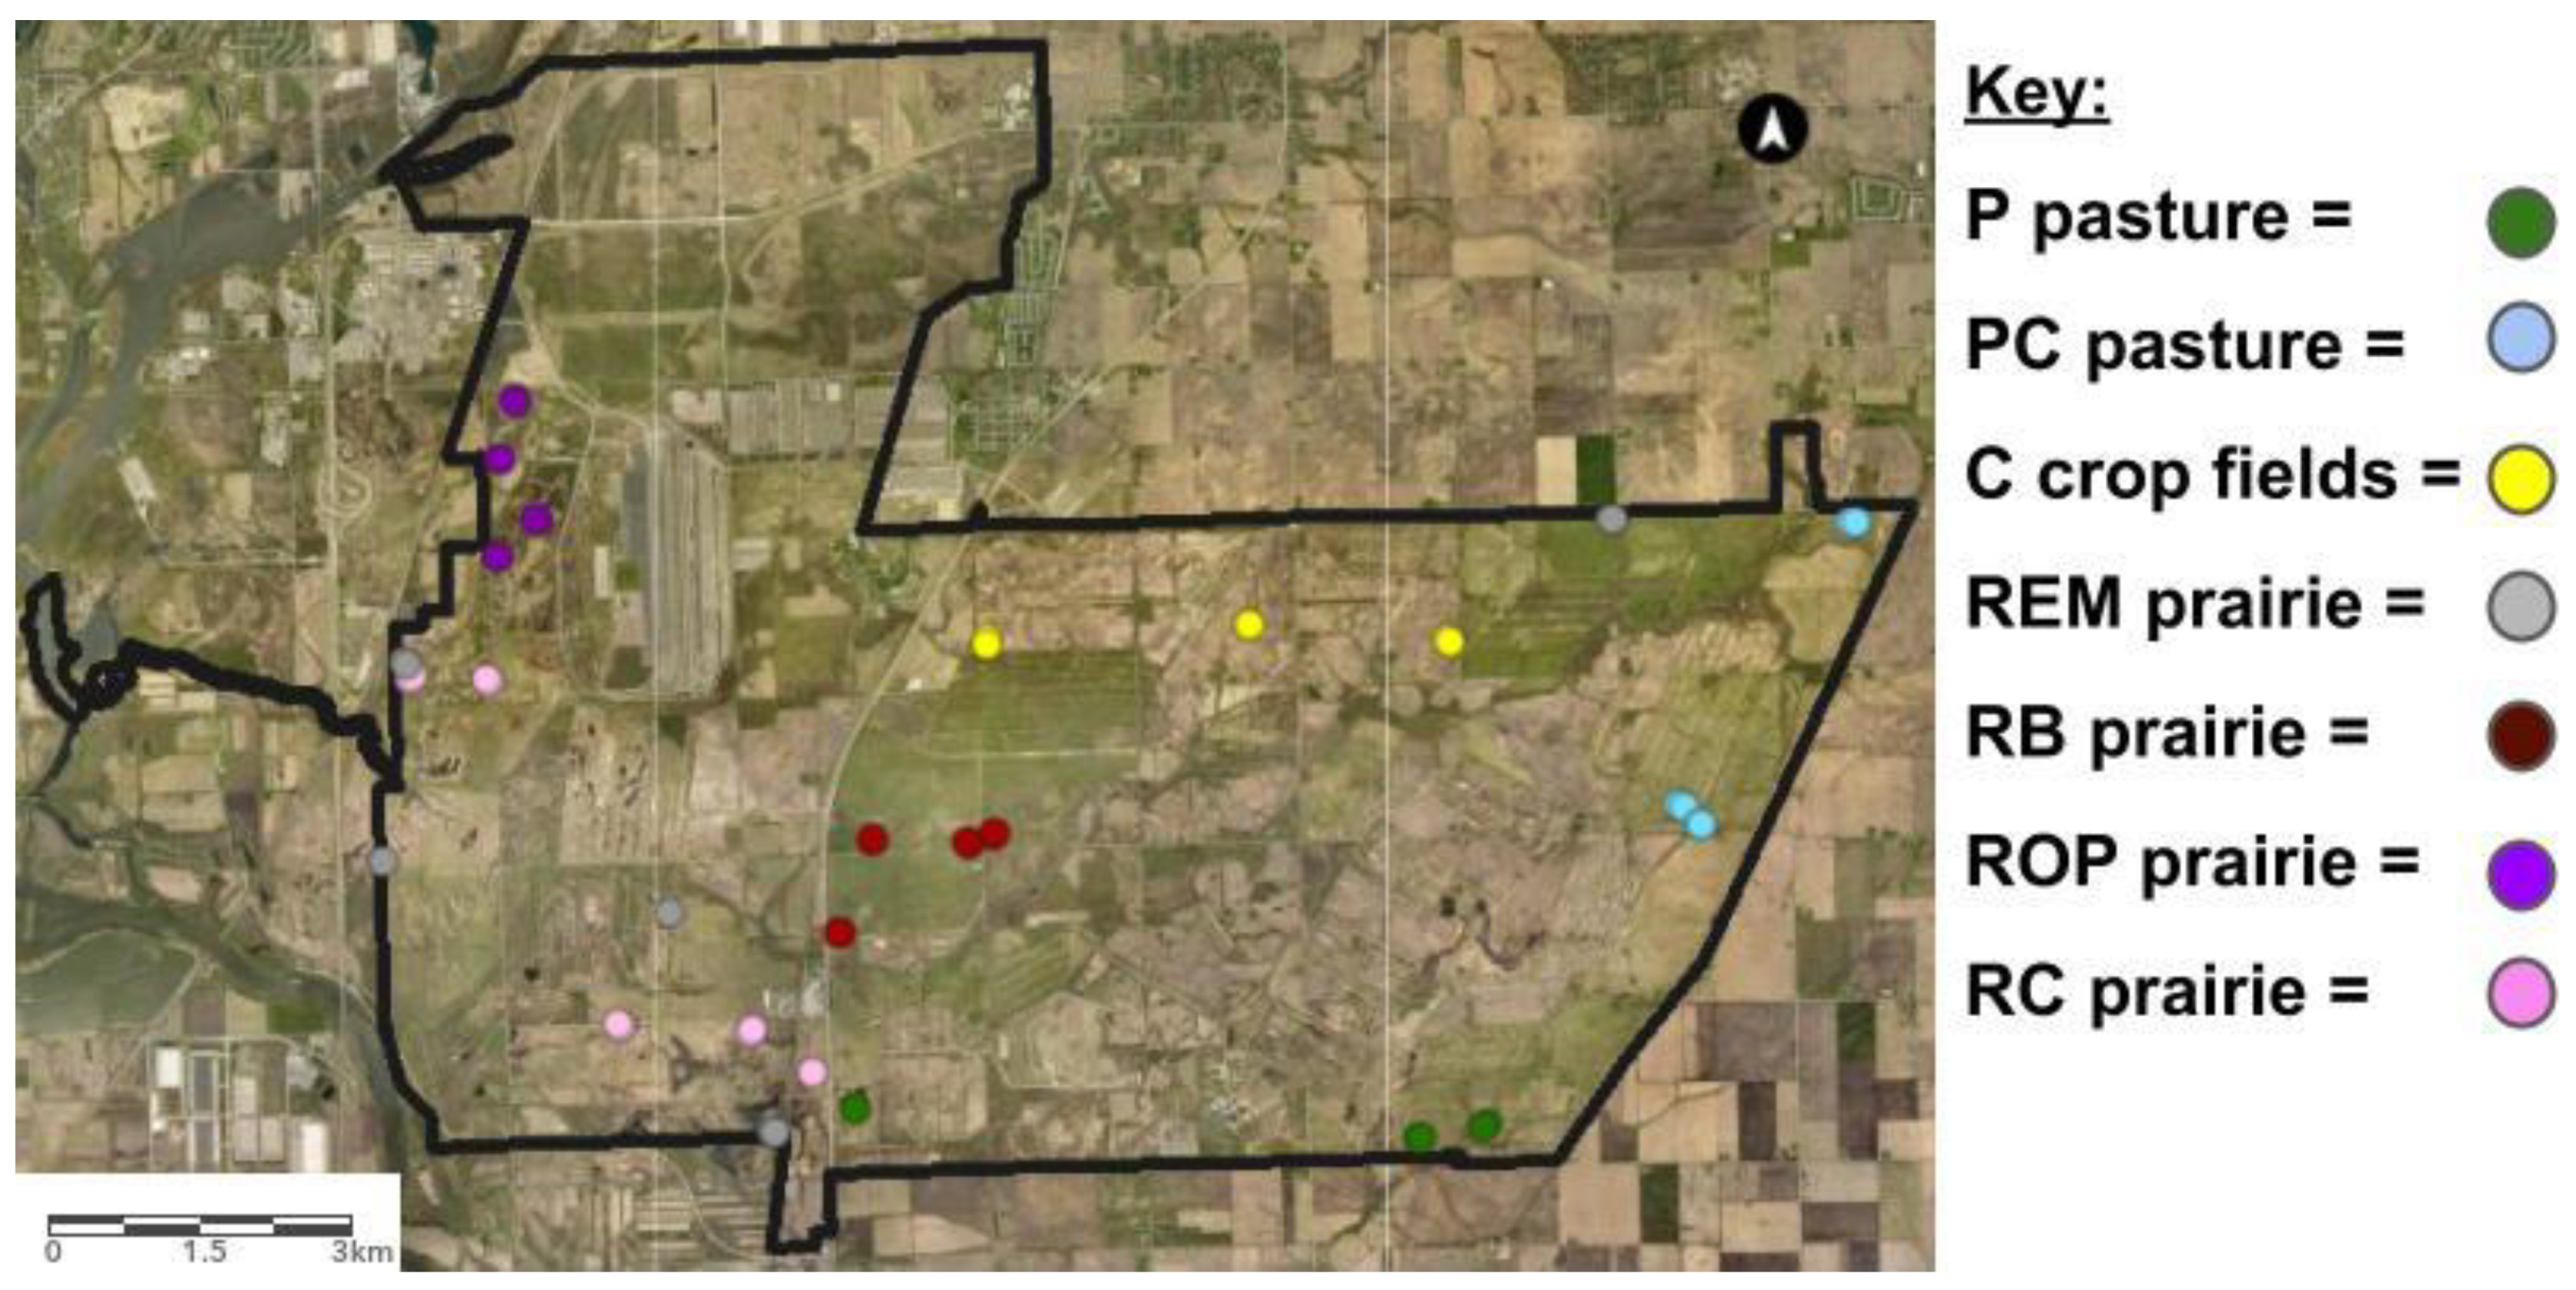
2.1. Site Description

This study was conducted at the USDA Forest Service Midewin National Tallgrass Prairie (hereafter Midewin) in Will County, IL, USA. (41.3727° N, 88.1160° W). Midewin is the only federally protected tallgrass prairie in the U.S.A. and encompasses over 20,000 acres. Prior to 1940, the area was largely row cropped farmland with occasional orchards and pastures (J. Wheeler, Midewin National Tallgrass Prairie, USDA Forest Service, personal communication, 2 March 2020). In December of 1941, the Department of Defense acquired the land and built the Joliet Army Ammunition Plant (JAAP) for TNT production and storage. To minimize fire hazards, the army allowed cows to graze over non-production areas of modern-day Midewin. In the 1980s, several areas across eastern Midewin were converted back to row crop agriculture. Midewin was transferred to the US Department of Agriculture in 1996 with the passage and signing into law of the Illinois Land Conservation Act (1995). In 1997, the USDA began to establish Midewin on portions of the former JAAP property. Over the next seven years, the USDA Forest Service made many changes to land uses in the area, including the conversion of several row crop fields on the east side of Midewin back to cow pasture and the restoration of tallgrass prairie on the west side of Midewin (B. Glass, retired from Midewin National Tallgrass Prairie, personal communication, 22 August 2019). However, a large northwestern portion of Midewin remained largely fallow until 2007. As of 2020, the entire west side of Midewin has been restored to prairie. The east side of Midewin includes leased row crop fields and cow pastures in addition to a 1200-acre prairie restoration containing bison. Soils are mollisols and range from silt loam to silty clay loam with 0–6% slopes [58]. Approximately 600 plant species are present at Midewin, and common vegetation present in the prairies include grasses such as Andropogon gerardii, Schizachyrium scoparium, Sorghastrum nutans, Panicum virgatum, Sporobolus heterolepis, and forb species in genera such as Silphium, Helianthus, Heliopsis, and Monarda. Common grasses in cow pastures include fescues (Festuca spp.), brome (Bromus spp.) grasses, and species such as Agrostis gigantea. Row crops consist of corn (Zea mays) and soybeans (Glycine max). All locations within Midewin experience similar climate, with mean annual precipitation for 2010–2020 ranging from 100 to 110 cm, mean annual temperature of 10.3 to 10.8 °C, and approximately 76 cm of mean snowfall [59]. In 2020, Midewin experienced approximately 90 cm of precipitation, 65 cm of snowfall, and a mean annual temperature of 10.5–11 °C.
For our study, we selected 27 locations within Midewin that represent 7 distinct land-use histories: (1) row crop agriculture (C), (2) cow pasture (P), (3) cow pasture converted from row crop agriculture (PC), (4) remnant prairie (REM), (5) restored prairie converted from row crop agriculture (RC), (6) restored prairie converted from former pasture land (“restored old pasture”; ROP), and (7) bison prairie restored from both P and PC pasture (RB; Table 1).
Two land-use histories (ROP and RB) involve land-use conversion that occurred after 2008. C sites have been cultivated continuously for row crops since the early 1980s but have not been tilled since 1998. P pastures have been grazed by cattle continuously since 1941, and the number of cattle per acre has been maintained at 0.28 cattle per acre since at least 1998. PC pastures also have 0.28 cattle per acre but were row crop fields from the 1980s until the late 1990s/early 2000s. REM prairies include areas such as dolomite prairies too rocky for cultivation or mesic prairies with periodic flooding. Although the remnant prairies at Midewin were periodically grazed by cattle until 1998, no remnant has ever been cultivated for crops. RC restorations were restored to tallgrass prairie from 2002 to 2005. All RC sites experienced approximately 20 years of row crop agriculture directly prior to restoration. ROP sites were grazed from 1941 to 1998 and then left fallow for at least 9 years prior to restoration planting. RB prairie restoration began in 2015. At the time of our sampling there were approximately 0.05 bison per acre in RB prairie. Sampling locations were located a maximum of 15 km apart. Soils range from well-drained to poorly drained, are mostly fine to fine-silty with occasional loamy and mixed with occasional illitic, and are all mesic [60]. Compaction from cows in pastures and from farm equipment in crop fields has reduced porosity in the upper soil layers. All sampling occurred within the A horizon, which typically continues to a depth of approximately 30 cm. In C, PC, and RC land-use histories, soils were plowed to a depth of 15–20 cm before Midewin enacted a no-till policy in 1998.
At Midewin, restored prairies are ideally burned every 1–5 years, although actual burn frequencies of a given location depend on environmental conditions, land manager prioritization, resource availability, burn day prescription parameters, and several other considerations (J. Parr, Midewin National Tallgrass Prairie, USDA Forest Service, personal communication, 7 June 2021). Restorations have also undergone the removal of soil drainage tiles: ceramic tiles part of soil drainage systems installed from the 1860s until the 1930s (J. Wheeler, Midewin National Tallgrass Prairie, USDA Forest Service, personal communication, 2 March 2020). The rare combination of adjacent restored prairies with similar current management but differing land-use histories provides the opportunity to evaluate the influence of past land use on tallgrass prairie restorations.

2.2. GIS Topographical Analysis

USDA Forest Service administrative borders were imported into ArcGIS (ESRI, US) and projected into WGS_1984_UTM_Zone_16N. All subsequent ArcGIS layers were similarly projected. The 2012 NAIP imagery for Will County, IL, was imported into ArcGIS. LiDAR data for tiles encompassing Midewin were then imported into ArcGIS and converted into a digital elevation model (DEM). The Nibble and Hillshade tools were applied to the DEM to eradicate No Data cells and to accentuate ground features, respectively (Figure S1). A water accumulation (WA) layer was generated for Midewin based on LiDAR data. WA is a measure of the degree to which water accumulates in the soil after rainfall events with streams and rivers having high WA values and the tops of hills having low WA values. We took the log10 of the WA values for each grid cell to simplify cell values and highlight the magnitude of flow into each cell. The log10(WA) layer was then transformed into integer data using the Integer Tool, and values for kg C per m2 and kg N per m2 for each sampling location were rounded to the nearest integer and incorporated as an additional layer. Elevation and log10(WA) values for grid cells were averaged for each sampling transect for comparison with topsoil C and N data.

2.3. Soil Sampling and Processing

We sampled 3–5 locations for each land-use history present at Midewin (Figure 1).
Soil sampling occurred in 2008 and 2018, but selected locations were resampled in 2020 (three ROP locations). The three locations resampled in 2020 have not been presented independently but are instead presented with 2018 data. This is because only three locations needed to be resampled, and we have applied regressions on data from 2020 to correct for the effect of two additional years of development on soil properties and nutrient content. We established a 40 m transect in each sampling location. Five 5 cm diameter × 20 cm deep soil cores were extracted at evenly spaced intervals along each transect with a soil core sampler with the hammer attachment (AMS Inc, American Falls, ID, USA). Soil cores were placed on dry ice and transported from Midewin to the Department of Biological Sciences at the University of Illinois at Chicago where they were frozen at −18 °C. The upper 10 cm of each soil core was weighed and passed through an 8 mm sieve. We chose to analyze only the top 10 cm of soil because topsoil is highly influenced by land management practices and is also where the majority of SOC and root mass is in tallgrass prairies. Roots and rocks were removed from soil, and roots were washed over a 150 µm mesh sieve, patted dry, and weighed before being placed in an oven at 65 °C for 48 h. Homogenized soil without roots was dried at 85 °C for 48 h. Oven-dried roots and soil were weighed again, ground, and analyzed for carbon (%C) and nitrogen (%N) via combustion in an elemental analyzer ECS 4010 (Costech Analytical, Valencia, CA, USA) coupled with an Isotope Ratio Mass Spectrometer Delta Plus XL (Thermo Finnigan, Germany) operating in continuous flow mode with Conflo III (Thermo Finnigan, GER). From these analyses, we also obtained the isotope ratios of both δ13C and δ1⁵N for 2018 samples only. Isotopic data was unavailable for 2008 samples.

2.4. Soil Bulk Density and Nutrient Content Calculations

Soil bulk density was calculated from core dry weights (no subsamples were used to calculate gravimetric water content; instead, all soil from the top 10 cm of cores was dried and weighed) and with a compression ratio that corrects for soil compaction that occurred during sampling. The compression ratio was calculated as:
CR = (hole length cm − core length cm) ÷ (core length cm),
where CR is the compression ratio. When the compression ratio is used to calculate soil bulk density, it adjusts sampling depth to estimate corrected soil bulk density, or the soil bulk density that would have been measured without soil compaction that occurred during sampling:
CR bulk density = (soil g) ÷ ((CR × 10 cm + 10 cm) × 19.635 cm2),
where CR bulk density is the corrected soil bulk density and soil g is the total grams of soil dry weight present in the top 10 cm of the soil core. For 2008 samples, we determined CR corrected soil bulk density by regressing corrected soil bulk density against uncorrected soil bulk density in 2018 samples for each land-use history separately and then applying the regression to 2008 soil bulk densities from the corresponding land-use history.
Soil C and N stable isotopic compositions were expressed as a “delta” notation according to:
[delta15N or δ13C] = (Rsample ÷ Rstd − 1) × 1000,
where R is the ratio of 13C/12C or 15N/14N of the sample and standard (std). The isotopic standard for C and N was the Pee Dee Belemnite (PDB) and atmospheric air, respectively. A standard linear mixing model was used to estimate the proportion of soil C in transects originating from C3 vegetation (C3-derived C).
Corrected soil bulk density, root dry weight, and root and soil %C and %N were used to estimate kg C (and N) m−2 in the 0–10 soil layer. Specifically, we used the following equations:
g [C or N] core = (soil %[C or N]) × (CR corrected soil bulk density) × (196.35 cm3) + (root %[C or N]) × (root g),
where g [C or N] core is the total grams of C or N present in a soil core volume when accounting for compression, soil %[C or N] is the percentage of C or N in the soil, root %[C or N] is the percentage of C or N in roots, and root g is the total grams of root dry weight present in the top 10 cm of the soil core; and:
kg soil [C or N] m−2 = (g [C or N] core ÷ 19.635 cm2) × (10,000 cm2 m−2 ÷ 1000 g kg−1),
where kg soil [C or N] m−2 is the total kilograms of C or N per square meter in the soil layer 0–10 cm. We also compared soil C and N content without soil bulk density by calculating the relative change in g [C or N] kg−1 soil between 2008 transects and corresponding 2018 transects. We estimated soil C and N accrual rates by taking the difference between 2008 kg soil [C or N] m−2 and 2018 kg soil [C or N] m−2 at each transect, dividing the difference by the number of months that passed between the two sampling dates, and then multiplying the quotient by 12. For 2020 samples (three ROP transects), calculations of soil bulk density, root mass, root and soil C and N concentrations, and soil C and N stocks included reductions that accounted for the additional 2 years that passed before resampling. After reductions were made, data from 2020 were combined with 2018 data for all subsequent analyses. Finally, subsamples of oven-dried soil from 2018 were analyzed for phosphorus (P) via Mehlich-3 method (20 mL solution per 2 g soil); potassium (K), calcium (Ca), magnesium (Mg), and sodium (Na) cations via ammonium acetate extraction (20 mL of 1 M NH4OAc per 2 g soil); zinc (Zn), copper (Cu), manganese (Mn) via DTPA extraction (20 mL solution per 10 g soil); and plant-available ammonium (NH4+) and nitrate (NO3−) via KCl extraction (20 mL of 1 M KCl per 2 g soil) at the K-State Soil Testing Lab in Kansas State University. Due to funding constraints, only 2018 samples were used for additional nutrient content analysis beyond C and N.

2.5. Statistical Analysis

To avoid pseudoreplication, we first determined means for each sampling location by taking the values from each of the five cores and averaging them to obtain one value per transect. A total of 27 transects were used for statistical analysis. Data from 2008 and 2018 were analyzed separately (unless data were combined to describe temporal patterns, e.g., soil C or N accrual rate and relative change in g C or N kg−1 soil). We analyzed 2008 and 2018 data separately because two land-use changes, bison prairie and ROP restorations, did not occur until after the 2008 sampling period.
All statistical analyses were performed using R software [61]. One-way analysis of variance (ANOVA) was used to estimate effect sizes and 95% confidence intervals for land-use history effects on soil bulk density, C:N ratios, and isotopic mixing model results [46]. ANOVAs were expressed using simple linear regression or, when normality was not met, non-linear least squares regression. Normality of residuals was assessed with Shapiro tests of normality and homoscedasticity was assessed by plotting the standardized residuals against fitted values via the ggfortify package [62]. In addition to 95% confidence intervals, Tukey’s post hoc tests were utilized to detect sources of statistical variation between means. Land-use legacy effects on soil C, N, Ca, Cu, Mn, Zn, K, P, NO3, Mg, Na, and NH4 were determined with PERMANOVA. All PERMANOVA results were followed by pairwise comparisons evaluated with FDR-adjusted p-values [63]. Because only soil C and N were available for 2008 soil samples, soil C and N were analyzed separately from other soil nutrients. Where PERMANOVA tests for land-use history interactions on soil C and N were significant (alpha = 0.05), ANOVAs were conducted to determine effects on soil C and N separately. Changes in soil properties from 2008 to 2018 were assessed using paired sample t-tests (2008 vs. 2018; [4]), which we prioritized over ANOVAs when possible because paired sample t-tests provided comparisons of each transect value for 2008 directly against its corresponding value in 2018. Figures were created using the GGPLOT2 package in R [64].

3. Results

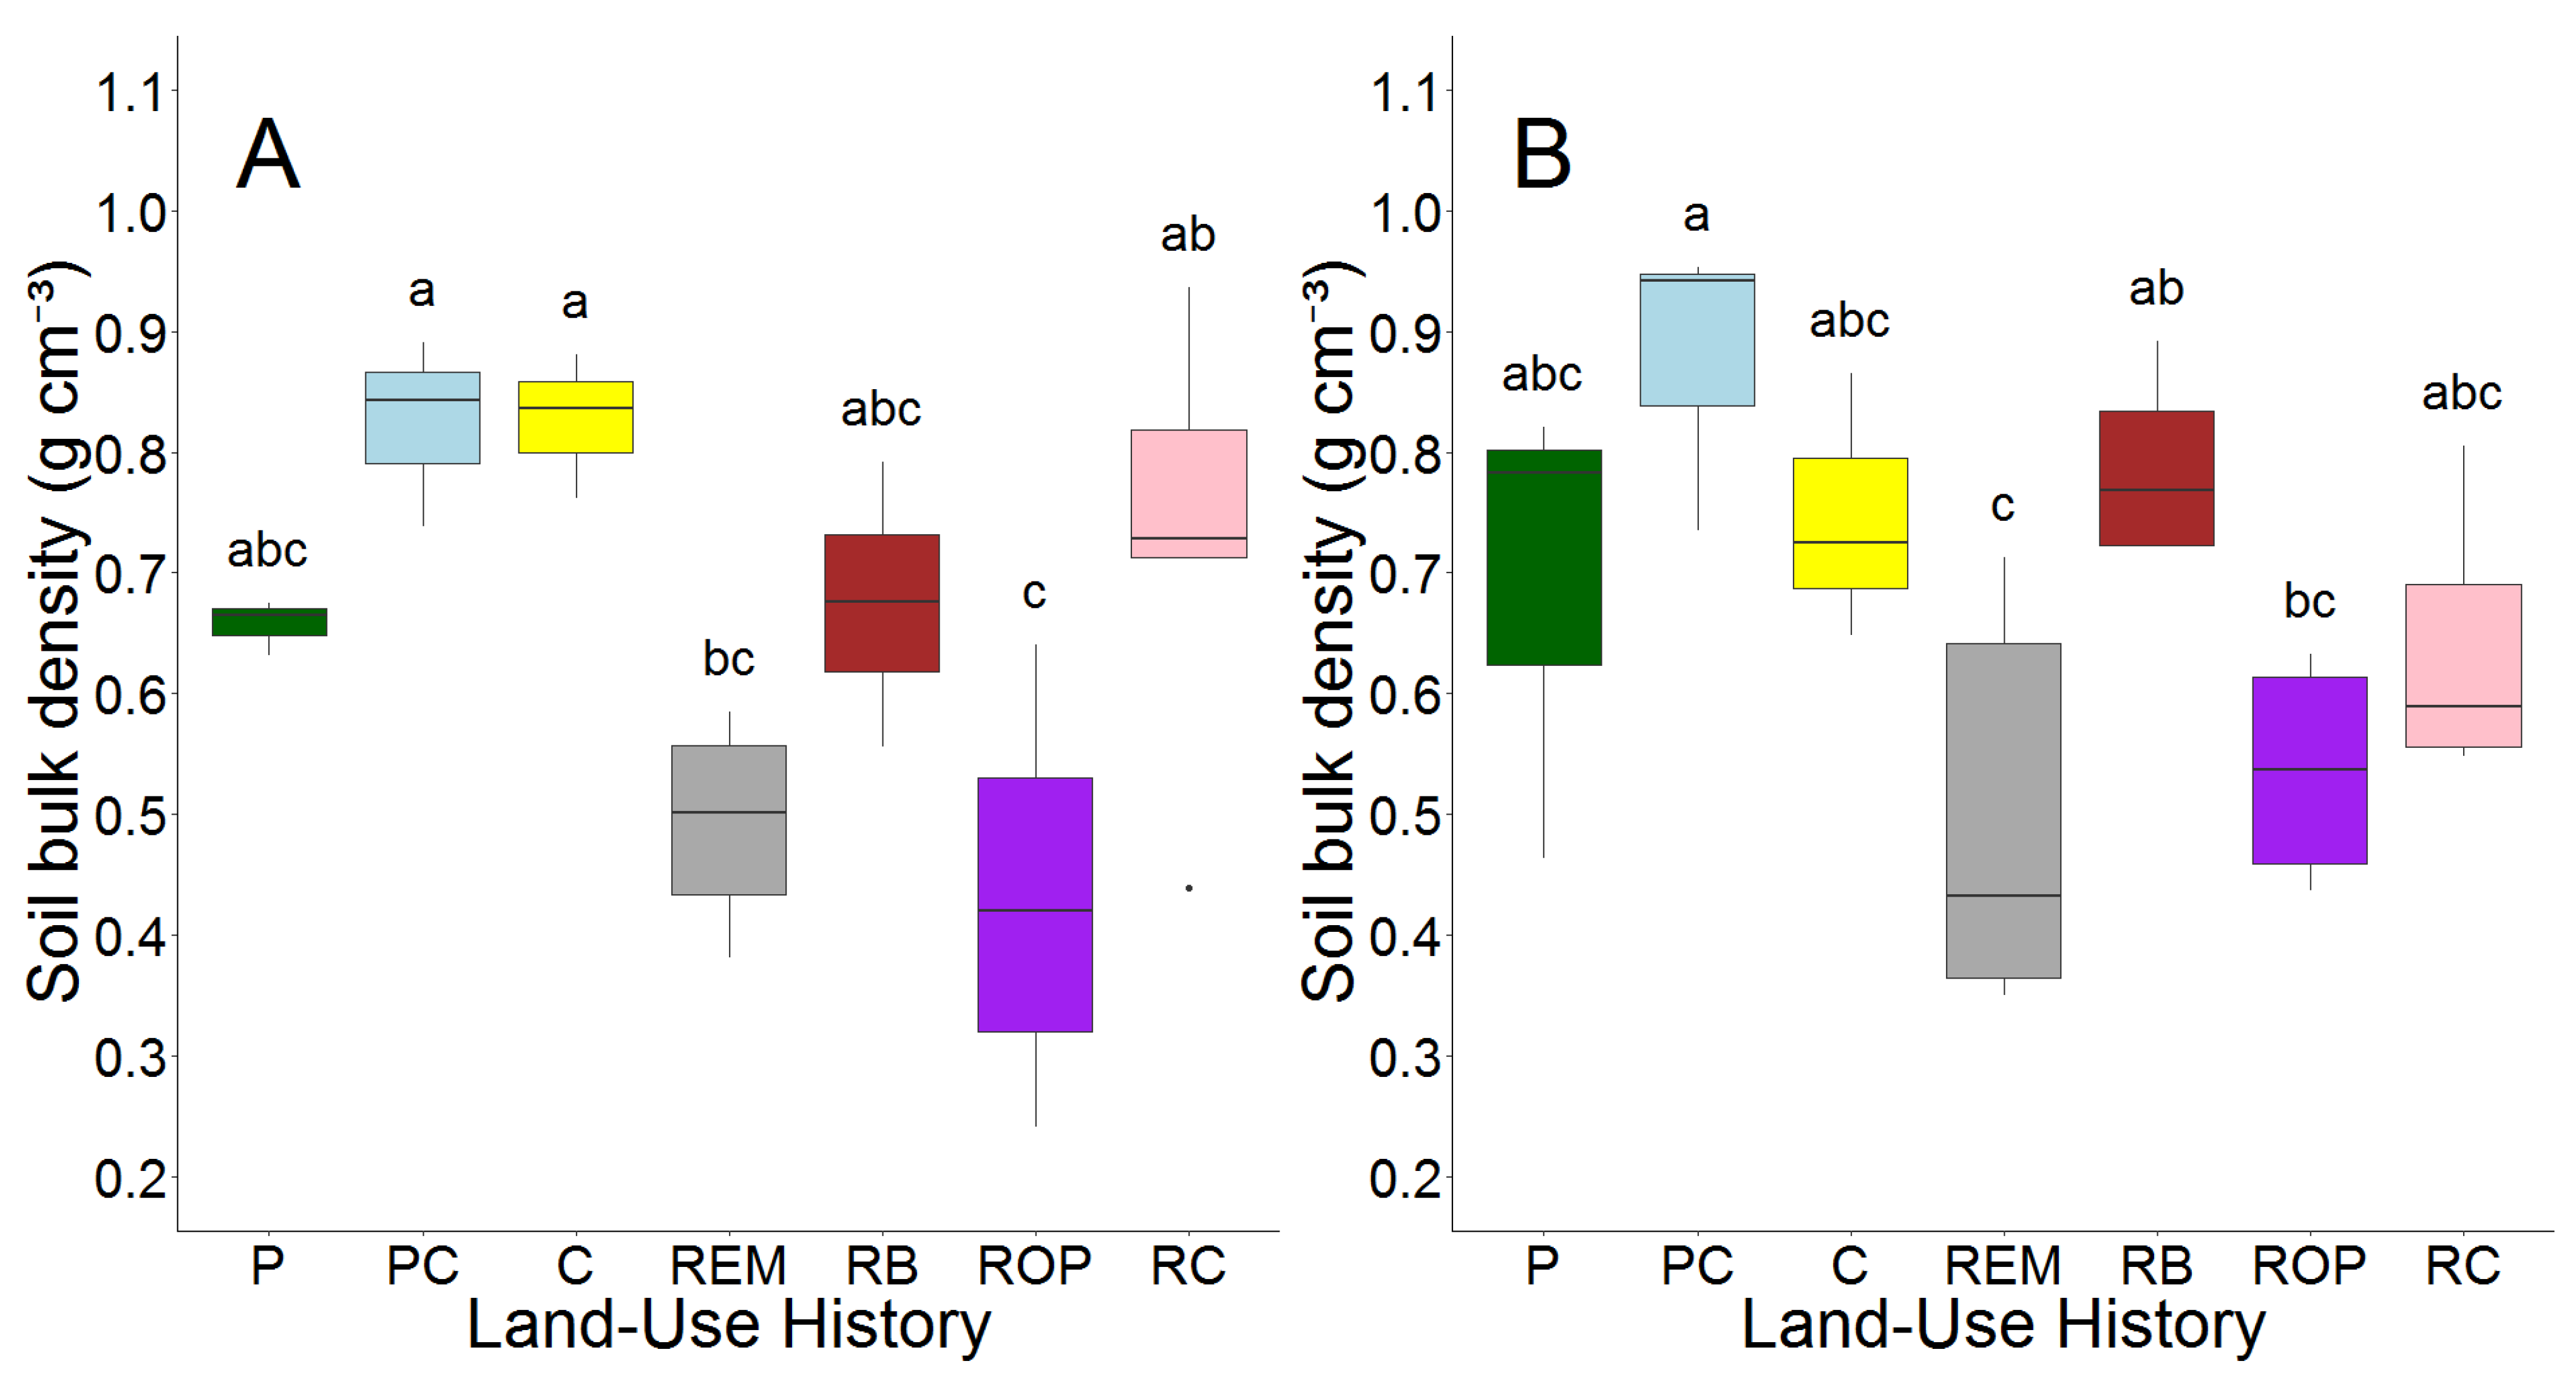
3.1. Topographical Effects and Soil Physical Properties

Neither elevation or water accumulation (WA) at Midewin affected topsoil C and N content along our transects (Table S1). For soil physical properties, no differences in bulk density were found between sampling years (Table 2); however, small trends were apparent.
In RC restorations (prairie restored from row crop fields) and row crop fields, average soil bulk density decreased slightly between 2008 and 2018; however, for PC pastures (pasture converted from row crop fields), P pastures (pasture), ROP restorations (prairie restored from old pasture), and RB prairie (bison prairie restored from PC and P pastures), average soil bulk density increased slightly with age. Soil bulk density was affected by land-use legacy in 2008 (p < 0.001) and 2018 (p = 0.007, Figure 2, Table S2).
Bulk density in RC restorations was 70% greater than ROP sites in 2008 but did not differ in 2018, and RC restorations contained 33% greater bulk density than remnant prairie in 2008 but also did not differ in 2018. Bulk density was similar between ROP sites and remnant prairie both before and after prairie restoration in ROP sites occurred. PC pastures contained higher average soil bulk density than P pastures in 2008, but they were more similar in 2018.

3.2. Belowground Plant and Soil Chemistry

Root C:N ratios varied significantly with land-use history in 2008 (p < 0.001) but not in 2018 (Table 3 and Table S3).
From 2008 to 2018, root C:N in row crop fields nearly doubled while root C:N in remnant prairies decreased; however, there was no effect of sampling year on root C:N. Soil C:N ratios were affected by sampling year (p = 0.007; Table 2 and Table 3), and the greatest change occurred in row crop fields (+27%, p = 0.02). Soil C:N in ROP sites exhibited a moderate decrease (−8%, p = 0.02) but increased in remnant prairie (+14%, p = 0.01). Unlike root C:N ratios, soil C:N varied by land-use history in 2008 (p < 0.001; Table 3 and Table S3) but not in 2018.
Land-use histories varied in the proportion of topsoil C originating from C3 vegetation (p = 0.002; Table 4 and Table S4).
ROP restoration soil contained greater proportions of C3 carbon than soil in RC restorations (p = 0.02), row crop fields (p = 0.002), and remnant prairies (p = 0.04). Bison prairie soil also contained greater proportions of C3 carbon than row crop field soil (p = 0.04) as did P pastures (p = 0.04), but PC pastures and row crop fields were similar.
Land-use history also affected topsoil nutrient content (p = 0.001) with the greatest differences occurring for soil Mg, Na, and NH4 (Table 5).
ROP restorations contained less soil Mg than all other land-use histories, and remnant prairies contained the most Mg. However, ROP restorations contained on average the greatest concentrations of soil Ca, P, Cu, and Na. Soil Mg in RC restorations was slightly lower than other land-use histories, and both ROP and PC restorations contained more soil Na than bison prairie and P pastures. ROP and RC restorations also contained similar amounts of soil NH4 that were less than half of that of P pastures. Bison prairie soil NH4 was considerably higher than that of other restorations. Similar to ROP and RC restorations, P and PC pastures did not differ for any soil nutrients tested. Finally, row crop fields contained negligible amounts of soil NH4 that were much less than other land-use histories. Overall, soil nutrient content in bison prairie was more similar to pastures than other prairie soils, and ROP soil nutrient content was more dissimilar to remnant prairie soil than soil in RC restorations (Table S5).

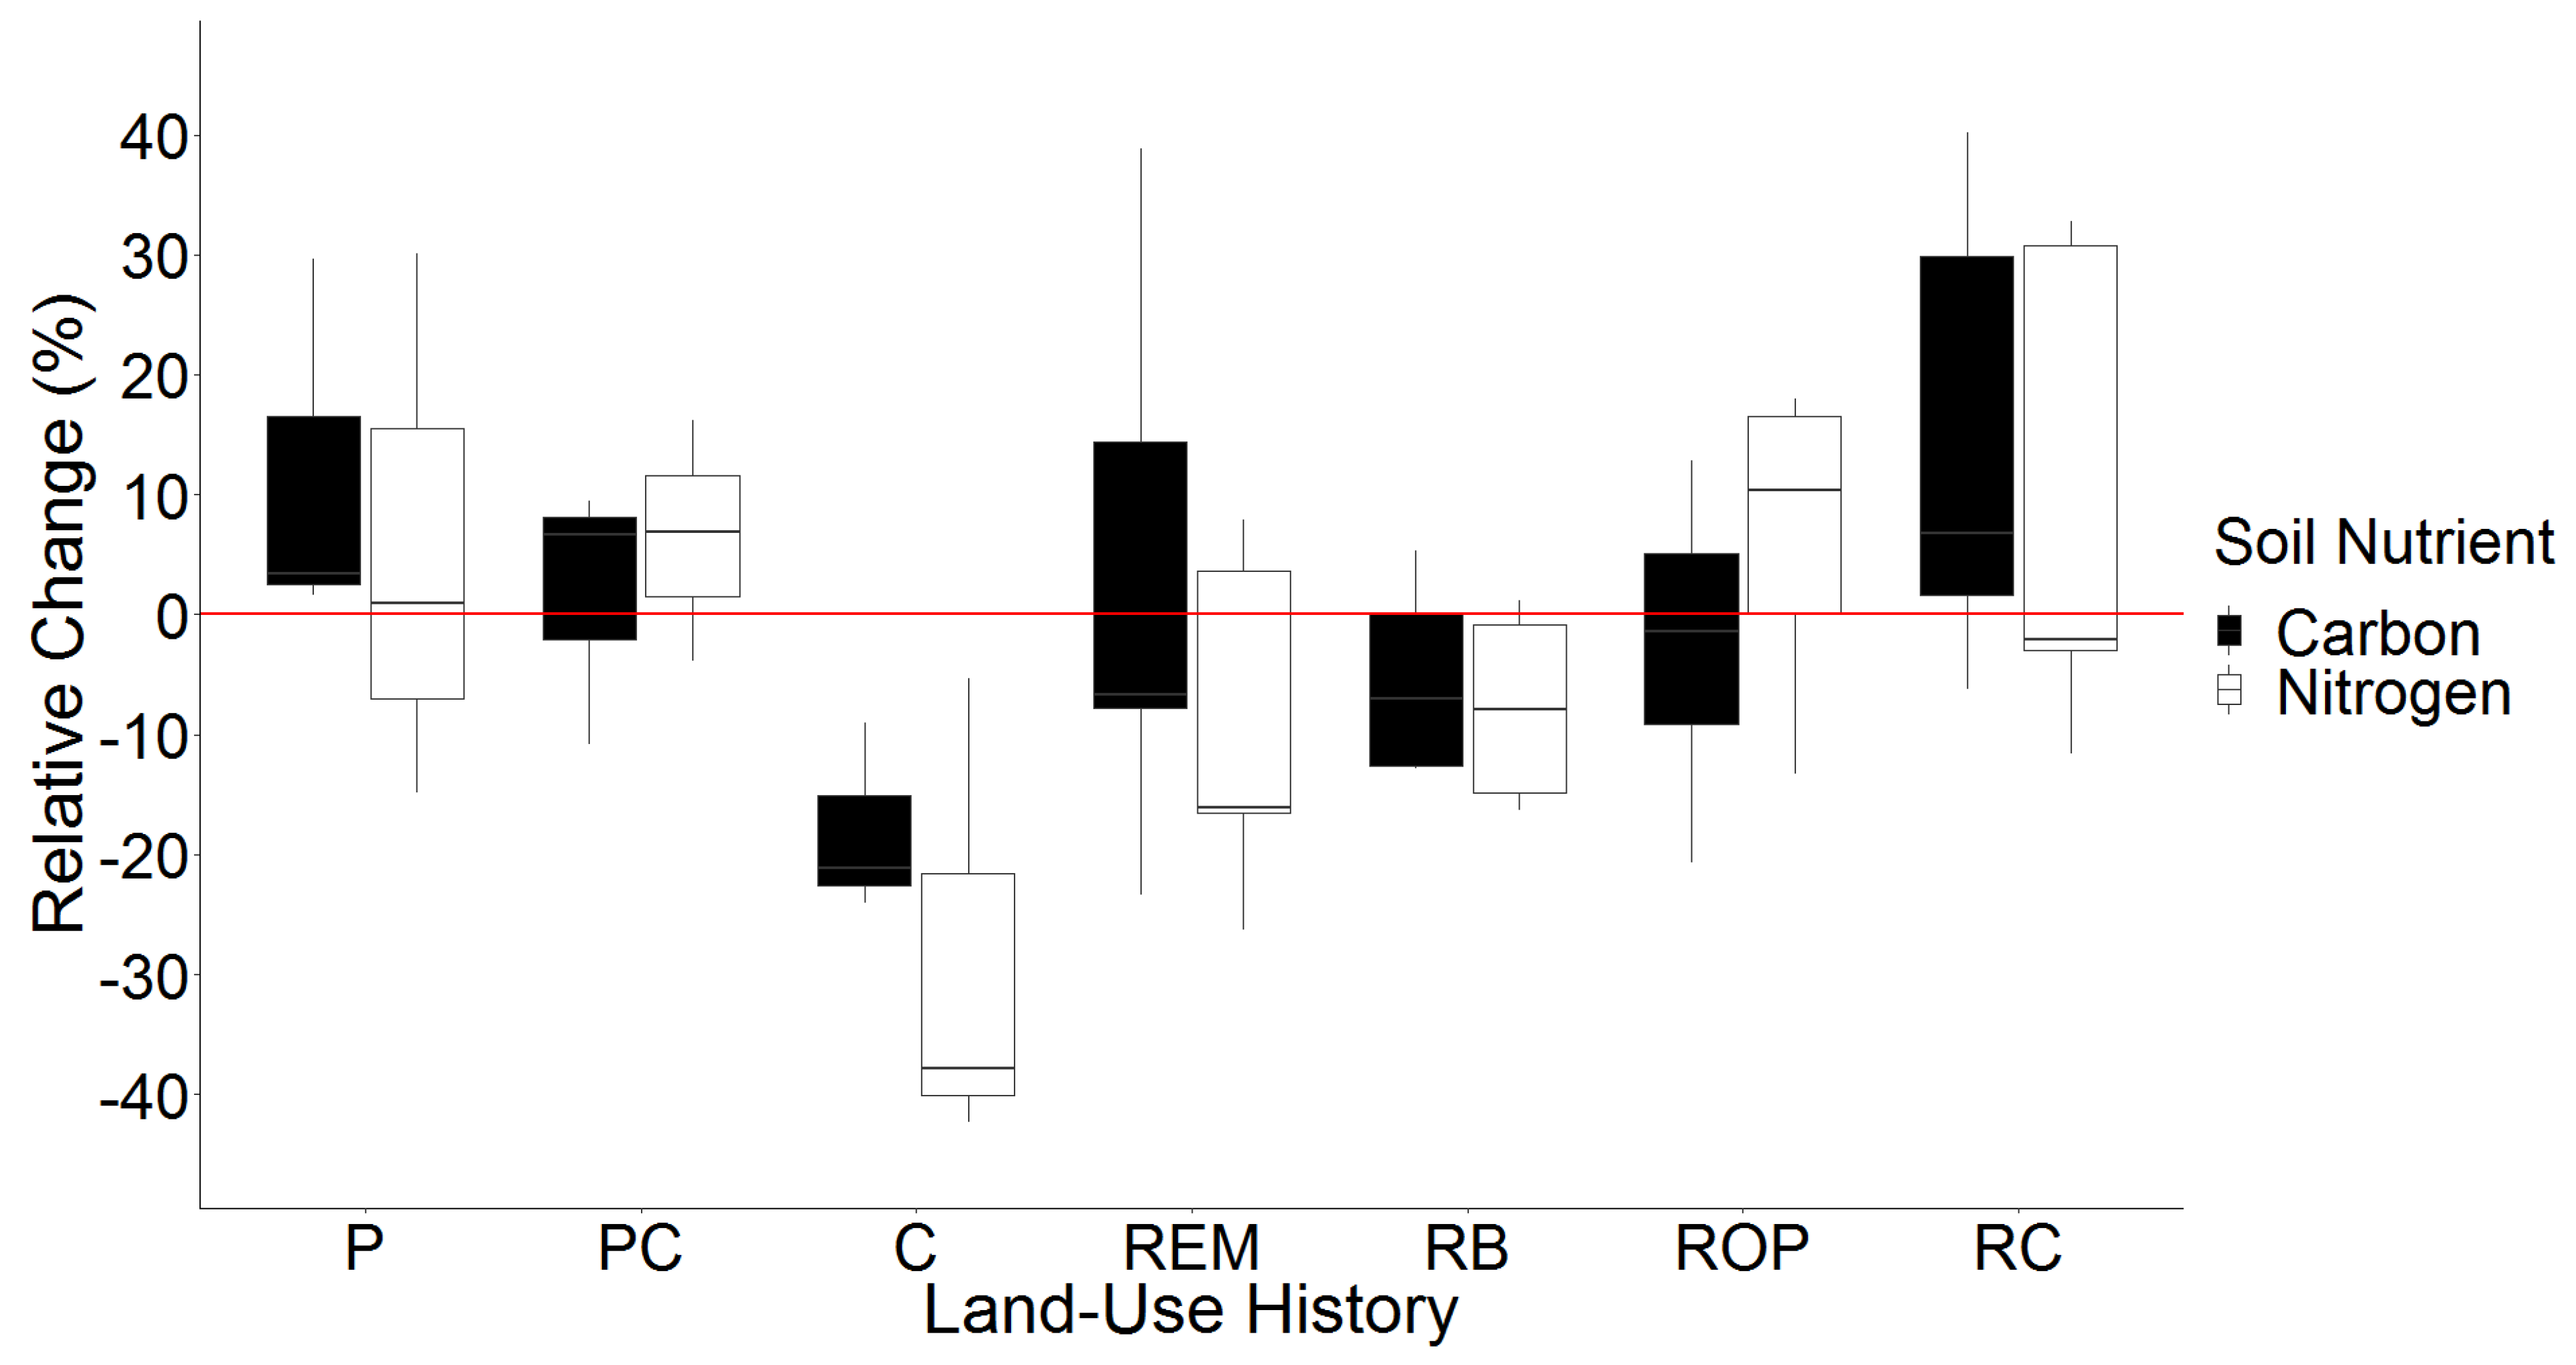
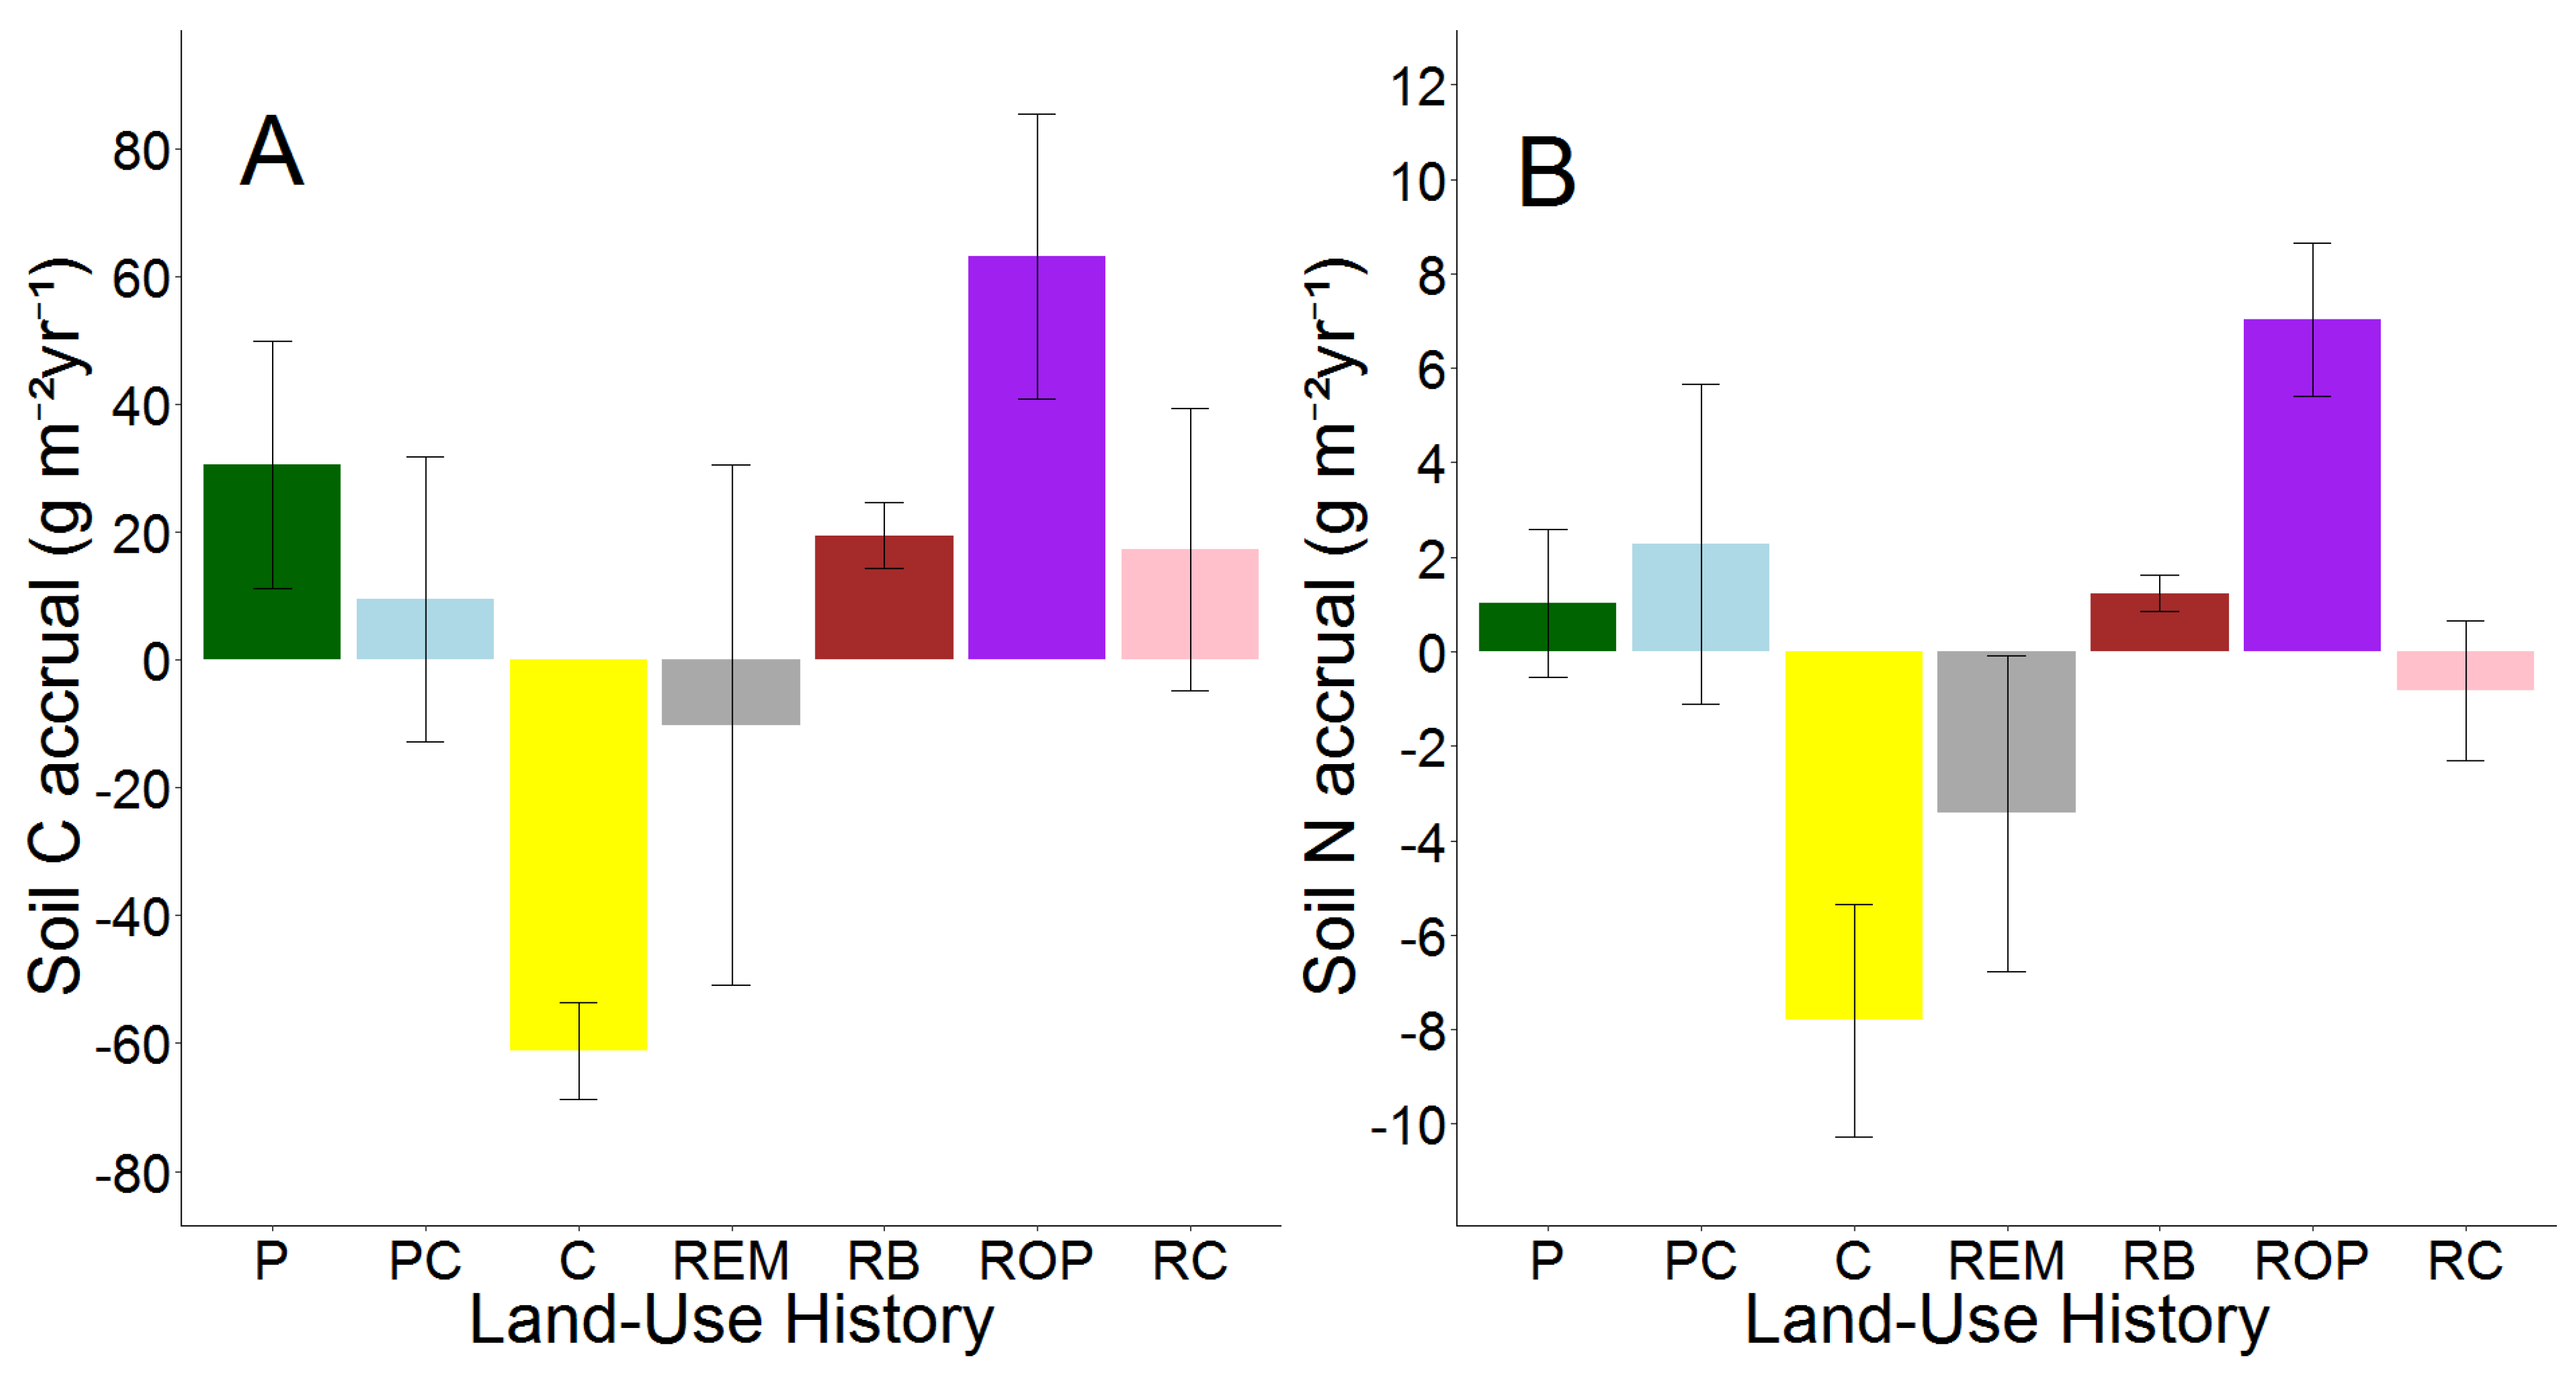
3.3. Temporal Changes in Soil C and N

In contrast to soil C:N ratios, grams of soil C and N per kilogram of soil did not vary with time but varied by land-use history in both sampling years (p = 0.03 for 2008, p = 0.008 for 2018, Tables S6–S8). Grams of C and N kg−1 soil were more similar between land-use histories in 2008 than in 2018. In 2018, remnants contained the highest soil C concentrations at 61.0 g C kg−1 soil, but ROP restoration soil C was only slightly lower at 55.8 g C kg−1 soil. RC restorations contained an average of 39.0 g C kg−1 soil while bison prairie contained 34.8 g C kg−1 soil. Row crop fields contained the lowest soil C concentrations at 23.2 g C kg−1 soil. ROP restorations contained the highest soil N concentrations at 4.9 g N kg−1 soil followed by remnant prairie at 4.6 g N kg−1 soil. Soil C and N concentrations in 2008 followed a similar pattern except that remnant prairies contained the highest soil N concentrations at 5.2 g N kg−1 soil, and ROP sites contained 4.8 g N kg−1 soil. RC restorations contained similar soil C and N concentrations to P and PC pastures in both 2008 and 2018, although PC pastures contained slightly lower g C and N kg−1 soil than P pastures and restorations in both sampling years. In fact, PC pastures contained the lowest concentrations of soil N in 2008 at 2.5 g N kg−1 soil.
Although g C and N kg−1 soil varied by land-use history in both sampling years, relative changes in g C and N kg−1 soil from 2008 to 2018 were unaffected by land-use history (Figure 3, Table S9).
Estimates of relative change in soil C and N varied widely within land-use histories. In P pastures, individual transects ranged from a 30% to a 2% increase in g C kg−1 soil and a 30% increase to a 15% decrease in g N kg−1 soil. PC pastures varied less, with relative changes ranging from +9% to −11% for g C kg−1 soil and +16% to −4% for g N kg−1 soil. The greatest variation between transects was within remnant prairie, which ranged from a +39% to −23% change for soil C and a +8% to −26% change for soil N. The greatest average change in g C kg−1 soil was a decrease in row crop fields (−18%), followed by an increase in RC restorations (+14%). However, changes in soil N were not always consistent with changes in soil C. While the greatest average increase in g N kg−1 soil also occurred in RC restorations (+9%), PC pastures and ROP restorations exhibited the second greatest increase (+6%). Remnant prairie, which experienced a 3% gain in g C kg−1 soil, decreased nearly 10% for soil N. Row crops again exhibited the greatest average relative change in g N kg−1 soil with a 28% decrease.
Overall, there were no effects of sampling year on topsoil C or N stocks at Midewin, and C and N stocks were similar between all land-use histories in 2008. However, topsoil C and N stocks varied between land-use histories in 2018 (p = 0.02, Tables S6–S8). ROP restorations contained on average 700 more grams of N and 490 more grams of C per square meter in the 0–10 cm soil layer than RC restorations. Bison prairie contained on average 300 g N m−2 and 220 g C m−2 more than RC restorations, while remnant prairie contained 300 g N m−2 and 460 g C m−2 more than RC. The greatest stocks of soil N and C were in ROP restorations, although differences between ROP and remnant prairie soil C stocks were slight. Row crop fields contained the lowest stocks of soil C and N, and PC pastures contained slightly higher stocks of soil C and N than P pastures. The average topsoil C stock for prairies at Midewin in 2018 was 2.8 kg C m−2, while for pastures the average was 2.7 kg C m−2. Both pastures and prairies exhibited a slightly higher average in 2018 than in 2008.
Topsoil C and N accrual rates also differed between land-use histories (p = 0.05; Figure 4; Tables S6 and S9) largely because of high variation in soil N accrual rates between restoration types and soil N depletion in row crop fields.
Both soil C and N accrual rates were higher in ROP restorations than in any other land-use history. In fact, the average soil C accrual rate was twice as high in ROP restorations than the next highest average: that of P pastures, which was followed by averages from bison prairie and RC restorations. Row crop fields and remnant prairies were the only land-use histories to show negative average accrual rates for both soil C and N, although variation within remnant prairies was large. Similar to relative changes in g C and N kg−1 soil, topsoil C and N accrual did not always follow similar patterns. Bison prairie exhibited an average accrual rate of 19.4 g C m−2 yr−1, which was approximately equal to RC restorations, but the two land-use histories differed in direction of average soil N accrual (RB gained 1.2 g N m−2 yr−1, RC lost −0.8 g N m−2 yr−1). P pastures exhibited the second highest average rate of soil C accrual (30.5 g C m−2 yr−1), but NP pastures contained the second highest average rate of soil N accrual (2.3 g C m−2 yr−1). Separate one-way ANOVAs of soil C and N accrual indicated that soil C accrual was statistically similar among all land-use legacies. However, land-use legacy effects on soil N accrual rates were significant (p = 0.01), and soil N accrual was greater in ROP restorations than in RC restorations, remnant prairies, and row crop fields (Table 6).

4. Discussion

4.1. Environmental and Land Management Interactions

Our results show that land-use history does create lasting legacy impacts on soil properties in tallgrass prairie restorations that persist for years after land use has changed. Soil C accrual rates did not vary by land-use history at Midewin; however, soil bulk density, soil C and N concentrations, and soil N accrual did. Thirteen to sixteen years after restoration occurred, soil bulk density and nutrient stocks in RC restorations were not statistically different from that in row crop fields. However, changes in soil bulk density greatly influenced topsoil C and N accrual in all restoration types, and for RC restorations, soil nutrient concentrations were more similar to remnant prairie than concentrations in ROP soil. Furthermore, our results show that land-use has legacy impacts on soil properties, and those are less evident in pastures than in prairie restorations.
Despite similar land use history, remnant prairie exhibited topsoil nutrient accrual rates that were mostly location specific. Wet-mesic remnant prairie experienced a 23% decrease in g C kg−1 soil and a 26% decrease in g N kg−1 soil: the greatest reductions of soil C and N concentrations of any prairie or pasture. Between 2008 and 2018, five summers featured abnormally dry conditions for Midewin, and an additional two years featured moderate drought [65]. Wet-mesic prairie is vulnerable to increased SOC respiration if normally anoxic soil experiences prolonged periods without moisture input [53], but dolomite remnant prairies, which are characterized by shallow alkaline soil that alternates between saturation and extreme dryness, experienced 7% and 17% averaged reductions in g C and N kg−1 soil, respectively. Another factor in nutrient accrual is soil bulk density, which counteracted some of these effects so that one dolomite prairie that exhibited a 6.7% decrease in soil C concentrations gained 107 g C m−2 yr−1. However, most remnants experienced either minimal change or reductions in soil bulk density, which facilitated soil kg C and N m−2 loss and could be due to land management. In a study of over 70 remnant tallgrass prairies, Larson et al. [66] found that grazing increased soil bulk density more than other management types, and it is possible that remnant prairie at Midewin remains affected by the soil compaction caused by grazers present up until 1997. However, Larson et al. [66] reported average bulk densities of approximately 1.0 g cm−3 for grazed remnants and 0.8 g cm−3 for burned, which are consistent with our results where the bulk density at Midewin’s remnants are also lower (Figure 2). Removal of grazing and periodic prescribed burning in remnants decreases soil compaction and promotes organic matter accumulation, which both facilitate decreases in soil bulk density, but soil factors such as drainage that are variable between Midewin remnants play important roles in the rate at which SOM accumulates.
Contrary to expectations, cow pastures that have been maintained for over 50 years (P pastures) did not exhibit negligible rates of topsoil nutrient accrual from 2008 to 2018. Instead, P pastures exhibited the second highest average soil C accrual rate of all land-use histories at 30.5 g C m−2 yr−1. Pastures converted from row crop fields (PC pastures) gained an average of 0.10 kg C m−2, but unconverted P pasture gained over 3 times more (0.32 kg C m−2). Because land management in P pastures has remained stable, P pastures have either experienced a prior depletion of soil C stock or are responding to changes in climate that are altering soil C holding capacity [13]. Soil C accrual in P pastures was driven primarily by increases in soil bulk density in locations near Doyle Lake and its accompanying stream in the SE corner of Midewin (Figure 1), and they may be prone to periodic flooding during wetter periods. Increased soil moisture may facilitate soil compaction in pastures, where effects of freeze–thaw cycles may be counteracted by cow traffic. Nutrient accrual in P pastures could thus be more affected by the environment than other land-use legacies at Midewin. Dry periods that facilitated soil nutrient loss in wet-mesic remnant prairie may also have contributed to soil nutrient gains in pastures. Extreme drought has been shown to increase soil C stocks in experimental manipulations of semi-arid grazed grasslands by reducing decomposition [67]; however, in our study only three drought periods between 2008 and 2013 lasted more than 4 weeks [65], and PC pastures did not exhibit the same rates of nutrient accrual despite similar soil C inputs. Furthermore, the average soil C accrual for PC pastures was reduced by one location that experienced a substantial reduction in soil bulk density (−10.4 g Soil cm−3 yr−1) and a second location that experienced an 11% reduction in g C kg−1 soil. High variation within pastures, in addition to minimal differences in soil nutrient concentrations between PC and P pastures in both 2008 and 2018, indicates that land-use legacy is not relevant for soil nutrient accrual in pastures at Midewin.
Overall, we found no effect on soil C and N stocks from water accumulation. However, it is possible that our measure of water accumulation failed to accurately represent average soil moisture contents in our sampling locations. For example, there are large areas in old pasture restorations (ROP) that are prone to periodic flooding or are saturated year-round under non drought conditions, but ROP has the second lowest water accumulation value of all land-use legacies (Table S1). Water accumulation was calculated from digital elevation models and does not consider factors such as soil texture or drainage tiles, which were removed from ROP sites between 2008 and 2018. Increased soil moisture content in ROP restorations relative to other sampling locations may contribute to the high soil C and N accrual rates present there. O’Brien et al. [4] reported that seasonally saturated prairies accrued SOC 30% faster than nearby mesic prairie; however, they also found that most plant contributions to SOC were from C4 vegetation, and moisture did not interact strongly with C3-derived soil C. Isotopic analysis of ROP topsoil indicates that the majority of SOC is derived from C3 vegetation (Table 4). This also shows that the majority of soil C stock originated prior to restoration planting of C4 vegetation and before soil drainage tiles were removed. Regardless of past soil moisture dynamics, ROP restorations should continue to accrue soil nutrients at an accelerated pace if soil moisture content remains high, but this also may cause SOC in ROP restorations to be vulnerable to increased decomposition during dry periods.

4.2. Soil and Root Nutrient Content Dynamics in Remnants

Tallgrass prairies are typically characterized by large quantities of low-quality SOM. The high lignin and low N content present in prairie grasses facilitates the buildup of plant material in soil that is less accessible to decomposers compared to SOM pools in ecosystems where N availability is less limited [68]. Vegetation adapted to low-N environments typically have higher C:N ratios [69]. However, both restored and remnant tallgrass prairies contained root C:N ratios that are relatively low compared to other prairie sites: remnant prairies from nearby Fermilab in Batavia, IL, contained root C:N ratios averaging 70–75 [46]. Remnant prairies in Illinois typically remained uncultivated because the soil was unsuitable for farming, e.g., large presence of rocks, shallow soil profile, or poor soil drainage. SOM in rocky dolomite prairie is vulnerable to erosion, and so remnant prairies at Midewin may have exhibited less SOM than surrounding prairie prior to cultivation. The removal of drainage tiles from surrounding areas, and the implementation of prescribed burns, directly impact soil processes in Midewin remnants. For example, root N concentration increases were consistent across all remnant sites, except for wet-mesic prairie, which may indicate more soil N has become available for plant uptake. Regardless, root C:N ratios are a reliable indicator of short-term root decomposition [70], and so remnants at Midewin may experience more decomposition and subsequent loss of SOC in the near future.

4.3. Land-Use Legacy Effects in Tallgrass Prairie Restorations

Row crop fields exhibited the greatest average losses of topsoil C and N from 2008 to 2018 (−0.63 kg C m−2, −0.8 kg N m−2), and land-use histories involving row crop agriculture, namely RC restorations and PC pastures, tended to have lower average soil C and N concentrations and higher bulk densities than other land use histories in 2008 and 2018. Bison prairie, which was restored from equal proportions of P pastures and PC pastures, exhibited smaller increases in soil C and N concentrations than P pastures or ROP restorations. These results seem to indicate that land-use histories create ecosystem legacies that impact soil properties during restorations. Row crop soil C and N concentrations were low, even when compared to crop fields in other areas. For example, in annually and biannually tilled agricultural fields in a former wet prairie in Wisconsin, Jelinski and Kucharik [71] reported C and N stocks for the 0–10 cm soil layer ranging from 4.3 to 8.0 kg C m−2 and 0.18 to 4.00 kg N m−2. Row crop fields at Midewin ranged from 1.5 to 2.7 kg C m−2 and 0.11 to 0.25 kg N m−2 including both sampling years. Midewin row crop fields experience less soil disturbance than other agricultural systems because Midewin enacts a no-till policy. However, because of greater levels of topsoil nutrient depletion, legacies of row cropping could have more detrimental effects on soil nutrient accrual during restorations at Midewin. However, our measurements evaluate only the 0–10 cm soil layer, and no-till row crop fields can facilitate soil C accrual in deeper soil layers [46]. Further study is required to ascertain land-use legacy effects on soil C in deeper layers, which may counteract or exacerbate losses in topsoil.
Restoration produced varying effects on topsoil nutrient accrual in ROP and RC prairie restorations. From 2008 to 2018, both restoration types experienced positive rates of soil C accrual. However, ROP restorations contained higher stocks of soil N in 2018 and greater N accrual rates (Figure 4) in addition to a greater average soil C accrual rate than RC and RB land use histories. Notably, RC restorations tended to contain lower root C:N ratios than ROP sites in 2008 despite ROP sites containing a larger proportion of soil C from C3 vegetation (Table 3 and Table 4). This implies that more C3-derived C was accumulated in ROP topsoil relative to RC, and thus ROP restorations may experience lesser rates of SOC decomposition [45]. Additionally, despite RC restoration planting beginning an average of 8 years prior to ROP restoration, soil C stocks in RC and ROP restorations were similar in 2018. In 2008, RC restorations had similar soil C and N stocks to ROP sites even though ROP restoration had not yet occurred. ROP restorations thus effectively had a “head start” of approximately 8 years of soil nutrient recovery compared to RC restorations. Furthermore, it has taken 5–15 years of restoration for RC soil bulk densities to approach remnant prairie levels (Figure 2), but ROP restorations did not differ from remnants in bulk density to begin with. However, while soil bulk density in RC restorations decreased from 2008 to 2018, ROP restoration bulk density increased in all but one sampling location. This increase facilitated high rates of topsoil C and N accrual in ROP restorations. In fact, g C kg−1 soil in RC restorations increased on average twice as much than in ROP, and soil N concentrations increased approximately the same percent. However, average soil bulk density in RC decreased the equivalent of −8.7 g Soil cm−3 yr−1 and facilitated lower kg C and N m−2. The soil nutrient gains in ROP restorations are a combination of moderate increases in nutrient concentrations and moderate increases in soil bulk density, and ROP soil nutrient stocks may be reduced in the future if bulk density begins to decrease there as well.
Our study is limited to a single comparison between two points in time, and we cannot fully capture patterns of soil nutrient accrual within the 10 years between sampling dates. Additional measurements are needed to assess the sensitivity of nutrient accrual to land management practices and climate changes. Furthermore, our statistical analyses were limited by small sample size, but regardless, land-use legacies were apparent within restorations. In 2008, RC restorations contained similar soil bulk density to row crop fields but lower density than remnant prairies, but ROP sites were the opposite: higher bulk density than row crop fields and similar density to remnant prairie soils. In 2018, RC restoration soil bulk density did not differ from row crop fields or remnant prairies, but ROP still differed from row crop fields despite increases in soil bulk density. PC pastures, which also have a history of row crop cultivation, exhibited the same patterns as RC restoration for soil bulk density except that it varied from remnant prairie in 2008 and 2018. Relative changes in soil nutrient concentrations in RC restorations were on average similar or higher than those in ROP; however, this did not translate into greater soil C and N accrual rates. Overall, changes in soil properties occurring in RC restorations better reflect the goals of grassland restoration: recovery of soil from compaction and simultaneous increase in soil nutrient status. It is possible that prairie restorations at Midewin may continue to accrue soil C beyond levels present in the remnant prairies, which contain soil C and N content lower than many other remnant prairie systems (Table S6). Finally, land management may increase topsoil nutrient accrual and enhance soil preservation in restorations by allowing crop land to lie fallow prior to restoration planting. Restoration practices that facilitate soil nutrient accrual will also enhance soil resilience to disturbance and ecosystem sustainability.

5. Conclusions

This study demonstrates that there is a land-use legacy that influences the rate of soil nutrient accrual via impacts on soil physical and chemical properties. Continued restoration of tallgrass prairies will facilitate nutrient recovery of degraded soils in addition to safeguarding the existence of a unique grassland ecosystem. Future work should include measurements of root litter decomposition and soil moisture to explore how climatic effects such as precipitation influence SOC accumulation in these restorations. Continued sampling of these plots, as well as the implementation of long-term ecological experiments, can provide further insight into the impacts of legacy effects on soil C accrual in grassland restorations and will enhance our understanding of how soil nutrient content will be affected by prior land use and changing climate.

Supplementary Materials

The following are available online at https://www.mdpi.com/article/10.3390/land10070735/s1, Figure S1: Digital elevation model of Midewin National Tallgrass Prairie, Table S1: Means and S.E.M.s of elevation (m) and water accumulation (WA; log10) for land-use histories and PERMANOVA F-ratio and p-values for effects on soil carbon and nitrogen, Table S2: Means and S.E.M.s, ANOVA estimates and 95% confidence intervals of 0–10 cm soil bulk density (g cm−3) in 2008 and 2018 for land-use histories, Table S3: ANOVA estimates and 95% confidence intervals of root and soil C:N ratios in 2008 and 2018 for land-use histories, Table S4: ANOVA estimates and 95% confidence intervals of isotopic mixing model results for C3-derived soil C (0–10 cm) for land-use histories, Table S5: FDR-adjusted p-values for pairwise comparisons of PERMANOVA distance matrix for 0–10 cm soil nutrients Ca, Cu, Mn, Zn, K, P, NO3, Mg, Na, and NH4 for land-use histories, Table S6: Means and S.E.M.s of 0–10 cm soil C and N concentrations (g C or N kg−1), stocks (kg C or N m−2), relative change in C and N concentrations (%), and C and N accrual rates (g C or N m−2 yr−1) for land-use histories, Table S7: FDR-adjusted p-values for pairwise comparisons of PERMANOVA distance matrix for 0–10 cm soil C and N concentrations (g C or N kg−1) and stocks (kg C or N m−2) in 2008 and 2019 for land-use histories, Table S8: ANOVA estimates and 95% confidence intervals for 0–10 cm soil C and N concentrations (g C or N kg−1) and stocks (kg C or N m−2) in 2008 and 2018 for land-use histories, Table S9: FDR-adjusted p-values for pairwise comparisons of PERMANOVA distance matrix for relative change in 0–10 cm soil C and N concentrations and C and N accrual rates for land-use histories.

Author Contributions

Conceptualization, B.M.-F., C.J.W. and M.A.G.-M.; methodology, N.G., B.M.-F., C.J.W. and M.A.G.-M.; validation, M.A.G.-M.; formal analysis, N.G.; investigation, N.G., E.M., S.U.; resources, E.D.d.O., M.A.G.-M.; data curation, N.G., S.U.; writing—original draft preparation, N.G.; writing—review and editing, B.M.-F., E.D.d.O., E.M., S.U., C.J.W., M.A.G.-M.; visualization, N.G.; supervision, C.J.W. and M.A.G.-M.; project administration, M.A.G.-M.; funding acquisition, N.G. All authors have read and agreed to the published version of the manuscript.

Funding

This research was funded by US Department of Energy, Terrestrial Ecosystem Science grant to M.A.G-M. (DE-SC0020285); N.G. was funded by the Elmer Hadley Graduate Research Grant, Department of Biological Sciences, University of Illinois at Chicago, and E.M. and S.U. were supported by HSI-STEM grant (#P031C160237) from USA ED., and by the USDA Forest Service at the Midewin National Tallgrass Prairie for maintaining the sites.

Institutional Review Board Statement

Not applicable.

Informed Consent Statement

Not applicable.

Data Availability Statement

Data available upon request.

Acknowledgments

We thank the USDA Forest Service, particularly Jeff Martina, Joseph Wheeler, Joseph Parr, and other Midewin staff for facilitating this research and their assistance in sharing details on the history, management, and native ecosystems of Midewin National Tallgrass Prairie. We thank Bill Glass, formerly of the USDA Forest Service, for providing essential information on restoration ages and management of restored and remnant prairies. We also thank Ricardo Alvarez, Eric Cramer, Alexis Guerrero, Michael Morgan, Michael Ricketts, Tara Rivera, Blanca Zavala, and Hanna Ziyad for their help collecting and processing soil samples.

Conflicts of Interest

The authors declare no conflict of interest. The funders had no role in the design of the study; in the collection, analyses, or interpretation of data; in the writing of the manuscript, or in the decision to publish the results.

References

  1. Samson, F.; Knopf, F. Prairie Conservation in North America. BioScience 1994, 44, 418–421. [Google Scholar] [CrossRef] [Green Version]
  2. Kucharik, C.J.; Fayram, N.J.; Cahill, K.N. A paired study of prairie carbon stocks, fluxes and phenology: Comparing the world’s oldest prairie restoration with an adjacent remnant. Glob. Chang. Biol. 2006, 12, 122–139. [Google Scholar] [CrossRef]
  3. Schilling, K.; Drobney, P. Restoration of Prairie Hydrology at the Watershed Scale: Two Decades of Progress at Neal Smith National Wildlife Refuge, Iowa. Land 2014, 3, 206–238. [Google Scholar] [CrossRef] [Green Version]
  4. O’Brien, S.L.; Jastrow, J.D.; Grimley, D.A.; Gonzalez-Meler, M.A. Moisture and vegetation controls on decadal-scale accrual of soil organic carbon and total nitrogen in restored grasslands. Glob. Chang. Biol. 2010, 16, 2573–2588. [Google Scholar] [CrossRef]
  5. Bengtsson, J.; Bullock, J.M.; Egoh, B.; Everson, C.; O’Connor, T.; O’Farrell, P.J.; Smith, H.G.; Lindborg, R. Grasslands—More important for ecosystem services than you might think. Ecosphere 2019, 10, e02582. [Google Scholar] [CrossRef]
  6. Six, J.; Elliott, E.T.; Paustian, K. Soil macroaggregate turnover and microaggregate formation: A mechanism for C sequestration under no-tillage agriculture. Soil Biol. Biochem. 2000, 32, 2099–2103. [Google Scholar] [CrossRef]
  7. Qu, R.; Han, G. The Grain for Green Project May Enrich the Mercury Concentration in a Small Karst Catchment, Southwest China. Land 2020, 9, 354. [Google Scholar] [CrossRef]
  8. Tisdall, J.M. Possible role of soil microorganisms in aggregation in soils. Plant Soil 1994, 159, 115–121. [Google Scholar] [CrossRef]
  9. Jastrow, J.D. Soil aggregate formation and the accrual of particulate and mineral-associated organic matter. Soil Biol. Biochem. 1996, 28, 665–676. [Google Scholar] [CrossRef]
  10. Foster, B.L.; Murphy, C.A.; Keller, K.R.; Aschenbach, T.A.; Questad, E.J.; Kindscher, K. Restoration of prairie community structure and ecosystem function in an abandoned hayfield: A sowing experiment. Restor. Ecol. 2007, 15, 652–661. [Google Scholar] [CrossRef]
  11. Zylka, J.J.; Whelan, C.J.; Molano-Flores, B. Restoration Implications of Land Management Legacy on Aboveground and Seed Bank Composition of North American Grasslands. Am. Midl. Nat. 2016, 176, 36–59. [Google Scholar] [CrossRef]
  12. Lal, R. Soil erosion and the global carbon budget. Environ. Int. 2003, 29, 437–450. [Google Scholar] [CrossRef]
  13. West, T.O.; Six, J. Considering the influence of sequestration duration and carbon saturation on estimates of soil carbon capacity. Clim. Chang. 2007, 80, 25–41. [Google Scholar] [CrossRef]
  14. Todd, T.C.; Powers, T.O.; Mullin, P.G. Sentinel nematodes of land-use change and restoration in tallgrass prairie. J. Nematol. 2006, 38, 20–27. [Google Scholar]
  15. De Graaff, M.A.; Six, J.; Jastrow, J.D.; Schadt, C.W.; Wullschleger, S.D. Variation in root architecture among switchgrass cultivars impacts root decomposition rates. Soil Bio. Biochem. 2013, 58, 198–206. [Google Scholar] [CrossRef]
  16. Baer, S.G.; Kitchen, D.J.; Blair, J.M.; Rice, C.W. Changes in ecosystem structure and function along a chronosequence of restored grasslands. Ecol. Appl. 2002, 12, 1688–1701. [Google Scholar] [CrossRef]
  17. Sørenson, L.H. Stabilization of newly formed amino-acid metabolites in soil by clay minerals. Soil Sci. Soc. Am. J. 1972, 114, 5–11. [Google Scholar] [CrossRef]
  18. Tisdall, J.M.; Oades, J.M. Organic matter and water-stable aggregates in soils. J. Soil Sci. 1982, 33, 141–163. [Google Scholar] [CrossRef]
  19. Elliott, E.T. Aggregate structure and carbon, nitrogen, and phosphorus in native and cultivated soils. Soil Sci. Soc. Am. J. 1986, 50, 627–633. [Google Scholar] [CrossRef]
  20. Six, J.; Paustian, K.; Elliott, E.T.; Combrink, C. Soil structure and organic matter: I. Distribution of aggregate-size classes and aggregate-associated carbon. Soil Sci. Soc. Am. J. 2000, 64, 681–689. [Google Scholar] [CrossRef]
  21. Trueman, R.J.; Gonzalez-Meler, M.A. Accelerated belowground C cycling in a managed agriforest ecosystem exposed to elevated carbon dioxide concentrations. Glob. Chang. Biol. 2005, 11, 1258–1271. [Google Scholar] [CrossRef]
  22. Neff, J.C.; Townsend, A.R.; Gleixner, G.; Lehman, S.J.; Turnbull, J.; Bowman, W.D. Variable effects of nitrogen additions on the stability and turnover of soil carbon. Nature 2002, 419, 915–917. [Google Scholar] [CrossRef]
  23. Kuzyakov, Y. Sources of CO2 efflux from soil and review of partitioning methods. Soil Bio. Biochem. 2006, 38, 425–428. [Google Scholar] [CrossRef]
  24. Schäfer, D.; Klaus, V.H.; Kleinebecker, T.; Boeddinghaus, R.S.; Hinderling, J.; Kandeler, E.; Marhan, S.; Nowak, S.; Sonnemann, I.; Wurst, S.; et al. Recovery of ecosystem functions after experimental disturbance in 73 grasslands differing in land-use intensity, plant species richness and community composition. J. Ecol. 2019, 107, 2635–2649. [Google Scholar] [CrossRef]
  25. John, K.; Abraham Isong, I.; Michael Kebonye, N.; Okon Ayito, E.; Chapman Agyeman, P.; Marcus Afu, S. Using Machine Learning Algorithms to Estimate Soil Organic Carbon Variability with Environmental Variables and Soil Nutrient Indicators in an Alluvial Soil. Land 2020, 9, 487. [Google Scholar] [CrossRef]
  26. Håkansson, I.; Reeder, R.C. Subsoil compaction by vehicles with high axle load extent, persistence and crop response. Soil Tillage Res. 1994, 29, 277–304. [Google Scholar] [CrossRef]
  27. Peng, X.; Horn, R. Time-dependent, anisotropic pore structure and soil strength in a 10-year period after intensive tractor wheeling under conservation and conventional tillage. J. Plant Nutr. Soil Sci. 2008, 171, 936–944. [Google Scholar] [CrossRef]
  28. Berisso, F.E.; Schjønning, P.; Keller, T.; Lamandé, M.; Etana, A.; de Jonge, L.; Iversen, B.V.; Arvidsson, J.; Forkman, J. Persistent effects of subsoil compaction on pore characteristics and functions in a loamy soil. Soil Tillage Res. 2012, 122, 42–51. [Google Scholar] [CrossRef]
  29. Keller, T.; Colombi, T.; Ruiz, S.; Manalili, M.P.; Rek, J.; Stadelmann, V.; Wunderli, H.; Breitenstein, D.; Reiser, R.; Oberholzer, H.; et al. Long-Term Soil Structure Observatory for Monitoring Post-Compaction Evolution of Soil Structure. Vadose Zone J. 2017, 16, 1–16. [Google Scholar] [CrossRef] [Green Version]
  30. Lal, R. Soils and world food security. Soil Tillage Res. 2009, 102, 1–4. [Google Scholar] [CrossRef]
  31. Hamza, M.A.; Anderson, W.K. Soil compaction in cropping systems. A review of the nature, causes and possible solutions. Soil Tillage Res. 2005, 82, 121–145. [Google Scholar] [CrossRef]
  32. Jabro, J.D.; Allen, B.L.; Rand, T.; Dangi, S.R.; Campbell, J.W. Effect of Previous Crop Roots on Soil Compaction in 2 Yr Rotations under a No-Tillage System. Land 2021, 10, 202. [Google Scholar] [CrossRef]
  33. Dick, R.P. A review: Long-term effects of agricultural systems on soil biochemical and microbial parameters. Agric. Ecosyst. Environ. 1992, 40, 25–36. [Google Scholar] [CrossRef]
  34. Nissen, T.M.; Wander, M.M. Management and Soil-Quality Effects on Fertilizer-Use Efficiency and Leaching. Soil Sci. Soc. Am. J. 2003, 67, 1524–1532. [Google Scholar] [CrossRef] [Green Version]
  35. Barak, P.; Jobe, B.O.; Krueger, A.R.; Peterson, L.A.; Laird, D.A. Effects of long-term soil acidification due to nitrogen fertilizer inputs in Wisconsin. Plant Soil 1997, 197, 61–69. [Google Scholar] [CrossRef]
  36. O’Brien, S.L.; Jastrow, J.D.; Grimley, D.A.; Gonzalez-Meler, M.A. Edaphic controls on soil organic carbon stocks in restored grasslands. Geoderma 2015, 251–252, 117–123. [Google Scholar] [CrossRef] [Green Version]
  37. Donkor, N.T.; Gedir, J.V.; Hudson, R.J.; Bork, E.W.; Chanasyk, D.S.; Naeth, M.A. Impacts of grazing systems on soil compaction and pasture production in Alberta. Can. J. Soil Sci. 2002, 82, 1–8. [Google Scholar] [CrossRef] [Green Version]
  38. Cherubin, M.R.; Carvalho, J.L.N.; Cerri, C.E.P.; Nogueira, L.A.H.; Souza, G.M.; Cantarella, H. Land Use and Management Effects on Sustainable Sugarcane-Derived Bioenergy. Land 2021, 10, 72. [Google Scholar] [CrossRef]
  39. Augustine, D.J.; Frank, D.A. Effects of migratory grazers on spatial heterogeneity of soil nitrogen properties in a grassland ecosystem. Ecology 2001, 82, 3149–3162. [Google Scholar]
  40. Hamilton, E.W.; Frank, D.A.; Hinchey, P.M.; Murray, T.R. Defoliation induces root exudation and triggers positive rhizospheric feedbacks in a temperate grassland. Soil Bio. Biochem. 2008, 40, 2865–2873. [Google Scholar] [CrossRef]
  41. Giese, M.; Gao, Y.Z.; Zhao, Y.; Pan, Q.; Lin, S.; Peth, S.; Brueck, H. Effects of grazing and rainfall variability on root and shoot decomposition in a semi-arid grassland. Appl. Soil Ecol. 2009, 41, 8–18. [Google Scholar] [CrossRef]
  42. Tracy, B.F.; Frank, D.A. erbivore influence on soil microbial biomass and nitrogen mineralization in a northern grassland ecosystem: Yellowstone National Park. Oecologia 1998, 114, 556–562. [Google Scholar] [CrossRef] [PubMed]
  43. Stark, S.; Strömmer, R.; Tuomi, J. Reindeer grazing and soil microbial processes in two suboceanic and two subcontinental tundra heaths. Oikos 2002, 97, 69–78. [Google Scholar] [CrossRef] [Green Version]
  44. Sankaran, M.; Augustine, D.J. Large herbivores suppress decomposer abundance in a semiarid grazing ecosystem. Ecology 2004, 85, 1052–1061. [Google Scholar] [CrossRef] [Green Version]
  45. Leidinger, J.L.G.; Gossner, M.M.; Weisser, W.W.; Koch, C.; Rosadio Cayllahua, Z.L.; Podgaiski, L.R.; Duarte, M.M.; Araújo, A.S.F.; Overbeck, G.E.; Hermann, J.-M.; et al. Historical and recent land use affects ecosystem functions in subtropical grasslands in Brazil. Ecosphere 2017, 8, e02032. [Google Scholar] [CrossRef] [Green Version]
  46. Matamala, R.; Jastrow, J.D.; Miller, R.M.; Garten, C.T. Temporal changes in C and N stocks of restored prairie: Implications for C sequestration strategies. Ecol. Appl. 2008, 18, 1470–1488. [Google Scholar] [CrossRef]
  47. Walker, L.R.; Wardle, D.A.; Bardgett, R.D.; Clarkson, B.D. The use of chronosequences in studies of ecological succession and soil development. J. Ecol. 2010, 98, 725–736. [Google Scholar] [CrossRef]
  48. Baer, S.G.; Bach, E.M.; Meyer, C.K.; Du Preez, C.C.; Six, J. Belowground Ecosystem Recovery During Grassland Restoration: South African Highveld Compared to US Tallgrass Prairie. Ecosystems 2015, 18, 390–403. [Google Scholar] [CrossRef]
  49. Perring, M.P.; De Frenne, P.; Baeten, L.; Maes, S.L.; Depauw, L.; Blondeel, H.; Carón, M.M.; Verheyen, K. Global environmental change effects on ecosystems: The importance of land-use legacies. Glob. Chang. Biol. 2016, 22, 1361–1371. [Google Scholar] [CrossRef]
  50. Van Der Molen, M.K.; Dolman, A.J.; Ciais, P.; Eglin, T.; Gobron, N.; Law, B.E.; Meir, P.; Peters, W.; Phillips, O.L.; Reichstein, M.; et al. Drought and ecosystem carbon cycling. Agric. For. Meteorol. 2011, 151, 765–773. [Google Scholar] [CrossRef]
  51. Inglett, K.S.; Inglett, P.W.; Reddy, K.R.; Osborne, T.Z. Temperature sensitivity of greenhouse gas production in wetland soils of different vegetation. Biogeochemistry 2012, 108, 77–90. [Google Scholar] [CrossRef]
  52. Szafranek-Nakonieczna, A.; Stêpniewska, Z. Aerobic and anaerobic respiration in profiles of Polesie Lubelskie peatlands. Int. Agrophys. 2014, 28, 219–229. [Google Scholar] [CrossRef]
  53. Chen, H.; Zou, J.; Cui, J.; Nie, M.; Fang, C. Wetland drying increases the temperature sensitivity of soil respiration. Soil Bio. Biochem. 2018, 120, 24–27. [Google Scholar] [CrossRef]
  54. Rhoades, C.C.; Eckert, G.E.; Coleman, D.C. Soil Carbon Differences among Forest, Agriculture, and Secondary Vegetation in Lower Montane Ecuador. Ecol. Appl. 2000, 10, 497–505. [Google Scholar] [CrossRef]
  55. Chen, W.; Huang, D.; Liu, N.; Zhang, Y.; Badgery, W.B.; Wang, X.; Shen, Y. Improved grazing management may increase soil carbon sequestration in temperate steppe. Sci. Rep. 2015, 5, 10892. [Google Scholar] [CrossRef] [PubMed] [Green Version]
  56. Geraei, D.S.; Hojati, S.; Landi, A.; Cano, A.F. Total and labile forms of soil organic carbon as affected by land use change in southwestern Iran. Geoderma Reg. 2016, 7, 29–37. [Google Scholar] [CrossRef]
  57. Lucci, G.M. Pastures and drought: A review of processes and implications for nitrogen and phosphorus cycling in grassland systems. Soil Res. 2019, 57, 101–112. [Google Scholar] [CrossRef]
  58. Soil Survey Staff, Natural Resources Conservation Service, United States Department of Agriculture. Web Soil Survey. Available online: http://websoilsurvey.sc.egov.usda.gov/ (accessed on 25 October 2018).
  59. Midwestern Regional Climate Center, Illinois State Water Survey, Prairie Research Institute, University of Illinois at Urbana-Champaign. cli-MATE: MRCC Application Tools Environment. Available online: http://mrcc.illinois.edu/CLIMATE/welcome.jsp (accessed on 31 October 2018).
  60. Soil Survey Staff, Natural Resources Conservation Service, United States Department of Agriculture. Official Soil Series Descriptions. Available online: https://www.nrcs.usda.gov/wps/portal/nrcs/detail/soils/survey/geo/?cid=nrcs142p2_053587 (accessed on 25 October 2018).
  61. R Core Team. R: A Language and Environment for Statistical Computing; R Foundation for Statistical Computing: Vienna, Austria, 2019; Available online: http://www.R-project.org/ (accessed on 24 December 2017).
  62. Tang, Y.; Horikoshi, M.; Li, W. Ggfortify: Unified Interface to Visualize Statistical Result of Popular R Packages. R J. 2016, 8, 478–489. [Google Scholar] [CrossRef] [Green Version]
  63. Benjamini, Y.; Hochberg, Y. Controlling the false discovery rate: A practical and powerful approach to multiple testing. J. R. Stat. Soc. Ser. B 1995, 57, 289–300. [Google Scholar] [CrossRef]
  64. Wickham, H. Ggplot2: Elegant Graphics for Data Analysis; Springer: New York, NY, USA, 2016. [Google Scholar]
  65. National Integrated Drought Information System, U.S. National Integrated Drought Information System NIDIS—Drought.gov—U.S. Drought Portal. United States. 2008. Available online: https://www.drought.gov/about (accessed on 31 October 2018).
  66. Larson, D.L.; Hernández, D.L.; Larson, J.L.; Leone, J.B.; Pennarola, N. Management of remnant tallgrass prairie by grazing or fire: Effects on plant communities and soil properties. Ecosphere 2020, 11. [Google Scholar] [CrossRef]
  67. Munjonji, L.; Ayisi, K.K.; Mudongo, E.I.; Mafeo, T.P.; Behn, K.; Mokoka, M.V.; Linstädter, A. Disentangling Drought and Grazing Effects on Soil Carbon Stocks and CO2 Fluxes in a Semi-Arid African Savanna. Front. Environ. Sci. 2020, 8. [Google Scholar] [CrossRef]
  68. Barber, N.A.; Chantos-Davidson, K.M.; Amel Peralta, R.; Sherwood, J.P.; Swingley, W.D. Soil microbial community composition in tallgrass prairie restorations converge with remnants across a 27-year chronosequence. Environ. Microbiol. 2017, 19, 3118–3131. [Google Scholar] [CrossRef] [PubMed]
  69. Zhang, J.; He, N.; Liu, C.; Xu, L.; Chen, Z.; Li, Y.; Wang, R.; Yu, G.; Sun, W.; Xiao, C.; et al. Variation and evolution of C:N ratio among different organs enable plants to adapt to N-limited environments. Glob. Chang. Biol. 2020, 26, 2534–2543. [Google Scholar] [CrossRef]
  70. Silver, W.L.; Miya, R.K. Global patterns in root decomposition: Comparisons of climate and litter quality effects. Oecologia 2001, 129, 407–419. [Google Scholar] [CrossRef]
  71. Jelinski, N.A.; Kucharik, C.J. Land-use Effects on Soil Carbon and Nitrogen on a U.S. Midwestern Floodplain. Soil Sci. Soc. Am. J. 2009, 73, 217–225. [Google Scholar] [CrossRef]
Figure 1. Aerial photograph of Midewin National Tallgrass Prairie. The heavy black line indicates the boundary of the former Joliet Army Ammunition Plant. Land-use histories are cow pasture (P), cow pasture converted from row crop (PC), row crop fields (C), remnant prairie (REM), bison prairie restored from P and PC pasture (RB), prairie restored from old pasture (ROP), and prairie restored from row crop (RC).
Land 10 00735 g001
Figure 2. Soil bulk density (g cm−3) in 2008 (A) and 2018 (B) by land-use history. Letters represent results of Tukey’s post hoc test on one-way ANOVA, alpha = 0.05. Land-use histories are cow pasture (P), cow pasture converted from row crop (PC), row crop fields (C), remnant prairie (REM), bison prairie restored from P and PC pastures (RB), prairie restored from old pasture (ROP), and prairie restored from row crop (RC).
Land 10 00735 g002
Figure 3. Relative change in g C kg−1 soil and g N kg−1 soil from 2008 to 2018 by land-use history. Red line indicates 0%. Land-use histories are cow pasture (P), cow pasture converted from row crop (PC), row crop fields (C), remnant prairie (REM), bison prairie restored from P and PC pastures (RB), prairie restored from old pasture (ROP), and prairie restored from row crop (RC).
Land 10 00735 g003
Figure 4. Means and S.E.M.s of soil C (A) and N (B) accrual from 2008 to 2018 by land-use history. Land-use histories are cow pasture (P), cow pasture converted from row crop (PC), row crop fields (C), remnant prairie (REM), bison prairie restored from P and PC pastures (RB), prairie restored from old pasture (ROP), and prairie restored from row crop (RC).
Land 10 00735 g004
Table 1. History of land use for 7 land-use histories at Midewin National Tallgrass Prairie. Land uses are for the month of January in the listed year. P is cow pasture, PC is pasture converted from row crop fields, C is row crop fields, REM is remnant prairie, RB is restored bison prairie, ROP is restored old pasture, and RC is restored from row crop fields.
Land-Use Histories199620002004200820122018
PPasturePasturePasturePasturePasturePasture
PCRow cropsPasturePasturePasturePasturePasture
CRow cropsRow cropsRow cropsRow cropsRow cropsRow crops
REMRemnantRemnantRemnantRemnantRemnantRemnant
RBPasture/Row cropsPasturePasturePasturePastureRestoration (bison)
ROPPastureFallowFallowFallowFallow/RestorationRestoration
RCPastureRow cropsRow crops/RestorationRestorationRestorationRestoration
Table 2. Paired t-test results for changes in soil and root properties from 2008 to 2018 in sampling transects at Midewin for 0–10 cm soil layer.
Soil Bulk DensityRoot C:NSoil C:Ng C kg−1 Soilg N kg−1 Soilkg C m−2kg N m−2
T-statistic−0.60.42.9−0.2−1.21.0−0.1
p-value0.60.70.0070.90.20.30.95
95% CI−0.08–0.05−4.9–7.6−1.3–−0.2−3.6–3.0−0.4–0.1−0.1–0.3−0.02–0.02
Table 3. Means and S.E.M.s of root and soil C:N ratios for land-use histories in 2008 and 2018. Land-use histories are cow pasture (P), cow pasture converted from row crop (PC), row crop fields (C), remnant prairie (REM), bison prairie restored from P and PC pastures (RB), prairie restored from old pasture (ROP), and prairie restored from row crop (RC).
Year20082018
Land-Use HistoryRoot C:NSoil C:NRoot C:NSoil C:N
P42 ± 111.4 ± 0.249 ± 312.3 ± 0.6
PC41 ± 412.2 ± 0.240 ± 312.1 ± 0.7
C15 ± 310.6 ± 0.227 ± 213.5 ± 0.4
REM54 ± 411.8 ± 0.238 ± 413.4 ± 0.5
RB42 ± 412.0 ± 0.251 ± 812.3 ± 0.3
ROP52 ± 712.3 ± 0.243 ± 511.3 ± 0.3
RC45 ± 211.7 ± 0.255 ± 912.6 ± 0.5
Table 4. Isotopic ratios of soil δ1⁵N and δ13C, and mixing model results, for land-use histories in 2018. Standard linear mixing model for C3-derived soil C assumed a δ13C of −12.1 for C4 vegetation and a δ13C of −28 for C3 vegetation. Land-use histories are cow pasture (P), cow pasture converted from row crop (PC), row crop fields (C), remnant prairie (REM), bison prairie restored from P and PC pastures (RB), prairie restored from old pasture (ROP), and prairie restored from row crop (RC).
Land-Use Historyδ1⁵Nδ13CC3 Carbon Proportion
P5.31 ± 0.14−24.49 ± 0.340.78 ± 0.02
PC5.72 ± 0.24−23.01 ± 0.380.69 ± 0.02
C6.76 ± 0.08−21.11 ± 0.330.57 ± 0.02
REM4.54 ± 0.88−22.78 ± 0.820.67 ± 0.05
RB5.16 ± 0.27−24.28 ± 0.360.77 ± 0.02
ROP4.97 ± 0.69−25.51 ± 0.650.84 ± 0.04
RC5.84 ± 0.20−22.56 ± 0.600.66 ± 0.04
Table 5. Means and S.E.M.s of soil nutrients (ppm) for land-use histories in 2018. Land-use histories are cow pasture (P), cow pasture converted from row crop (PC), row crop fields (C), remnant prairie (REM), bison prairie restored from P and PC pastures (RB), prairie restored from old pasture (ROP), and prairie restored from row crop (RC).
Land-Use HistoryCaMgPCuMnNaNO3NH4KZn
P48 ± 1884 ± 1111 ± 312 ± 240 ± 441 ± 1252 ± 1830 ± 6286 ± 576 ± 1
PC52 ± 476 ± 1211 ± 19 ± 151 ± 1949 ± 632 ± 118 ± 2200 ± 436 ± 1
C47 ± 2679 ± 177 ± 215 ± 515 ± 751 ± 2333 ± 23 ± 2180 ± 514 ± 1
REM89 ± 18103 ± 515 ± 38 ± 227 ± 473 ± 1241 ± 620 ± 3184 ± 2610 ± 2
RB50 ± 888 ± 1019 ± 98 ± 137 ± 732 ± 841 ± 917 ± 1247 ± 226 ± 2
ROP124 ± 532 ± 720 ± 616 ± 637 ± 686 ± 945 ± 912 ± 2231 ± 1910 ± 1
RC82 ± 1967 ± 1718 ± 414 ± 630 ± 568 ± 623 ± 713 ± 2170 ± 196 ± 1
Table 6. ANOVA estimates and 95% confidence intervals for relative change in 0–10 cm soil C and N concentrations (g C or N kg−1) from 2008 to 2018 and 0–10 cm soil C and N accrual (g C or N m−2 yr−1) for land-use histories. Degrees of freedom are 6 (model) and 20 (residual). P is cow pasture, PC is pasture converted from row crop fields, C is row crop fields, REM is remnant prairie, RB is restored bison prairie, ROP is restored old pasture, and RC is restored from row crop fields.
Response VariableLand-Use HistoryEstimate95% CI
Relative Change in g C kg−1 soilROP (Intercept)−2.68−20.07–14.72
P−2.74−27.34–21.86
PC14.23−12.34–40.80
C4.46−22.11–31.03
REM17.11−6.23–40.44
RB5.75−17.59–29.09
RC−15.39−41.96–11.19
Relative Change in g N kg−1 soilROP (Intercept)6.33−10.97–23.63
P−0.95−27.37–25.48
PC0.07−26.35–26.50
C−34.83−61.25–−8.41
REM−15.8−39.01–7.41
RB−14.09−38.55–10.38
RC3.03−20.18–26.24
g C m−2 yr−1ROP (Intercept)63.119–118
P−32.61−116–51
PC−53.58−137–30
C−124.25−207–−41
REM−73.34−146–−0.37
RB−43.66−121–33
RC−45.81−119–27
g N m−2 yr−1ROP (Intercept)7.022.24–11.79
P−5.99−13.29–1.31
PC−4.74−12.04–2.56
C−14.82−22.13–−7.52
REM−10.44−16.85–−4.03
RB−5.78−12.54–0.98
RC−7.84−14.26–−1.43
Publisher’s Note: MDPI stays neutral with regard to jurisdictional claims in published maps and institutional affiliations.

