Article

Spatial Differentiation and Driving Factor Analysis of Urban Construction Land Change in County-Level City of Guangxi, China

1
School of Architecture and Urban Planning, Nanjing University, Nanjing 210093, China
2
Hualan Design and Consulting Group Company Ltd., Nanning 530011, China
*
Author to whom correspondence should be addressed.
Land 2021, 10(7), 691; https://doi.org/10.3390/land10070691
Submission received: 15 May 2021 / Revised: 23 June 2021 / Accepted: 24 June 2021 / Published: 30 June 2021

Abstract

:
The change of urban construction land is most obvious and intuitive in the change of global land use in the new era. The supply and allocation of construction land is an important policy tool for the government to carry out macro-control and spatial governance, which has received widespread attention from political circles, academia, and the public. An empirical study on the change of construction land and its driving factors in 70 county-level cities in Guangxi, China based on the GeoDetector method reveals the driving mechanism of the construction land change in county-level cities and provides more detailed information and a more accurate basis for county-level city policy makers and decision makers. The study shows a significant heterogeneity in the action intensity and interaction between construction land change and its driving factors in county-level cities, where population and GDP size, transportation, and industrial structure are determining factors. Besides, the factors of fiscal revenue, social consumption, utility investment, and real economy have a very weak action force individually, but they can achieve significant synergistic enhancement effects when coupled with other factors. In the end, urban construction land change at different scales and their driving mechanisms are somewhat different, and it is recommended to design differentiated and precise construction land control and spatial governance policies according to local conditions.

1. Introduction

1.1. Background

The study on land use/cover change (LUCC) and its driving mechanisms is an advanced field of intense scholarly debate in global change research today. Urban land use change is the most significant and intuitive manifestation of global land use change in the urban era, and how to put urban land use change into the same framework or model with economy, society, environment, policy. and politics for an integrated study has attracted the attention of scholars and decision makers [1,2]. According to the UN World Urbanization Prospects, the number of global urban residents surpassed the global rural population in 2009 and the world entered the urban age [3]. In the urban era, the urban construction land change has become a dominant player in global land use change, especially in countries with rapid urbanization and industrialization, where urban construction land change has become a core element of land planning and spatial governance, receiving wide attention from government departments, academic researchers, and the public [4,5].
According to China Statistical Yearbooks 2019, China’s urbanization rate exceeded 50% in 2011, marking the transition from “rural China” to a new era of “urban China”. According to China Statistical Yearbooks 2020, China’s urbanization rate reached 60.6% by 2019, and the “14th Five-Year Plan” proposes to reach 65% by 2025, with an average annual growth of 0.88%. China is still at a rapid pace of urbanization. In the context of “land finance” (where some city governments rely on revenues from the sale of land use rights to support local fiscal expenditures), the change of urban construction land has become the central feature of land use change in the rapid process of urbanization in China, and it has become a key research topic for many subjects such as urban geography, planning, management, economics, and land science to discuss the change of urban construction land quantity and quality [6,7,8,9].
Changes in urban construction land are the result of many factors. To discover the main driving factors with the study of the interactive relationships among them is not only the difficulty and focus of academic research, but also the basis for making urban spatial planning and development policies. In summary, the study of the spatial-temporal change characteristics of urban construction land and its driving mechanism helps to reveal the mechanism of urban land use change and spatial evolution law, and it is of great significance to the improvement of urban land use, the control of construction land scale and its change, the optimization of urban spatial structure, and the achievement of sustainable development of urban society and economy.

1.2. Literature Review

Current studies related to urban construction land and land use changes focus on four areas, that is, monitoring and evaluation, impact analysis, dynamics mechanisms, and planning and control. They can be further divided into eight research directions of simulation analysis of land use changes, suitability evaluation, economic and social impacts, arable land and landscape ecological impacts, driving factors, coupling relationships, planning methods, and planning evaluation. Besides, correlation studies such as comprehensive evaluation models for urban construction land quality and drivers of rural construction land structure evolution have emerged. For example, Cui constructed a model for comprehensive evaluation of urban construction land quality, involving dimensions such as economic quality, social quality, and ecological quality [10]; Huang analyzed the driving factors of the evolution of rural construction land structure during urbanization in China [11]. The detailed analysis is as follows.
First, it focuses on the monitoring and evaluation of land use and its changes. In the field of change simulation analysis, it includes Noszczyk [12] and Cegielska [13], who modeled and statistically analyzed the land use changes in Poland and Hungary, respectively; Li performed simulation analysis of the spatio-temporal changes of construction land in the Chang-Zhu-Tan urban agglomeration, i.e., the movement of the center of gravity [14]; Yao established the classification and regression tree-cellular automata model for urban construction land expansion simulation [15]; Aliani [16] and Karimi [17] built the cellular automata–Markov model for land use monitoring and prediction and conducted a case study; Xiong carried out a simulation study on urban construction land supply and demand [18]. In the field of suitability evaluation, it includes Huang, who offered a comprehensive evaluation of the suitability of urban construction land changes in Nanchang during rapid urbanization [19]; using the Beihu New District of Jining City, China, as a case study, Yan introduced a novel research approach for comprehensive suitability evaluation based on vertical-horizontal processes [20]; Cao proposed a suitability evaluation method for urban construction land in mountainous areas based on the example of Baoxing County, Sichuan, China [21]; Xu took Hangzhou as an example and put forward the evaluation method of urban construction land suitability based on geographical environment factors [22]; Bozdag [23], Ustaoglu [24], and Zhang [25] evaluated and analyzed the suitability of urban construction land in Cihanbeyli and Pendik District of Turkey and Hefei of China using GIS tools, respectively.
Second, the analysis focuses on the impact of land use and its changes. In the field of economic and social impact research, Xie [26] believes that urban construction land expansion has a positive effect on China’s regional economic development; Wang points out that decreased urban construction land will have a negative impact on the regional labor market [27]. In the field of Arable land and landscape ecological impact research, Guo argues that urban construction land expansion leads to the reduction of cultivated land, and has a greater impact on landscape pattern [28]; Aneseyee [29,30,31] and Sadat [32] hold that land use change has a significant ecological effect, affecting the value of ecosystem services, especially land-use intensity, population density, elevation, and slope, which are significantly correlated with the distribution of habitat quality; Li believes that the change of urban construction land has a great impact on carbon emissions [33].
Third, the analysis focuses on the dynamic mechanism of land use and its change. In the field of driving factor research, it includes Jin, who believes that non-agricultural industry development, land resource scarcity, population growth, economic extroversion, and domestic capital have different effects on NCL at different stages of development [34]; Yu pointed out that the social economy, science and technology, and the management system are major driving factors of green use efficiency of urban construction land [35]; Wang argues that the level of indebtedness, especially new debt, positively drives the efficiency of urban construction land use [36]; Liu, based on the analysis of panel data, holds that capital, labor, and land investment all contributed to the non-agricultural GDP growth have an important impact on China’s construction land allocation efficiency [37]; Ye found that several site factors, including landscape types and the distances to roads, coastlines, or city centers, had significant impacts on the expansion of construction land, influencing the direction, scale, and intensity of the expansion [38]. In the field of coupling relationship research, Li found there is a long-term bidirectional causal relationship between urban land expansion and economic and population growth [39]; Zhou revealed the coupling relationship between urban construction land expansion and PM2.5 [40]; Cai [41] and Li [42] analyzed the coupling relationship between construction land and spatial-temporal changes of mobile population and economic development level during the rapid urbanization in China; Yang studied the coupling relationship between urban construction land expansion and changes of the urban heat island effect [43]; He analyzed collaborative optimization of rural residential land consolidation and urban construction land expansion [44].
Finally, the analysis focuses on land use planning and control. In the field of planning method research, Zhu put forward an ecological planning method for urban construction land based on comprehensive benefits [45]; Zhu analyzed the conflicts and compromises of governments at different levels in construction land planning decisions [46]; Tang analyzed the countermeasures for benefit distribution in the coordination of construction land changes [47]. In the field of planning evaluation research, Zhou evaluated the effectiveness of annual land use plan and land use master planning in controlling the growth of urban construction land [48,49].
Although a wealth of research results on urban construction land change has now been achieved, there are still three shortcomings. Our thoughts and comments are as follows.
First of all, in terms of research methods, emphasis is placed on the analysis of the influencing factors and the strength of their forces, while there is a lack of research on the interaction effect of factors. Existing papers mainly rely on socio-economic and land use change data to carry out correlation, regression, and simulation analyses with the help of remote sensing and GIS tools [50,51]. In most papers, regression analysis, hierarchical analysis, cluster analysis, the conversion of land use and its effects at small regional extent model, the two-regime spatial Durbin model, and the cellular automata model are employed to analyze the change of construction land and its influencing factors. The change of construction land is influenced by many factors in a complex way, and the joint force of the factors is not equal to the sum of forces of individual factors. However, there is still a lack of research on their interaction effect in existing papers.
In addition, on the research scale, research mainly focuses on internationalized large cities or urban agglomerations, while paying little attention to small and medium-sized cities or less-developed cities. Small and medium-sized cities are numerous and occupy an important place in the regional town system; however, the present studies mainly focus on large cities [52] (such as Shanghai [53], Ningbo [54], Chongqing [55], etc.), cities in developed coastal areas [56,57], and city clusters [58,59], and the research on small and medium-sized cities at the county and town level, especially in the underdeveloped western region, is very insufficient. The spatial heterogeneity of large-medium-small-sized and prefecture-county-town-level cities and their driving mechanisms differ significantly under the influence of scale effect. To improve the applicability and accuracy of the present research findings, a multi-scale empirical study is urgently needed.
Last but not least, in terms of research perspectives, most papers are case studies of individual cities or city clusters, and there are fewer on comparative analysis of differences between cities and studies on spatial-temporal coupling. There are significant differences in the scale of construction land and its changes in different cities, which characterize the spatial differentiation of the region under the comprehensive action of multiple factors such as economy, society, politics, and ecology in the region. Analysis based on time series data is often hard to explain the effects of spatial heterogeneity on land use change. Studies dedicated to exploring the spatial heterogeneity of urban construction land and its driving mechanisms from a spatial perspective have just emerged at present, and only Li [60,61], Huang [62], Xie [63], and Zhu [64] have conducted exploratory studies on the spatial and temporal differences of urban construction land and their driving factors in prefecture-level cities and poor counties as well as special geographical areas such as the Loess Plateau.

1.3. Aim and Question

The different resource endowments, planning, and positioning lead to a significant difference in the urban construction land scale and its changes. It is helpful to gain full knowledge of the urban spatial change law and provide an important basis for the development of land use planning and spatial governance policies by clarifying the difference and further analyzing its influencing factors and driving mechanisms from a spatial perspective. This study is dedicated to exploring the following questions: What are the differences in the scale of construction land and its changes in county-level cities? What are the dynamic evolution characteristics of construction land change against the background of the new urbanization policy and the strategy of “big county” (Guangxi provincial government increasing investment in county-level cities to promote the rapid expansion of their population and land area)? What are their driving forces? Answers to the above questions have a profound theoretical and practical significance for finding out the spatial distribution and scale changes of construction land in county-level cities, promoting the precise supply of land and its effective distribution in different cities, and speeding up the urbanization and even modernization of counties. Therefore, based on the case study of 70 counties in Guangxi, this paper conducted an empirical study on the characteristics and driving forces of construction land change from 2015 to 2019 by the GeoDetector and GIS analysis methods, providing a basis for policy makers and decision makers to know the complexity of dynamic changes in construction land and to establish a precise land supply mode and a spatial distribution pattern that meet the high-quality development requirements.

2. Research Design

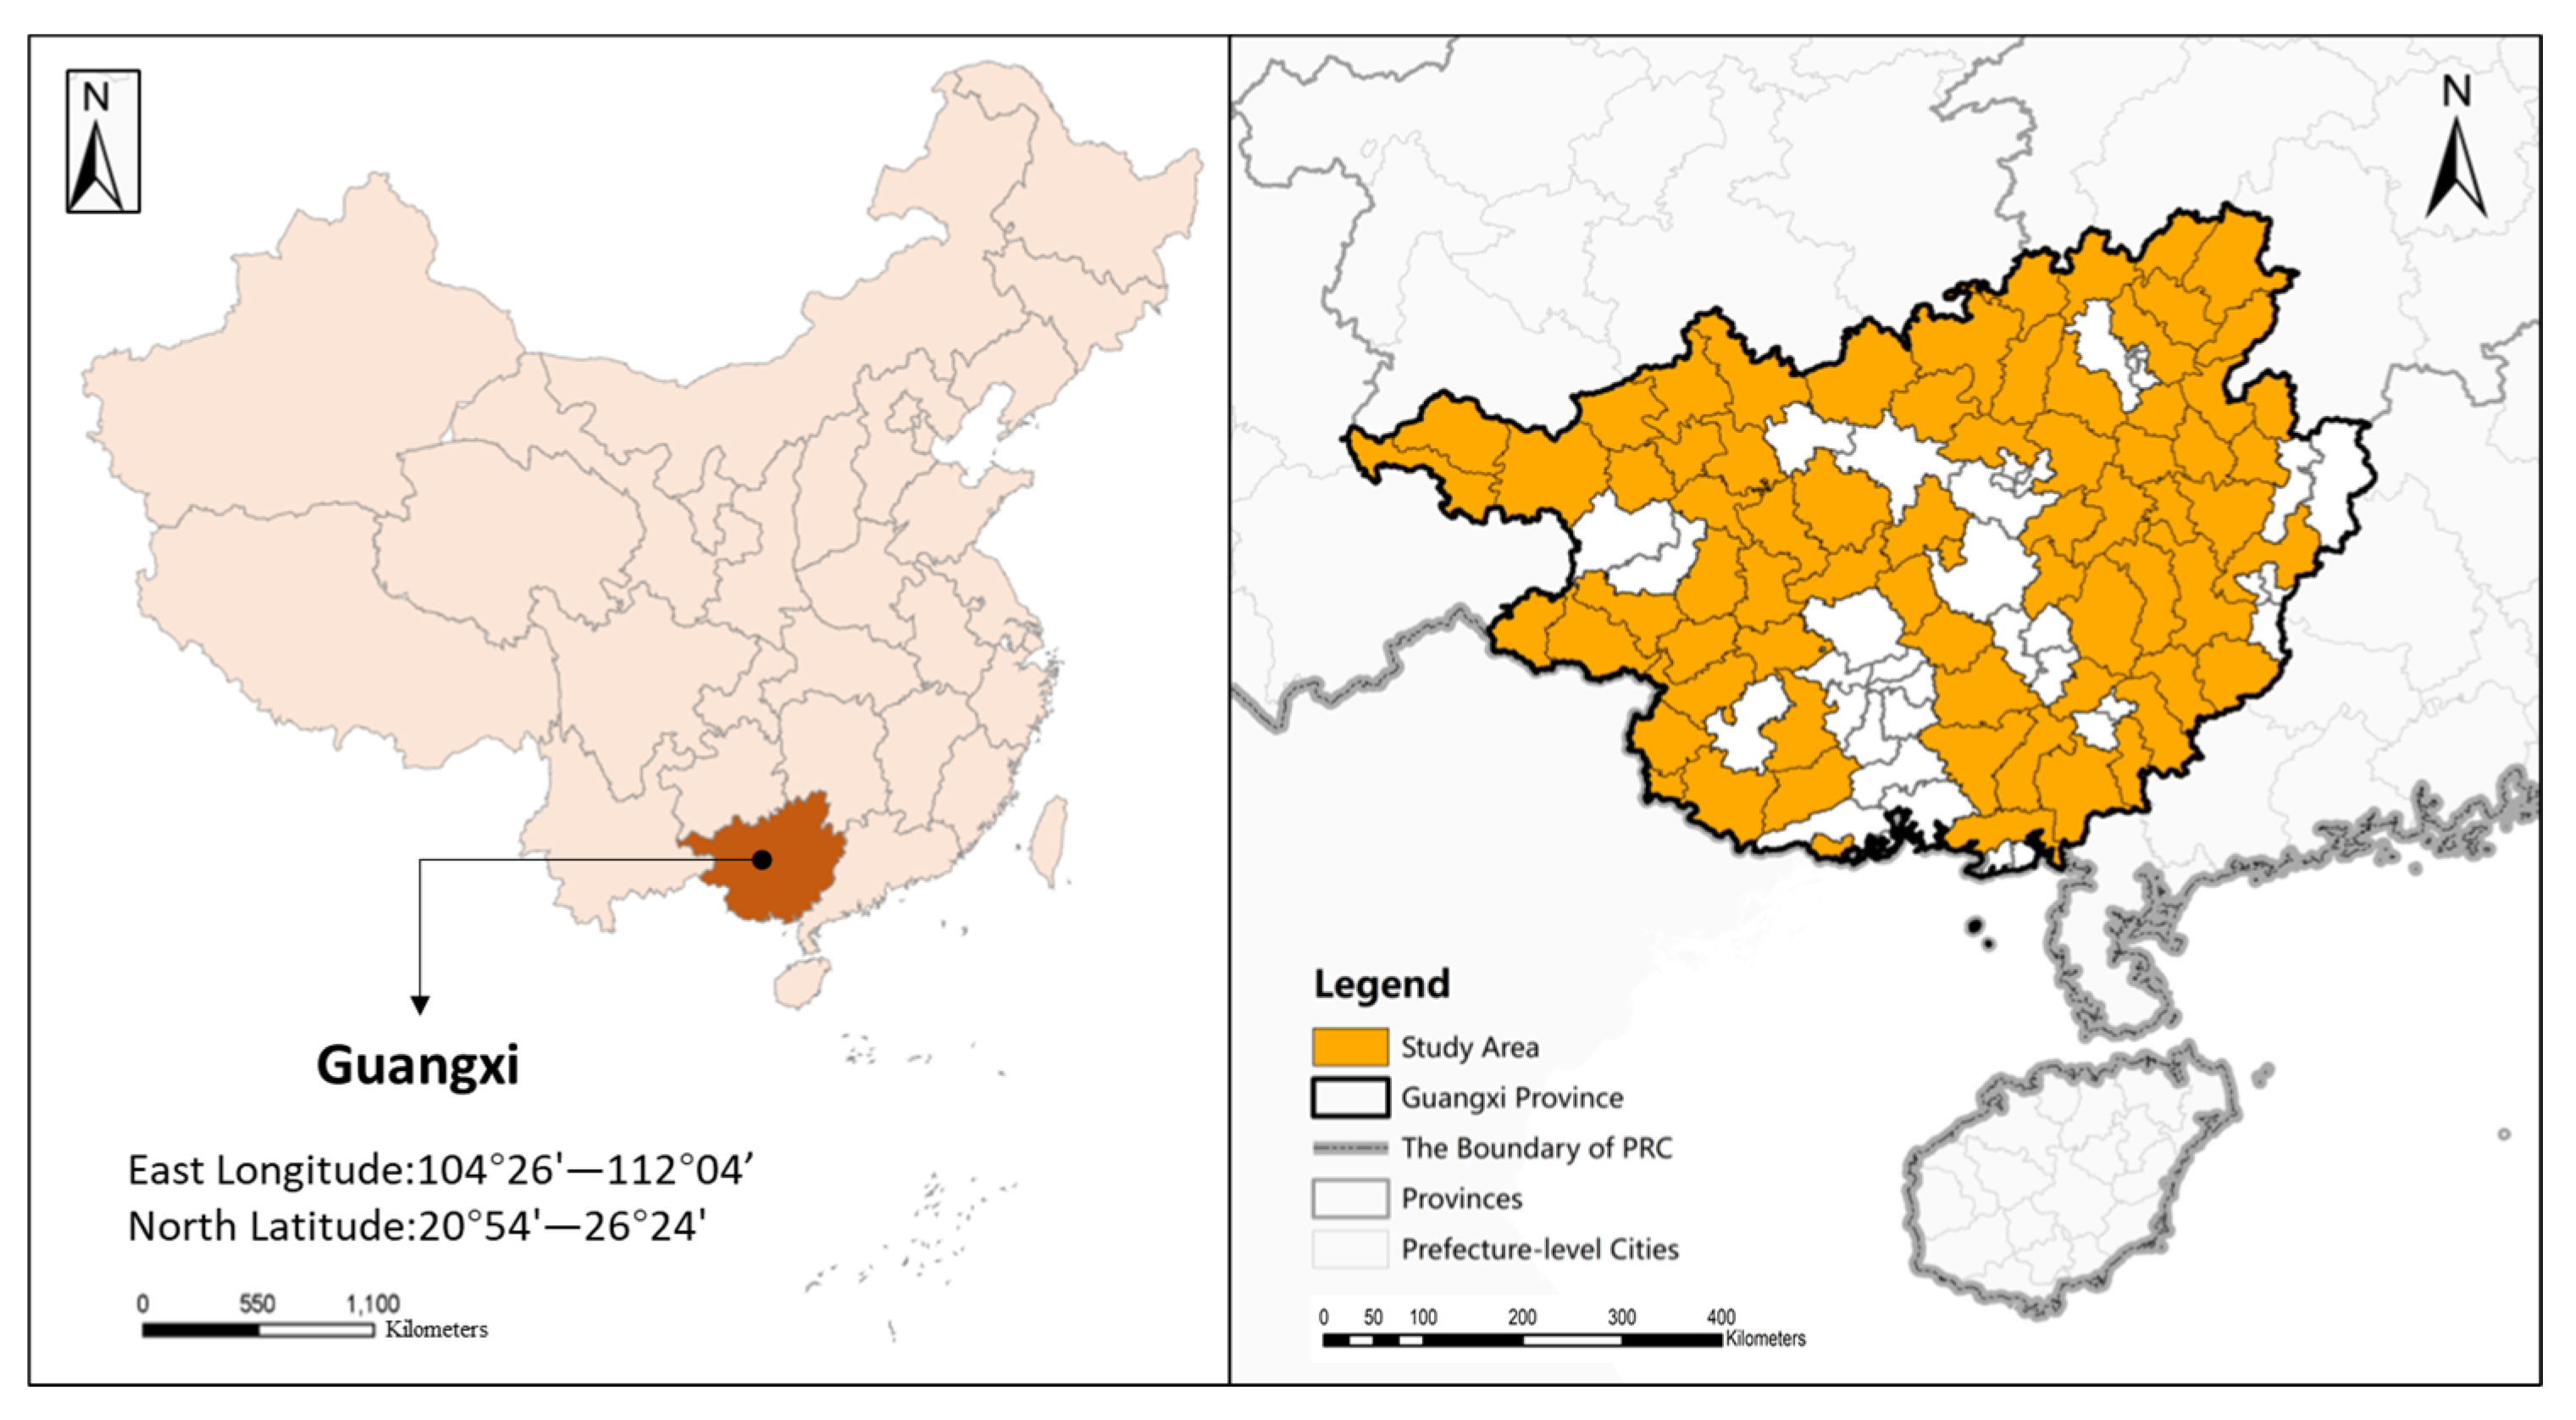
2.1. Study Area: Guangxi

In recent years, Chinese governments at all levels have attached great importance to the development of county-level cities, taking them as a critical space carrier for new approach to urbanization. Therefore, they have promulgated and implemented a series of plans and policies to support the development of county economy and the construction of county seats. The central government of China promulgated the “National New-type Urbanization Plan (2014)” and “Some Opinions on Further Promoting the Construction of New Urbanization (2016)”, clearly proposing to accelerate the development of county-led small and medium-sized cities. With the “Several Opinions on Innovation-Driven Development of the County” plan implemented in 2017, the policies have been increasingly focused and specialized. At the local government level, provincial and municipal governments have made their own special policies for county development such as the “Guidelines of Sichuan Province on Promoting High-Quality Development of County Economy”, the “Opinions of Hunan Province on the Development of County Economy and Strong Counties”, and the “Opinions of Qinghai Province on Further Supporting the Development of County Economy”, besides introducing local plans for new-type urbanization in succession.
In recent years, local governments at all levels in Guangxi have attached great importance to the development of county-level cities and implemented a series of policies to support the construction of counties and the development of county economy on the basis of the national strategic deployment, which are very typical and representative. In 2014, the “Guangxi New-type Urbanization Plan” was promulgated and implemented, clearly proposing to “implement the strategy of building large counties”. The Guangxi Provincial Government then promulgated and implemented special policies such as “Opinions on Implementing the Strategy of Building Large Counties to Improve the County Urbanization Development”, “Decision on Accelerating County Economy Development in Guangxi”, “Opinions on Strengthening the Classification and Assessment of County Economy Development”, and the “13th Five-Year Plan” for county economy development in Guangxi, and established detailed plans for implementation of key tasks in six areas, that is, characteristic agricultural demonstration zones, industrial parks, tourism, characteristic small towns, financial support, and fiscal system reform.
This paper studies 70 county-level cities of Guangxi, located in the western region of China (see Figure 1). County-level cities are the basic units on which Guangxi is based for economic and social development and town construction, covering an area of 76% of the total land of Guangxi with more than 65% of the local population and more than 40% of the local gross domestic product (GDP). In 2015, urban construction land in Guangxi covered an area of 1844 km2, including 683 km2 in county-level cities, while it was 2178 km2 in 2019, including 809 km2 in county-level cities. From 2015 to 2019, urban construction land in Guangxi increased by 335 km2 in area, including 126 km2 in county-level cities. County-level cities maintained about 37% of Guangxi’s total in the current value and change of construction land area from 2015 to 2019, playing an important role in the urbanization construction and the county economy development in Guangxi.
The studies on land use and cover change in Guangxi and their impacts have attracted the attention of scholars, including the evaluation of land use and cover change in Guangxi [65], the construction land pattern in the Xijiang River basin [66], and the interaction between land use and karst [67]. However, there is still a lack of research on the spatial differentiation of urban construction land in Guangxi and its changes, and the size of the driving forces and their interactions have not been effectively identified and quantified for characterization.

2.2. Research Methods

The GeoDetector, created by Professor Wang Jinfeng in 2010 and constantly improving, is an emerging statistical method to detect spatial heterogeneity and reveal its influencing factors [62]. With the characteristics of clear principle, defined meaning, broad application conditions, and nonlinear mechanism, this method has been widely used in many natural and humanities disciplines including geography, sociology, economics, ecology, environmental science, landscape science, planning science, and even medicine [68]. There have been papers based on the GeoDetector method at present in the field of land use and cover research [62,69,70,71] to explain the spatial divergence and spatial-temporal evolution characteristics of land use and their driving factors. The GeoDetector offers four functions of factor detection, interaction detection, risk detection, and ecology detection (http://www.geodetector.cn, accessed on 7 April 2021), and in this paper the first two functions are used to study the size of the force of influencing factors and their interaction effects on land use changes in county-level cities. That is, with the urban construction land area used as the dependent variable Y i and the driving factor-related index as the independent variable X i , factor detection and interaction detection were performed based on the GeoDetector. The results fed back by factor detection are q i and p i . The former represents the strength of the explanatory power of X i on Y i with a value range of [0, 1], and a larger value indicates a stronger explanatory power; the latter represents the significance condition, and 0.05 or 0.01 is generally taken. Interaction detection feeds back the interaction between driving factors, that is, it detects whether the results of X i and X j acting together are enhanced or weakened, or if they are independent of each other. It is classified into five types according to the strength of the interaction effect (see Table 1) [68,72].
The urban construction land in this article is consistent with the “Urban Land Classification and Planning and Construction Land Standard” (GB50137-2011). Urban construction land is a general term for residential land, land for public administration and public services, land for commercial service facilities, industrial land, land for logistics and warehousing, land for transportation facilities, land for public utilities, green space, and land for special purposes within cities and towns where the county government is located, excluding waters and other land areas. The data mainly comes from the Guangxi Urban Construction Yearbook and Guangxi Statistical Yearbook, and individual missing data comes from statistical yearbooks, statistical bulletins, and government work reports of provinces and cities.

2.3. Index Selection
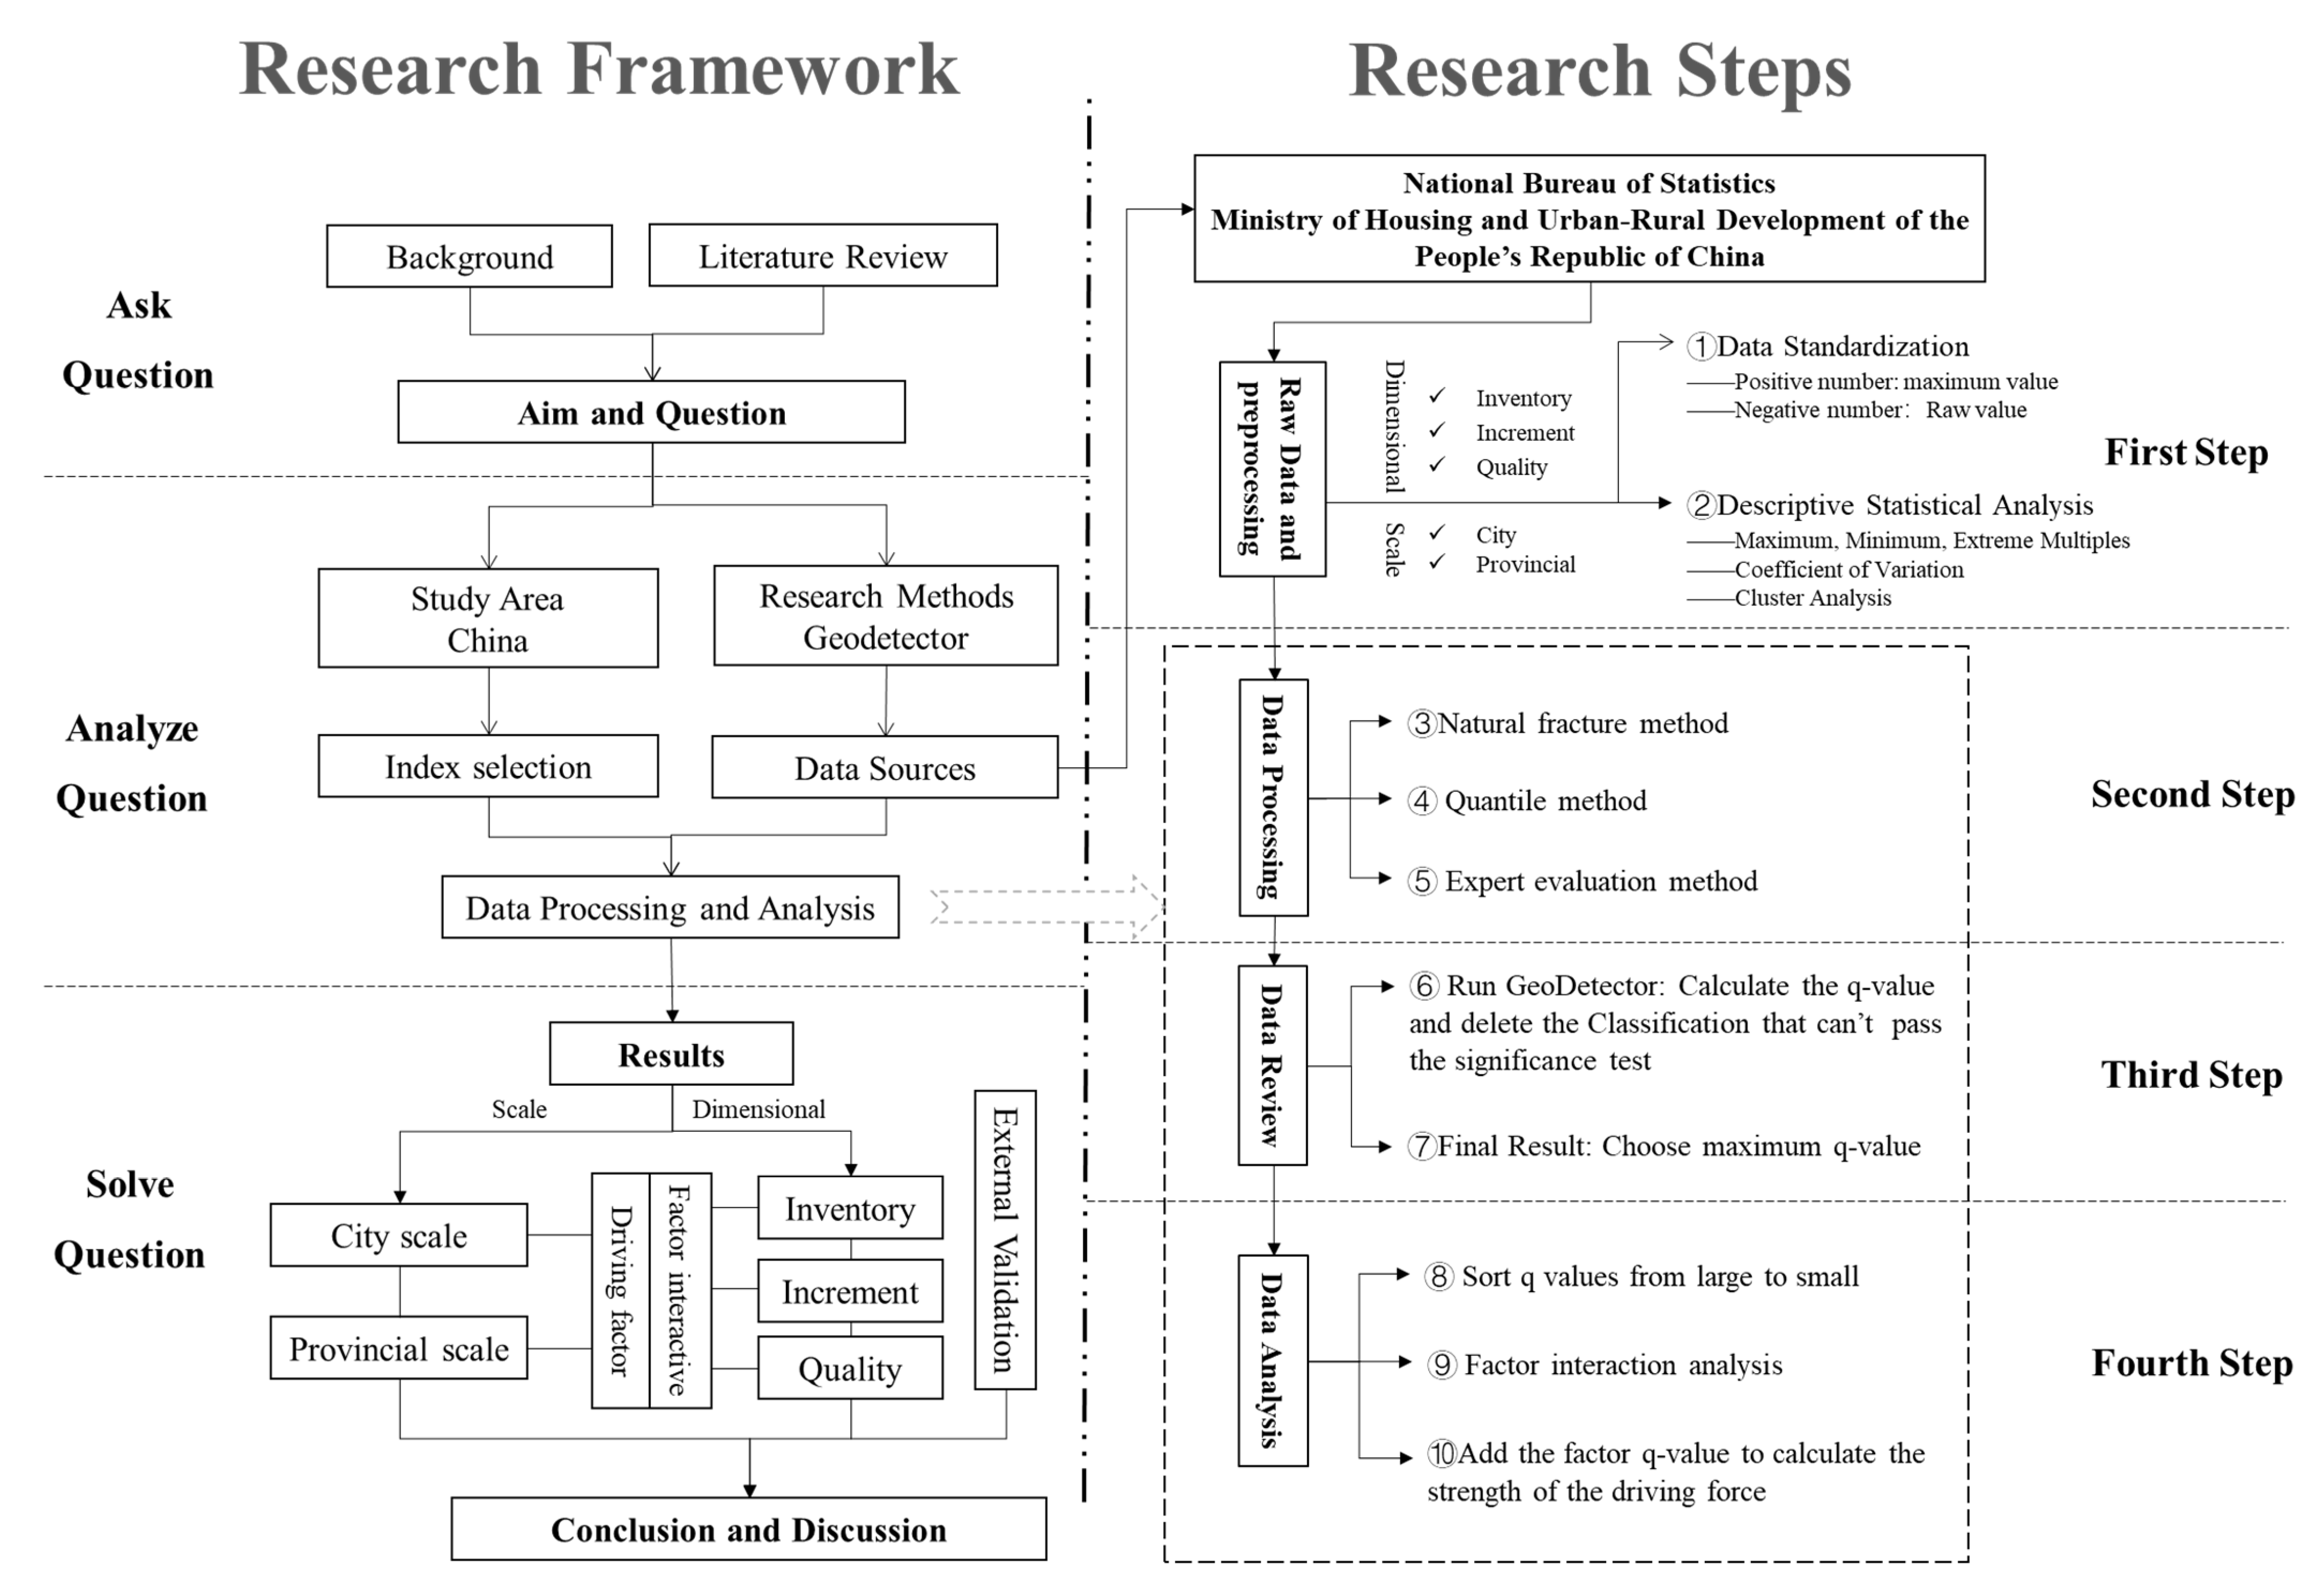
The study was conducted between 2015 and 2019. The latest data were available in 2019, while in 2015 the data were mainly affected by the implementation time of the development planning and supporting policies of counties in China and Guangxi. In 2014, the central government promulgated the national new urbanization plan, explicitly increasing investment in county seat construction. In the same year, the “Guangxi New-type Urbanization Plan” took effect, clearly proposing to “implement the strategy of building large counties”. In 2015, the starting year to implement the “13th Five-Year Plan”, the national and Guangxi governments introduced a series of new policies to support the development of the counties during the implementation of the “13th Five-Year Plan”. Based on comprehensive consideration of the time of policy promulgation, performance lag, and data availability and comparability, the study base period was set to 2015.
Urban construction land change is the result of a combination of economic, social, and investment factors, and it is highly complex and uncertain. Identifying the main influencing factors and quantifying the interaction effects between the measured factors are keys to revealing the driving mechanisms of urban construction land change. According to the studies by Wu [73], Qu [74], Zhao [75], and Liu [76], economic and social development, population and investment growth, industrial structure adjustment, policy planning and guidance, and ecological and environmental constraints are the dominant factors affecting the change of urban construction land, and appropriate indexes must be selected from them as independent variables for analysis.
According to the review of literature, the common indicators as independent variables include population and GDP size, tertiary industrial structure, urbanization rate, fixed asset investment, residents’ income level, transportation accessibility, GDP per capita, import and export trade volume, actual utilization of foreign capital, fiscal revenue and support, employed population, R&D, and policies and institutions; common indicators as dependent variables are total urban construction land area, population carried per unit area, GDP or tax revenue output per unit area, and jobs created per unit area. By further statistical description and qualitative and quantitative analysis, we can find the relationship between these independent and dependent variables. In this paper, the dependent variable Y i is the construction land area of each county-level city in Guangxi in 2015 and 2019; the independent variables X i are 16 indexes taken from five drivers: population, economy, investment, industry, and society (see Table 2). It should be noted that due to a great lack of environmental data and the difficulty in quantifying policy data, such indexes were dropped during the selection of independent variables to ensure the objectivity and accuracy of the analysis results.
It is worth noting that X 17 is significantly different from other indicators. X 17 is a comprehensive index, and the value of accessibility is determined based on the comprehensive evaluation of urban location and traffic conditions. Location conditions are determined based on the distance, including the distance from the county government to the central city government, coastline, and border. The distance is estimated by the measurement tool of Baidu Map. The evaluation of traffic conditions comprehensively considers high-speed railways, railways, expressways, national highways, and provincial highways. Including opening time, mileage, and site construction. The 2015 and 2019 “Guangxi Traffic Map” and “Guangxi Comprehensive Transportation Development Plan” are the most important evidence for evaluation.

2.4. Research Steps

There are four steps and nine key points mainly involved in the research (see Figure 2), which are detailed as follows.
The first step is “Raw Data and Preprocessing”. ① Prepare a complete table of raw data with the data released by the relevant statistical websites, and for missing data, acquire them by consulting the departments concerned by telephone. If there are too many missing data on the indicator, choose a substitute indicator or abandon the indicator. For example, we replaced the road area with the road length during data processing and gave up the initially selected indicator of temporary population. ② Discrete the continuous data of the independent variables using Python and divide the data of 70 county-level cities into 2–15 categories by natural breaks to eliminate artificial influence.
The second step is “Data Processing”. ③ Calculate the maximum, minimum, average, standard deviation, coefficient of variation (low accuracy), and Gini index (high accuracy) of the dependent variables and their changes with Excel to measure the spatial heterogeneity of construction land. ④ Conduct spatial clustering analysis and kernel density analysis of dependent variables and their changes using GIS. ⑤ Import the raw data of the dependent variable and the discretized data of the independent variable into the GeoDetector to calculate the analysis results.
The third step is “Data Review”. ⑥ Compare and select discretization schemes for independent variables based on q i and p i in the factor detection results. At the same level of significance, the scheme with the largest q i is taken as final. The significance test p i in this paper is based on 0.01, and a more stringent significance test is measured, such as 0.001, is adopted in preference where reasonable.
The 4th step is “Data Analysis”. ⑦ Determine the explanatory power of the independent variables by ranking them according to the value of q i . ⑧ Analyze the interaction effect of the driving factors based on interaction detection results. ⑨ Calculate the average of the independent variables q i that have passed the significance test as the representation of the intensity of the five driving forces to further reveal the driving mechanisms and policy insights of construction land change in county-level cities.

3. Results

3.1. Differentiation Analysis

Due to the different development stages, resource endowment, and location conditions, the area of construction land and its changes in county-level cities of Guangxi show significant heterogeneity. Table 3 shows that in 2015, Hepu County had the largest area of urban construction land (29.39 km2) and Jinxiu County had the smallest (1.08 km2), with a difference of about 28 times. In 2019, the largest county in urban construction land area was Guiping (37.38 km2) and the smallest was Jinxiu (1.42 km2), with a difference of about 26 times. According to statistics, the coefficient of variation indicates the degree of variation in the study sample and shows the level of sample heterogeneity. According to the study of Guan [77], Zhang [78], Ruan [79], Liu [80], Miyamoto [81], and She [82] et al., the heterogeneity is divided into categories of weak, medium, and strong by the coefficient of variation. That is, when the coefficient of variation is 0–0.15, the heterogeneity is weak, when it is 0.16–0.35, the heterogeneity is medium, and when it is greater than 0.36, the heterogeneity is strong. The coefficient of variation of urban construction land area increased from 0.69 in 2015 to 0.74 in 2019, much larger than 0.36, showing high heterogeneity.
There was a large spatial heterogeneity in the change of industrial land in county-level cities of Guangxi from 2015 to 2019. The largest area growth happened in Hengxian County (16.48 km2), while the largest area contraction happened in Yongfu County (−2.45 km2), with a high coefficient of variation of 1.30, showing high heterogeneity. It is worth noting that Lingchuan County, Guanyang County, Zhaoping County, and Yongfu County experienced a negative growth, but it was minor in size, which may be the result of urbanization and the transformation of poverty alleviation policies.
The quantile-based spatial clustering analysis in GIS shows significant spatial differentiation in construction land and its changes in county-level cities of Guangxi (see Figure 3). By comparing the results of clustering analysis in 2015 and 2019, it was found that the spatial distribution of construction land in county-level cities of Guangxi was generally in a stable pattern in 2015 and 2019, with “High” counties mostly distributed in the southeast region of Guangxi, “Medium” counties concentrated and contiguous in the central region, and “Low” counties mainly found in the northwest and northeast regions. Moreover, the spatial pattern of construction land changes in county-level cities of Guangxi from 2015 to 2019 also showed similar regularity, and the spatial distribution was more concentrated.

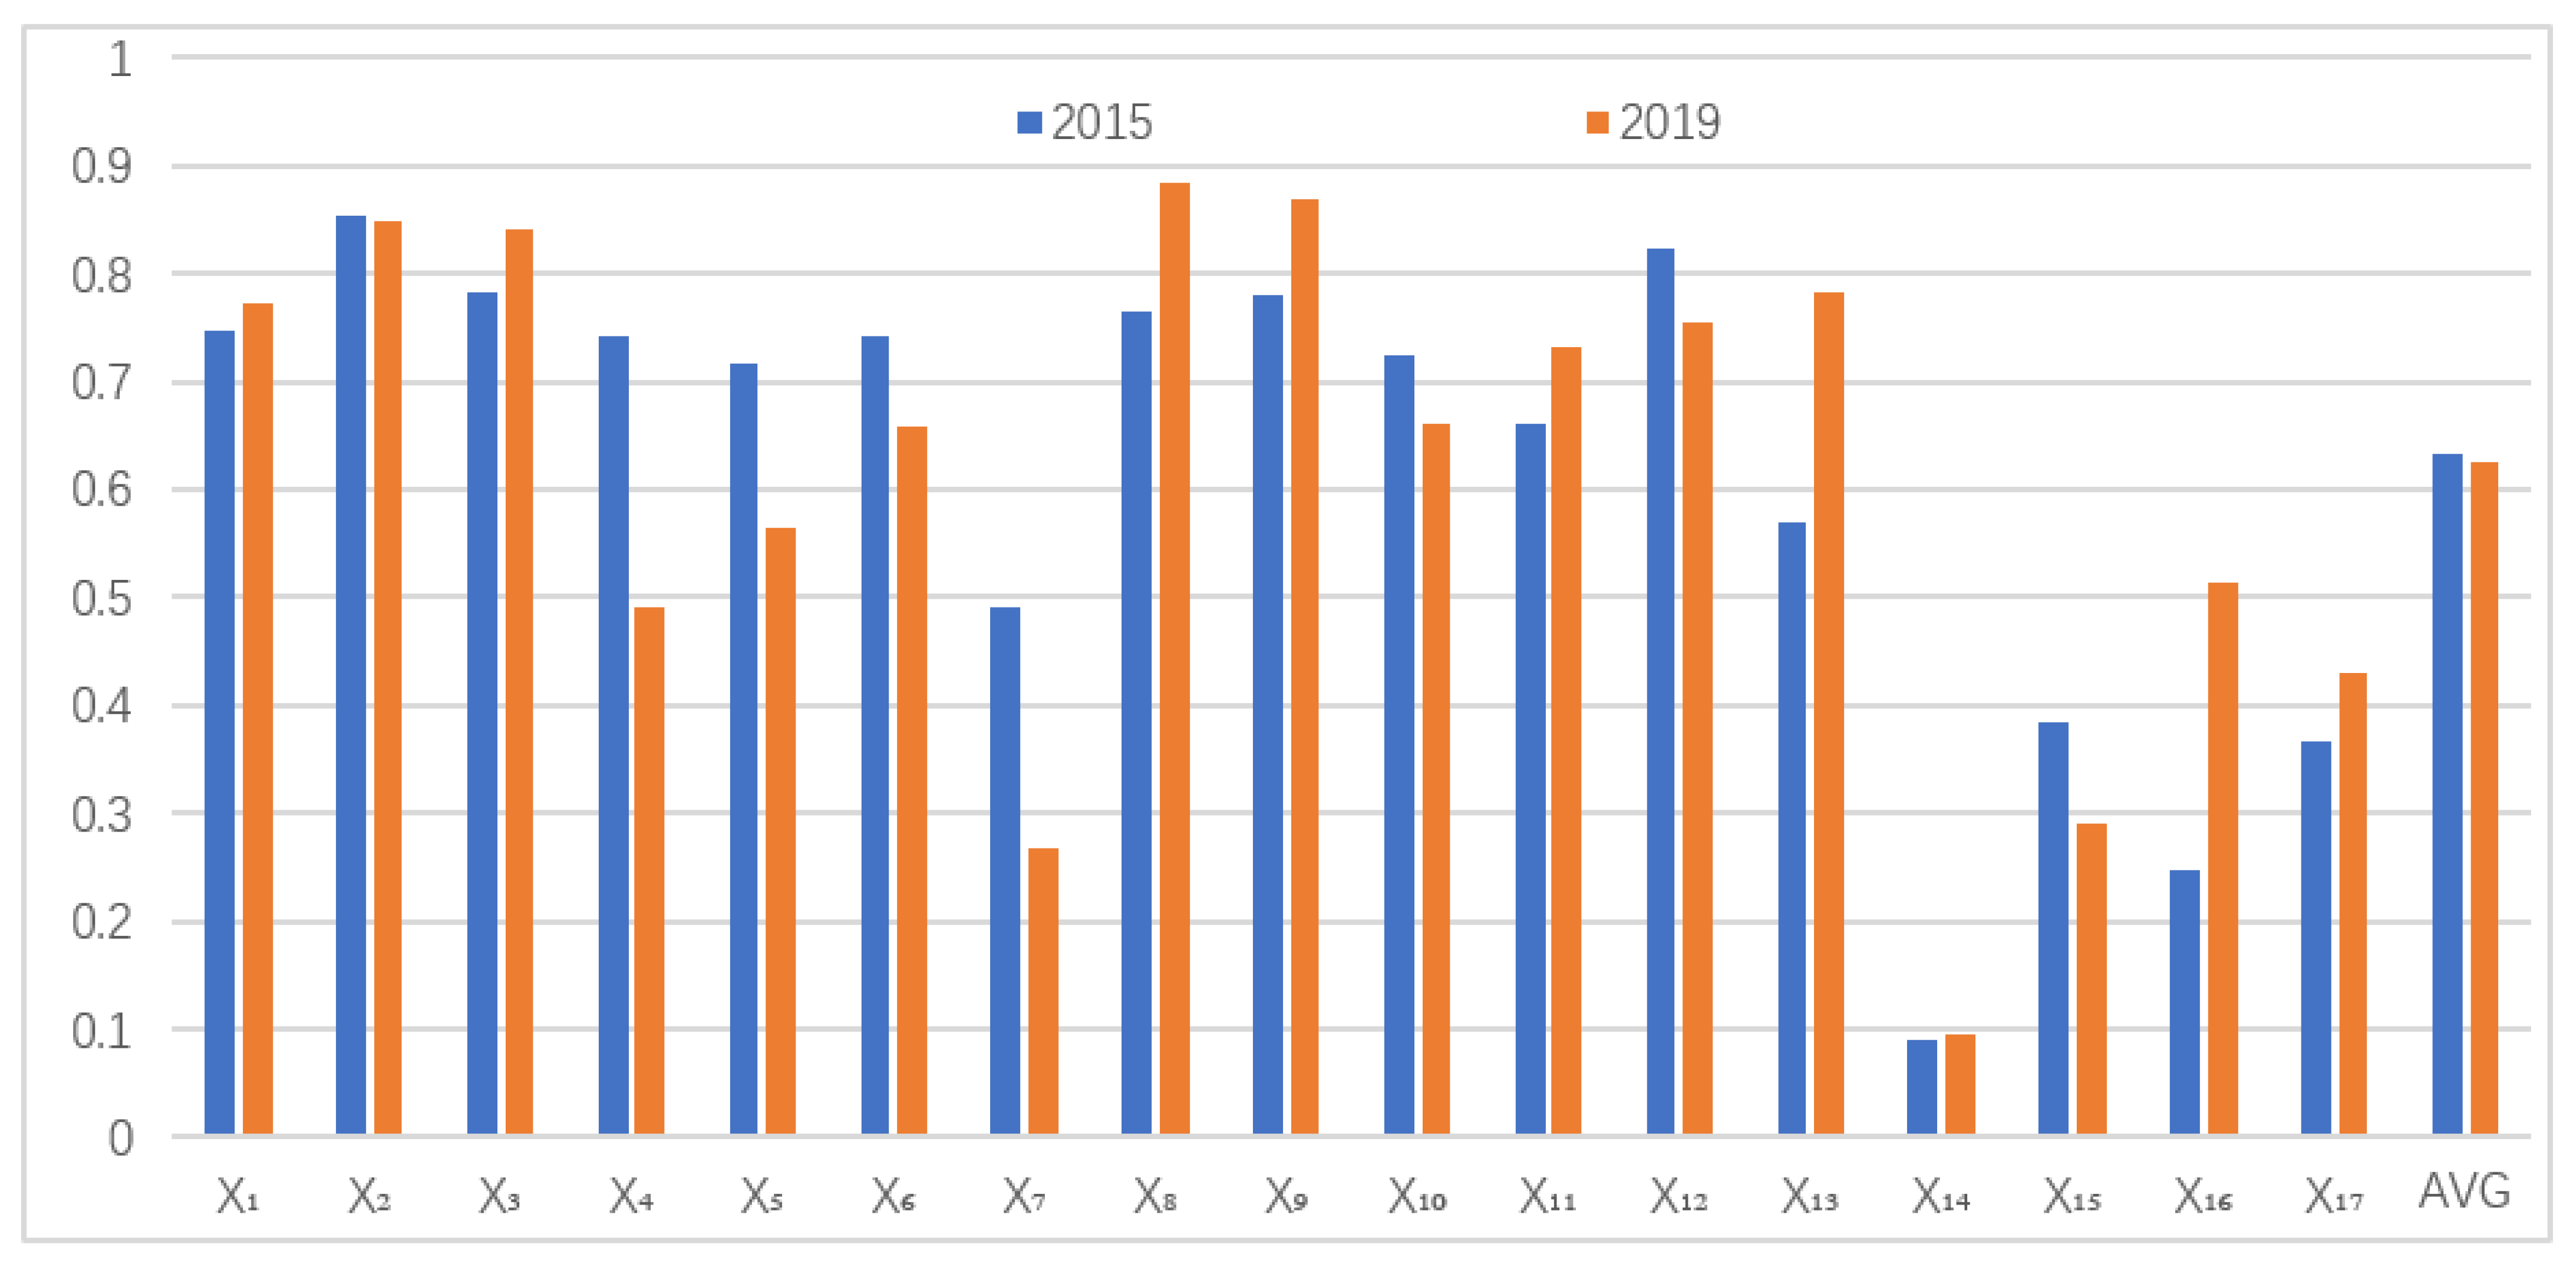
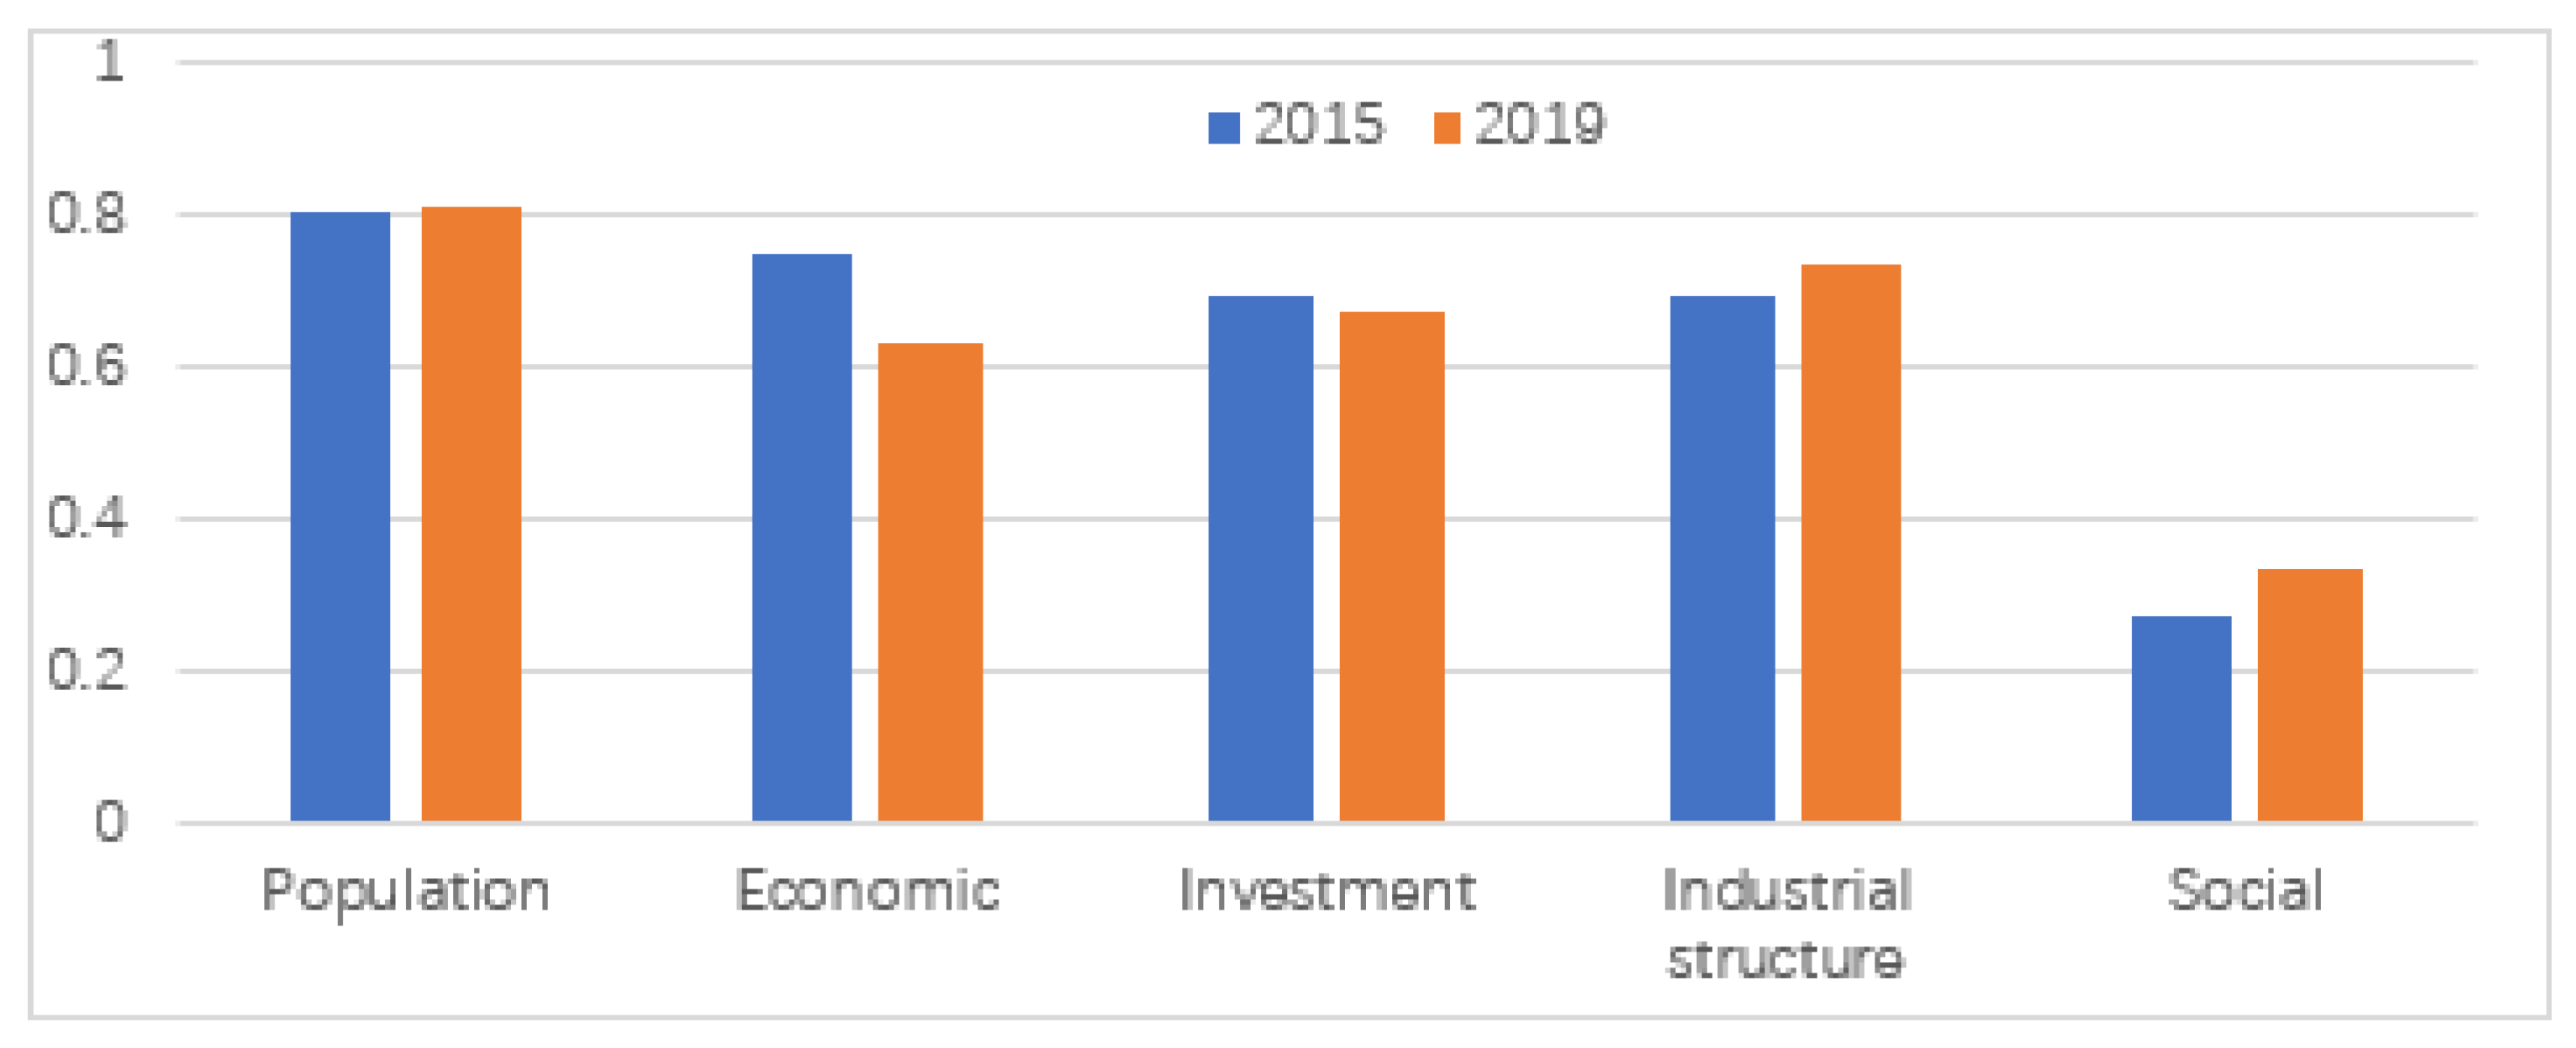
3.2. Factor Analysis

In 2015, the driving factors were ranked by intensity in the order of X 2 > X 12 > X 3 > X 9 > X 8 > X 1 > X 6 > X 4 > X 10 > X 5 > X 11 > X 13 > X 7 > X 15 > X 17 > X 16 > X 14 ; the driving forces were ranked by intensity in the order of Population > Economic > Investment > Industrial Structure > Social. In 2019, the driving factors were ranked by intensity in the order of X 8 > X 9 > X 2 > X 3 > X 13 > X 1 > X 12 > X 11 > X 10 > X 6 > X 5 > X 16 > X 4 > X 17 > X 15 > X 7 > X 14 ; the driving forces were ranked by intensity in the order of Population > Industrial Structure > Investment > Economic > Social (see Figure 4 and Figure 5). The average force of driving factors was 0.64 in 2015 and 2019, with 11 and 10 factors exceeding the mean, respectively. The changes in the force ranking of driving factors were complex from 2015 to 2019, which can be classified into three categories according to the direction and amount of change, that is, factors significantly improved, factors remaining stable, and factors significantly decreased. Factors significantly improved include X 8 , X 9 , X 11 ,   X 13 , and X 16 ; the factors remaining stable include X 1 , X 2 , X 3 , X 10 , X 14 , and X 17 ; and the factors significantly decreased include X 4 , X 5 , X 6 , X 7 , X 12 , and X 15 .

3.3. Interaction Analysis

The drive factors were all bifactorially enhanced with each other, and there was no independent, asymptotic, or non-linear enhancement relationship. The value of the interaction force was 0–1, and a larger value indicated a stronger force. There was a great difference in the interacting force between factor pairs, with a stable Gini coefficient of 0.52 (see Table 4). It should be noted that the interacting forces of X 4 X 9 , X 4 X 12 , X 4 X 8 , X 11 X 12 in 2015 and X 1 X 13 , X 2 X 9 , X 8 X 10 in 2019 reached 0.98 and above. The driving force and interaction force intensity of urban construction land change factors changed, and so did the composition of leading factors, showing that the driving mechanism is becoming more and more complex. The mean factor interactions for X 2 , X 4 , X 8 , X 9 , X 11 , X 12 in 2015 and X 2 , X 3 , X 8 , X 9 , X 10 , X 13 in 2018 were all greater than 0.9, and the three factors X 2 , X 8 , X 9 exerted a strong interaction effect for a long time. The interaction forces of 136 factor pairs were classified into three categories of high, medium, and low by criteria of 0.85 and 0.95 (see Figure 6). In 2015, there were 25 high-factor pairs, accounting for about 18.38%; 56 medium-factor pairs, accounting for about 41.18%; and 55 low-factor pairs, accounting for about 40.44%. In 2019, there were 24 high-factor pairs, accounting for about 17.65%; 66 medium-factor pairs, accounting for about 48.53%; and 46 low-factor pairs, accounting for about 33.82%. In summary, the number of counties in the high category remained basically stable, while those in the low category experienced a decline and those in the medium category enjoyed a significant increase, showing that the interaction effect is getting better on the whole, and the synergy among the influencing factors is growing.
It is worth noting that the mean, median, plural, maximum, and minimum values were considered when determining the classification thresholds, with reference to the balance and coordination of the sample size in each category. The thresholds in this paper were set mainly for the following reasons: first, the mean interaction forces for all factor pairs in 2015 and 2019 were 0.84 and 0.85, the median values were 0.87 and 0.89, the mode values were 0.94 and 0.93, the maximum values were 0.99 and 0.98, respectively, and the minimum values were both 0.09. Second, the number of samples of each type should be kept balanced and coordinated to some extent after classification. The aforementioned two conditions can be satisfied at the same time by criteria of 0.85 and 0.95. The thresholds were also moderately fine-tuned when there were changes in the study sample size, indicator system, analysis content, and results.
There were large differences between the driving factors in the enhancement effect, with the Gini coefficient increasing from 0.68 in 2015 to 0.71 in 2019, the difference between the maximum and minimum values expanding from 0.38 to 0.63, and the ratio between the maximum and minimum values broadening from about 30 to about 65 times (see Table 4). The enhancement effect of the factor pairs was gradually improved after interaction, with the mean value of the enhancement effect increased from 0.13 in 2015 to 0.17 in 2019. The number of factor pairs with enhancement greater than 0.5 increased from 0 in 2015 to 7 in 2019, including X 7 X 8 , X 7 X 9 , X 7 X 10 , X 7 X 11 , X 7 X 12 , and X 7 X 13 . The mean, median, and mode values of the post-interaction enhancement effect of all factors in 2015 and 2019 ranged from 0.10 to 0.17. With comprehensive consideration of their maximum and minimum values and the level of heterogeneity, this paper classifies the enhancement effects after factor interaction into three categories of high, medium, and low by criteria of 0.15 and 0.3 (see Figure 7). In 2015, there were 10 high-factor pairs, accounting for about 7.35%; 46 medium-factor pairs, accounting for about 33.82%; and 80 low-factor pairs, accounting for about 58.82%. In 2019, there were 22 high-factor pairs, accounting for about 16.18%; 35 medium-factor pairs, accounting for about 25.74%; and 79 low-factor pairs, accounting for about 58.09%. X 4 , X 8 , X 9 , X 10 , X 11 , and X 12 in 2015 and X 7 , X 8 , X 9 , X 10 , X 11 , X 12 , X 13 , and X 16 in 2018 experienced a large enhancement after interaction, and the five factors of X 8 , X 9 , X 10 , X 11 , and X 12 exerted a strong synergistic effect for a long time.

4. Discussion

4.1. Driving Mechanism

The driving mechanism of urban construction land change is constructed based on the classification and grading of the driving forces and their interaction relationships, while taking into account the influence of development stages (see Figure 8). Based on the classification and grading criteria of TOP5 and average, the driving factors are classified into three categories: “Key factors”, “Important factors” and “Auxiliary factors”. For the “Key factors”, the direct effect is dominant, with the interaction between factors taken into account. As the direct and interaction forces of “Important factors” are small, the indirect effects should be dominant, with the interaction between factors is taken into account. As the direct forces of “Auxiliary factors” are very weak, and the interaction should be dominant, with special attention to the special role of super-interaction factors.
The “Population Driving Force” has long played a key role in the expansion of urban construction land, especially the resident population in county town. During the rapid urbanization, a large number of rural residents gathered in county seats, creating a huge demand in housing, transportation, public service facilities construction, and other fields, and directly driving the expansion of county construction land. “Economic Driving Force” and “Investment Driving Force” used to be very important, but there is a clear downward trend in their positions, with only GDP and road area and length maintaining a strong driving role, reflecting that developmentalism and infrastructure orientation are still the mainstream ideas. The “Industrial Structure Driving Force” is rapidly rising in status; especially the “Secondary Industry” and “Standard-Sized Enterprises”, which are playing an increasingly prominent role, reflecting that the implementation of policies to strengthen the real economy and adjust the industrial structure has achieved significant results. The “Social Driving Force” has been weak for a long time, and the rise of urbanization rate and residents’ income has little impact on the scale of construction land, which may be in connection with the policy orientation of intensive land use and stock development.
Some conclusions of this paper lend support to some viewpoints of existing papers, but some are contrary. These new findings are of great value to supplement and improve the driving mechanism and evolution law of urban construction land change. For example, Cai [83], Wang [84,85], Liu [86], Jin [87], and Cao [88], et al., based on the study of large cities, believe that GDP, population, value added of secondary industry, transportation conditions, and industrial structure are important drivers of construction land expansion, which is in agreement with the viewpoint of this paper. They think that the urbanization rate (Cai, Jin, Cao), residents’ income, living standard (Liu), and other factors are also the determinants of urban construction land change, which, contrary to the viewpoint in this paper, may be affected by the scale effect. This paper discusses county-level cities, which are on a micro scale. Their research focuses on prefecture-level cities, provinces, and even regions on a macro scale.

4.2. Policy Implications: Precision and Differentiation

The policy on construction land allocation is the most important macro-economic control policy adopted by the Chinese central government [89,90], and the most critical policy instrument for local governments to control urban expansion and sprawl [91]. There are many driving factors for urban construction land change, and their forces and interactions are characterized by heterogeneity, complexity, and dynamics. Therefore, this paper suggests a precise, refined, and differentiated policy design for urban construction land planning and control as well as spatial governance based on the urban construction land change driving mechanism constructed in the previous part and the findings of Li [92], Zhou [93], Ye [94], and others. The governing policy for urban construction land supply and allocation should be designed around key factors such as population size, infrastructure conditions, economic development level, and industrial structure to implement the development orientation of “tightening up increment, revitalizing the stock, and improving the quality”. A series of special supporting policies should be designed in response to the orientation of expanding domestic demand and optimizing the development of the real economy and be based on the interactive effects of factors such as fiscal revenue, social consumption, fixed asset investment, industry, and enterprises. In addition, the differentiated management of urban construction land is a significant manifestation of the modernization of the land spatial governance of a country. It is suggested to design differentiated performance evaluation standards according to local conditions, develop a new system of comprehensive urban construction land control and spatial development governance policies, and change the policy design and implementation from a “one-size-fits-all approach” to a “differentiation approach”.
From the population perspective, the population size of the county seat and county region has a long-term impact on urban construction land above 0.75, and population has become a key driver of urban construction land change as the fundamental to development. In recent years, the “war for talent attraction” has become increasingly intense in China’s major cities, especially in the first- and second-tier cities. That is, cities across China have introduced a series of preferential policies at high frequencies to attract talents and residents, in turn resulting in a competition for human resources. Third- and fourth-tier small and medium-sized cities and counties are the hardest hit by population drainage, for example, about one-fourth of Guangxi county-level cities experienced population outflow from 2015 to 2019, especially Luzhai County, with the largest population outflow, experiencing a population decrease of 32,000, accounting for one-third of its total in 2019. Counties have a natural disadvantage in attracting immigrants, and in the context of the growing competition for human resources, the design of population policy has changed from a “war for talent attraction” to a “war for talent retention”. In other words, the core task of county-level cities is to ensure that their own population does not flow out, and the priority is to protect the population of the county seat from loss. How to make use of the new policies given to the county development in the new era by the state and autonomous regions and to retain the population in county seats and county regions should be the entry point for the design of the population policy for county-level cities, and also the point to leverage the change of construction land in county-level cities.
In terms of infrastructure conditions, the area and length of intra-city roads and the level of public and public service facilities become key influencing factors, and there is no significant effect of inter-city accessibility on urban construction land. Guangxi, benefiting from the implemented strategies of the ASEAN-oriented international corridor, the new strategic pivot point for open development in the southwest and south-central regions, and organic convergence of important gateways through the “Belt and Road”, has increased investment in intercity railroads and highways, especially high-speed railways (HSRs) and expressways since 2015, establishing a fast, efficient, and smooth comprehensive transportation network. However, intercity transportation facility improvements have little impact on the construction land change in county cities, largely due to the current deviation in the direction of intercity transportation construction. Guangxi county-level city governments and citizens are enthusiastic about high-speed railway construction, and the railroad investment is mainly put in high-speed railways. Since 2015, HSR stations have been built or are under construction in more than 35% of counties, yet there are very few general rail lines or train stations. The HSR, which is mainly passenger oriented, accelerates the outflow of local population, instead of bringing immigrants as expected by the government. In contrast, the general railway mostly focuses on freight transportation and serves industrial development. Therefore, the lack of general railways has led to a scarcity of investment in county-level cities, further resulting in difficulties in expanding urban construction land. The complex topography of Guangxi and the high cost of highway construction have led to high freight costs and, thus, the highway plays a limited role in the development of counties. As Aristotle said, people come to the city to live, and stay in the city to live a good life. Urbanites and those preparing to settle in the city are increasingly focused on quality of life while considering their own career development. Convenience of transportation in the city, the tertiary industry, especially the atmosphere of commercial consumption, education, and medical facilities, as well as the potential and vitality of the city’s development, have become an important “soil” for outside population to “come” and inside population to “stay”. For county-level cities, the entry point in the new infrastructure plan should be changed from the convenience of inter-city transportation to the comfort of intra-city services and facilities.
From the perspective of economic development, total GDP, industrial structure optimization, and real economy development are key driving forces for the change of construction land in county-level cities, while the driving force of finance is weakening as “well-governed prefectures and counties will ensure a stable society”; the sound governance of counties has always played an important role in the national and regional spatial governance system of China. Since the establishment of the system of prefectures and counties in the Qin Dynasty, counties have long been the most stable and important spatial units in the administrative division system of China, and county-level cities have become an important strategic stronghold for China to integrate urban and rural economic development and social governance in the new era. The driving force of GDP, secondary industry, and especially industrial enterprises above the scale on the change of construction land in county-level cities from 2015 to 2019 has been rapidly increasing. The influence of the tertiary and primary industries has decreased but remains high, with a driving force of more than 0.66. County-level cities, in general, should focus on promoting the simultaneous development of new industrialization, new urbanization, and agricultural modernization in economic development, accelerating the construction of industrial parks, trying to introduce more industrial manufacturing enterprises, agricultural product-processing enterprises, and logistics and tourism enterprises, as well as attracting all types of economic resources, industrial elements, and entrepreneurial individuals to the county, thus further driving the expansion of urban construction land. It should be noted that the influence of financial revenues on the county’ urban construction land decreases quickly, from 0.74 in 2015 to about 0.5 in 2019. Therefore, county-level city governments should further implement the “Guidance on Innovative Government Allocation of Resources” and the “Opinions on Building a More Perfect System and Mechanism of Market Allocation of Factors” issued by the central government. They should promote market-oriented reforms in breadth and depth, significantly reduce the direct allocation of resources by the government, expand the scope of market-oriented allocation of factors, perfect the factor market system, promote the construction of the factor market system, innovate the allocation of government financial resources by classification and sector, introduce more market mechanisms and market-oriented means, enhance the attractiveness and agglomeration of the county seats for population and resources, and further expand the total amount of urban construction land to revitalize its stock and improve its quality.

5. Conclusions

The study on the spatial-temporal differences of urban construction land change at different scales and its driving mechanism is helpful to comprehensively master and reveal the spatial laws of land use and its evolution and provides more detailed and accurate information for urban policy makers and decision makers. It is of great theoretical significance and practical value to provide a scientific basis for urban governments at all levels to optimize the construction land supply mode and allocation plan, and to develop differentiated and precise construction land planning and spatial governance policies. The spatial-temporal evolution of construction land is correlated with its driving mechanism in cities of different scales and grades, but small-sized cities have special laws that are different or even contrary to those of large-sized cities due to the influence of scale effects, management systems, and operation mechanisms. The micro-level empirical study based on county-level cities in this paper fills the gap of the study on “small-sized cities”, and it contributes to the overall “map” of cross-scale research in combination with the research results of “large-sized cities” at the macro level.
Since small and medium-sized cities have the largest share in the world urban system, it is of the most extensive theoretical and practical value to integrate economic and social factors and conduct a comprehensive study on their development mechanism. It not only provides guidance for the development and planning of small cities in China, but also offers a certain reference value for more countries such as Vietnam, Thailand, Myanmar, Indonesia, Malaysia, and Laos, with great case study value. Our study also has some shortcomings, which may have some impact on the accuracy and applicability of the conclusions. For example, although the indexes of driving forces employed in this study involve a wide range, there is a lack of indexes concerning policy regimes and natural environment in this paper due to the constraints on data acquisition. Besides, the economic geographical phenomenon and their development trends and mechanisms may not be the same in different spatial scales. There are no detailed and systematic comparative studies at multiple scales or across scales, such as county, prefecture, provincial, regional, and national levels. Further in-depth research is needed in the future on how to incorporate policy regimes, natural environments, and scale effects into the research framework to reach a more precise conclusion.

Author Contributions

Conceptualization, X.Z. and D.O.; methodology, D.O.; software, D.O. and X.L.; validation, D.O. and R.H.; formal analysis, Q.W. and X.L.; investigation, D.O. and R.H.; resources, X.Z.; data curation, D.O. and R.H.; writing—original draft preparation, D.O. and X.L.; writing—review and editing, X.Z.; visualization, D.O. and R.H.; supervision, D.O.; project administration, X.Z. and D.O.; funding acquisition, X.Z. and D.O. All authors have read and agreed to the published version of the manuscript.

Funding

This research was funded by Major Research Project of Guangxi in 2021: Countermeasures of Urbanization Construction in counties of Guangxi (Project No. KTZB-2021-07) and Guangxi Philosophy and Social Sciences Planning Research Project in 2017: Study on the Coupling Mechanism of Local Urbanization and Targeted Poverty Alleviation in the Process of New Urbanization in Guangxi (Project No. 17FJL004).

Informed Consent Statement

Not applicable.

Data Availability Statement

The data mainly comes from Guangxi Urban Construction Yearbook and Guangxi Statistical Yearbook, and select missing data comes from statistical yearbooks, statis-tical bulletins, and government work reports of provinces and cities. Interested readers and researchers can find data from http://www.gxcic.net/zj/showlist.aspx?oneid=268 (accessed on 6 June 2021) and http://tjj.gxzf.gov.cn/tjsj/ (accessed on 6 June 2021).

Acknowledgments

We provided assistance to Sidong Zhao from the School of Architecture of Southeast University in the process of method and conception.

Conflicts of Interest

The authors declare no conflict of interest.

References

  1. Wang, Y.F.; Zhao, F.F.; Cheng, L.; Yang, K. Framework for monitoring the conversion of cultivated land to construction land using SAR image time series. Remote Sens. Lett. 2015, 6, 794–803. [Google Scholar] [CrossRef]
  2. Noszczyk, T. A review of approaches to land use changes modeling. Hum. Ecol. Risk Assess. 2019, 25, 1377–1405. [Google Scholar] [CrossRef]
  3. United Nations Department of Economic and Social Affairs/Population Division III. World Urbanization Prospects: The 2009 Revision; United Nations: New York, NY, USA, 2010; Available online: https://www.ipcc.ch/apps/njlite/ar5wg2/njlite_download2.php?id=10148 (accessed on 18 March 2021).
  4. Wang, J.; Li, Y.R.; Wang, Q.Y.; Cheong, K.C. Urban-Rural Construction Land Replacement for More Sustainable Land Use and Regional Development in China: Policies and Practices. Land 2019, 8, 171. [Google Scholar] [CrossRef] [Green Version]
  5. Noszczyk, T. Land Use Change Monitoring as a Task of Local Government Administration in Poland. J. Ecol. Eng. 2018, 19, 170–176. [Google Scholar] [CrossRef]
  6. Wang, J.; Skidmore, M.; Wu, Q.; Wang, S. The impact of a tax cut reform on land finance revenue: Constrained by the binding target of construction land. J. Urban Aff. 2020. [Google Scholar] [CrossRef]
  7. Cao, Y.; Zhang, X.L.; Zhang, X.K.; Li, H. The incremental construction land differentiated management framework: The perspective of land quota trading in China. Land Use Policy 2020, 96, 104675. [Google Scholar] [CrossRef]
  8. Lu, S.H.; Wang, H. Distributive politics in China: Regional favouritism and expansion of construction land. Urban Stud. 2020, 57, 1600–1619. [Google Scholar] [CrossRef]
  9. Liu, T.; Liu, H.; Qi, Y.J. Construction land expansion and cultivated land protection in urbanizing China: Insights from national land surveys, 1996–2006. Habitat Int. 2015, 46, 13–22. [Google Scholar] [CrossRef]
  10. Cui, X.F.; Yang, S.; Zhang, G.H.; Liang, B.; Li, F. An Exploration of a Synthetic Construction Land Use Quality Evaluation Based on Economic-Social-Ecological Coupling Perspective: A Case Study in Major Chinese Cities. Int. J. Environ. Res. Public Health 2020, 17, 3663. [Google Scholar] [CrossRef]
  11. Huang, D.Q.; Lang, Y.; Liu, T. The Evolving Structure of Rural Construction Land in Urbanizing China: Case Study of Tai’an Prefecture. Land 2021, 10, 65. [Google Scholar] [CrossRef]
  12. Noszczyk, T.; Rutkowska, A.; Hernik, J. Exploring the land use changes in Eastern Poland: Statistics-based modeling. Hum. Ecol. Risk Assess. 2020, 26, 255–282. [Google Scholar] [CrossRef]
  13. Cegielska, K.; Noszczyk, T.; Kukulska, A.; Szylar, M.; Hernik, J.; Dixon-Gough, R.; Jombach, S.; Valanszki, I.; Kovacs, K.F. Land use and land cover changes in post-socialist countries: Some observations from Hungary and Poland. Land Use Policy 2018, 78, 1–18. [Google Scholar] [CrossRef]
  14. Li, Z.; Jiang, W.G.; Wang, W.J.; Lei, X.; Deng, Y. Exploring spatial-temporal change and gravity center movement of construction land in the Chang-Zhu-Tan urban agglomeration. J. Geogr. Sci. 2019, 29, 1363–1380. [Google Scholar] [CrossRef] [Green Version]
  15. Yao, Y.X.; Li, J.; Zhang, X.G.; Duan, P.; Li, S.; Xu, Q.L. Investigation on the Expansion of Urban Construction Land Use Based on the CART-CA Model. ISPRS Int. J. Geo-Inf. 2017, 6, 149. [Google Scholar] [CrossRef]
  16. Aliani, H.; Malmir, M.; Sourodi, M.; Kafaky, S.B. Change detection and prediction of urban land use changes by CA-Markov model (case study: Talesh County). Environ. Earth Sci. 2019, 78, 546. [Google Scholar] [CrossRef]
  17. Karimi, H.; Jafarnezhad, J.; Khaledi, J.; Ahmadi, P. Monitoring and prediction of land use/land cover changes using CA-Markov model: A case study of Ravansar County in Iran. Arab. J. Geosci. 2018, 11, 592. [Google Scholar] [CrossRef]
  18. Xiong, Y.; Chen, Y.; Peng, F.; Li, J.Z.; Yan, X.J. Analog simulation of urban construction land supply and demand in Chang-Zhu-Tan Urban Agglomeration based on land intensive use. J. Geogr. Sci. 2019, 29, 1346–1362. [Google Scholar] [CrossRef] [Green Version]
  19. Huang, R.J.; Nie, Y.J.; Duo, L.H.; Zhang, X.P.; Wu, Z.H.; Xiong, J.C. Construction land suitability assessment in rapid urbanizing cities for promoting the implementation of United Nations sustainable development goals: A case study of Nanchang, China. Environ. Sci. Pollut. Res. 2021, 28, 25650–25663. [Google Scholar] [CrossRef]
  20. Yan, Y.T.; Zhou, R.; Ye, X.Y.; Zhang, H.; Wang, X.J. Suitability Evaluation of Urban Construction Land Based on an Approach of Vertical-Horizontal Processes. ISPRS Int. J. Geo-Inf. 2018, 7, 198. [Google Scholar] [CrossRef] [Green Version]
  21. Cao, M.; Zhao, J.; Zhang, S. Research on The Suitability Evaluation of Construction Land in Southwest Mountainous Areas of China: A Case Study of Baoxing County, Sichuan Province, China. Appl. Ecol. Environ. Res. 2018, 16, 6567–6587. [Google Scholar] [CrossRef]
  22. Xu, K.; Kong, C.F.; Li, J.F.; Zhang, L.Q.; Wu, C.L. Suitability evaluation of urban construction land based on geo-environmental factors of Hangzhou, China. Comput. Geosci. 2011, 37, 992–1002. [Google Scholar] [CrossRef]
  23. Bozdag, A.; Yavuz, F.; Gunay, A.S. AHP and GIS based land suitability analysis for Cihanbeyli (Turkey) County. Environ. Earth Sci. 2016, 75, 813. [Google Scholar] [CrossRef]
  24. Ustaoglu, E.; Aydinoglu, A.C. Suitability evaluation of urban construction land in Pendik district of Istanbul, Turkey. Land Use Policy 2020, 99, 104783. [Google Scholar] [CrossRef]
  25. Zhang, X.R.; Fang, C.L.; Wang, Z.B.; Ma, H.T. Urban Construction Land Suitability Evaluation Based on Improved Multi-criteria Evaluation Based on GIS (MCE-GIS): Case of New Hefei City, China. Chin. Geogr. Sci. 2013, 23, 740–753. [Google Scholar] [CrossRef] [Green Version]
  26. Xie, H.L.; Zhu, Z.H.; Wang, B.H.; Liu, G.Y.; Zhai, Q.L. Does the Expansion of Urban Construction Land Promote Regional Economic Growth in China? Evidence from 108 Cities in the Yangtze River Economic Belt. Sustainability 2018, 10, 4073. [Google Scholar] [CrossRef] [Green Version]
  27. Wang, K.Q.; Li, G.X.; Liu, H.M. Porter effect test for construction land reduction. Land Use Policy 2021, 103, 105310. [Google Scholar] [CrossRef]
  28. Guo, L.Y.; Di, L.P.; Tian, Q. Detecting spatio-temporal changes of arable land and construction land in the Beijing-Tianjin corridor during 2000–2015. J. Geogr. Sci. 2019, 29, 702–718. [Google Scholar] [CrossRef] [Green Version]
  29. Aneseyee, A.B.; Noszczyk, T.; Soromessa, T.; Elias, E. The InVEST Habitat Quality Model Associated with Land Use/Cover Changes: A Qualitative Case Study of the Winike Watershed in the Omo-Gibe Basin, Southwest Ethiopia. Remote Sens. 2020, 12, 1103. [Google Scholar] [CrossRef] [Green Version]
  30. Aneseyee, A.B.; Elias, E.; Soromessa, T.; Feyisa, G.L. Land use/land cover change effect on soil erosion and sediment delivery in the Winike watershed, Omo Gibe Basin, Ethiopia. Sci. Total Environ. 2020, 728, 138776. [Google Scholar] [CrossRef]
  31. Aneseyee, A.B.; Soromessa, T.; Elias, E. The effect of land use/land cover changes on ecosystem services valuation of Winike watershed, Omo Gibe basin, Ethiopia. Hum. Ecol. Risk Assess. 2020, 26, 2608–2627. [Google Scholar] [CrossRef]
  32. Sadat, M.; Zoghi, M.; Malekmohammadi, B. Spatiotemporal modeling of urban land cover changes and carbon storage ecosystem services: Case study in Qaem Shahr County, Iran. Environ. Dev. Sustain. 2020, 22, 8135–8158. [Google Scholar] [CrossRef]
  33. Li, Y.N.; Cai, M.M.; Wu, K.Y.; Wei, J.C. Decoupling analysis of carbon emission from construction land in Shanghai. J. Clean. Prod. 2019, 210, 25–34. [Google Scholar] [CrossRef]
  34. Jin, W.F.; Zhou, C.S.; Li, S.J.; Zhang, G.J. Factors affecting newly increased construction land at different development stages: Evidence from 352 Chinese cities. Environ. Plan. B Urban Anal. City Sci. 2021, 48, 358–375. [Google Scholar] [CrossRef]
  35. Yu, H.S.; Song, G.; Li, T.; Liu, Y.J. Spatial Pattern Characteristics and Influencing Factors of Green Use Efficiency of Urban Construction Land in Jilin Province. Complexity 2020, 2020, 5637530. [Google Scholar] [CrossRef]
  36. Wang, H.; Qiao, L.; Tian, C.; Lin, Q.Q. Utilisation Efficiency of Construction Land in China’s Coastal Cities Based on Debt Level. Complexity 2020, 2020, 3428968. [Google Scholar] [CrossRef]
  37. Liu, Y.S.; Zhang, Z.W.; Zhou, Y. Efficiency of construction land allocation in China: An econometric analysis of panel data. Land Use Policy 2018, 74, 261–272. [Google Scholar] [CrossRef]
  38. Ye, Y.Y.; Zhang, H.G.; Liu, K.; Wu, Q.T. Research on the influence of site factors on the expansion of construction land in the Pearl River Delta, China: By using GIS and remote sensing. Int. J. Appl. Earth Obs. Geoinf. 2013, 21, 366–373. [Google Scholar] [CrossRef]
  39. Li, Z.Y.; Luan, W.X.; Zhang, Z.C.; Su, M. Relationship between urban construction land expansion and population/economic growth in Liaoning Province, China. Land Use Policy 2020, 99, 105022. [Google Scholar] [CrossRef]
  40. Zhou, L.; Yuan, B.; Mu, H.W.; Dang, X.W.; Wang, S.H. Coupling relationship between construction land expansion and PM2.5 in China. Environ. Sci. Pollut. Res. 2021. [Google Scholar] [CrossRef]
  41. Cai, E.X.; Liu, Y.L.; Li, J.W.; Chen, W.Q. Spatiotemporal Characteristics of Urban-Rural Construction Land Transition and Rural-Urban Migrants in Rapid-Urbanization Areas of Central China. J. Urban Plan. Dev. 2020, 146, 05019023. [Google Scholar] [CrossRef]
  42. Li, M.; Shi, Y.Y.; Duan, W.K.; Chen, A.Q.; Wang, N.; Hao, J.M. Spatiotemporal Decoupling of Population, Economy and Construction Land Changes in Hebei Province. Sustainability 2019, 11, 6794. [Google Scholar] [CrossRef] [Green Version]
  43. Yang, Z.W.; Chen, Y.B.; Qian, Q.L.; Wu, Z.F.; Zheng, Z.H.; Huang, Q.Y. The coupling relationship between construction land expansion and high-temperature area expansion in China’s three major urban agglomerations. Int. J. Remote Sens. 2019, 40, 6680–6699. [Google Scholar] [CrossRef]
  44. He, Q.S.; Tan, S.K.; Yin, C.H.; Zhou, M. Collaborative optimization of rural residential land consolidation and urban construction land expansion: A case study of Huangpi in Wuhan, China. Comput. Environ. Urban Syst. 2019, 74, 218–228. [Google Scholar] [CrossRef]
  45. Zhu, B.S.; Bi, F. Research on Ecological Planning Method of Urban Construction Land Based on Comprehensive Benefits. Fresenius Environ. Bull. 2021, 30, 465–473. [Google Scholar]
  46. Zhu, J.; Tang, W.C. Conflict and compromise in planning decision-making: How does a Chinese local government negotiate its construction land quota with higher-level governments? Environ. Urban. 2018, 30, 155–174. [Google Scholar] [CrossRef] [Green Version]
  47. Tang, Y.; Mason, R.J.; Sun, P. Interest distribution in the process of coordination of urban and rural construction land in China. Habitat Int. 2012, 36, 388–395. [Google Scholar] [CrossRef]
  48. Zhou, Y.; Huang, X.J.; Zhong, T.Y.; Chen, Y.; Yang, H.; Chen, Z.G.; Xu, G.L.; Niu, L.D.; Li, H.H. Can annual land use plan control and regulate construction land growth in China? Land Use Policy 2020, 99, 105026. [Google Scholar] [CrossRef]
  49. Zhou, Y.; Huang, X.J.; Chen, Y.; Zhong, T.Y.; Xu, G.L.; He, J.L.; Xu, Y.T.; Meng, H. The effect of land use planning (2006–2020) on construction land growth in China. Cities 2017, 68, 37–47. [Google Scholar] [CrossRef]
  50. Liu, H.P.; Zhang, Y.X.; Zhang, X.P. Using the RS Method to Analyse Construction Land Changes in Tongren during 2002 and 2016. Pol. J. Environ. Stud. 2019, 28, 1277–1286. [Google Scholar] [CrossRef]
  51. Chen, G.B. GIS method and its application for harmonious evaluation of urban construction land and geological environment. Arab. J. Geosci. 2019, 12, 600. [Google Scholar] [CrossRef]
  52. Jiang, M.; Xin, L.J.; Li, X.B.; Tan, M.H. Spatiotemporal Variation of China’s State-Owned Construction Land Supply from 2003 to 2014. Sustainability 2016, 8, 1137. [Google Scholar] [CrossRef] [Green Version]
  53. Shi, Y.S.; Wu, J.; Shi, S.Z. Study of the Simulated Expansion Boundary of Construction Land in Shanghai Based on a SLEUTH Model. Sustainability 2017, 9, 876. [Google Scholar] [CrossRef] [Green Version]
  54. Zheng, Q.; Wang, K.; Huang, L.Y.; Zheng, Q.M.; Abubakar, G.A. Monitoring the Different Types of Urban Construction Land Expansion (UCLE) in China’s Port City: A Case Study of Ningbo’s Central City. Sustainability 2017, 9, 2374. [Google Scholar] [CrossRef] [Green Version]
  55. Cao, Y.G.; Bai, Z.K.; Zhou, W.; Ai, G. Gradient Analysis of Urban Construction Land Expansion in the Chongqing Urban Area of China. J. Urban Plan. Dev. 2015, 141, 05014009. [Google Scholar] [CrossRef] [Green Version]
  56. Zhang, J.J.; Su, F.Z. Spatial Pattern of Construction Land Distribution in Bays along the Coast of Vietnam. ISPRS Int. J. Geo-Inf. 2020, 9, 707. [Google Scholar] [CrossRef]
  57. Cai, F.F.; Pu, L.J.; Zhu, M. Assessment Framework and Decision-Support System for Consolidating Urban-Rural Construction Land in Coastal China. Sustainability 2014, 6, 7689–7709. [Google Scholar] [CrossRef] [Green Version]
  58. Wang, Z.B.; Fang, C.L.; Zhang, X.R. Spatial expansion and potential of construction land use in the Yangtze River Delta. J. Geogr. Sci. 2015, 25, 851–864. [Google Scholar] [CrossRef] [Green Version]
  59. Cao, Y.G. Forces Driving Changes in Urban Construction Land of Urban Agglomerations in China. J. Urban Plan. Dev. 2015, 141, 05014011. [Google Scholar] [CrossRef]
  60. Li, J.T.; Sun, Z.F. Urban Function Orientation Based on Spatiotemporal Differences and Driving Factors of Urban Construction Land. J. Urban Plan. Dev. 2020, 146, 05020011. [Google Scholar] [CrossRef]
  61. Li, Y.R.; Yi, L.; Karacsonyi, D.; Liu, Z.J.; Wang, Y.S.; Wang, J.Y. Spatio-temporal pattern and driving forces of construction land change in a poverty-stricken county of China and implications for poverty-alleviation-oriented land use policies. Land Use Policy 2020, 91, 104267. [Google Scholar] [CrossRef]
  62. Huang, H.; Zhou, Y.; Qian, M.J.; Zeng, Z.Q. Land Use Transition and Driving Forces in Chinese Loess Plateau: A Case Study from Pu County, Shanxi Province. Land 2021, 10, 67. [Google Scholar] [CrossRef]
  63. Xie, W.H.; Jin, W.F.; Chen, K.R.; Wu, J.L.; Zhou, C.S. Land Use Transition and Its Influencing Factors in Poverty-Stricken Mountainous Areas of Sangzhi County, China. Sustainability 2019, 11, 4915. [Google Scholar] [CrossRef] [Green Version]
  64. Zhu, Z.Q.; Liu, L.M.; Chen, Z.T.; Zhang, J.L.; Verburg, P.H. Land-use change simulation and assessment of driving factors in the loess hilly region-a case study as Pengyang County. Environ. Monit. Assess. 2010, 164, 133–142. [Google Scholar] [CrossRef]
  65. Hu, Y.F.; Batunacun, Z.L.; Zhuang, D.F. Assessment of Land-Use and Land-Cover Change in Guangxi, China. Sci. Rep. 2019, 9, 2189. [Google Scholar] [CrossRef] [Green Version]
  66. Dang, L.J.; Xu, Y.; Tang, Q. The pattern of available construction land along the Xijiang River in Guangxi, China. Land Use Policy 2015, 42, 102–112. [Google Scholar] [CrossRef]
  67. Chen, T.T.; Peng, L.; Liu, S.Q.; Wang, Q. Land cover change in different altitudes of Guizhou-Guangxi karst mountain area, China: Patterns and drivers. J. Mt. Sci. 2017, 14, 1873–1888. [Google Scholar] [CrossRef]
  68. Wang, J.F.; Li, X.H.; Christakos, G.; Liao, Y.L.; Zhang, T.; Gu, X.; Zheng, X.Y. Geographical detectors-based health risk assessment and its application in the neural tube defects study of the Heshun region, China. Int. J. Geogr. Inf. Sci. 2010, 24, 107–127. [Google Scholar] [CrossRef]
  69. Wang, J.F.; Xu, C.D. Geodetector: Principle and prospective. Acta Geogr. Sin. 2017, 72, 116–134. [Google Scholar]
  70. Liu, C.L.; Li, W.L.; Zhu, G.F.; Zhou, H.K.; Yan, H.P.; Xue, P.F. Land use/land cover changes and their driving factors in the Northeastern Tibetan Plateau based on Geographical Detectors and Google Earth Engine: A case study in Gannan Prefecture. Remote Sens. 2020, 12, 3139. [Google Scholar] [CrossRef]
  71. Zhang, H.W.; Wang, Z.Q.; Yang, B.; Chai, J.; Wei, C. Spatial—Temporal characteristics of illegal land use and its driving factors in China from 2004 to 2017. Int. J. Environ. Res. Public Health 2021, 18, 1336. [Google Scholar] [CrossRef]
  72. Zhu, M.Q.; Zhuang, D.C.; Zhang, H.X.; Wen, J.Q. Research on spatial differentiation and influencing factors of rural land use functions in the counties of Guangdong province. China Land Sci. 2021, 57, 79–87. [Google Scholar]
  73. Wang, J.F.; Hu, Y. Environmental health risk detection with GeogDetector. Environ. Model. Softw. 2012, 33, 114–115. [Google Scholar] [CrossRef]
  74. Wu, W.; Huang, C.P.; Zhano, X.J.; Hu, X.Y.; Wang, N. Spatial expansion characteristics and mechanism of urban land use in different modes: A case study of Ganzhou. Urban Dev. Stud. 2018, 25, 1–6. [Google Scholar]
  75. Qu, Y.B.; Jiang, G.H.; Tian, Y.Y.; Shang, R.; Wei, S.W.; Li, Y.L. Urban—Rural construction land Transition (URCLT) in Shandong Province of China: Feature’s measurement and mechanism exploration. Habitat Int. 2019, 86, 101–115. [Google Scholar] [CrossRef]
  76. Zhao, X.F.; Liu, M.L.; Wang, B.Y. Spatio-Temporal disparity of urban construction land and its impact factors in China based on Geodetector. China Land Sci. 2018, 32, 29–35. [Google Scholar]
  77. Liu, Y.W.; Cao, X.S.; Li, T. Identifying driving forces of built-up land expansion based on the geographical detector: A case study of Pearl River Delta urban agglomeration. Int. J. Environ. Res. Public Health 2020, 17, 1759. [Google Scholar] [CrossRef] [Green Version]
  78. Guan, X.Y.; Wang, S.L.; Gao, Z.Y.; Lv, Y.; Fu, X.J. Spatio-temporal variability of soil salinity and its relationship with the depth to groundwater in salinization irrigation district. Acta Ecol. Sin. 2012, 32, 198–206. [Google Scholar]
  79. Zhang, R.F. Theory and Application of Spatial Variability; Science Press: Beijing, China, 2005; pp. 13–14. [Google Scholar]
  80. Ruan, B.Q.; Xu, F.R.; Jiang, R.F. Analysis on spatial and temporal variability of groundwater level based on spherical sampling model. J. Hydraul. Eng. 2008, 39, 573–579. [Google Scholar]
  81. Liu, X.N.; Huang, F.; Wang, P. Spatial Analysis Principle and Method of GIS; Science Press: Beijing, China, 2008; pp. 199–206. [Google Scholar]
  82. Miyamoto, S.; Chacon, A.; Hossain, M.; Martinez, L. Soil salinity of urban turf areas irrigated with saline water I. Spatial variability. Landsc. Urban Plan. 2005, 71, 233–241. [Google Scholar]
  83. She, D.L.; Shao, M.A.; Yu, S.G. Spatial Variability of Soil Water Content on a Cropland-grassland Mixed Slope Land in the Loess Plateau, China. Trans. Chin. Soc. Agric. Mach. 2010, 41, 57–63. [Google Scholar]
  84. Cai, W.J.; Tu, F.Y. Spatiotemporal characteristics and driving forces of construction land expansion in Yangtze River economic belt, China. PLoS ONE 2020, 15, e0227299. [Google Scholar] [CrossRef] [PubMed]
  85. Wang, X.G.; Su, F.Z.; Zhang, J.J.; Cheng, F.; Hu, W.Q.; Ding, Z. Construction land sprawl and reclamation in the Johor River Estuary of Malaysia since 1973. Ocean Coast. Manag. 2019, 171, 87–95. [Google Scholar] [CrossRef]
  86. Wang, X.F.; Xiao, F.Y.; Zhang, Y.; Yin, L.C.; Lesi, M.C.; Guo, B.; Zhao, Y.H. Thirty-year expansion of construction land in Xi’an: Spatial pattern and potential driving factors. Geol. J. 2018, 53, 309–321. [Google Scholar] [CrossRef]
  87. Liu, Y.L.; Luo, T.; Liu, Z.Q.; Kong, X.S.; Li, J.W.; Tan, R.H. A comparative analysis of urban and rural construction land use change and driving forces: Implications for urban-rural coordination development in Wuhan, Central China. Habitat Int. 2015, 47, 113–125. [Google Scholar] [CrossRef]
  88. Jin, W.F.; Zhou, C.S.; Zhang, G.J. Characteristics of state-owned construction land supply in Chinese cities by development stage and industry. Land Use Policy 2020, 96, 104630. [Google Scholar] [CrossRef]
  89. Cao, Y.H.; Liu, M.Y.; Cao, Y.D.; Chen, C.; Zhang, D.P. Change pattern and driving mechanism of construction land in China’s undertaking industrial transfer demonstration area: Taking the Wanjiang City Belt along the Yangtze River as an Example. Earth Sci. Res. J. 2020, 24, 215–223. [Google Scholar] [CrossRef]
  90. Li, H.Z.; Yin, F.; Li, J.L. China’s Construction Land Expansion and Economic Growth: A Capital-output Ratio Based Analysis. China World Econ. 2008, 16, 46–62. [Google Scholar] [CrossRef]
  91. Tan, R.; Wang, R.Y.; Heerink, N. Liberalizing rural-to-urban construction land transfers in China: Distribution effects. China Econ. Rev. 2020, 60, 101147. [Google Scholar] [CrossRef]
  92. Fang, L.; Tian, C.H. Construction land quotas as a tool for managing urban expansion. Landsc. Urban Plan. 2020, 195, 103727. [Google Scholar] [CrossRef]
  93. Li, Y.J.; Kong, X.S.; Zhu, Z.Q. Multiscale analysis of the correlation patterns between the urban population and construction land in China. Sustain. Cities Soc. 2020, 61, 102326. [Google Scholar] [CrossRef]
  94. Zhou, Q.F.; Wu, X.Q.; Zhang, X.; Song, Y. Investigating the Spatiotemporal Disparity and Influencing Factors of Urban Construction Land Utilization Efficiency: Empirical Evidence from Panel Data of China. Adv. Civil Eng. 2021, 2021, 1613978. [Google Scholar] [CrossRef]
Figure 1. Study Area.
Land 10 00691 g001
Figure 2. Research framework and steps.
Land 10 00691 g002
Figure 3. Cluster analysis of urban construction land and its change in Guangxi. Left: 2015, Middle: 2019, Right: Change.
Land 10 00691 g003
Figure 4. Analysis of factor detector.
Land 10 00691 g004
Figure 5. Analysis of driving force.
Land 10 00691 g005
Figure 6. Analysis of interaction detector.
Land 10 00691 g006
Figure 7. Comparative analysis of enhancement effect.
Land 10 00691 g007
Figure 8. Driving mechanism of urban construction land change in Guangxi.
Land 10 00691 g008
Table 1. Interaction between explanatory variables ( X i and X j ).
Graphical RepresentationDescriptionInteraction
Land 10 00691 i001q( X i X j ) < Min(q( X i ), q( X j ))Weaken, nonlinear
Land 10 00691 i002Min(q( X i ), q( X j )) < q( X i X j ) < Max(q( X i )), q( X j ))Weaken, uni-
Land 10 00691 i003q( X i X j ) > Max(q( X i ), q( X j ))Enhance, bi-
Land 10 00691 i004q( X i X j ) = q( X i ) + q( X j )Independent
Land 10 00691 i005q( X i X j ) > q( X i ) + q( X j )Enhance, nonlinear
Legend: Land 10 00691 i006 Min(q( X i ), q( X j )) Land 10 00691 i007 Max(q( X i ), q( X j )) Land 10 00691 i008 q( X i ) + q( X j ) Land 10 00691 i009 q( X i X j ). Originate: http://geodetector.cn/, accessed on 7 April 2021.
Table 2. Model variable description.
VariableIndexCodeDriving ForceData Sources
Dependent   variable   Y i Urban construction land area in 2019 Y 1 ——Guangxi Construction Yearbook
Urban construction land area in 2015 Y 2
Independent   variable   X i Resident population in county area X 1 Population driving force
Resident population in county town X 2
Gross domestic product (GDP) X 3 Economic driving forceGuangxi Statistical Yearbook and County Statistical Bulletin
Government revenue X 4
Total retail sales of consumer soods X 5
Public finance expenditure X 6 Investment driving force
Fixed asset investment in urban municipal public facilities X 7 Guangxi Construction Yearbook
Road length X 8
Road area X 9
Primary industry X 10 Industrial structure driving forceGuangxi Statistical Yearbook and County Statistical Bulletin
Secondary industry X 11
Tertiary industry X 12
Number of standard-sized enterprises X 13
Per-Capita disposable income of urban residents X 14 Social driving force
Per-Capita disposable income of rural residents X 15
Urbanization rate X 16
Accessibility X 17 Guangxi Traffic Map
Table 3. Differentiation analysis of urban construction land and its change.
Index20152019Change
Max29.9337.3816.48
Min1.081.42−2.45
Max–Min28.8535.9618.93
Max/Min27.7126.32--
Average9.7611.741.98
Standard Deviation6.778.442.58
Coefficient of Variation (CV)0.690.741.30
Table 4. Differentiation analysis of interaction and enhancement effect.
20152019
Interaction DetectorEnhancement EffectInteraction DetectorEnhancement Effect
Max0.990.390.980.64
Min0.090.010.090.01
Median0.870.120.890.12
Mode0.940.120.930.10
Max–Min0.900.380.890.63
Max/Min10.9639.1110.9164.33
Average0.840.130.850.17
Gini Coefficient0.540.680.540.71
Publisher’s Note: MDPI stays neutral with regard to jurisdictional claims in published maps and institutional affiliations.

