Article

Spatially Illustrating Leisure Agriculture: Empirical Evidence from Picking Orchards in China

1
Hubei Provincial Key Laboratory for Geographical Process Analysis and Simulation, Academy of Wuhan Metropolitan Area, College of Urban and Environmental Sciences, Central China Normal University, Wuhan 430079, China
2
School of Resource and Environmental Science, Wuhan University, Wuhan 430079, China
3
Ningbo Institute of Technology, School of Economics, Zhejiang University, Ningbo 315000, China
*
Author to whom correspondence should be addressed.
Land 2021, 10(6), 631; https://doi.org/10.3390/land10060631
Submission received: 22 April 2021 / Revised: 4 June 2021 / Accepted: 7 June 2021 / Published: 13 June 2021
(This article belongs to the Special Issue Land Issues and Their Impact on Tourism Development)

Abstract

:
In the context of rural revitalization strategies and humans’ increasing leisure pursuit, leisure agriculture starts to act as a new engine of rural economic growth and industrial upgradation. Unraveling the agri-leisure developmental regularity from a spatial perspective facilitates urban-rural integration and poverty alleviation in rural regions. Given the lack of spatially analyzing agri-leisure (e.g., sightseeing picking orchards) especially at the macro-spatial scale (e.g., the national scale), this study aims to explore the spatiality of leisure agriculture and its fundamental driving mechanisms based on geo-visual (spatially visualizing) analytical tools looking at 20,778 picking orchards in China. Results show that: (1) Picking orchards are distributed in the form of clusters with striking disparity at multiple spatial scales; (2) Five spatial agglomerations are found involving the regions around Beijing and Tianjin, Shandong hinterland, Henan hinterland, the core district of the Yangtze Delta, and the core district of the Pearl River Delta; (3) The driving mechanisms are revealed, and the spatial pattern of picking orchards is found to be largely influenced by morphology, distance to central cities, traffic conditions, economic level, and tourism resources. This study is conducive to optimizing the spatial planning of rural eco-tourism towards sustainable agro-development.

1. Introduction

With rapid socio-economic development, people engage in more leisure activities (e.g., tourism, recreation, etc.) to meet their increasing cultural and psychological needs, such as viewing their cultural heritage, experiencing the traditional life, and viewing beautiful natural scenery, which contributes towards a higher quality of life [1,2,3,4,5]. In the context of rapid urbanization globally, urban dwellers are predicted to account for 68% of the worldwide population, a growing number of urban residents desire to leave the city and get close to nature in the countryside as rapid urbanization leads to an increased distance to nature for many people [6,7]. Rapid urbanization and postmodernism have given birth to the rural idyll of the urban, just as the rural signifies idyllic, pure, tranquil authenticity and original, idealized, traditional agriculture [8,9]. Rural destinations are depicted as an imaginative place with a significant range of cultural meanings and cultural heritage, and tourism possesses the capacity to revitalize the culture and heritage of rural communities [10,11,12]. Many citizens start to yearn for leisure activities, enjoying idyllic scenery, breathing fresh air, tasting local specialties (e.g., organic farm food) in the countryside on holidays [13,14,15,16]. Thanks to this growing demand, traveling to the countryside, living and eating with peasant families, experiencing the simple farm life without modern equipment, and admiring the beautiful countryside has now become a new trend and created opportunities for the rise of agriculture-based tourism development [17,18]. Agriculture-based tourism also acts as one significant avenue through which urbanites (urban residents [19]) return to nature while relaxing their body and soul [20]. Given a series of ‘urban diseases’ caused in the process of accelerating urbanization, concerning overpopulation, traffic congestion, resource depletion, air pollution, ecological destruction, etc., urban environments are often higher in many of the physical and psychological stressors that are detrimental to health and lower in the social capital that is beneficial to health [21,22,23,24,25]. Urban citizens suffer higher risks of many health-related problems, such as decreased psychological well-being, high psychosocial stress, elevated depressive symptoms, and obesity prevalence [26,27,28,29]. Conversely, rural environments with plenty of open spaces and direct contact with nature counteracts the negative effects of urbanization in a manner, through reducing chronic stress and anxiety, encouraging physical and mental well-being, and providing positive influences regarding health-promoting behaviors [30,31,32]. Because rural environments affect such a multitude of health outcomes, the development of accessible nature and countryside by diversifying farms to include recreation and leisure activities for visitors, commonly labeled leisure agriculture or agritourism, has been on the regional development agenda [33,34]. Furthermore, governments and citizens appreciate promoting the nature connectedness of children with outdoor education in the open countryside, which also promotes agritourism industry development [35]. Thus, agritourism has gained popularity worldwide over the last decade, and an increasing number of tourists have been visiting agritourism destinations such as sightseeing parks, on-farm restaurants, and picking orchards [36].
Leisure agriculture, interchangeable with agrileisure, agritourism, agritourism, sightseeing agriculture, recreational farm visits, rural eco-tourism, etc., has become largely the concern of academic scholars during the past few decades. Some researchers focused on the definition and classification of agritourism [37]. For instance, Barbieri et al. appealed for the standardization of the multiple names of agrileisure (i.e., farm visit, agritourism, etc.) [38]. Some have explored the agritourism domain from the supply-demand perspective. Gao et al. researched the effects of certain agritourism activities on visitor response and tourist revisit intention [39]. It was found that the agrileisure activities that require mutual cooperation (e.g., animal feeding, fruit/vegetable picking, etc.) are preferred, and that these activities enhance tourist revisit intention [40]. Some have probed into the determinants of agritourism development. Askarpour et al. demonstrated that education, diversified crops, and services are the main drivers of agritourism development [41]. Besides, there are also challenges and barriers to developing agritourism including issues related to marketing, product development, government support, education and training, and partnership and communication [42,43]. Others have assessed the benefits of the leisure agriculture industry to farmers, rural communities, and heritage preservation [44,45], and both economic and non-economic benefits have been identified [18,46].
Specifically, a majority of studies focus on the economic benefits of leisure agriculture [47,48]. It is demonstrated that the income is increased mainly through diversifying the income sources of traditional farm businesses, increasing market accessibility, and better enhancing farm products [49]. Meanwhile, leisure agriculture has considerably tackled the production, price, technological, and political uncertainties of highly unstable agricultural income since both yields and prices are not completely manageable over time [50]. The rural eco-tourism industry has become increasingly populous and brought great help for local economic development [51], with the potential to stimulate local production, generate exchange earnings, attract investments, and create new jobs as an engine of economic growth [52]. The crucial role that leisure agriculture plays in non-economic benefits is also addressed, such as revitalizing rural culture and facilitating public health, social justice, environmental sustainability, and heritage protection [45,47,53,54,55].
In many countries and regions, leisure agriculture has developed very successfully. Nonetheless, global leisure agriculture scenery make a huge difference as it is rooted in different farms’ agricultural resources and cultural and natural heritage of the local landscapes [39], for instance, wine tourism in Italy [56] and scenic villages in China. In developed countries, agritourism largely promotes further economic prosperity. In the United States, for example, during the 2007–2012 period, the number of farms offering agritourism increased by 42% from 23,350 to 33,161, grossing an income of US$704 million [57]. In France, the percentage of farms engaged in tourism was 3% in 2013 [58]. Even more, just in the Northern Italian Region of South Tyrol, around 15% of the existing farms offer tourist services [59]. In developing countries like China, recent years have seen leisure agriculture become a feasible approach to stimulating economic growth and achieving the pro-poor objectives of rural renewal towards uplifting the lives of small farmers in sustainable ways [60]. Through agritourism, rural residents can get additional income and more job opportunities by providing recreational services and tangible cultural resources and intangible cultural heritage rather than the traditional single farming mode [61,62]. Many rural households incorporating tourism into their livelihood strategy have caused the rapid expansion of leisure agriculture activities in China in light of economic needs and poverty alleviation [63]. All these call for a specific framework to understand the overall picture of leisure agriculture development in China.
Apart from farm-based accommodation and events, leisure agriculture entails organizing dedicated leisure activities such as agriculture-based festivals, farm markets, wineries, and U-Picks [42], among which picking orchards are a popular form of leisure agriculture in China [42,64]. Picking orchards are cultivated fields allowing consumers to enter the field and directly harvest their own product. A review of the relevant literature reveals that many authors use other terms with the same meaning, such as picking agriculture, U-Pick farms, pick-your-own farms, and picking gardens [64,65,66,67,68]. Picking orchards normally fall into one of two categories: vegetable and fruit farms. Typical eco-tourism picking orchards in China are shown in Figure 1. Figure 1a is one kind of representative vegetable farm (a potato farm) and Figure 1b is one kind of fruit farm (a strawberry farm). There is a wide variety of picking orchards in China, involving potatoes, cucumbers, mini-pumpkins, mini-carrots, eggplants, cherries, peaches, pears, apples, mangoes, watermelons, apricots, grapes, Chinese dates, loquats, pitayas, citruses, mulberries, persimmons, Chinese strawberries, raspberries, kiwi fruits, pomegranates, and so on. An abundant variety of papers have explored the development of picking orchards from multiple aspects. Some researches demonstrated that the climate, crop management strategies, and cultivars have a large impact on the performance of picking orchards [67,69,70]. Other researchers compared the tourists’ purchasing behavior during and after experiences in picking orchards with that of retail grocery stores and through other types of direct farm markets [65,66,71]. The results argue that the picking orchards have high profitability and improve the intentions toward local foods [65,69]. The price elasticity and output elasticity of picking orchards were investigated as well [64,66].
The fast-paced growth and benefits of leisure agriculture, especially picking orchards, is noteworthy, but more interesting is how and why leisure agriculture is distributed across the region. Research on the spatial distribution and place-based influencing factors of leisure agriculture is progressing. Thus far, some researchers have analyzed the spatial heterogeneity of leisure agriculture and its driving factors in both the U.S. and China [72]. Spatial analysis methods (e.g., local indicators of spatial autocorrelation (LISA) analysis, nearest neighbor analysis, kernel density estimation, proximity distance measurements, etc.) were used to investigate the spatial pattern of leisure agriculture [72,73,74,75]. Probit regression and the geodetector method have been used to detect the place-based factors related to the distribution of leisure agriculture [72,73,76]. A qualitative analytical method was also used in the identification of the place-based factors [77]. Moreover, spatial planning of leisure agriculture was explored by the methodological approach of spatial multiple criteria evaluation through the weighted linear combination of spatial factor layers as images in a geographical information system [78].
Despite this, insufficient research has been devoted to spatially characterizing leisure agriculture, especially at the national scale with a specific focus on sightseeing picking orchards, despite the advent of geospatial big data bringing about great opportunities for conducting research from a spatial perspective. Though great attention was devoted to the influencing factors of leisure agriculture based on farm characteristics and owner/farmer characteristics [79,80], few studies have examined the influencing factors involving regional natural conditions or socio-economic characteristics. To fill this research gap, this study analyzed the spatial pattern of leisure agriculture and its underlying mechanism by looking at the 20,778 picking orchards in China. This study adopts the methodological approach of average nearest neighbor, multi-distance spatial cluster analysis, and kernel density estimation for spatializing picking orchards in China, as well as analyzing the influencing factors.
The rest of the paper is organized as follows. Section 2 illustrates the data resources and analytical methods. Section 3 presents the spatial pattern of picking orchards and the influencing factors. Section 4 addresses the discussion, practical implications, and limitations of this study. Section 5 draws the conclusions. The statistics of picking orchards in China’s provincial-level administrative districts are reported in Appendix A. The explanation of ‘the Three Gradient Terrains of China (TGTC)’ is outlined in Appendix B.

2. Methodology

2.1. Data Resources

In this study, four data sets are involved (Table 1). The first is the points of interest (POIs) of picking orchards, where the points mark the locations of the picking orchards. These POIs are gathered and geo-coded by Gaode Map (AutoNavi Map, Similar to Google Map in China), from August to November of 2019. The ‘search service API’ on the Gaode Map open platform (AutoNavi Open Platform) (https://lbs.amap.com/api/webservice/guide/api/search/, accessed on 22 April 2021) provides a simple HTTP interface for retrieving relevant POIs by keyword search. We select frequently applied names of picking orchards (i.e., sightseeing garden, picking garden, picking orchards, strawberry bases, vineyards, loquat gardens, apple park, ecological garden, ecological farm, all in Chinese) and then capture all the geographical coordinates and names of the picking orchards by connection to the open platform using web scraping techniques by Python code with requests and json packages. After filtering and data cleansing, including deleting missing values, removing duplication, and checking the POI type manually by its name, 20,778 picking orchards and their locations were derived all over China. The second data set used was the fundamental geographic data, involving administrative divisions (e.g., provincial boundaries), municipal governments, transport networks, etc., collected from the National Geomatics Center of China (http://www.ngcc.cn/, accessed on 22 April 2021). Thirdly, population, GDP, per capita consumption, number of A-level scenic spots, etc., were directly gathered from the China Statistical Yearbook (2019) and China Tourism Statistical Yearbook (2019). The fourth data source was the digital evaluation model (DEM) of Aster GDEM with 30 × 30 resolution, from the platform of Geospatial Data Cloud (http://www.gscloud.cn, accessed on 22 April 2021). Hong Kong, Macao, and Taiwan are not included in this study due to the lack of available data in these regions. All these data sets are projected onto Albers equal-area conic projection system and stored in the form of data layers in ArcGIS 10.2 Software.

2.2. Methods

2.2.1. Average Nearest Neighbor (ANN)

Point pattern analysis regards an individual picking orchard as a point in two-dimensional space and then analyses their quantity and spatial characteristics. We conducted the average nearest neighbor (ANN) test using the Spatial Statistical Tools extension of ArcGIS 10.2, which evaluates whether the pattern expressed is clustered, dispersed, or random within the study area, to detect the distribution patterns of picking orchards. ANN refers to the distance from a certain point to its nearest neighbor [86]. Nearest neighbor index means the ratio of the observed ANN (i.e., the actual situation) to the theoretical ANN (i.e., the random distribution), commonly used as an indicator for point pattern analysis. The equation is as below:
r E ¯ = 1 2 n / A = 1 2 λ
R = r i ¯ r E ¯
In Equation (1), r E ¯ denotes the theoretical average nearest neighbor distance and n denotes the number of points. A represents the area of study region and λ refers to the point density. In Equation (2), R is the nearest neighbor index and r i ¯   is the actual average nearest neighbor distance. ‘R > 1’ shows that the actual average nearest neighbor distance is larger than the theoretical value. That is, points repel each other towards a scattered distribution. While ‘R < 1’ means that the actual average nearest neighbor distance is smaller than the theoretical average nearest neighbor distance. R = 1 represents the complete random pattern of point features. On this basis, three spatial patterns can be identified: scattered (R > 1), random (R = 1), and clustered form (R < 1) [87,88,89].

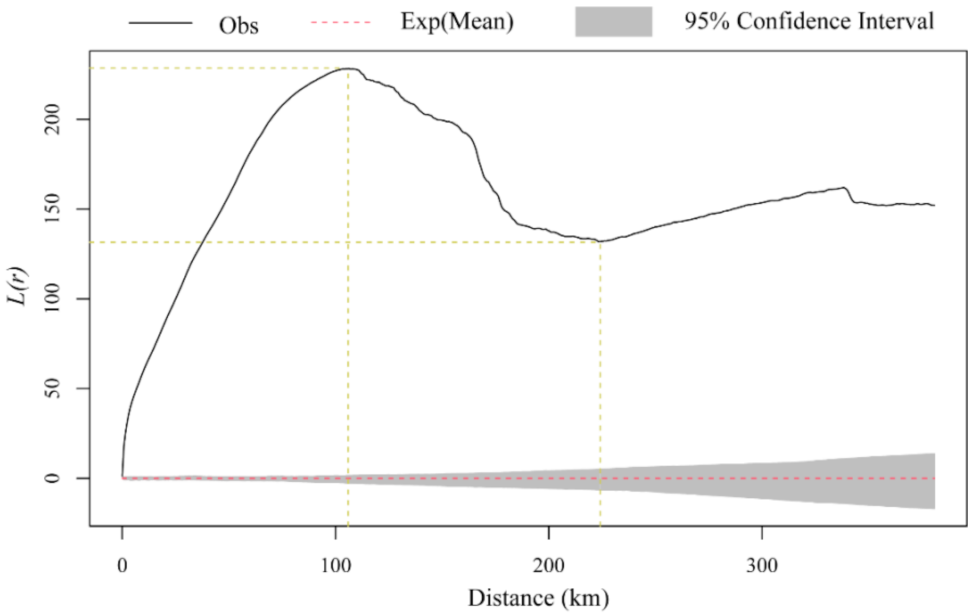
2.2.2. Multi-Distance Spatial Cluster Analysis (Ripley’s L Functions)

Ripley’s L function was calculated to assess the spatial pattern of picking orchards throughout the study area at varying spatial scales processed with Spatstat and Maptools packages for R [90]. Ripley’s L function is a second-order point pattern analysis based on the variance between points (picking orchards) in two-dimensional space that can determine whether the picking orchards exhibit statistically significant clustering or dispersion over a range of distances [91]. This method overcomes the shortcoming of the traditional method that the spatial distribution patterns at only a single scale can be analyzed, and makes the best use of the spatial information for different points. Ripley’s L-function is a multi-distance spatial cluster analysis tool that uses a common transformation of the Ripley’s K-function. Ripley’s K-function estimates the average number of points within a distance r of a randomly chosen point within the study area [92,93]. Deviations between the observed K curves with theoretical K curves which would be expected under complete spatial randomness (CSR) may suggest spatial clustering or spatial heterogeneity [94]. The K-function is defined as:
K r = a i = 1 n j = 1 , j i n k i , j n n 1
In which a is the area of the rectangle (study area); n is the number of spatial points; and ki,j is a weight that will be equal to one when the distance between point i and point j is less than r, and will be equal to zero otherwise.
Under the assumption of CSR generated by the uniform Poission point process, which is a well-documented process for generating reference point patterns, K(r) is equal to πr2. For simplification, square root transformation (L(r)) was applied to stabilize variance and give zero expectation under CSR. The square root also has the effect of stabilizing the variance of the estimator, so that L(r) is more appropriate for use in simulation envelopes and hypothesis tests. The transformation L(r) was shown as:
L r = K r π r
When the observed L(r) value is larger than the expected L(r) (namely 0) for a particular distance, the point distribution is more clustered than a random distribution at that distance. When the observed L(r) is smaller than 0, the pattern can be considered dispersed at that distance.
There is a limitation of Ripley’s K and L functions, which is the presence of edge, or boundary, effects. Edge effects arise because the theoretical distributions for most spatial point statistics assume an unbounded area, yet observed distributions are estimated from delineated regions [95]. For Ripley’s L function, edge correction is necessary when the radius extends over the boundary of the study area. A ‘border’ edge correction was applied in this study.
It is possible to represent graphically not only the observed L(r) function and the expected L(r) function but also an interval estimation of exact expected values, including both a lower and a higher confidence envelope. L(r) values above the envelope were considered to indicate clustering at r, values within it to indicate randomness, and values below it to indicate regularity [96].

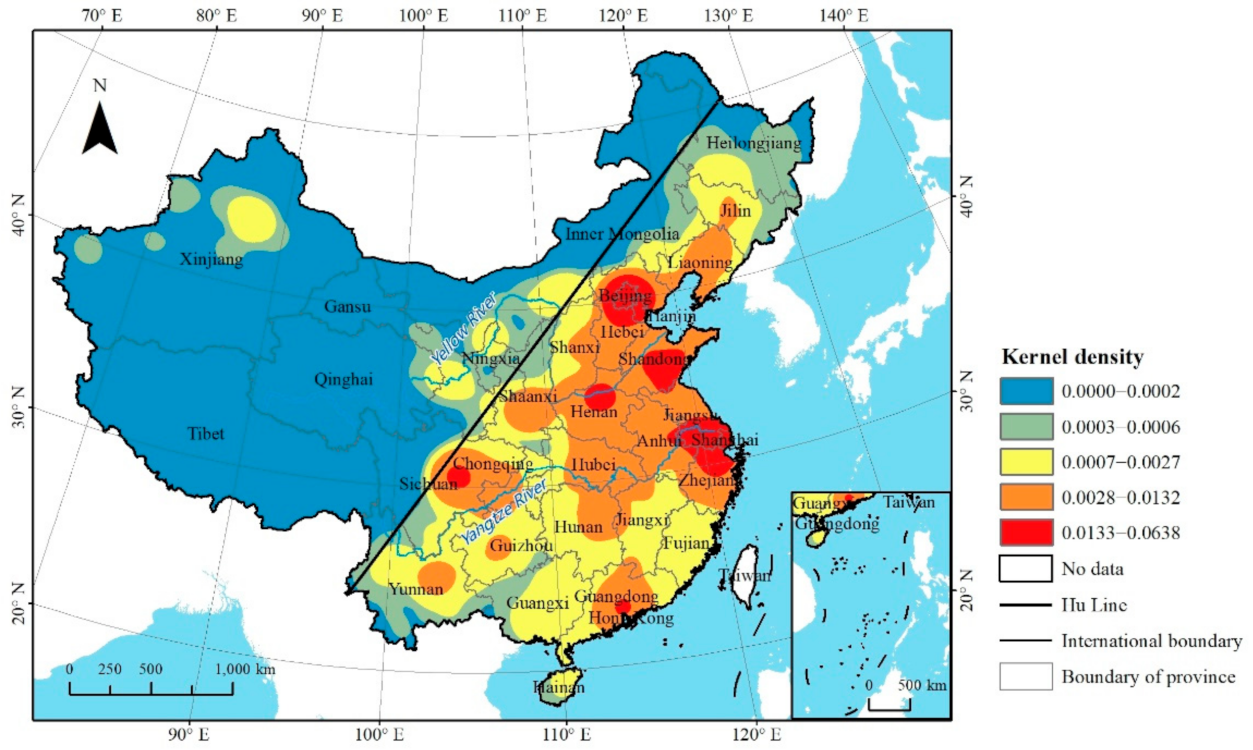
2.2.3. Kernel Density Estimation (KDE)

To reveal the distribution of the picking orchards in the study area, we used the kernel density estimation (KDE) tool of the Spatial Analyst Tools extension of ArcGIS 10.2. KDE has long been used for calculating the density value of unknown regions based on the distribution of specific spatial elements based on the kernel function [97,98]. The KDE equation is below:
f x = 1 T h i = 1 T k x X i h
In Equation (3),   f x refers to the kernel density estimated value, k x X i h is the kernel function. T represents the number of specific elements (i.e., the picking orchards in this research). h > 0 means the bandwidth. (x − Xi) denotes the distance between the estimated location and the known location. The bigger the kernel estimated density value is, the denser the spatial elements probably are.

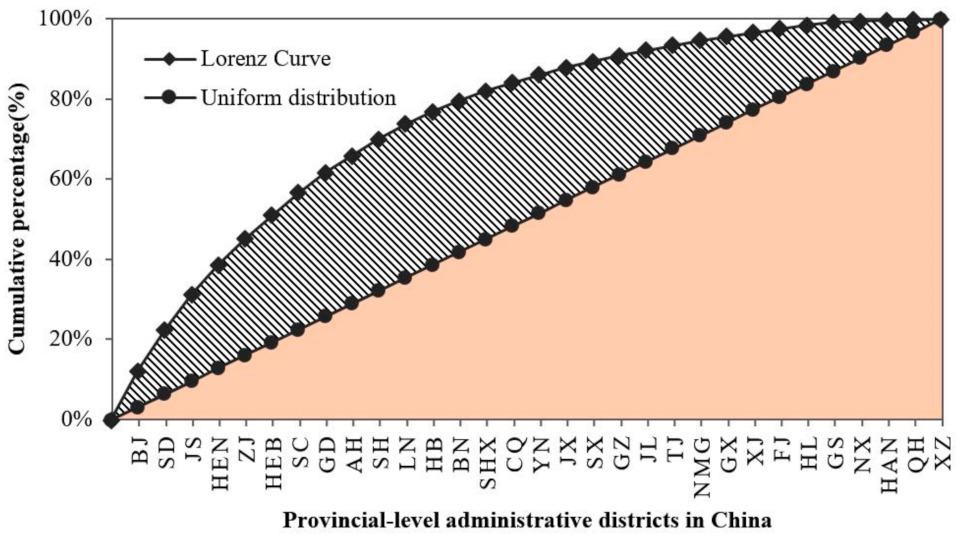
2.2.4. Lorenz Curve and Gini Coefficient

The Lorenz curve and Gini coefficient are mostly applied to measure distributive uniformity. They are selected here to explore the spatial equity of picking orchards among numerous provinces within the study area using Excel computing. The Lorenz curve, introduced by Lorenz (1905), illustrates the cumulative proportion of one variate, ranking from the lowest to the highest [99]. A Gini coefficient is defined as the percentage of the area between the Lorenz curve and a hypothetical absolute equilibrium line to the area under the Lorenz curve [100]. The range of a Gini coefficient is 0 to 1. The perfect inequality value is 1, while 0 indicates perfect equality [7]. This study adopts a Gini coefficient to measure the interprovincial distribution of sightseeing picking orchards. The equation is below:
G = i = 1 N P i l n P i l n N
In Equation (4), Pi is the share of picking orchards in the ith region of China. N refers to the number of regions. The higher the Gini value is, the more concentrated picking orchards in the region are.

3. Results

3.1. Spatial Pattern of Picking Orchards

According to Equations (1) and (2), the actual mean nearest neighbor distance of picking orchards is 3.36 km and the theoretical value is 10.67 km in China (R < 1). Numerically, this reveals that these picking orchards are distributed in clusters. By the average nearest-neighbor technique, normally small-scale clustering would be detected. Given point features, the pattern of picking orchards generally exhibits different forms at different spatial scales. To determine the pattern of picking orchards in this study area, scale effects should be taken into account. L-function, the standardized version of Ripley’s K-function, is used to examine the spatial dependence based on distances of each picking orchard from one another. The function outputs concern four parameters: the observed L (Obs, the black solid line), the expected L (Exp, the red dashed line), lower confidence envelope (lower boundary of the grey block) and the higher confidence envelope (higher boundary of the grey block) at the desired 95% confidence interval. As shown in Figure 2, the observed L value of picking orchards is always larger than the expected L value for any given distance threshold, indicating that the distribution of picking orchards is in general clustered. In addition, the observed L value is far beyond the 95% confidence simulation envelope, which indicates that the spatial clustering of the picking orchards is statistically significant. However, the extent of clustering differs. When the distance threshold is set to less than 106 km, the extent of clustering is positively associated with the distance. The peak of observed L value appears when the distance threshold is 106 km, showing that picking orchards are highly clustered at this distance scale. Afterwards, the level of clustering decreases with the increase in distance threshold. Yet, there is an inflection when the distance threshold is 224 km, and the level of clustering rises slowly above the threshold.

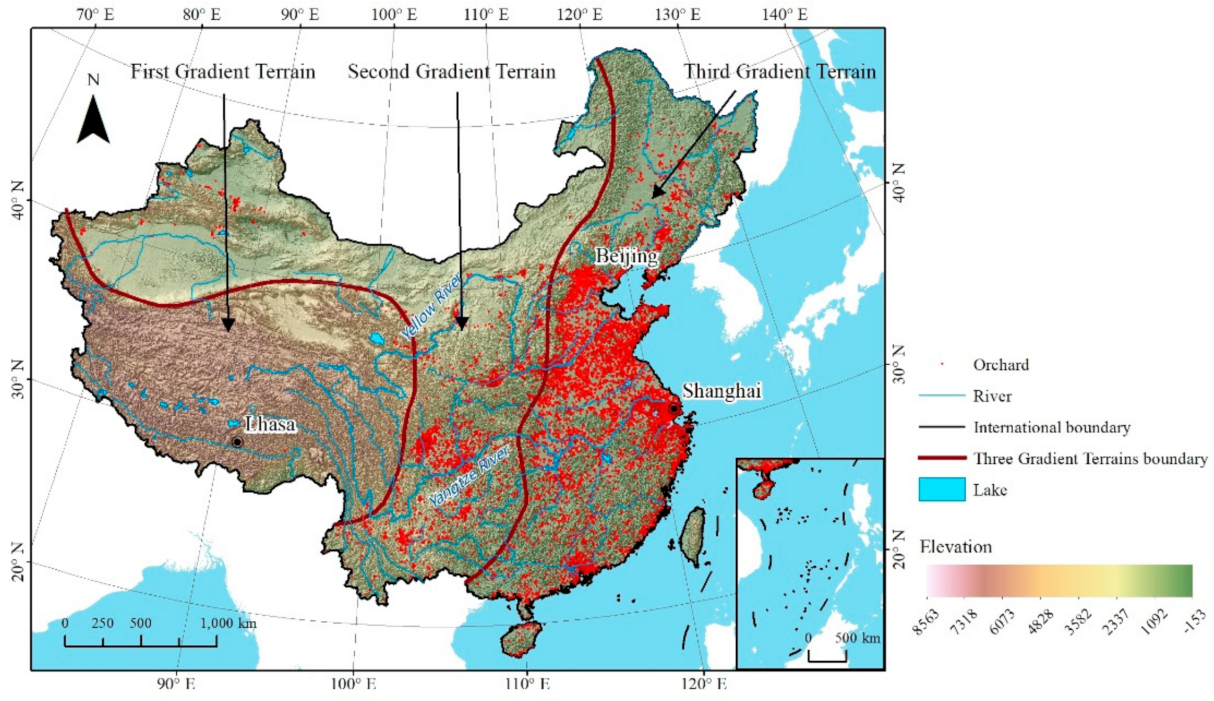
3.1.1. Spatial Distribution of Picking Orchards in China

Spatially, picking orchards are indeed aggregated via the KDE tool (with the bandwidth 200 km) in a GIS environment (obviously shown in Figure 3). In particular, Figure 3 illustrates the following: (1) A striking imbalance occurs in terms of these picking orchards’ distribution at the provincial scale, with a deceasing trend from the southeast to the northwest on the national scale; (2) The distribution pattern of these picking orchards tally with the Hu Line (the population density cutting line in China), meaning that the distribution of picking orchards on both sides of this line present great disparities; (3) On the southeast side of the Hu Line, six key aggregations are detected, namely, the region around Beijing and Tianjin City, Shandong Province, Henan Province, the core area of the Yangtze River Delta, the core area of the Pearl River Delta and the Chengyu urban agglomeration. On the northwest side of the Hu Line, few picking orchards are distributed, with only a few around Urumchi city in Xinjiang Province. (4) The spatial pattern of picking orchards tends to be a strip-type distribution along the traffic arteries of the Northeast, North China, and Central China (mainly, Beijing-Guangzhou Railway and Lanzhou-Lianyungang Railway). Most regions are traditional rural agricultural regions with concentrated agricultural production or developed urban areas with dense populations. The former regions normally yield sufficient fruits and residents in the latter regions possess in increasing desire for agritourism (i.e., sightseeing agriculture, leisure farms, etc.) in the process of rapid urbanization.

3.1.2. Interprovincial Discrepancy of Picking Orchard Distribution

Figure 4 illustrates the regional distribution of picking orchards in the form of a Lorenz curve. The x-axis lists the provinces and the y-axis shows the cumulative percentage of picking orchards per province. This figure numerically shows the interprovincial difference of picking orchards. To reflect the extent of distributive disparity, the Gini coefficient is calculated based on the Lorenz curve, and is 0.87 (close to 1). This demonstrates that the distribution of picking orchards at the provincial level is quite imbalanced.
In terms of the picking orchard number, the top five provincial-level districts are Beijing, Shandong, Jiangsu, Henan, and Zhejiang, together accounting for 45% of the total (Table A1). Taking Beijing as an example, this provincial-level municipality possesses 2552 picking orchards. These five provincial-level administrative regions are all in the Southeast of China, and are either economically developed or have a strong agricultural foundation. Provinces in the Northwest of China have few picking orchards in them. The smallest number is in Tibet, which only has 14 picking orchards. There are only 27, 56, and 58 in Qinghai, Hainan, and Ningxia, respectively. In terms of orchard density, the five top-ranked provincial-level districts are Beijing (118.48), Shanghai (34.82), Zhejiang (23.22), Jiangsu (22.99), and Shandong (21.07). The lowest-ranked provinces are Tibet, Guangxi, Qinghai, and Heilongjiang, which are all below 5 (see Appendix A).

3.2. The Influencing Factors of Picking Orchard Spatial Pattern

3.2.1. Topographic and Geomorphic Conditions

Topographic and geomorphic conditions are the fundamental factors affecting the development and transformation of rural production modes, and include earth surface water and heat distribution, soil quality and land use division, spatial configuration of crops, etc. In order to analyze the impact of topography and landform on the development of leisure agriculture, this paper selects DEM/elevation as the index of topographic and landform to demonstrate its influence mode and extent.
Figure 5 visualizes the spatial distribution of picking orchards in China, overlaid by the DEM layer with 1000 m resolution and the subregions of Three Gradient Terrains of China (TGTC) (see Appendix B). At a macro-level, picking orchards are most densely distributed on the First Gradient Terrains of China, especially in the Northeast Liaohe Plain, the North China Plain, the middle and lower reaches of the Yangtze River Plain, the Pearl River Delta and other flat areas. On the Second Gradient Terrains of China, picking orchards are mainly concentrated in the Wei-River Plain, Sichuan Basin and other relatively flat areas. In the Yunnan-Guizhou Plateau, there are local agglomeration distribution of picking orchards, while there are few in the northwest. On the Third Gradient Terrains of China, the number of picking orchards is very small. The elevation is divided into four grades: lower than 200, 200–500, 500–1000, and higher than 1000 m. The number of picking gardens at different elevations was counted. We found that picking orchards are mostly distributed in areas that are lower than 200 m, accounting for about 72.68%. The area with an elevation of 200–500 m accounts for about 13.61%. The area with an elevation of 500–1000 m accounts for about 7.65%. The area with an elevation of higher than 1000 m accounts for about 6.06%.
Hence, picking orchards are mostly distributed in areas with low altitude (e.g., plains), where there is more developed agriculture and stronger external economic ties, where it is easier to develop new types of leisure agriculture so as to supplement farmers’ income. However, high-altitude areas are generally located in mountainous areas and plateau areas, which are more isolated and have poor agricultural production conditions, making it more difficult to develop new leisure agriculture.

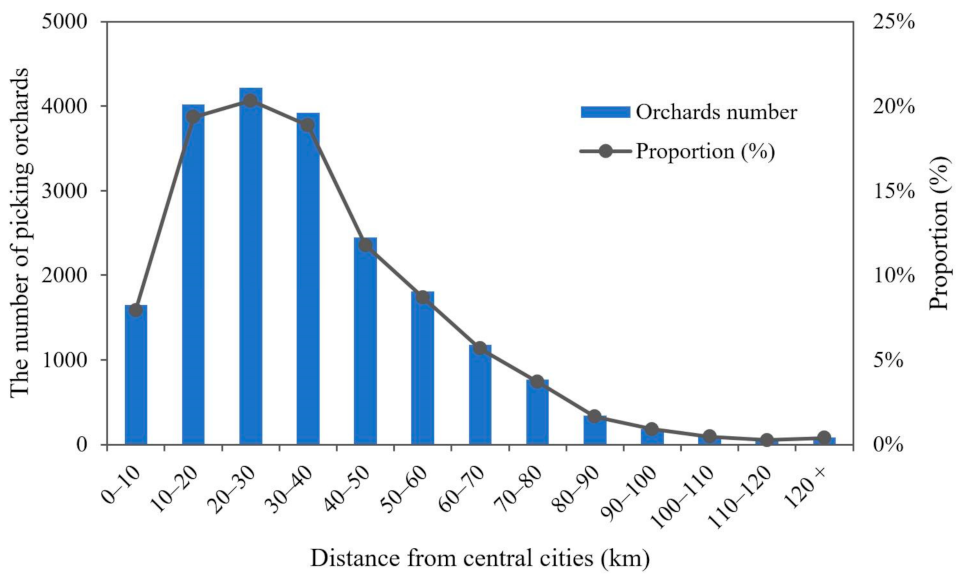
3.2.2. Distance to City Centers

The spatial configuration of central cities is deemed to play a significant role in the spatiality of leisure agriculture. Most tourists for leisure agriculture are normally urbanites with an increasing desire for idyllic scenery due to rapid socio-economic development. The closer leisure agriculture is to the central city within a certain region, the more urban tourists are probably attracted. In this study, we adopt China’s prefecture-level municipalities (i.e., city centers) as tourist origins. In this section, we will explore the spatial relation between city centers and picking orchards.
Figure 6 shows the spatial association between picking orchards and city centers. The x-axis shows the distance to its nearest city center per picking orchard. It clearly shows that most picking orchards are located within 10–40 km of a city center. This distance range enables urban tourists to reach this place within one hour, meaning that they can get there and back within one day since vehicle speed inside a city is about 50–60 km per hour [101,102]. That is, this distance range is suitable for excursions on weekends or holidays. With increasing distance, when the distance is more than 40 km away, the ratio of the picking orchards number sharply decreases. Picking orchards more than 40 km from a city center have a lower land price and more rural characteristics, but are less accessible.

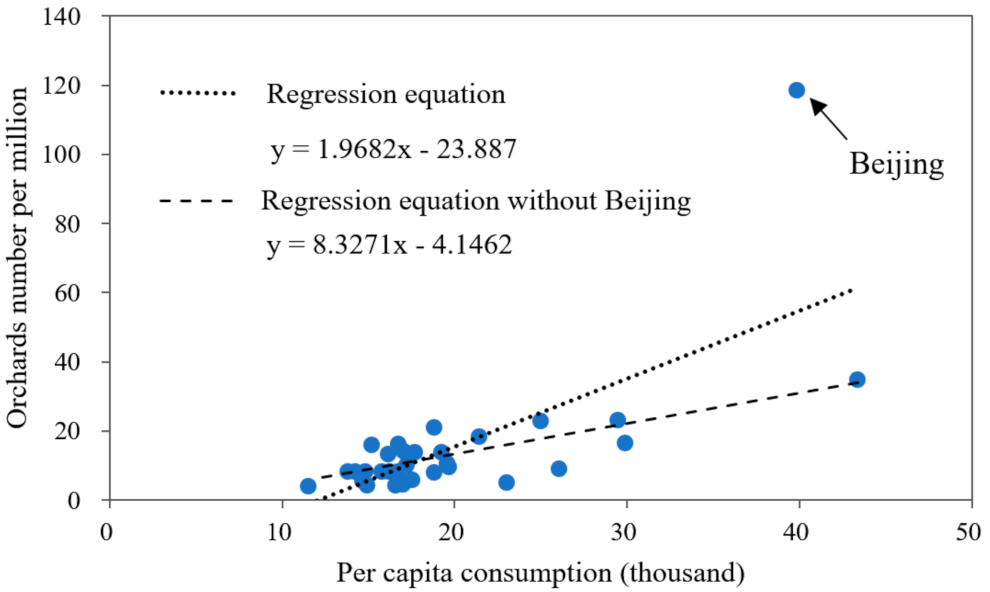
3.2.3. Economic Factors

A developed economy is an essential catalyst for innovative leisure agriculture, and brings about a solid financial, technological, and cultural basis. On the one hand, increasing individual income ensures their consumption ability for leisure, but on the other hand, regional economic development ensures agricultural and industrial modernization and promotes the shift from primary industry to secondary and tertiary industries in rural areas, thereby promoting the development of leisure agriculture. In this section, the per capita consumption expenditure is taken as an indicator reflecting the economic development level of a province.
Figure 7 presents the significantly positive linear relationship between economic development (consumption expenditure per capita) and the spatial distribution of picking orchards (the number of picking orchards per capita). That is, the higher the consumption expenditure is, the more picking orchards per capita there are. Based on the statistical calculation, the Pearson value is 0.75, with a significant correlation (p < 0.001). Yet the value of Beijing is an outlier, with the reason being that Beijing is unique due to its political and cultural position in China, which greatly facilitates its leisure agriculture industry, including picking orchards.

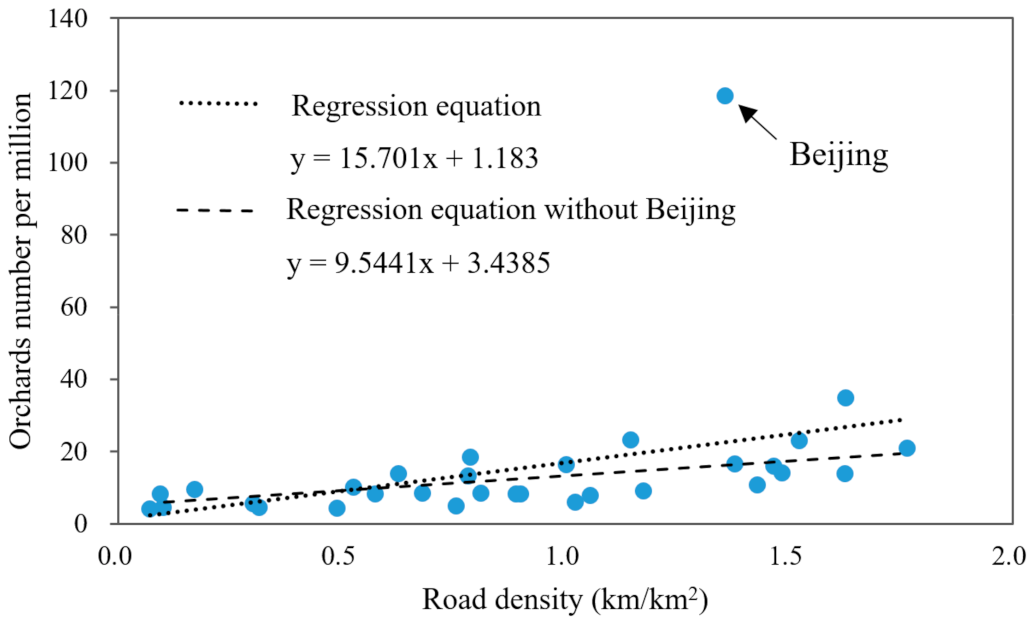
3.2.4. Traffic Condition

Traffic condition plays a fundamental role in the development of tourist industries. In other words, good traffic status facilitates the accessibility of picking orchards for tourists. This section selects the road network to represent traffic conditions.
Figure 8 shows that traffic condition and the distribution of picking orchards are significantly correlated. That is, the higher the road density is, the more picking orchards per capita there are. Based on the statistical calculation, the Pearson correlation coefficient is 0.68, with a significant correlation (p < 0.001). Yet again, the value of Beijing is an outlier.

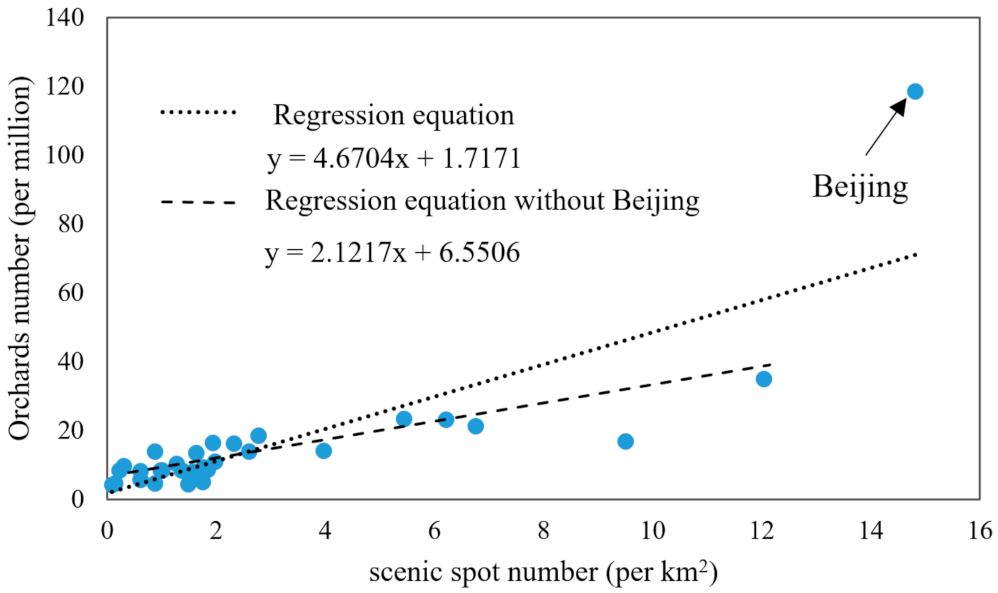
3.2.5. Tourism Resources

Given that leisure agriculture is the combination of agriculture and tourism, tourism resources is an important influencing factor of leisure agriculture. The sites of leisure agriculture is mostly positioned around popular tourist attractions. As satellite-type tourism attractions, leisure agricultural venues easily gain great numbers of potential tourists. This section is explores the relationship between tourism resources and leisure agriculture based on analyzing the correlation between the density of A-level scenic spots (per square kilometer) and picking orchards (per capita), shown in Figure 9.
Figure 9 displays the significant correlation between tourism resources and leisure agriculture, respectively by the indicators of the A-level scenic spot density (per square kilometer) and the picking orchards density (per capita). That is, the higher the density of A-level scenic spots is, the larger the number of picking orchards per capita is. Based on the statistical calculation, the Pearson correlation coefficient is 0.85, with a significant correlation (p < 0.001). Yet again, the value of Beijing is an outlier. This indicates that picking orchards still need to rely on the attraction of mature scenic spots, meaning that they are still in a subordinate position in the tourism industry. Meanwhile, rural tourism has a certain attraction and shows a trend of rapid development.

4. Discussion

4.1. Research Findings Compared to Other Studies

The government has seen leisure agriculture as an opportunity to stimulate rural development and fight poverty. Therefore, leisure agriculture as a rural industry is promoted by local governments all over China [63]. The rapid development of agritourism has been widely acknowledged, examined, and debated [103,104,105,106], and the spatial pattern and spatial drivers of agritourism need to be investigated. This study discovers the spatial heterogeneity of picking orchards in China at multiple scales. Firstly, it was found that the spatial pattern of agriculture leisure gardens is distributed in the form of clusters and that a striking disparity occurs on both sides of the Hu Line (i.e., the Heihe-Tengchong Line), namely, five highly-clustered agglomerations in the southeast and four clusters in the northwest of China. In this sense, there is a large spatial disparity all around the country in China, and huge regional differences of agritourism development embody the complexity and diversity of agritourism development. There exist multiple studies that investigate the spatial distribution of leisure agriculture both in China and abroad [72,73,74,75,76,77]. While most of these studies are based on statistical data on the municipal level [72,76,77,107] or national or regional demonstration sites in leisure agriculture [73,75,108], we carried out our research based on the POIs from the web map service, which has not been done in previous studies especially on the national scale in China. The detailed data enables us to further analyze the spatial pattern of picking orchards on multiple scales. In addition, most studies included the picking orchards (interchangeable with picking agriculture, U-Pick farms, pick-your-own farms, and picking gardens) in the leisure agriculture industry more broadly [40]. We are not aware of any research investigating the spatial aspects of picking orchards separately, and this article starts an initial research interest on the topic. The distribution pattern of picking orchard destinations in space represents valuable information to improve the planning and management of regional agritourism development.
The spatial patterns reported in this study indicate that there are a diverse set of factors that may contribute to the concentration of picking orchards. This paper focuses on the geographical indicators and the socio-economic factors relating to location conditions, and five influencing factors are identified in this study. Most of the five factors identified within the present study are in line with other studies. Factor 1 (geomorphic and topologic condition) has demonstrated a remarkable influence on the development of picking orchards. Picking orchards are normally distributed in flat regions with low altitude (i.e., plains, basins) in the First and Second Gradient Terrains of China. This conforms to our expectation. The flat regions, rather than hilly regions with high altitude, are indeed preferred by residents to live and partake in activities in, which fosters eco-rural tourism. Factor 2 (distance to central cities) and factor 3 (traffic conditions) indicate that the location of the region and the access convenience of the spot is very important. The current study indicates that most picking orchards are gathered within 40 km of city centers, which is around half an hour’s drive one way. This indicates that people favor short sight-seeing trips to eco-farms, and this tallies with the actual situation. That is, urbanites normally plan picking orchard visits on weekends. Similar studies confirmed this finding that farms and areas close to central cities and provincial capitals are more suitable for agritourism [109]. Besides, new picking orchards should be constructed within a relatively small distance from city centers. Further, it is found that the number of picking orchards per capita positively correlates with Factor 4 (per capita consumption of the local region). Given that per capita consumption reflects economic conditions, this finding suggests that people in more economically developed regions pursue or participate in agricultural leisure activities more often. This finding is consistent with the views of Shaken et al., as potential tourists are highly influenced by the amount they are willing to pay for agritourism services [110]. Factor 5 (the density of A-level scenic spots) is demonstrated to significantly correlate with the picking orchards number. This is because A-level scenic spots increase tourism in an area and cause peripheral rural sightseeing at eco-farms. In this regard, Sandt et al. emphasize factors such as proximity to outdoor attractions and other environmental features in the formation and prosperity of leisure agriculture [72]. Konečný has also highlighted that agritourism is indeed concentrated in areas which are already established as popular tourist destinations, and this reflects the importance of mass-tourism for the development of leisure agriculture [77]. These influencing factors mentioned above indicate that developed economic, transportation, and tourist conditions facilitate the prosperity of neo-agriculture leisure gardens.

4.2. Research Limitations

This study has the following limitations: (1) Our sample only considers one type of leisure agriculture, namely picking orchards. We chose this type of leisure agriculture because it is one of the most popular forms of leisure agriculture. Nonetheless, there are also other POIs concerning leisure agriculture locales (i.e., agricolas, fishing gardens, etc.) in China that were not involved in the current research as a whole to better understand agriculture leisure from a comprehensive perspective. Multiple types of leisure agriculture may be analyzed, and these may reveal various spatial patterns. (2) The present work only analyzed the supply of leisure agriculture, but not its demand. The demand side cannot be neglected before policy and operating decisions are made, since consumers play an increasingly powerful role and it would be very helpful to consider the opinions of the consumers before making business decisions. Given the spatiality of leisure agriculture, this study largely clarifies the spatial pattern and influencing factors, yet how to optimize the spatial planning of these leisure agriculture gardens is not mentioned in this study, either. (3) The method adopted in this study does not consider the evolution of the spatial pattern over time, since the rural tourism industry has undergone tremendous changes in China in the past few years. Time-series geo-big data remains to be combined to discover the dynamic regularity of agri-leisure tempo-spatial evolution. In future research, we will collect the annual POIs and time-series remote sensing images to deal with this limitation. (4) This study is unable to cover all factors influencing the development of agritourism. Besides the natural and economic factors, some other factors might also have a great impact on the development of agri-leisure, such as tourists’ preferences, the role of central government, the participation of local residents, agricultural entrepreneurship, willingness, and skill, and so on. That is, a systematic analysis should be done, involving more factors in future through combining the qualitative methods besides the spatial quantitative methods. (5) This study does not concern the negative effects of agritourism, despite the fact that the possible negative effects of agritourism might occur, such as cultural conflicts, destruction of quiet rural environments, and land grabbing. In future research, how these series of spatial approaches function to eliminate these negative effects remains to be combined. Future research design can be conducted to further overcome these limitations.

4.3. Practical Implications

This research contributes to the more efficient management of resources, favoring certain positive effects (e.g., those derived from agglomeration economies) and managing/minimizing possible negative impacts (e.g., excess competition). From the results obtained, some recommendations are presented for the government and other stakeholders of leisure agriculture: (1) The spatial disparity and regional discrepancy of the picking orchard distribution indicates that the national agri-leisure development guidance should be diversified and fit for the local situation. (2) Attention to the five highly-clustered agglomerations in the southeast and four clusters in the northwest of China should be prioritized. Their developmental paradigm of leisure agriculture could be generalized to other regions where the leisure agriculture is less developed. (3) To advance the progress of agriculture leisure, effective measures could be taken towards improving road connectivity and density for improving traffic conditions and initiating or upgrading A-level scenic spots to increase tourist radiation effects. High road density indicates developed traffic conditions, and facilitates the spatial accessibility of visiting picking orchards. More interaction and articulation are necessary between mass tourism and leisure agriculture, so as to generate synergies for customers and competitive advantage. (4) Planning should not be neglected, and the development suitability assessments of leisure agriculture should be a priority. Rural informatics and more spatial analytics should be adopted to facilitate the planning and governance of leisure agriculture.

5. Conclusions

Given people’s increasing leisure needs, the advent of the geo-big data era, and the great challenges of rural decline, leisure agriculture or rural tourism is deemed a feasible approach to rural revitalization, poverty alleviation, and urban-rural integration. Despite leisure agriculture receiving increasing attention from spatial planners, researchers, and local authorities, the spatial pattern of leisure agriculture has seldom been addressed, especially on a large scale by geo-spatial big data. This study investigates the spatiality of leisure agriculture and its driving mechanisms, with a specific focus on sightseeing picking orchards, through multiple spatial statistical methods in China. This study discovered three main findings. Firstly, the spatial heterogeneity of picking orchards was discovered. Specifically, picking orchards are clustered with an uneven spatial distribution pattern in China. Secondly, five spatial agglomerations are found involving the regions around Beijing and Tianjin, Shandong hinterland, Henan hinterland, the core district of the Yangtze Delta, and the core district of the Pearl River Delta. Thirdly, the influencing factors of the picking orchard distribution were investigated, and it was revealed that the spatial pattern of picking orchards is largely influenced by morphology, distance to city centers, traffic conditions, economic development, and tourism resources. A better understanding the characteristics of a region where leisure agriculture is most viable may help guide farm managers and programming decision makers. Meanwhile, this study benefits policy making and rural planning towards sustainable eco-agritourism, agricultural entrepreneurial upgradation, and rural spatial layout optimization.

Author Contributions

Conceptualization, J.C. and Y.J.; methodology, J.C.; software, R.L.; validation, Y.J.; formal analysis, R.L.; investigation, Y.J.; resources, J.C.; data curation, L.Z.; writing—original draft preparation, J.C.; writing—review and editing, Y.J.; visualization, R.L.; supervision, Y.J.; project administration, J.C.; funding acquisition, J.C. All authors have read and agreed to the published version of the manuscript.

Funding

This research was funded by the National Natural Science Foundation of China, grant number 41901201, and the Fundamental Research Funds for the Central Universities, grant number CCNU20QN034.

Conflicts of Interest

The authors declare no conflict of interest.

Appendix A

This below table supplements Section 3.1.2.
Table A1. The statistics of picking orchards in China’s provincial-level administrative districts.
Provincial-Level DistrictArea
(/1000 km2)
Population
(/Million)
Population Density
(/km2)
Orchard NumberOrchard Density
(/Million People)
Orchard Density
(/1000 km2)
Beijing16.4021.541313.052552118.4815.56
Shandong155.85100.47644.67211721.071.36
Jiangsu102.5980.51784.75185122.991.80
Henan165.6596.05579.83154016.030.93
Zhejiang105.0557.37546.10133223.221.27
Hebei188.1775.56401.55123516.340.66
Sichuan486.1183.41171.59115613.860.24
Guangdong177.93113.46637.6710409.170.59
Anhui140.1463.24451.2789214.100.64
Shanghai8.0624.243008.0084434.8210.47
Liaoning146.7843.59296.9780718.510.55
Hubei185.9459.17318.2263610.750.34
Hunan211.8368.99325.685507.970.26
Shaanxi205.5538.64187.9851713.380.25
Chongqing82.3731.02376.5943013.860.52
Yunnan383.2248.3126.043978.220.10
Jiangxi166.9446.48278.423938.460.24
Shanxi156.7537.18237.193138.420.20
Guizhou176.0936204.443038.420.17
Jilin191.0227.04141.5627510.170.14
Tianjin11.7915.61322.9426016.672.21
Inner Mongolia1146.1425.3422.112429.550.02
Guangxi236.5749.26208.222164.380.09
Xinjiang1630.5924.8715.252068.280.01
Fujian122.3339.41322.171995.050.16
Heilongjiang452.7337.7383.341734.590.039
Gansu425.4326.3761.981475.570.04
Ningxia51.966.88132.41588.430.11
Hainan33.989.34274.89566.000.17
Qinghai696.666.038.66274.480.004
Tibet1202.083.442.86144.070.001

Appendix B

This appendix supplements Section 3.2.1. The explanation of the ‘Three Gradient Terrains of China (TGTC)’. Specifically, the terrains of China, showing a trend of being high in the west and low in the east, can be categorized largely into three gradient terrains that consist of different geomorphic units, namely, glaciers and mountains (the First Gradient Terrain [highest]), basins and plateaus (the Second Gradient Terrain [less high]), and plains (the Third Gradient Terrain [lowest]).

References

  1. Veal, A.J. The leisure society II: The era of critique, 1980–2011. World Leis. J. 2012, 54, 99–140. [Google Scholar] [CrossRef] [Green Version]
  2. Molitor, G. The Dawn of the Leisure Era. Assoc. Manag. 2000, 52, 76–81. [Google Scholar]
  3. Molitor, G.T.T.; Forecasting, P.P. Part I: Oncoming “Leisure Era”: How We are Getting There. J. Futures Stud. 2008, 12, 109–120. [Google Scholar]
  4. Liu, Y.; Jing, Y.; Cai, E.; Cui, J.; Zhang, Y.; Chen, Y. How Leisure Venues Are and Why? A Geospatial Perspective in Wuhan, Central China. Sustainability 2017, 9, 1865. [Google Scholar] [CrossRef] [Green Version]
  5. Jing, Y.; Liu, Y.; Cai, E.; Liu, Y.; Zhang, Y. Quantifying the spatiality of urban leisure venues in Wuhan, Central China—GIS-based spatial pattern metrics. Sustain. Cities Soc. 2018, 40, 638–647. [Google Scholar] [CrossRef]
  6. United Nations. World Urbanization Prospects: The 2018 Revision; United Nations: New York, NY, USA, 2019. [Google Scholar]
  7. Tian, F.; Pan, J. Hospital bed supply and inequality as determinants of maternal mortality in China between 2004 and 2016. Int. J. Equity Health 2021, 20, 51. [Google Scholar] [CrossRef] [PubMed]
  8. Chen, M.; Zhang, J.; Zhang, Y.; Wu, K.; Yang, Y. Rural Soundscape: Acoustic Rurality? Evidence from Chinese Countryside. Prof. Geogr. 2021, 1–14, published online. [Google Scholar] [CrossRef]
  9. Yarwood, R. Beyond the Rural Idyll: Images, countryside change and geography. Geography 2020, 90, 19–31. [Google Scholar] [CrossRef]
  10. Daugstad, K.; Kirchengast, C. Authenticity and the Pseudo-Backstage of Agri-Tourism. Ann. Tour. Res. 2013, 43, 170–191. [Google Scholar] [CrossRef] [Green Version]
  11. Flanigan, S.; Blackstock, K.; Hunter, C. Generating public and private benefits through understanding what drives different types of agritourism. J. Rural Stud. 2015, 41, 129–141. [Google Scholar] [CrossRef]
  12. Zhou, L. Online rural destination images: Tourism and rurality. J. Destin. Mark. Manag. 2014, 3, 227–240. [Google Scholar] [CrossRef]
  13. Eusébio, C.; Carneiro, M.J.; Kastenholz, E.; Figueiredo, E.; Soares da Silva, D. Who is consuming the countryside? An activity-based segmentation analysis of the domestic rural tourism market in Portugal. J. Hosp. Tour. Manag. 2017, 31, 197–210. [Google Scholar] [CrossRef]
  14. Huber, M.; Hofstetter, P.; Hochuli, A. A Demand-driven Success Factor Analysis for Agritourism in Switzerland. J. Rural Community Dev. 2020, 15, 1–16. [Google Scholar]
  15. Chueh, H.-C.; Lu, Y.-H. My dream life in a rural world: A nonfiction media representation of rural idyll in Taiwan. J. Rural Stud. 2018, 59, 132–141. [Google Scholar] [CrossRef]
  16. Shucksmith, M. Re-imagining the rural: From rural idyll to Good Countryside. J. Rural Stud. 2018, 59, 163–172. [Google Scholar] [CrossRef] [Green Version]
  17. Ezebilo, E.E.; Boman, M.; Mattsson, L.; Lindhagen, A.; Mbongo, W. Preferences and willingness to pay for close to home nature for outdoor recreation in Sweden. J. Environ. Plan. Manag. 2013, 58, 283–296. [Google Scholar] [CrossRef]
  18. Tew, C.; Barbieri, C. The perceived benefits of agritourism: The provider’s perspective. Tour. Manag. 2012, 33, 215–224. [Google Scholar] [CrossRef]
  19. Haller, A. Urbanites, smallholders, and the quest for empathy: Prospects for collaborative planning in the periurban Shullcas Valley, Peru. Landsc. Urban Plan. 2017, 165, 220–230. [Google Scholar] [CrossRef] [Green Version]
  20. Siderelis, C.; Smith, J.W. Ecological settings and state economies as factor inputs in the provision of outdoor recreation. Environ. Manag. 2013, 52, 699–711. [Google Scholar] [CrossRef]
  21. Bowen, R.L.; Cox, L.J.; Fox, M. The interface between tourism and agriculture. J. Tour. Stud. 1991, 2, 43–54. [Google Scholar]
  22. Frederick, M. Rural Tourism and Economic Development. Econ. Dev. Q. 1993, 7, 215–224. [Google Scholar] [CrossRef]
  23. Loumou, A.; Glourga, C.; Dimitrakopoulos, P. Tourism Contribution to Agro-Ecosystems Conservation: The Case of Lesbos Island, Greece. Environ. Manag. 2000, 26, 363–370. [Google Scholar] [CrossRef] [PubMed]
  24. Yang, Z.; Cai, J.; Sliuzas, R. Agro-tourism enterprises as a form of multi-functional urban agriculture for peri-urban development in China. Habitat Int. 2010, 34, 374–385. [Google Scholar] [CrossRef]
  25. Shih, H.-Y.; Yao, Y.-S. Indicators of Low-Carbon Management in the Leisure Industry: Research Using Examples in Taiwan and China. Sustainability 2020, 12, 4326. [Google Scholar] [CrossRef]
  26. Berry, H.L. ‘Crowded suburbs’ and ‘killer cities’: A brief review of the relationship between urban environments and mental health. N. S. W. Public Health Bull. 2007, 18, 222–227. [Google Scholar] [CrossRef] [PubMed]
  27. Wang, R.; Xue, D.; Liu, Y.; Chen, H.; Qiu, Y. The relationship between urbanization and depression in China: The mediating role of neighborhood social capital. Int. J. Equity Health 2018, 17, 105. [Google Scholar] [CrossRef] [PubMed] [Green Version]
  28. Wang, R.; Feng, Z.; Liu, Y.; Qiu, Y. Is lifestyle a bridge between urbanization and overweight in China? Cities 2020, 99, 102616. [Google Scholar] [CrossRef]
  29. Chen, J.; Chen, S. Mental health effects of perceived living environment and neighborhood safety in urbanizing China. Habitat Int. 2015, 46, 101–110. [Google Scholar] [CrossRef]
  30. Joung, D.; Lee, B.; Lee, J.; Lee, C.; Koo, S.; Park, C.; Kim, S.; Kagawa, T.; Park, B.J. Measures to Promote Rural Healthcare Tourism with a Scientific Evidence-Based Approach. Int. J. Environ. Res. Public Health 2020, 17, 3266. [Google Scholar] [CrossRef]
  31. Pope, D.; Tisdall, R.; Middleton, J.; Verma, A.; van Ameijden, E.; Birt, C.; Macherianakis, A.; Bruce, N.G. Quality of and access to green space in relation to psychological distress: Results from a population-based cross-sectional study as part of the EURO-URHIS 2 project. Eur. J. Public Health 2018, 28, 35–38. [Google Scholar] [CrossRef] [Green Version]
  32. Rugel, E.J.; Carpiano, R.M.; Henderson, S.B.; Brauer, M. Exposure to natural space, sense of community belonging, and adverse mental health outcomes across an urban region. Environ. Res. 2019, 171, 365–377. [Google Scholar] [CrossRef]
  33. Ciolac, R.; Adamov, T.; Iancu, T.; Popescu, G.; Lile, R.; Rujescu, C.; Marin, D. Agritourism-A Sustainable Development Factor for Improving the ‘Health’ of Rural Settlements. Case Study Apuseni Mountains Area. Sustainability 2019, 11, 1467. [Google Scholar] [CrossRef] [Green Version]
  34. Chiodo, E.; Fantini, A.; Dickes, L.; Arogundade, T.; Lamie, R.D.; Assing, L.; Stewart, C.; Salvatore, R. Agritourism in Mountainous Regions—Insights from an International Perspective. Sustainability 2019, 11, 3715. [Google Scholar] [CrossRef] [Green Version]
  35. Braun, T.; Dierkes, P. Connecting students to nature—How intensity of nature experience and student age influence the success of outdoor education programs. Environ. Educ. Res. 2016, 23, 937–949. [Google Scholar] [CrossRef]
  36. Karampela, S.; Kizos, T. Agritourism and local development: Evidence from two case studies in Greece. Int. J. Tour. Res. 2018, 20, 566–577. [Google Scholar] [CrossRef]
  37. Gil Arroyo, C.; Barbieri, C.; Rozier Rich, S. Defining agritourism: A comparative study of stakeholders’ perceptions in Missouri and North Carolina. Touri. Manag. 2013, 37, 39–47. [Google Scholar] [CrossRef]
  38. Barbieri, C.; Xu, S.; Gil-Arroyo, C.; Rich, S.R. Agritourism, Farm Visit, or …? A Branding Assessment for Recreation on Farms. J. Travel Res. 2015, 55, 1094–1108. [Google Scholar] [CrossRef]
  39. Gao, J.; Barbieri, C.; Valdivia, C. Agricultural Landscape Preferences: Implications for Agritourism Development. J. Travel Res. 2013, 53, 366–379. [Google Scholar] [CrossRef] [Green Version]
  40. Liang, A.R.-D.; Hsiao, T.-Y.; Chen, D.-J.; Lin, J.-H. Agritourism: Experience design, activities, and revisit intention. Tour. Rev. 2020. ahead-of-print. [Google Scholar] [CrossRef]
  41. Askarpour, M.H.; Mohammadinejad, A.; Moghaddasi, R. Economics of agritourism development: An Iranian experience. Econ. J. Emerg. Mark. 2020, 12, 93–104. [Google Scholar] [CrossRef]
  42. Colton, J.W.; Bissix, G. Developing Agritourism in Nova Scotia: Issues and Challenges. J. Sustain. Agric. 2005, 27, 91–112. [Google Scholar] [CrossRef]
  43. Yang, L. Impacts and Challenges in Agritourism Development in Yunnan, China. Tour. Plan. Dev. 2012, 9, 369–381. [Google Scholar] [CrossRef]
  44. Hung, W.-T.; Ding, H.-Y.; Lin, S.-T. Determinants of performance for agritourism farms: An alternative approach. Curr. Issues Tour. 2016, 19, 1281–1287. [Google Scholar] [CrossRef]
  45. LaPan, C.; Barbieri, C. The role of agritourism in heritage preservation. Curr. Issues Tour. 2014, 17, 666–673. [Google Scholar] [CrossRef]
  46. Barbieri, C.; Sotomayor, S.; Aguilar, F.X. Perceived Benefits of Agricultural Lands Offering Agritourism. Tour. Plan. Dev. 2019, 16, 43–60. [Google Scholar] [CrossRef]
  47. Nematpour, M.; Khodadadi, M. Farm tourism as a driving force for socioeconomic development: A benefits viewpoint from Iran. Curr. Issues Tour. 2021, 24, 247–263. [Google Scholar] [CrossRef]
  48. Veeck, G.; Hallett, L.; Che, D.; Veeck, A. The Economic Contributions of Agricultural Tourism in Michigan. Geogr. Rev. 2016, 106, 421–440. [Google Scholar] [CrossRef]
  49. Quadri-Felitti, D.; Fiore, A.M. Experience economy constructs as a framework for understanding wine tourism. J. Vacat. Mark. 2012, 18, 3–15. [Google Scholar] [CrossRef]
  50. Arru, B.; Furesi, R.; Madau, F.A.; Pulina, P. “Value portfolio”, value creation and multifunctionality: The case study of an Italian wine agritourism farm. Aestimum 2019, 75, 163–181. [Google Scholar] [CrossRef]
  51. Gong, X.; Zhu, W.C.; Liu, S. The Strategy of Eco-Agriculture Economic Development along the Coast Based on Improving the Rural Eco-Tourism Environment. J. Coast. Res. 2020, 104, 652–655. [Google Scholar] [CrossRef]
  52. Torres, R.; Momsen, J.H. Challenges and potential for linking tourism and agriculture to achieve pro-poor tourism objectives. Psychol. Rep. 2008, 40, 3027–3028. [Google Scholar] [CrossRef]
  53. Amsden, B.; McEntee, J. Agrileisure: Re-imagining the relationship between agriculture, leisure, and social change. Leisure/Loisir 2011, 35, 37–48. [Google Scholar] [CrossRef]
  54. Farmer, J.R.; Chancellor, C.; Robinson, J.M.; West, S.; Weddell, M. Agrileisure: Farmers’ Markets, CSAs, and the Privilege in Eating Local. J. Leis. Res. 2014, 46, 313–328. [Google Scholar] [CrossRef]
  55. Lin, C.-N. A Fuzzy Analytic Hierarchy Process-Based Analysis of the Dynamic Sustainable Management Index in Leisure Agriculture. Sustainability 2020, 12, 5395. [Google Scholar] [CrossRef]
  56. Bitsani, E.; Kavoura, A. Connecting Oenological and gastronomical tourisms at the Wine Roads, Veneto, Italy, for the promotion and development of agrotourism. J. Vacat. Mark. 2012, 18, 301–312. [Google Scholar] [CrossRef]
  57. University of Tennessee. 2007 and 2012 Census of Agriculture Data and Direct Sales, CSAs, Value-Added Products and Agritourism for Selected Southern States and the United States; University of Tennessee: Knoxville, TN, USA, 2014. [Google Scholar]
  58. Annes, A.; Wright, W. ‘Creating a room of one’s own’: French farm women, agritourism and the pursuit of empowerment. Women’s Stud. Int. Forum 2015, 53, 1–11. [Google Scholar] [CrossRef]
  59. Barbieri, C.; Streifeneder, T. Agritourism Advances around the Globe: A Commentary from the Editors. Open Agric. 2019, 4, 712–714. [Google Scholar] [CrossRef]
  60. Qiu, S.R.; Fan, S.S. Recreational value estimation of suburban leisure agriculture:a case study of the Qianjiangyue agritourism farm. J. Mt. Sci. 2016, 13, 183–192. [Google Scholar] [CrossRef]
  61. Ma, X.; Wang, R.; Dai, M.; Ou, Y. The influence of culture on the sustainable livelihoods of households in rural tourism destinations. J. Sustain. Tour. 2021, 29, 1235–1252. [Google Scholar] [CrossRef]
  62. Su, Z.; Aaron, J.R.; Guan, Y.; Wang, H. Sustainable Livelihood Capital and Strategy in Rural Tourism Households: A Seasonality Perspective. Sustainability 2019, 11, 4833. [Google Scholar] [CrossRef] [Green Version]
  63. Tao, C. Development Efficiency of Leisure Agriculture Based on DEA Model in the Background of Rural Revitalization. Rev. Cercet. Interv. Soc. 2019, 67, 169–187. [Google Scholar] [CrossRef]
  64. Du, N.; Shao, Q.; Hu, R. Price Elasticity of Production Factors in Beijing’s Picking Gardens. Sustainability 2019, 11, 2160. [Google Scholar] [CrossRef] [Green Version]
  65. Brune, S.; Knollenberg, W.; Stevenson, K.T.; Barbieri, C. U-Pick Farms: Harvesting More than Pumpkins. J. Park Recreat. Adm. 2020, 38, 135–144. [Google Scholar] [CrossRef]
  66. Carpio, C.E.; Wohlgenant, M.K.; Safley, C.D. A Structural Econometric Model of Joint Consumption of Goods and Recreational Time: An Application to Pick—Your—Own Fruit. Am. J. Agric. Econ. 2008, 90, 644–657. [Google Scholar] [CrossRef]
  67. Liu, J.; Chen, F.; Ge, Q.; Li, Y. Climate Change and Fruit-Picking Tourism: Impact and Adaptation. Adv. Meteorol. 2016, 2016, 1–11. [Google Scholar] [CrossRef]
  68. Wei, X.; Hou, S.; Pan, X.; Xu, C.; Li, J.; Yu, H.; Chase, J.; Atwill, E.R.; Li, X.; Chen, K.; et al. Microbiological Contamination of Strawberries from U-Pick Farms in Guangzhou, China. Int. J. Environ. Res. Public Health 2019, 16, 4910. [Google Scholar] [CrossRef] [PubMed] [Green Version]
  69. Agehara, S.; Lin, S.-Y.; Kang, L. Strawberry Production and Markets in Taiwan: Challenges, Trends, and Outlook. Int. J. Fruit Sci. 2020, 20, S2018–S2029. [Google Scholar] [CrossRef]
  70. Clark, J.R. Changing Times for Eastern United States Blackberries. Horttechnology 2005, 15, 491–494. [Google Scholar] [CrossRef]
  71. Kim, K.-H.; Park, D.-B. Factors Influencing Rural Tourists’ Purchasing Behaviour: Four Types of Direct Farm Markets in South Korea. Tour. Econ. 2014, 20, 629–645. [Google Scholar] [CrossRef]
  72. Van Sandt, A.; Low, S.A.; Thilmany, D. Exploring Regional Patterns of Agritourism in the U.S.: What’s Driving Clusters of Enterprises? Agric. Resour. Econ. Rev. 2018, 47, 592–609. [Google Scholar] [CrossRef] [Green Version]
  73. Yan, X.; Yinjun, C.; Yanlin, H.; Baoxiang, Q. Spatial Distribution and Influencing Factors of Leisure Agriculture: A Case from Hebei Province. Sci. Geogr. Sin. 2019, 39, 1806–1813. [Google Scholar] [CrossRef]
  74. Ruilin, Y.; Huiyuan, C.; Guangping, C.; Chengliang, L. Spatial Distribution of Rural Tourism Destination and Influencing Factors in Hubei Province—A Case Study of High-Star Agritainment. Econ. Geogr. 2018, 38, 210–217. [Google Scholar] [CrossRef]
  75. Zhiqiang, G.; Qihuang, C.; Xiaomei, J. Study on the Spatial Distribution Characteristics of Leisure Agriculture Demonstration Sites in Jiangxi. Chin. J. Agric. Resour. Regional Plan. 2018, 39, 155–162. [Google Scholar] [CrossRef]
  76. Sandt, A.V.; Low, S.; Jablonski, B.B.R.; Weiler, S. Place-Based Factors and the Performance of Farm-Level Entrepreneurship: A Spatial Interaction Model of Agritourism in the U.S. Rev. Reg. Stud. 2019, 49, 428–453. [Google Scholar]
  77. Konečný, O. Geographical Perspectives on Agritourism in The Czech Republic. Morav. Geogr. Rep. 2014, 22, 15–23. [Google Scholar] [CrossRef] [Green Version]
  78. Van der Merwe, J.H.; Ferreira, S.L.A.; van Niekerk, A. Resource-directed spatial planning of agritourism with GIS. S. Afr. Geogr. J. 2013, 95, 16–37. [Google Scholar] [CrossRef]
  79. Ohe, Y.; Ciani, A. Evaluation of Agritourism Activity in Italy: Facility Based or Local Culture Based? Tour. Econ. 2011, 17, 581–601. [Google Scholar] [CrossRef]
  80. Barbieri, C.; Mshenga, P.M. The Role of the Firm and Owner Characteristics on the Performance of Agritourism Farms. Sociol. Rural. 2008, 48, 166–183. [Google Scholar] [CrossRef]
  81. AutoNavi. AutoNavi Open Platform. 2019. Available online: https://lbs.amap.com/api/webservice/guide/api/search/ (accessed on 10 November 2019).
  82. Chinese Academy of Sciences. Platform of Geospatial Data Cloud. 2003. Available online: http://www.gscloud.cn/ (accessed on 6 May 2015).
  83. China Cartographic Publishing House. Standard Map Service System. 2019. Available online: http://bzdt.ch.mnr.gov.cn/index.html (accessed on 6 September 2019).
  84. National Geomatic Center of China. Metadata Catalog Service for Geographic Information Resource. 2015. Available online: https://www.webmap.cn/ (accessed on 6 September 2019).
  85. National Bureau of Statistics of China. China Statistical Yearbook; China Statistic Press: Beijing, China, 2019.
  86. Franca, R. Spatial patterns of snake diversity in an urban area of north-east Brazil. Herpetol. J. 2019, 29, 274–281. [Google Scholar] [CrossRef]
  87. Ebdon, D. Statistics in Geography; Wiley-Blackwell: Hoboken, NJ, USA, 1991. [Google Scholar]
  88. Lee, J.; Wong, D. Statistical Analysis with ArcView GIS; John Wiley & Sons: Hoboken, NJ, USA, 2000. [Google Scholar]
  89. Dhanaraj, K.; Angadi, D.P. A GIS based interpretation of the historical evolution of urban settlements in Mangalore City, India. Spat. Inf. Res. 2020, 1–15, published online. [Google Scholar] [CrossRef]
  90. Besag, J. Contribution to the discussion on Ripley’s paper. J. R. Stat. Soc. Ser. B (Methodological) 1977, 39, 193–195. [Google Scholar]
  91. Elliott, G.P.; Kipfmueller, K.F. Multi-scale Influences of Slope Aspect and Spatial Pattern on Ecotonal Dynamics at Upper Treeline in the Southern Rocky Mountains, U.S.A. Arct. Antarct. Alp. Res. 2018, 42, 45–56. [Google Scholar] [CrossRef] [Green Version]
  92. Ripley, B.D. The second-order analysis of stationary point processes. J. Appl. Probab. 2016, 13, 255–266. [Google Scholar] [CrossRef] [Green Version]
  93. Ripley, B.D. Modelling spatial patterns. J. R. Stat. Soc. 1977, 39, 172–192. [Google Scholar] [CrossRef]
  94. Hassan, M.M.; Juhász, L.; Southworth, J. Mapping Time-Space Brickfield Development Dynamics in Peri-Urban Area of Dhaka, Bangladesh. ISPRS Int. J. Geo-Inf. 2019, 8, 447. [Google Scholar] [CrossRef] [Green Version]
  95. Andresen, M.A. Testing for similarity in area-based spatial patterns: A nonparametric Monte Carlo approach. Appl. Geogr. 2009, 29, 333–345. [Google Scholar] [CrossRef]
  96. Metsaranta, J.M. Influence of past mortality and measurement thresholds on tree-ring inferred trends in tree distribution and size-growth relationships at a Populus tremuloides stand in the Northwest Territories, Canada. For. Ecol. Manag. 2020, 466, 118138. [Google Scholar] [CrossRef]
  97. Bíl, M.; Andrášik, R.; Sedoník, J. A detailed spatiotemporal analysis of traffic crash hotspots. Appl. Geogr. 2019, 107, 82–90. [Google Scholar] [CrossRef]
  98. Chen, Y.; Liu, X.; Li, X.; Liu, Y.; Xu, X. Mapping the fine-scale spatial pattern of housing rent in the metropolitan area by using online rental listings and ensemble learning. Appl. Geogr. 2016, 75, 200–212. [Google Scholar] [CrossRef]
  99. Lorenz, M.O. Methods of Measuring the Concentration of Wealth. Publ. Am. Stat. Assoc. 1905, 9, 209–219. [Google Scholar] [CrossRef]
  100. Gini, C.W. Variability and mutability, contribution to the study of statistical distributions and relations. Studi Economico-Giuridici della R. Universita de Cagliari (1912). J. Am. Stat. Assoc. 1971, 66, 534–544. [Google Scholar]
  101. Chen, Z.; Jin, F. Scope, shape, and structural characteristics of traffic circles ofequal travel time in Beijing. Prog. Geogr. 2016, 35, 389–398. [Google Scholar] [CrossRef] [Green Version]
  102. Verhetsel, A.; Beckers, J.; De Meyere, M. Assessing Daily Urban Systems: A Heterogeneous Commuting Network Approach. Netw. Spat. Econ. 2018, 18, 633–656. [Google Scholar] [CrossRef]
  103. Su, B. Rural tourism in China. Tour. Manag. 2011, 32, 1438–1441. [Google Scholar] [CrossRef]
  104. Shen, S.; Wang, H.; Quan, Q.; Xu, J. Rurality and rural tourism development in China. Tour. Manag. Perspect. 2019, 30, 98–106. [Google Scholar] [CrossRef]
  105. Xue, L.; Kerstetter, D.; Hunt, C. Tourism development and changing rural identity in China. Ann.Tour. Res. 2017, 66, 170–182. [Google Scholar] [CrossRef]
  106. Liu, C.; Dou, X.; Li, J.; Cai, L.A. Analyzing government role in rural tourism development: An empirical investigation from China. J. Rural Stud. 2020, 79, 177–188. [Google Scholar] [CrossRef]
  107. Sadowski, A.; Wojcieszak, M.M. Geographic differentiation of agritourism activities in Poland vs. cultural and natural attractiveness of destinations at district level. PLoS ONE 2019, 14, e0222576. [Google Scholar] [CrossRef] [PubMed]
  108. Yu, W.; Spencer, D.M. Motivations, challenges, and self-transformations of farmers engaged in farm tourism on a tropical island. J. Herit. Tour. 2021, 16, 164–180. [Google Scholar] [CrossRef]
  109. Bagi, F.S.; Reeder, R.J. Factors affecting farmer participation in agritourism. Agric. Resour. Econ. Rev. 2012, 41, 189–199. [Google Scholar] [CrossRef]
  110. Shaken, A.; Mika, M.; Plokhikh, R.V. Exploring the social interest in agritourism among the urban population of Kazakhstan. Misc. Geogr. 2020, 24, 16–23. [Google Scholar] [CrossRef]
Figure 1. Typical sightseeing picking orchards in China: (a) potato farm; (b) strawberry farm. (These photos were acquired from the publicity website of two eco-farms. The websites are https://sh.news.fang.com/open/33125923.html and http://www.lvmama.com/comment/2434478, accessed on 22 April 2021).
Land 10 00631 g001
Figure 2. Ripley’s L(r) function of picking orchards in China.
Land 10 00631 g002
Figure 3. Kernel density estimation of picking orchards in China (density surface based on the picking orchard points is displayed from blue to red representing the density from low to high).
Land 10 00631 g003
Figure 4. Lorenz curve of spatial distribution of picking orchards in China.
Land 10 00631 g004
Figure 5. Spatial distribution of picking orchards displayed by comparing the topography in different parts of China.
Land 10 00631 g005
Figure 6. Gradient distribution of picking orchards from city centers (most picking orchards are located within 10–40 km of a city center).
Land 10 00631 g006
Figure 7. The correlation analysis between economic factors and picking orchards (the higher the consumption expenditure is, the more picking orchards per capita there are).
Land 10 00631 g007
Figure 8. The correlation between traffic conditions and picking orchards (the higher the road density is, the more picking orchards per capita there are).
Land 10 00631 g008
Figure 9. The correlation analysis between A-level scenic spots and picking orchards (the higher the density of A-level scenic spots is, the larger the number of picking orchards per capita is).
Land 10 00631 g009
Table 1. Data sources and descriptions.
Data NameData TypeTime PeriodResolutionData Source
Picking orchardsPoints2019-POIs of Gaode Map [81]
Digital Elevation Model (DEM)Grid200330 m × 30 mPlatform of Geospatial Data Cloud [82]
National boundary, sea land border, and major riversVector20191:60,000,000Standard Map Service System [83]
Administrative boundary and road mapVector20151:250,000National Geomatics Center of China [84]
Socioeconomic dataTxt2019County levelChina Statistical Yearbook [85]
Publisher’s Note: MDPI stays neutral with regard to jurisdictional claims in published maps and institutional affiliations.

