
Impact of Cropland Evolution on Soil Wind Erosion in Inner Mongolia of China


 ,
,
Abstract
1. Introduction
2. Materials and Methods
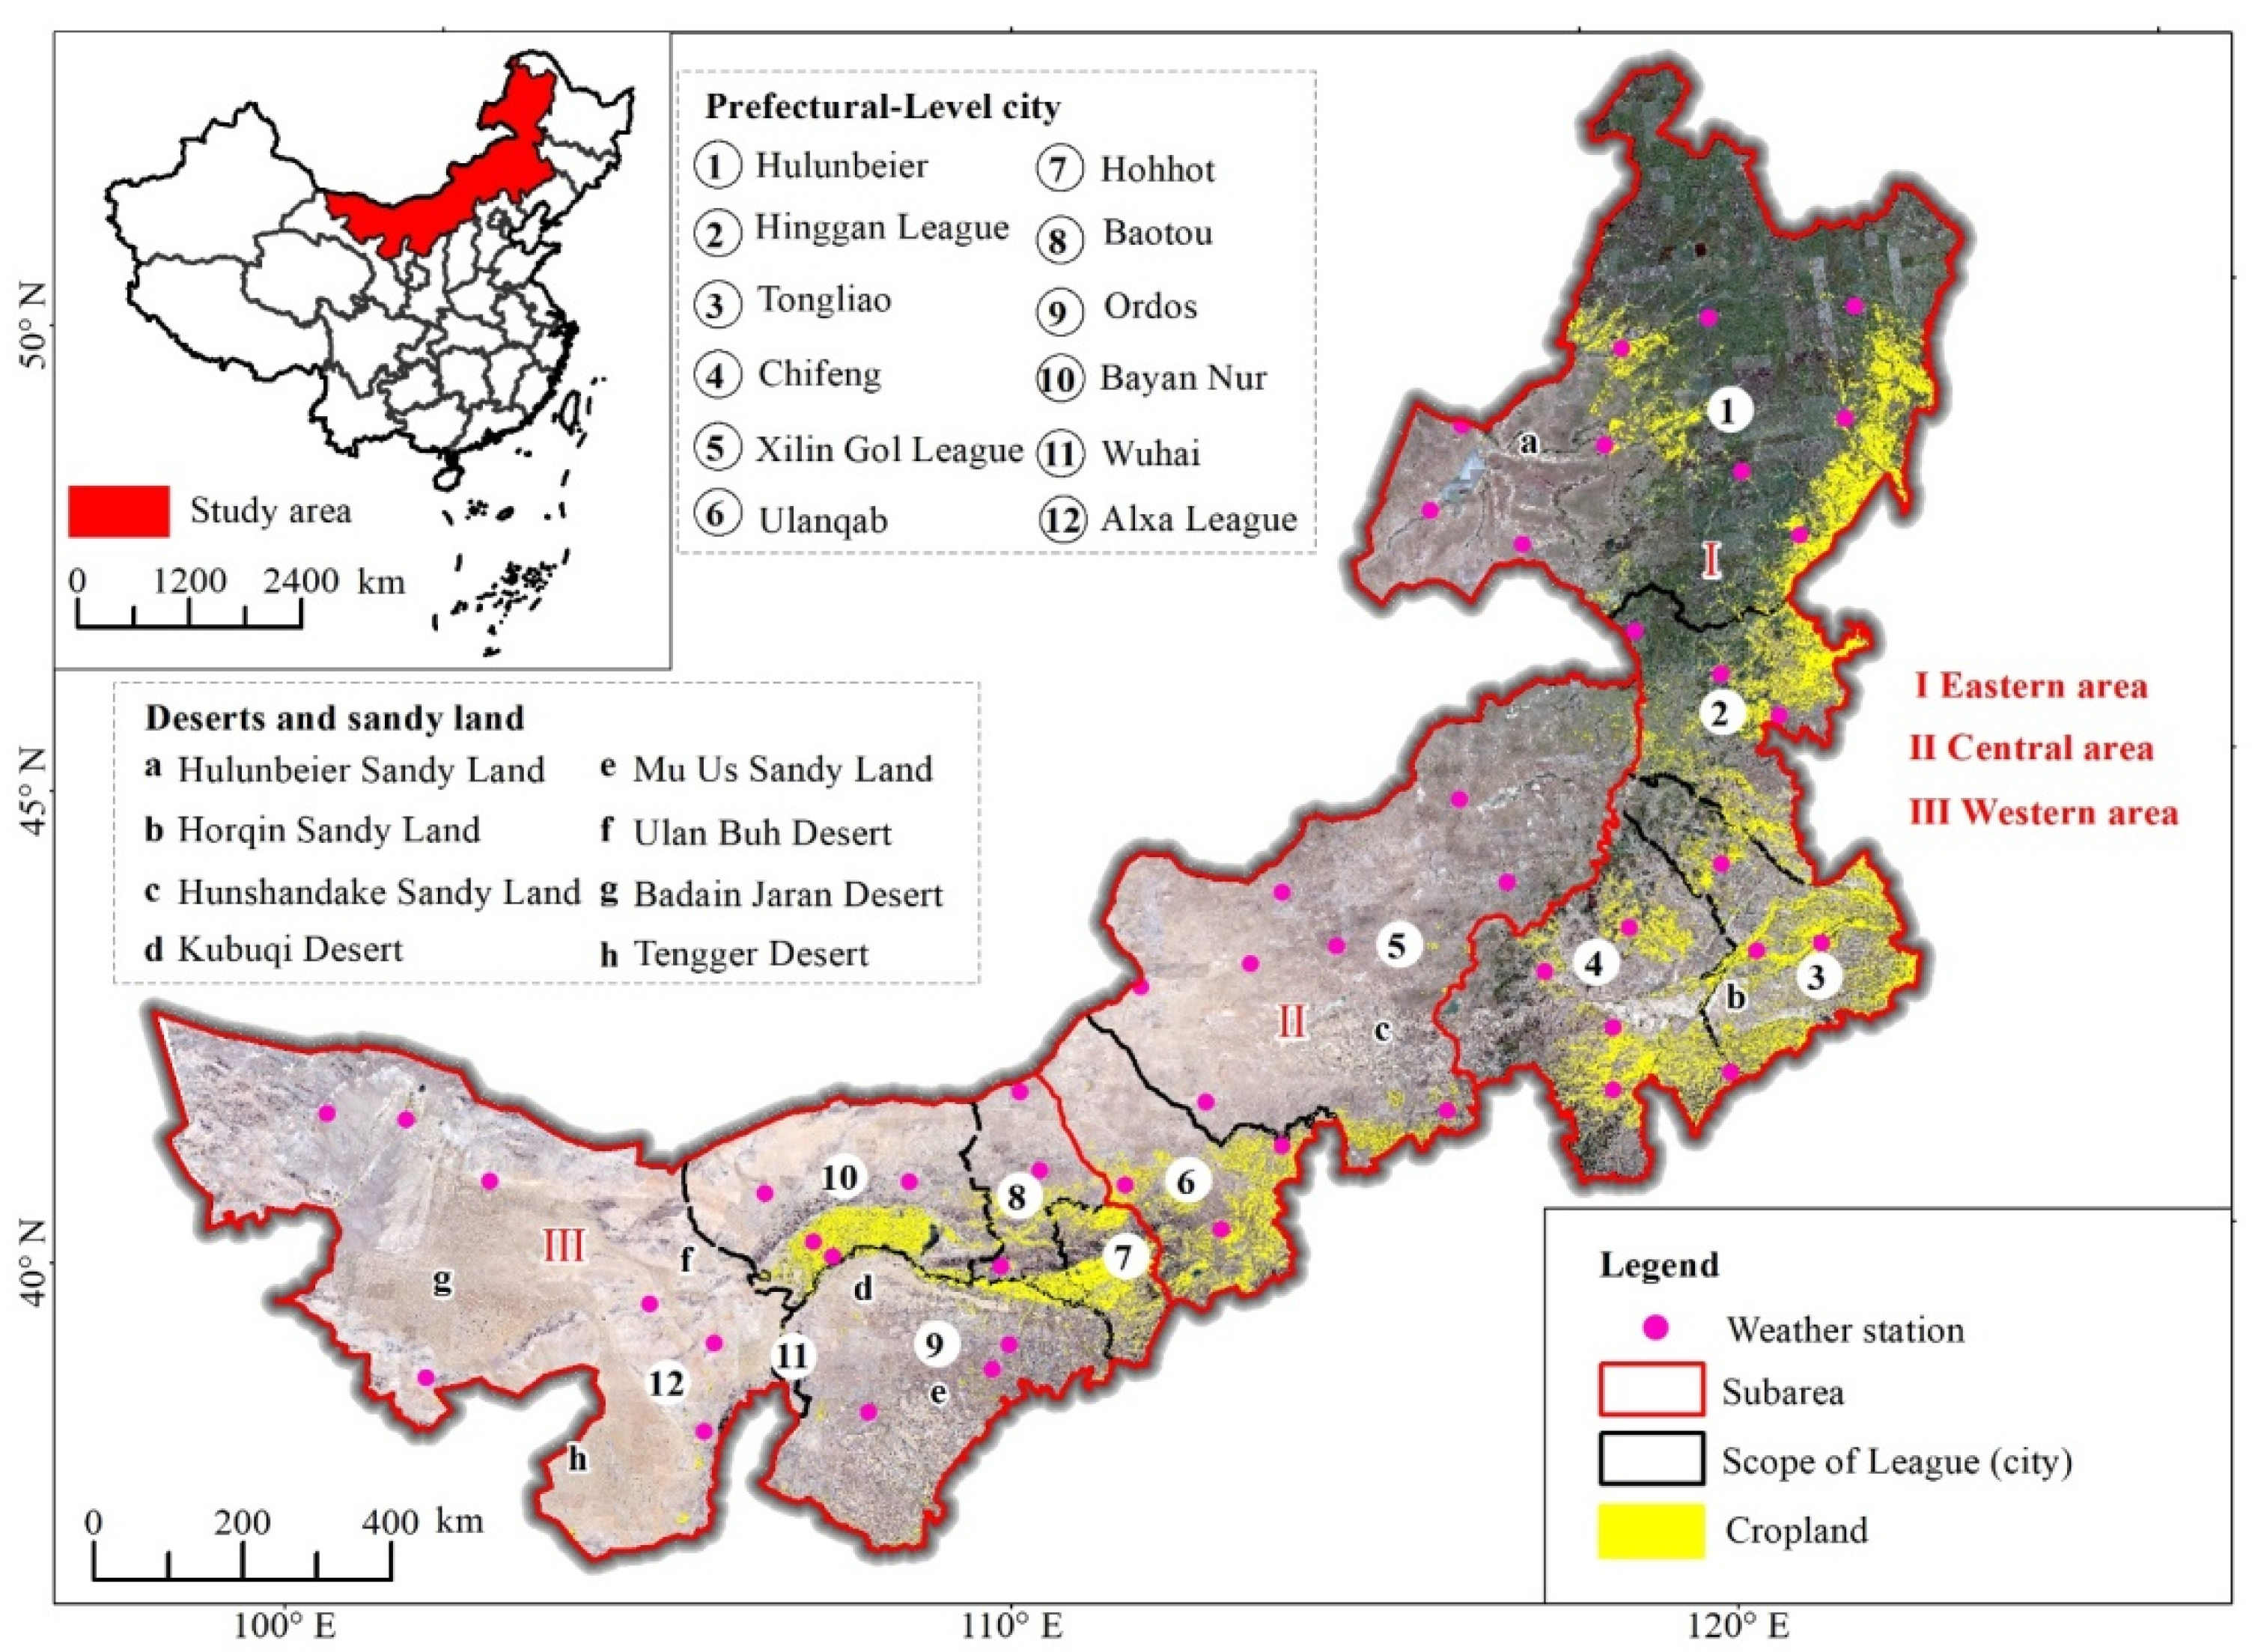
2.1. Study Area
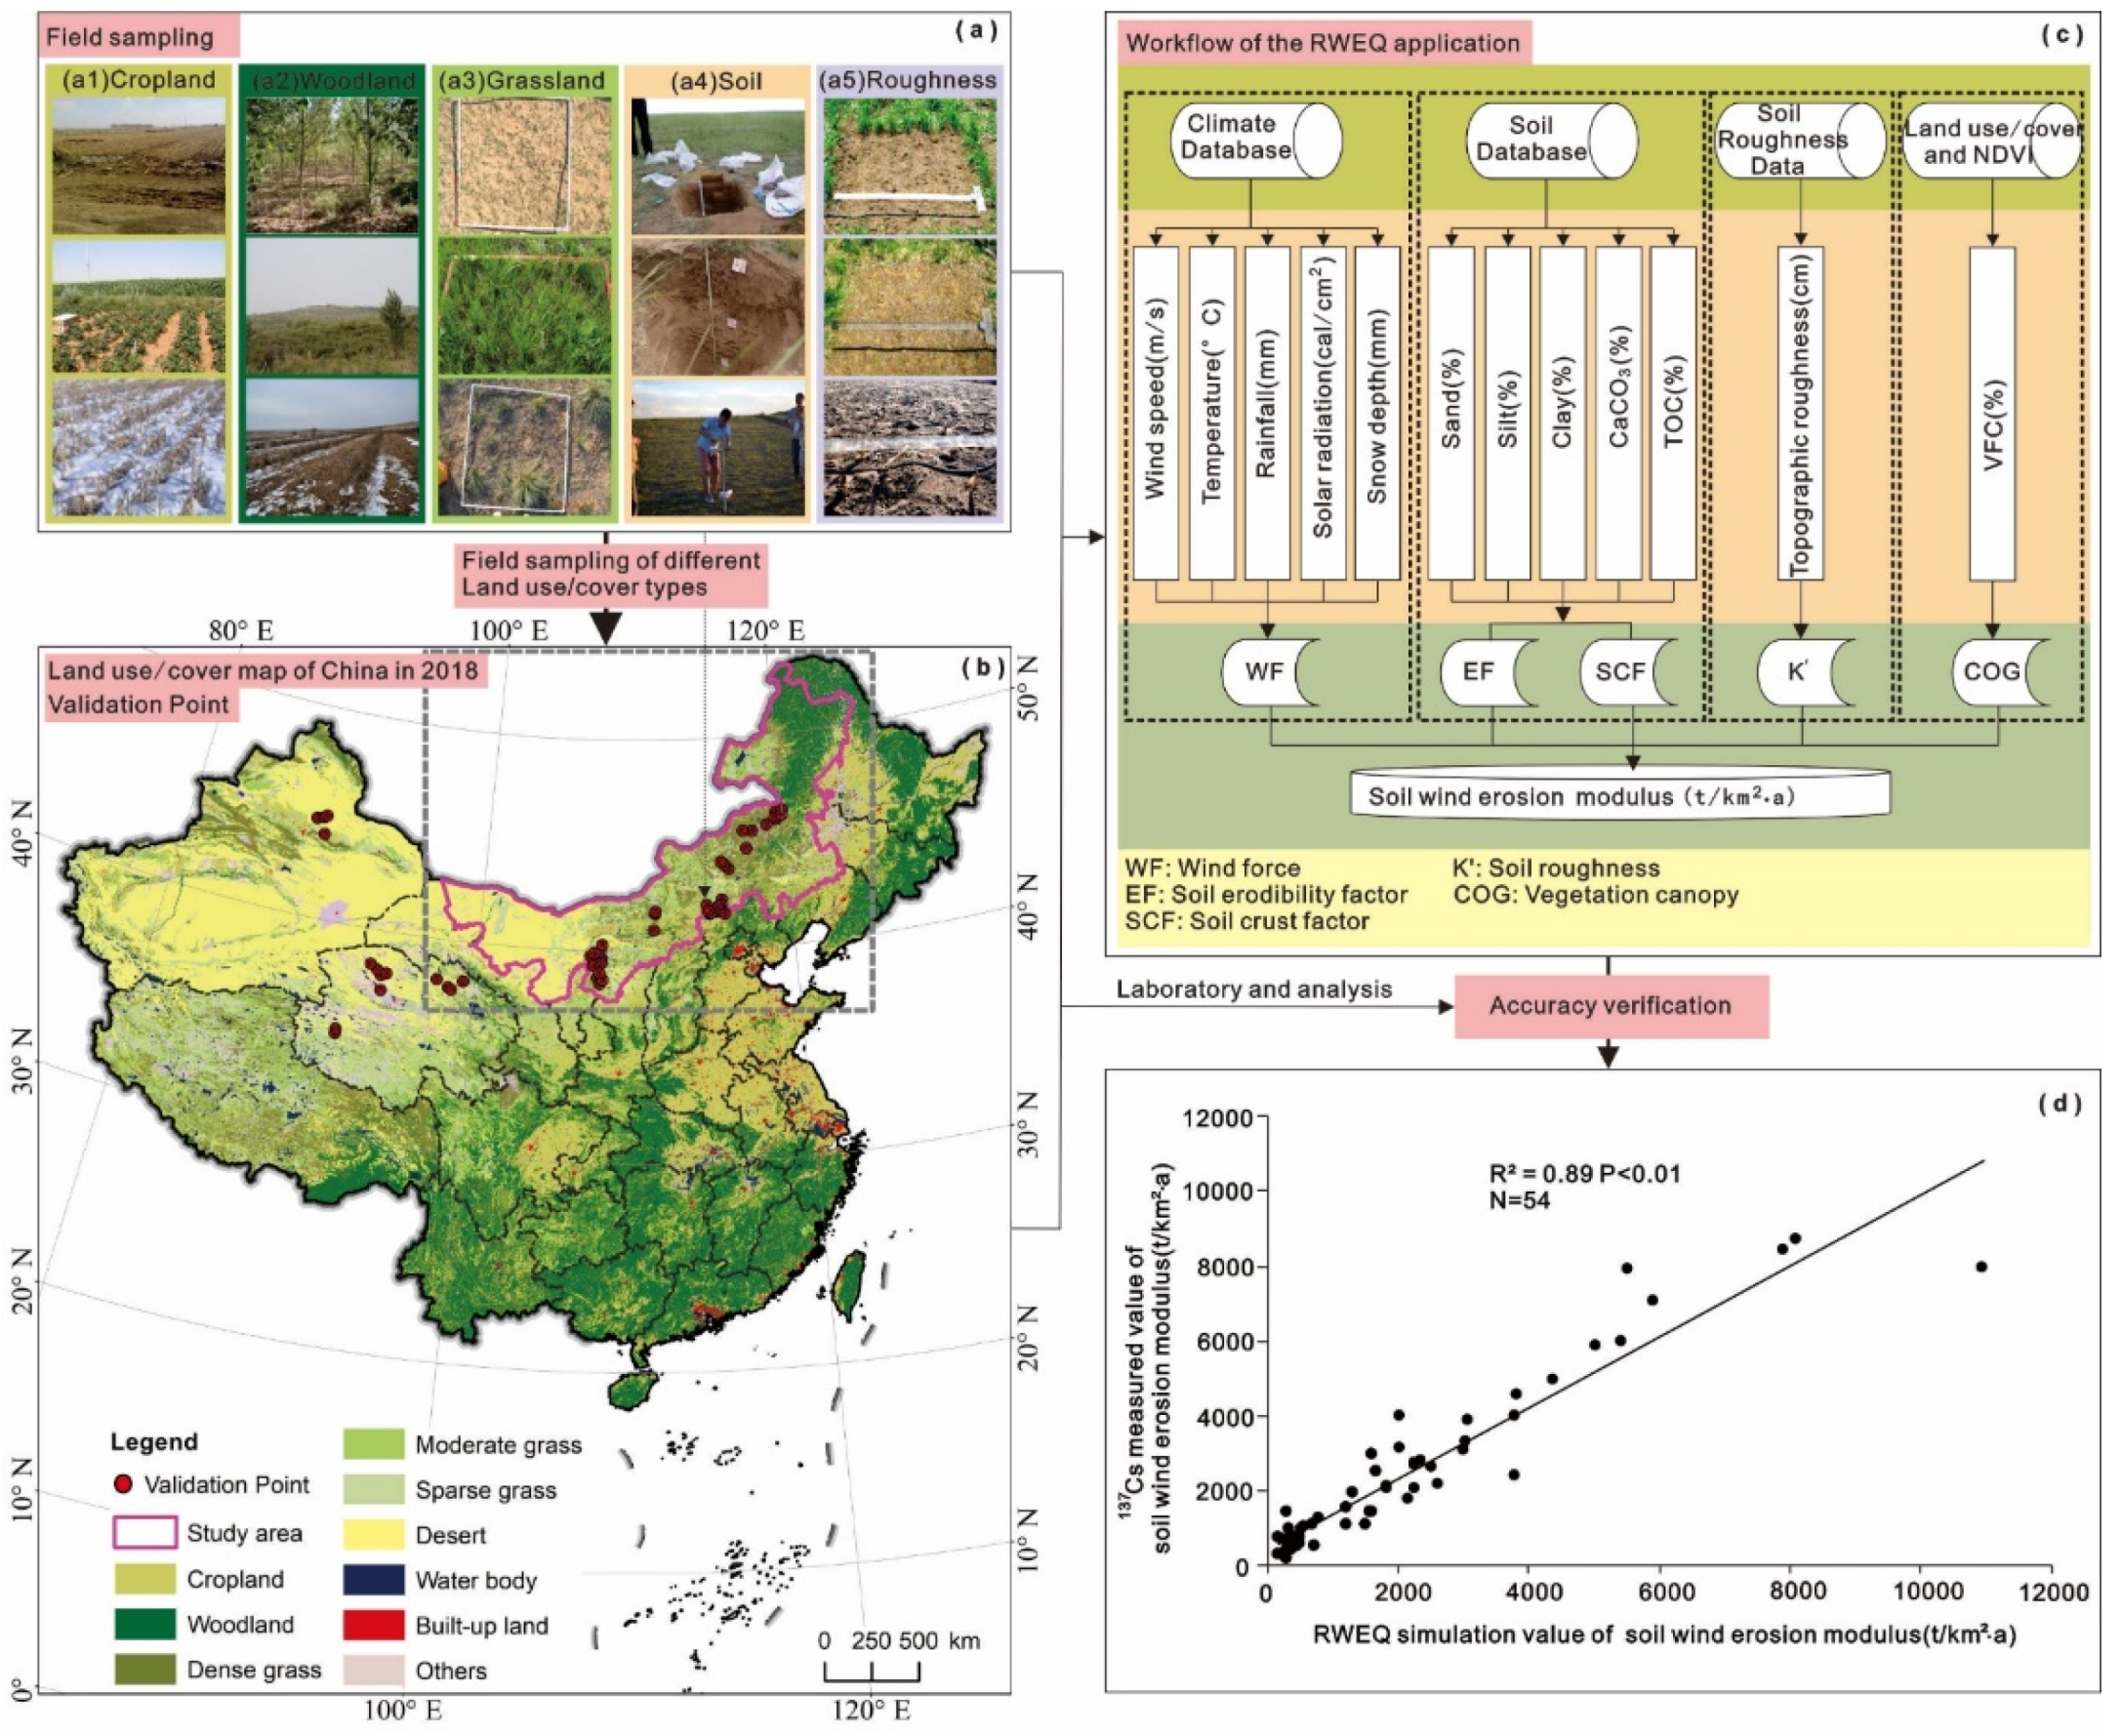
2.2. Methods
2.3. Data
2.4. The Detection of Cropland Changes
2.5. Analysis of Soil Wind Erosion Dynamics with Cropland Evolution
3. Results
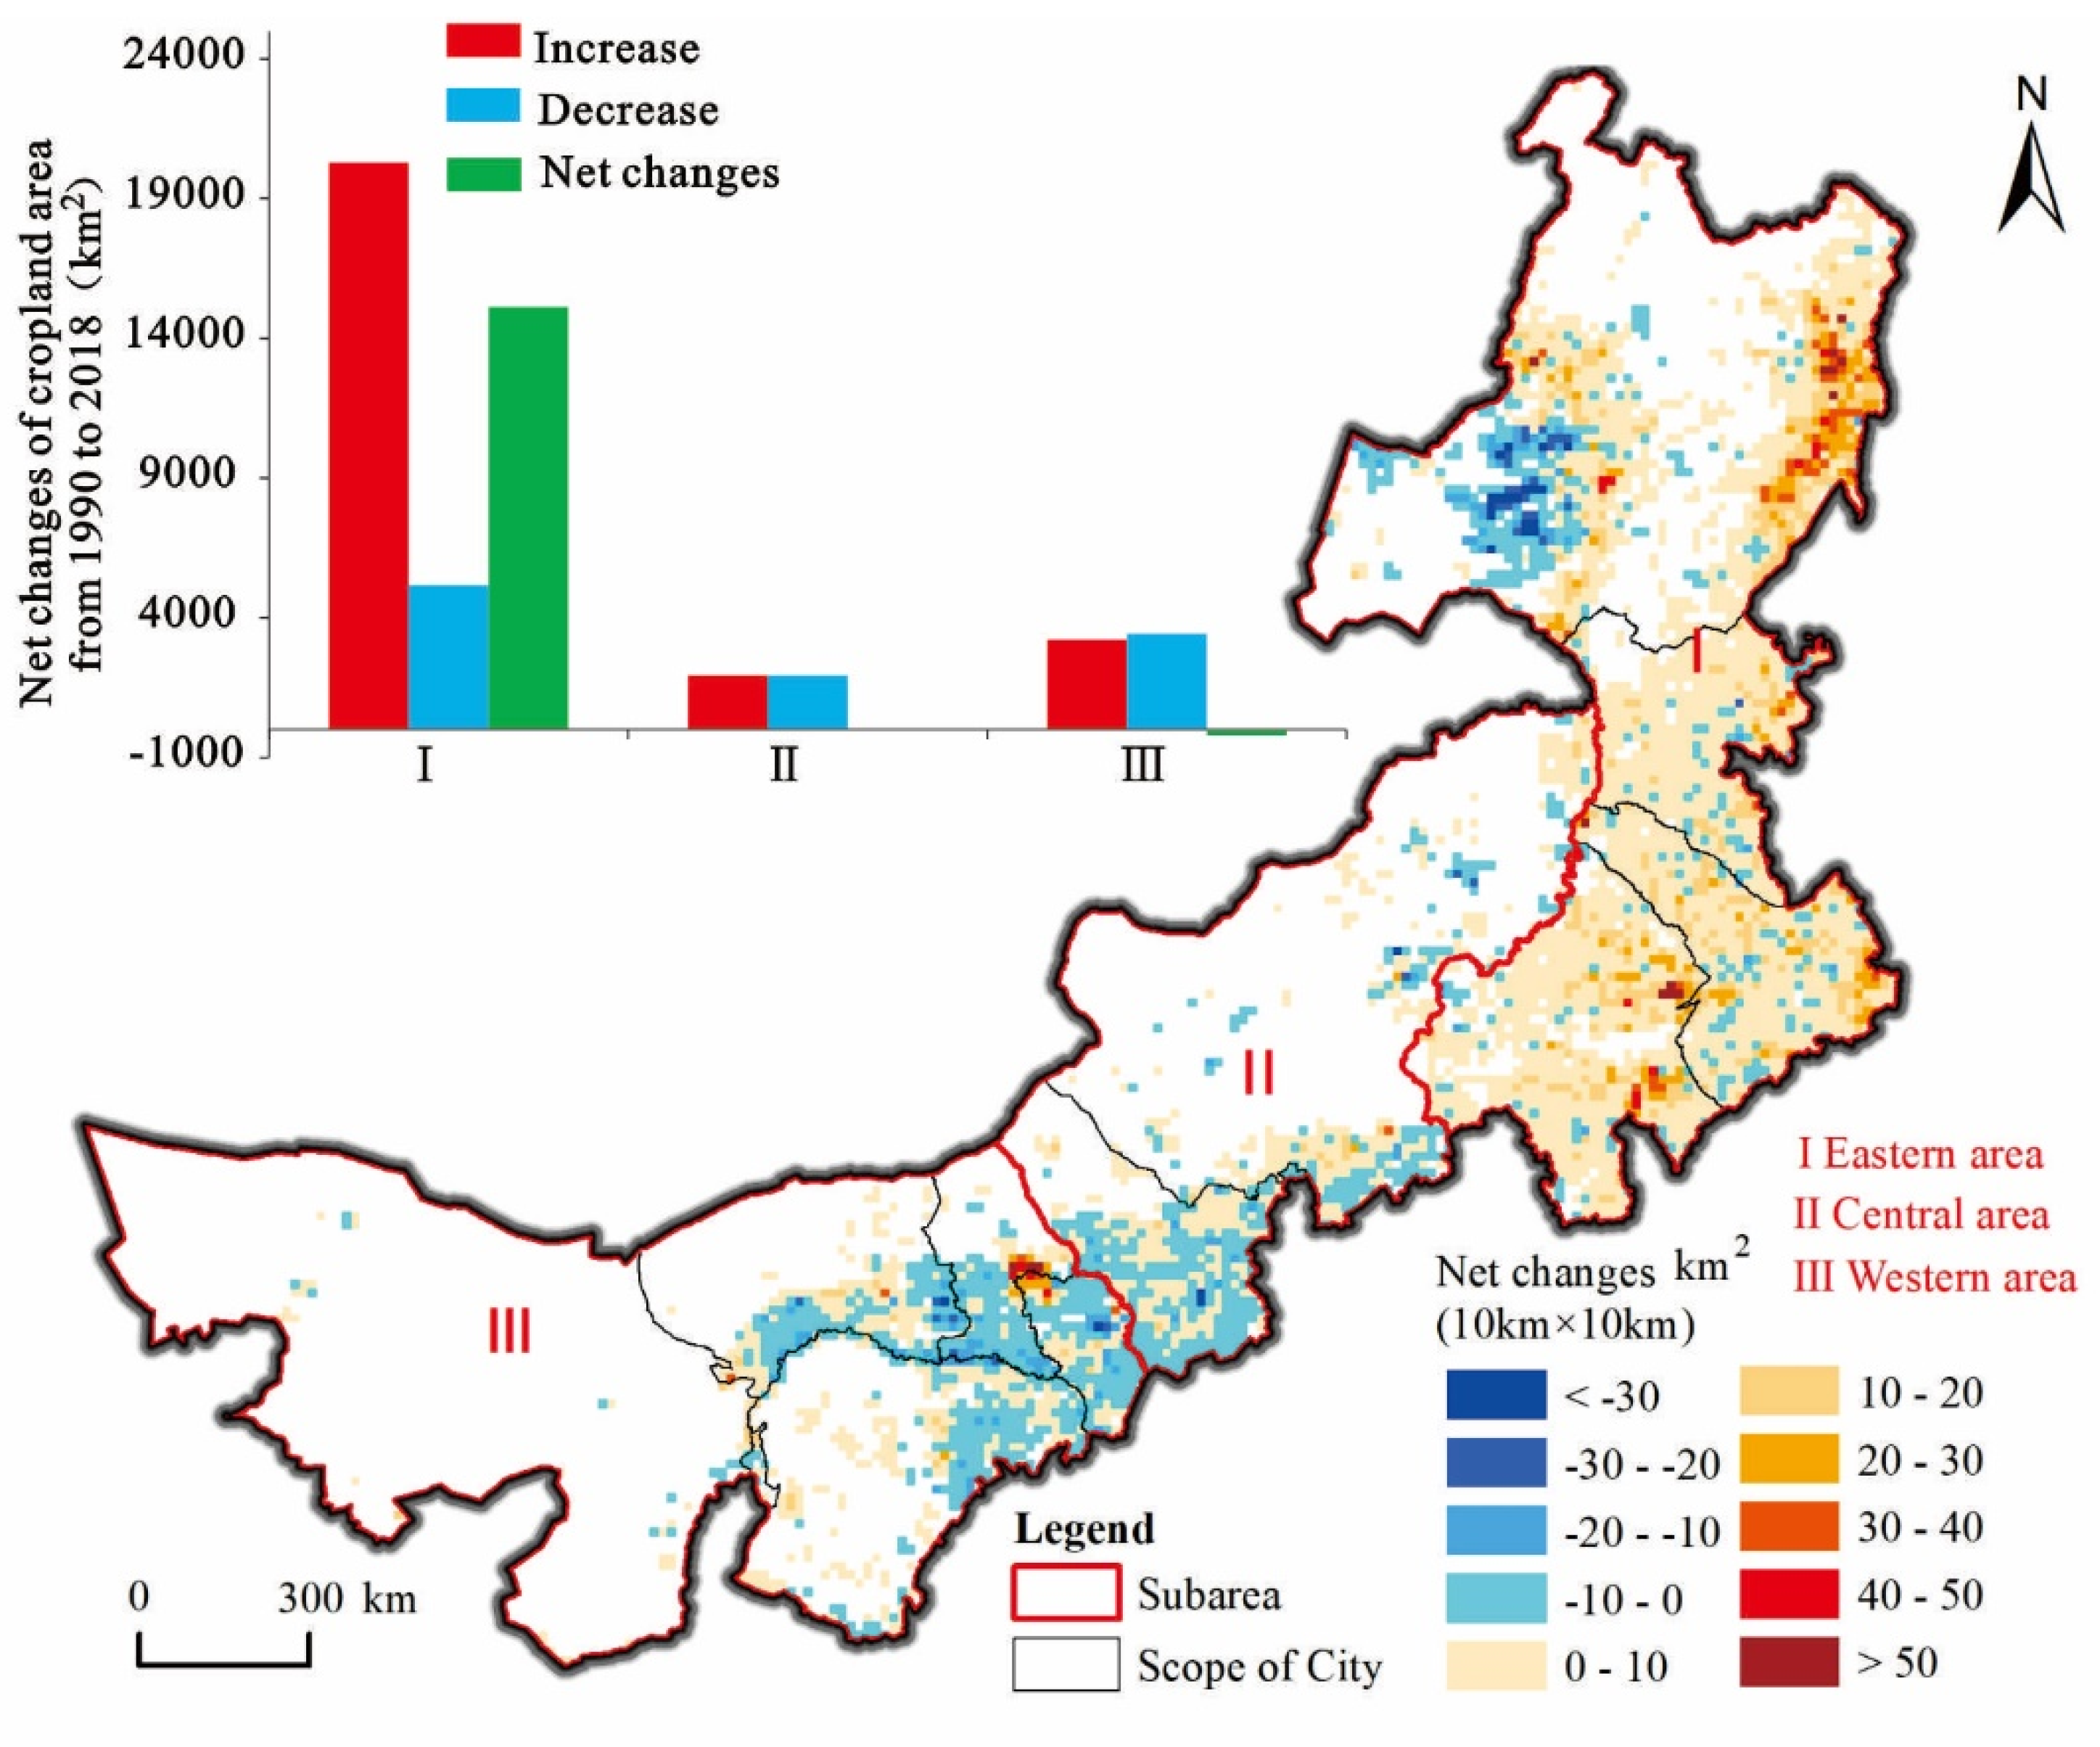
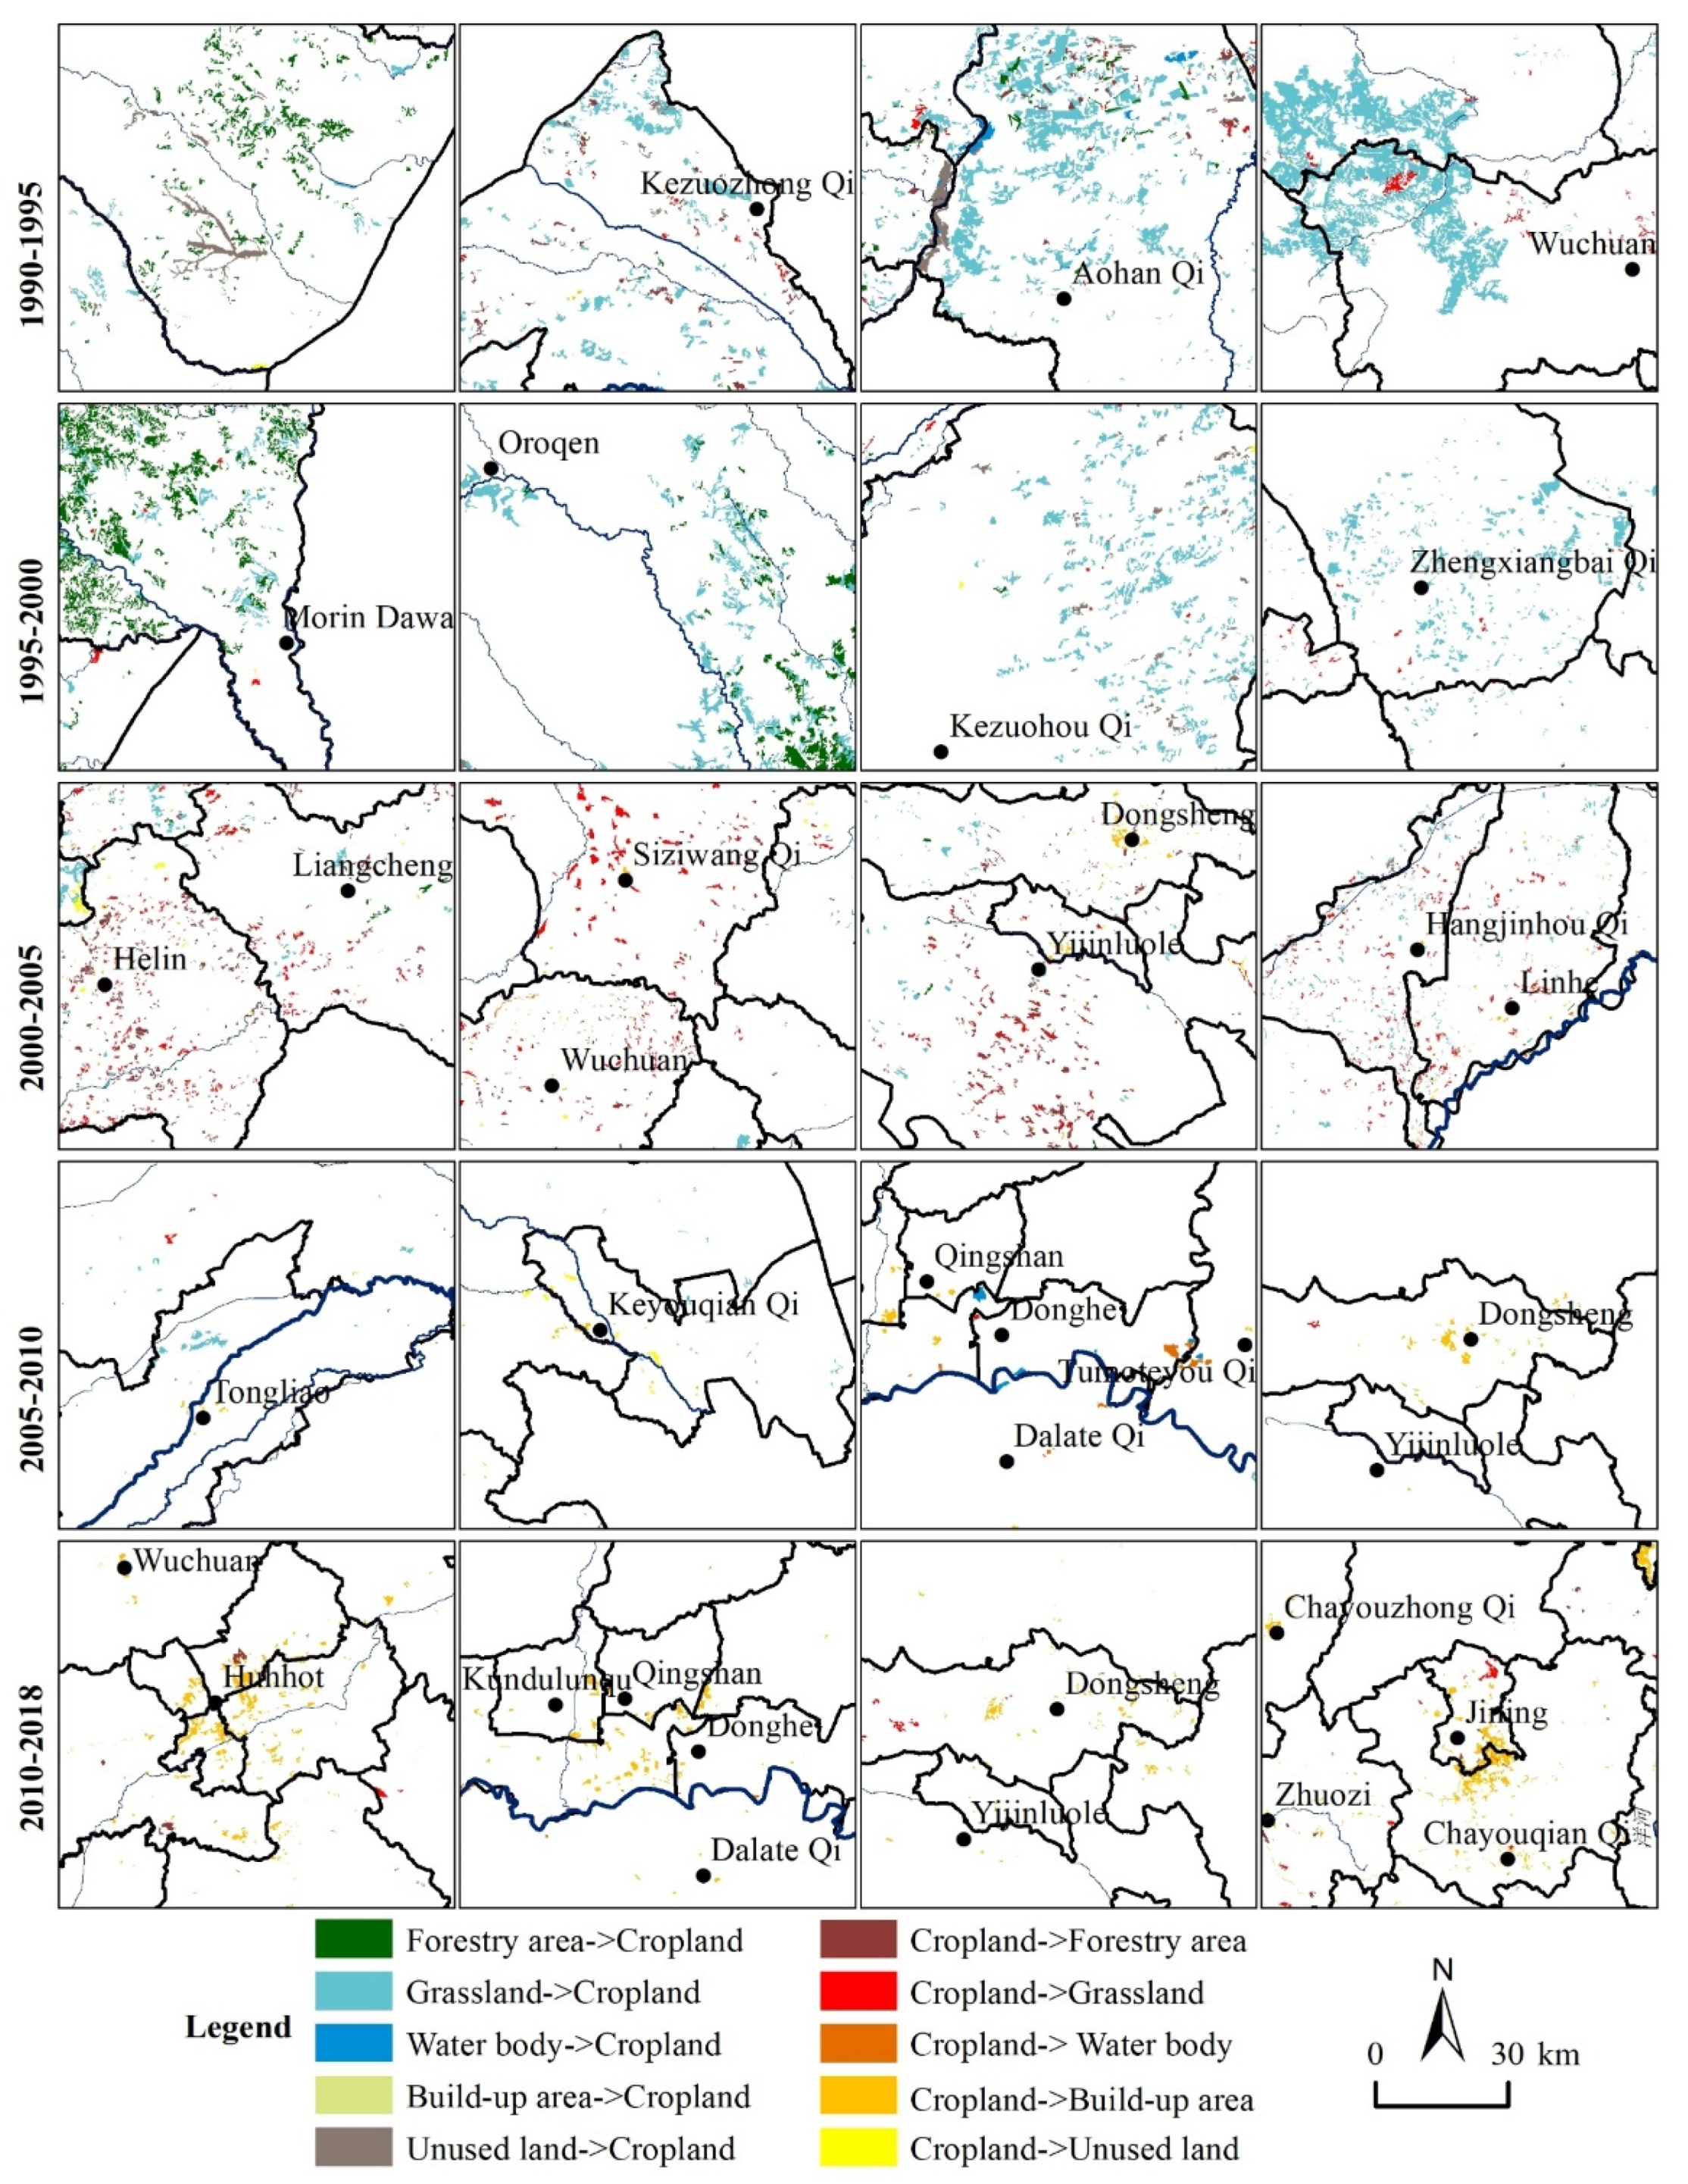
3.1. Spatio-Temporal Patterns of Cropland Evolution during 1990–2018
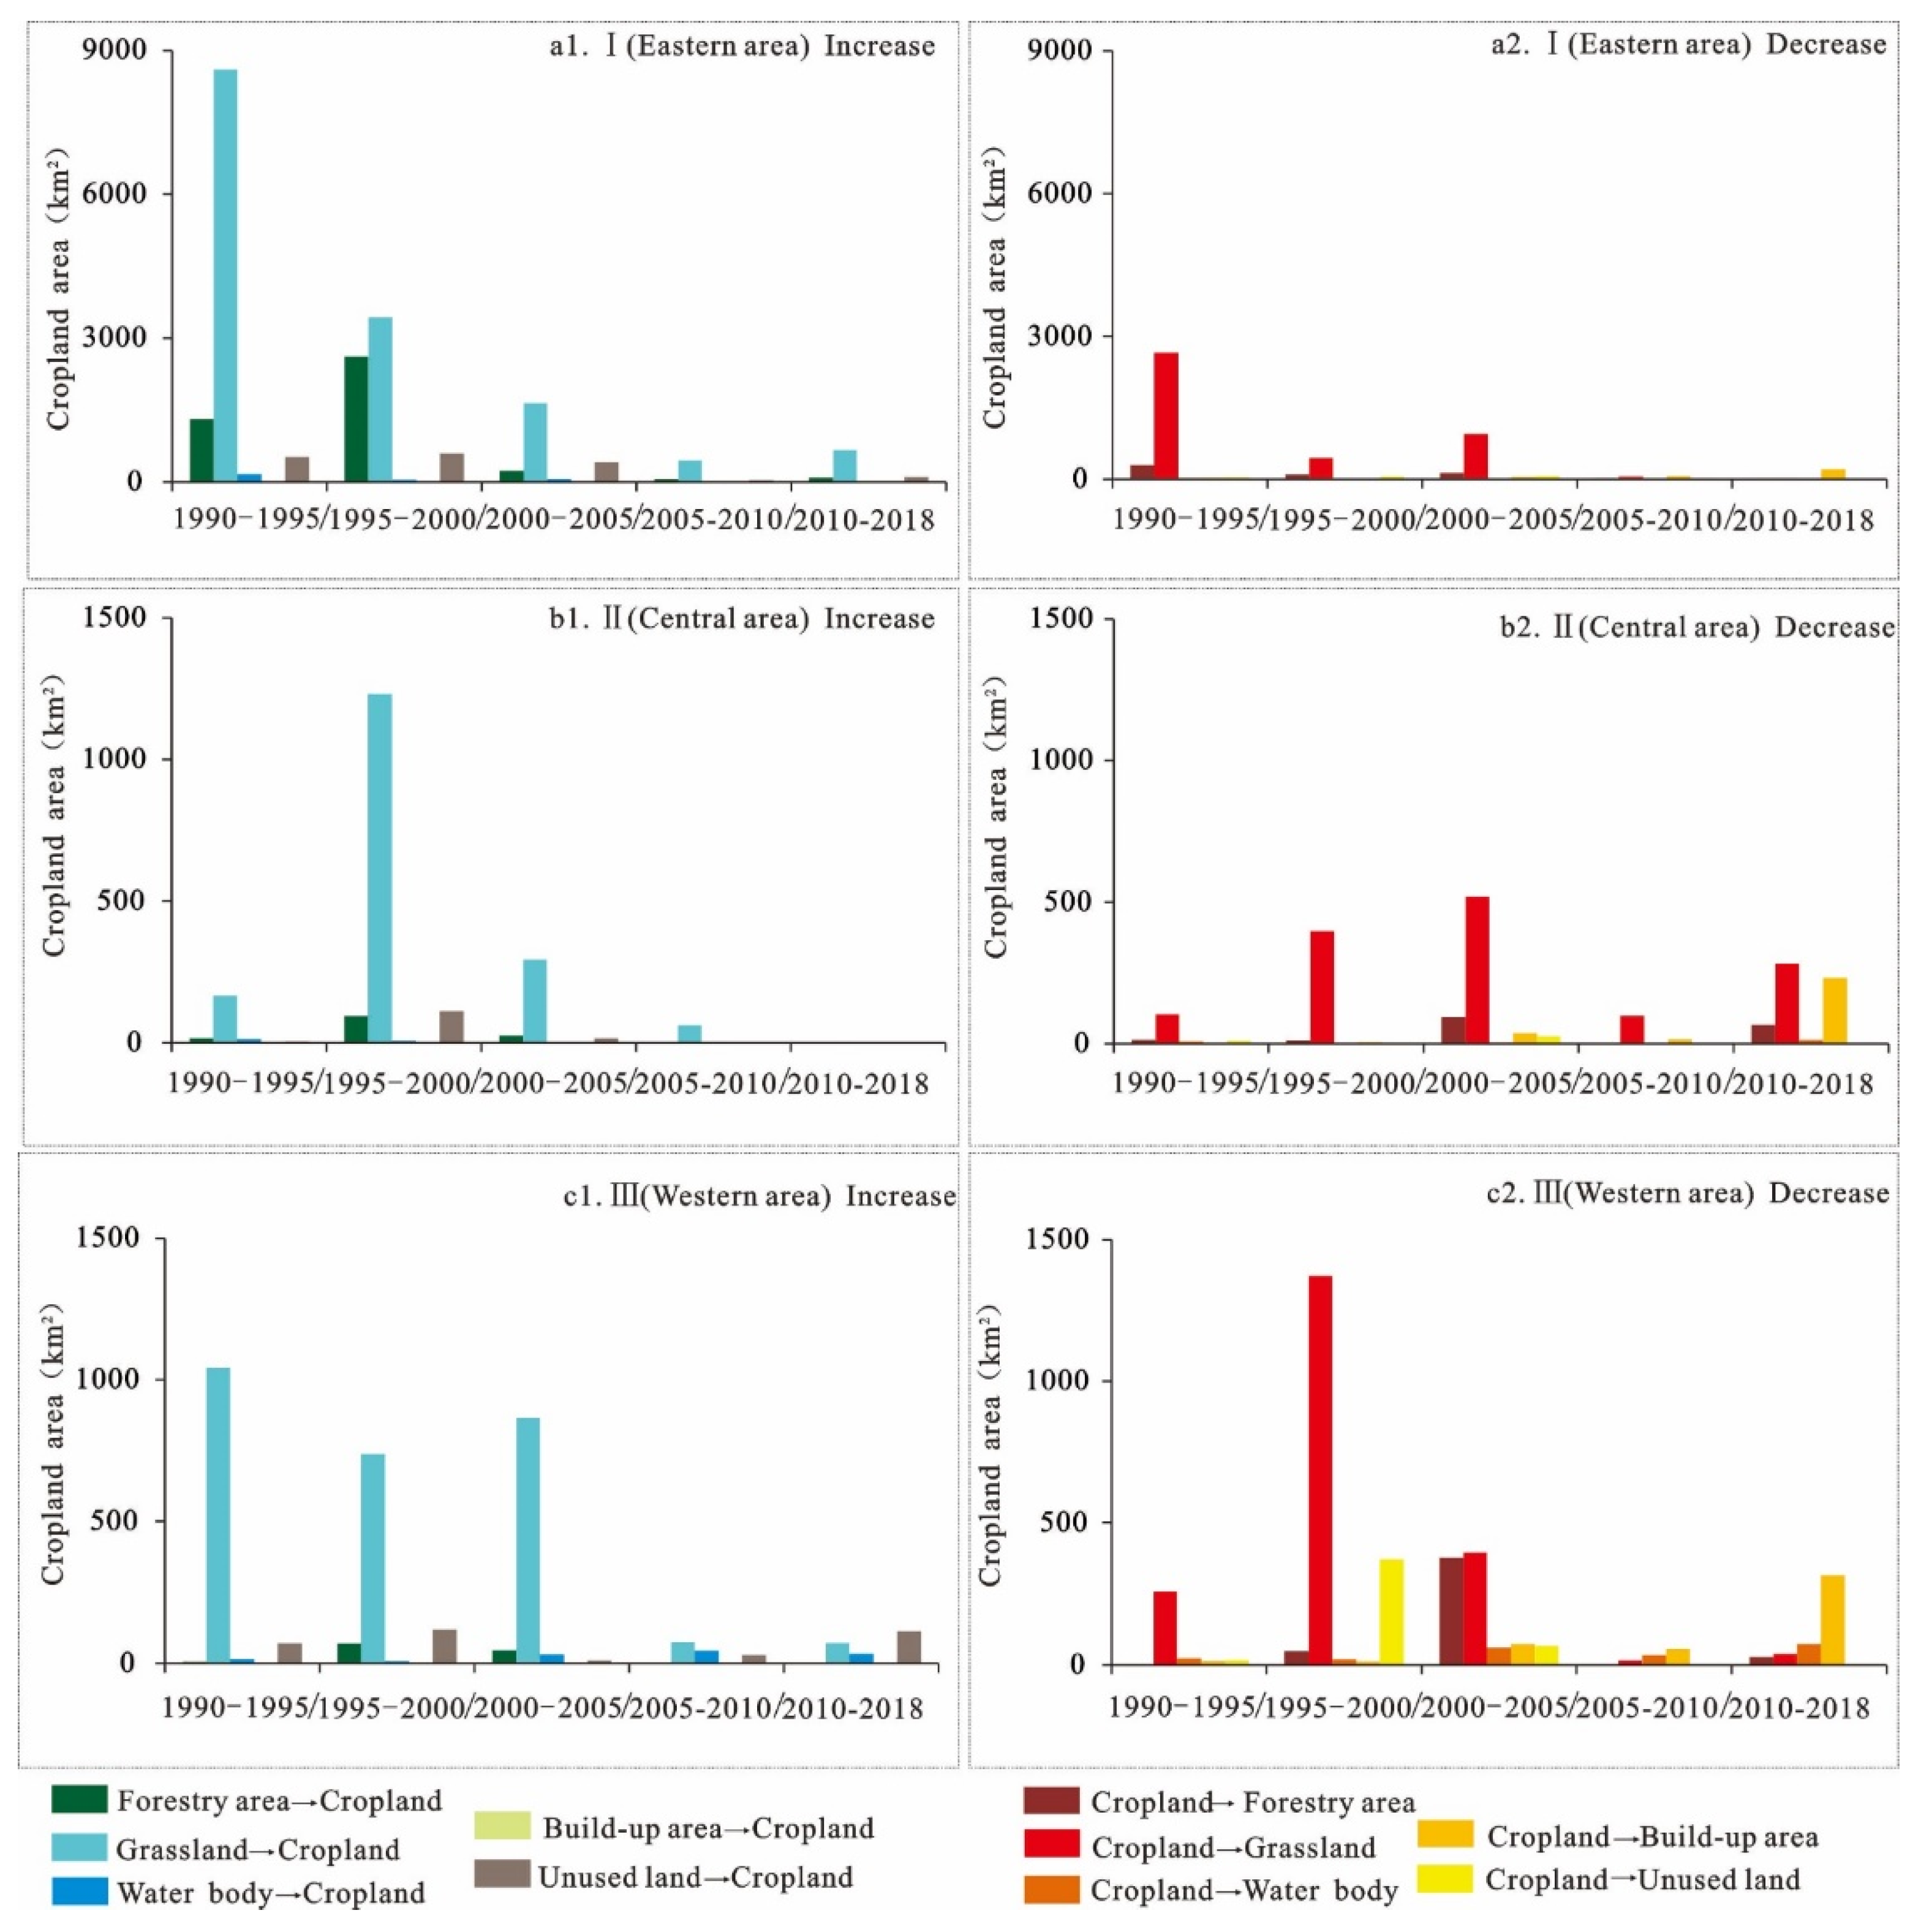
3.2. The Tracked Cropland Conversions in the Three Sub-Regions from 1990 to 2018
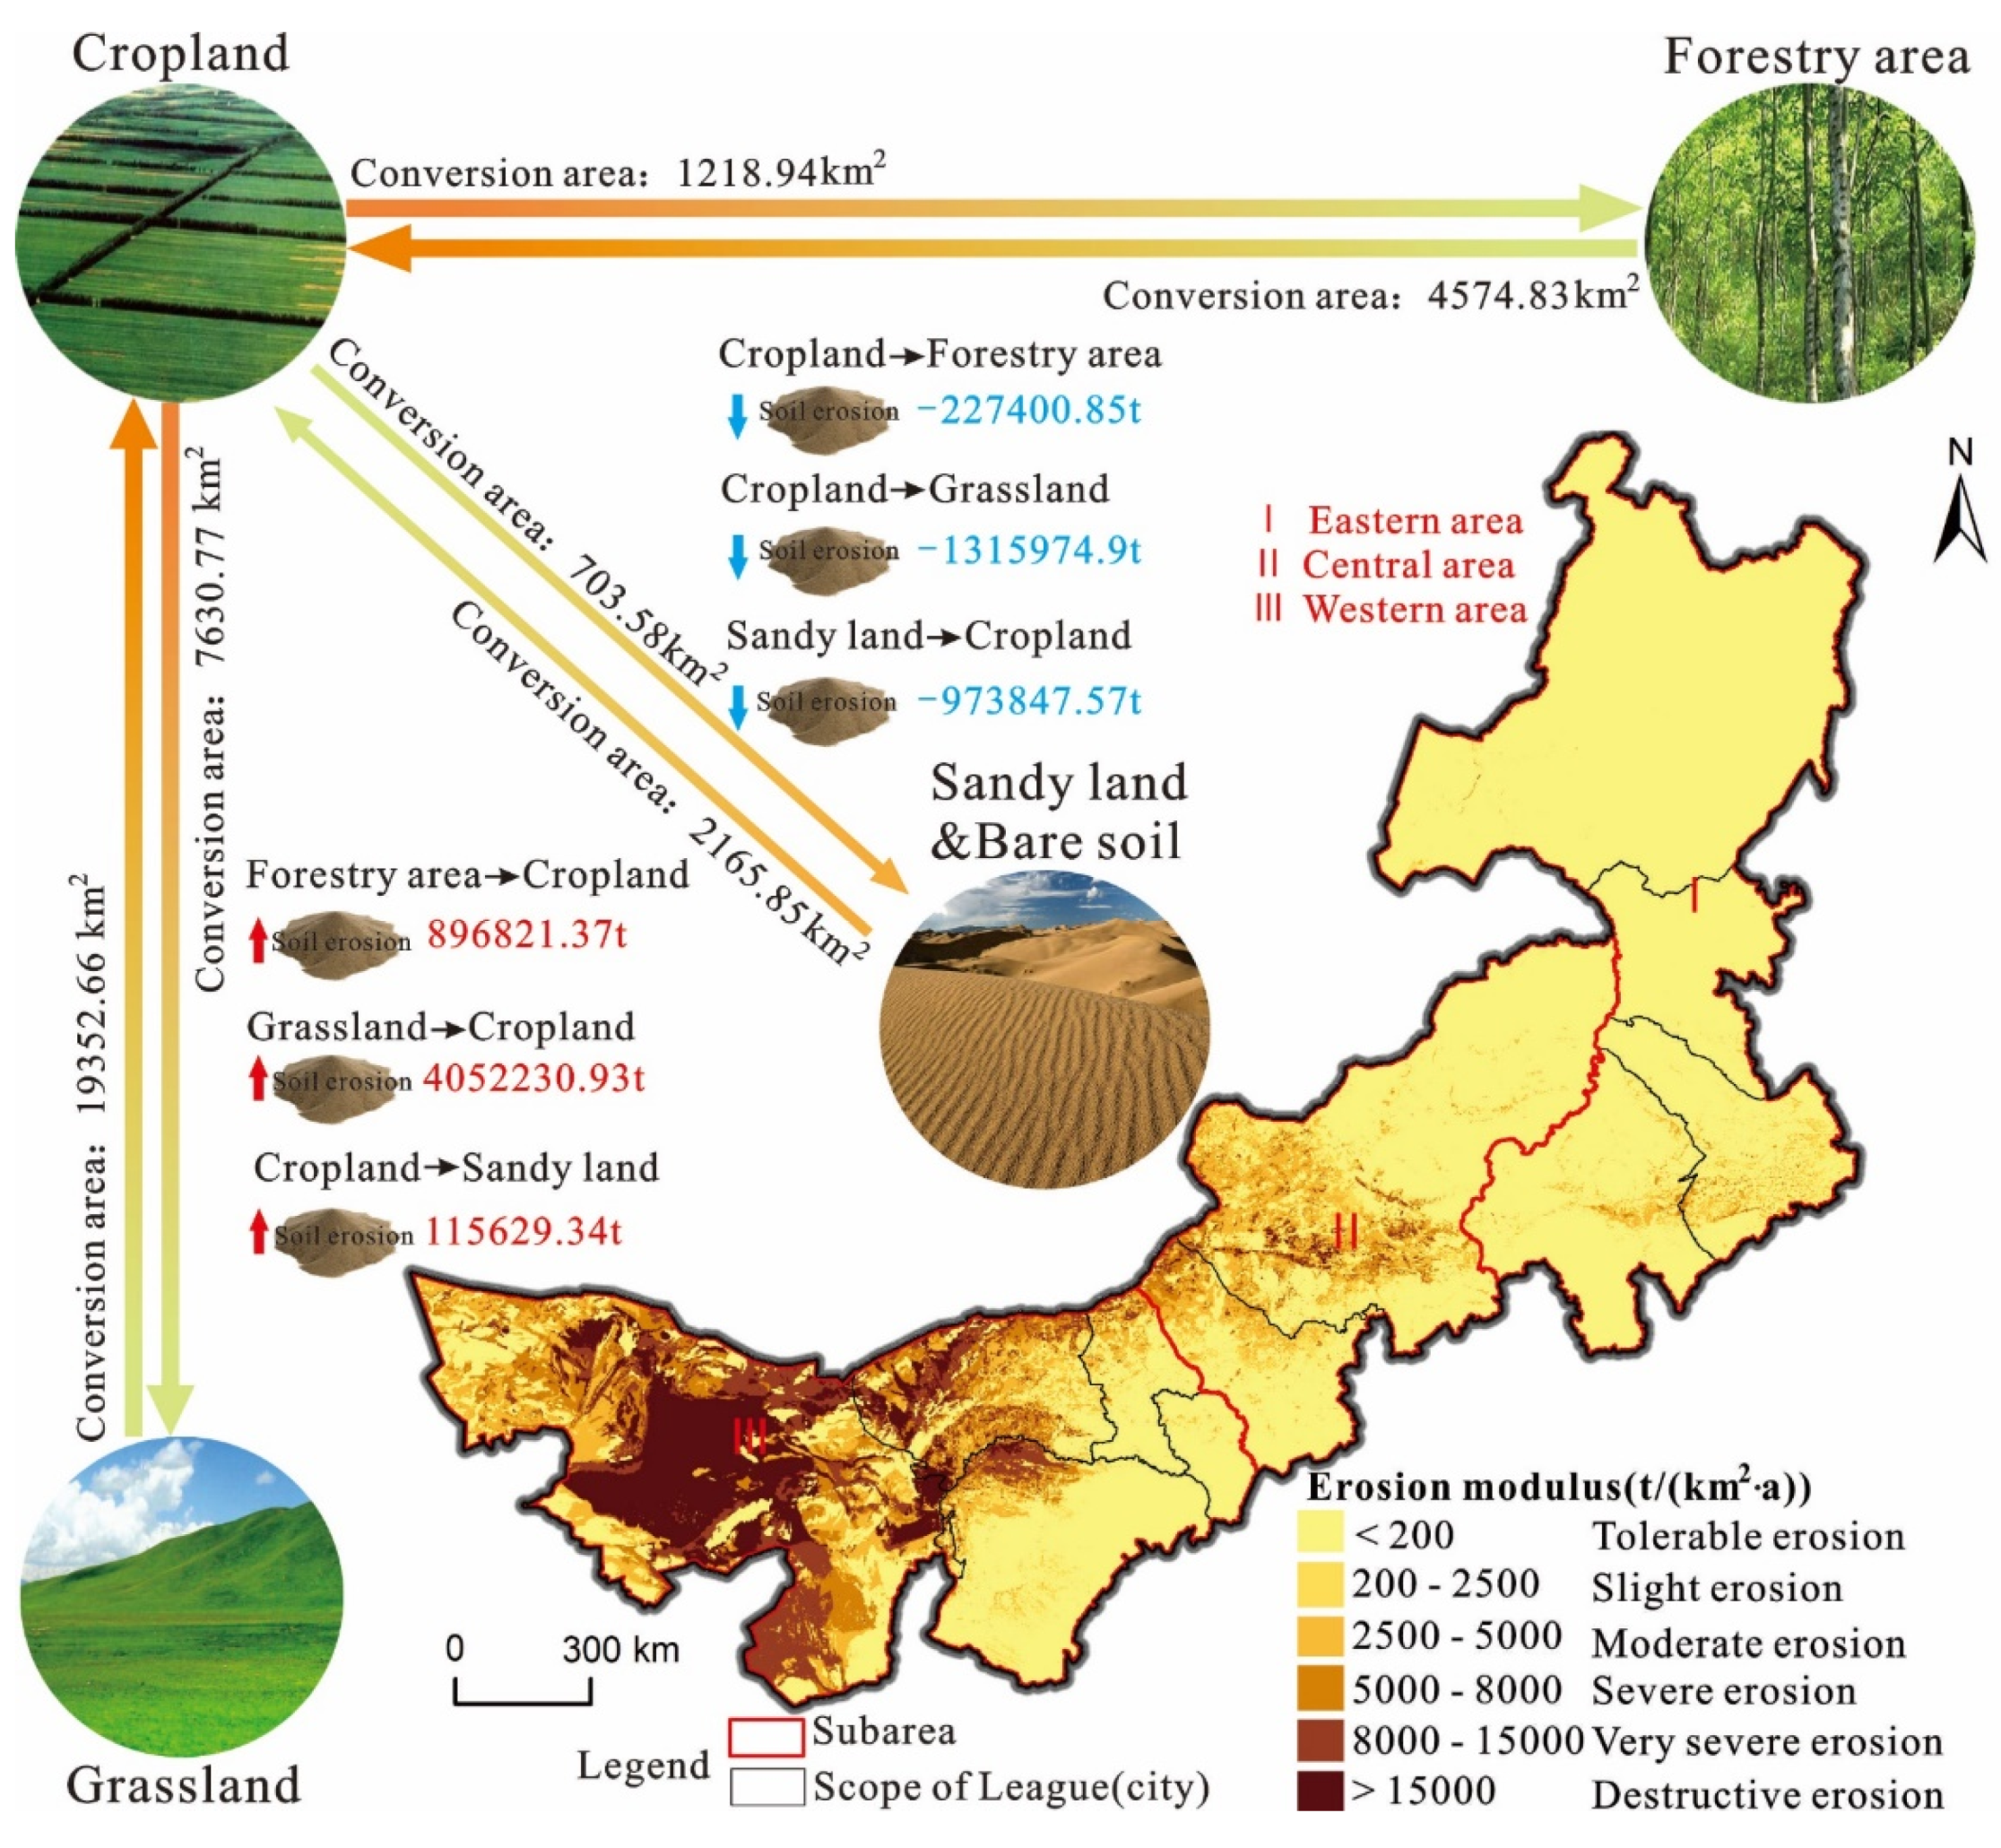
3.3. Temporal and Spatial Effects of Cropland Evolution on Soil Wind Erosion Changes
4. Discussions
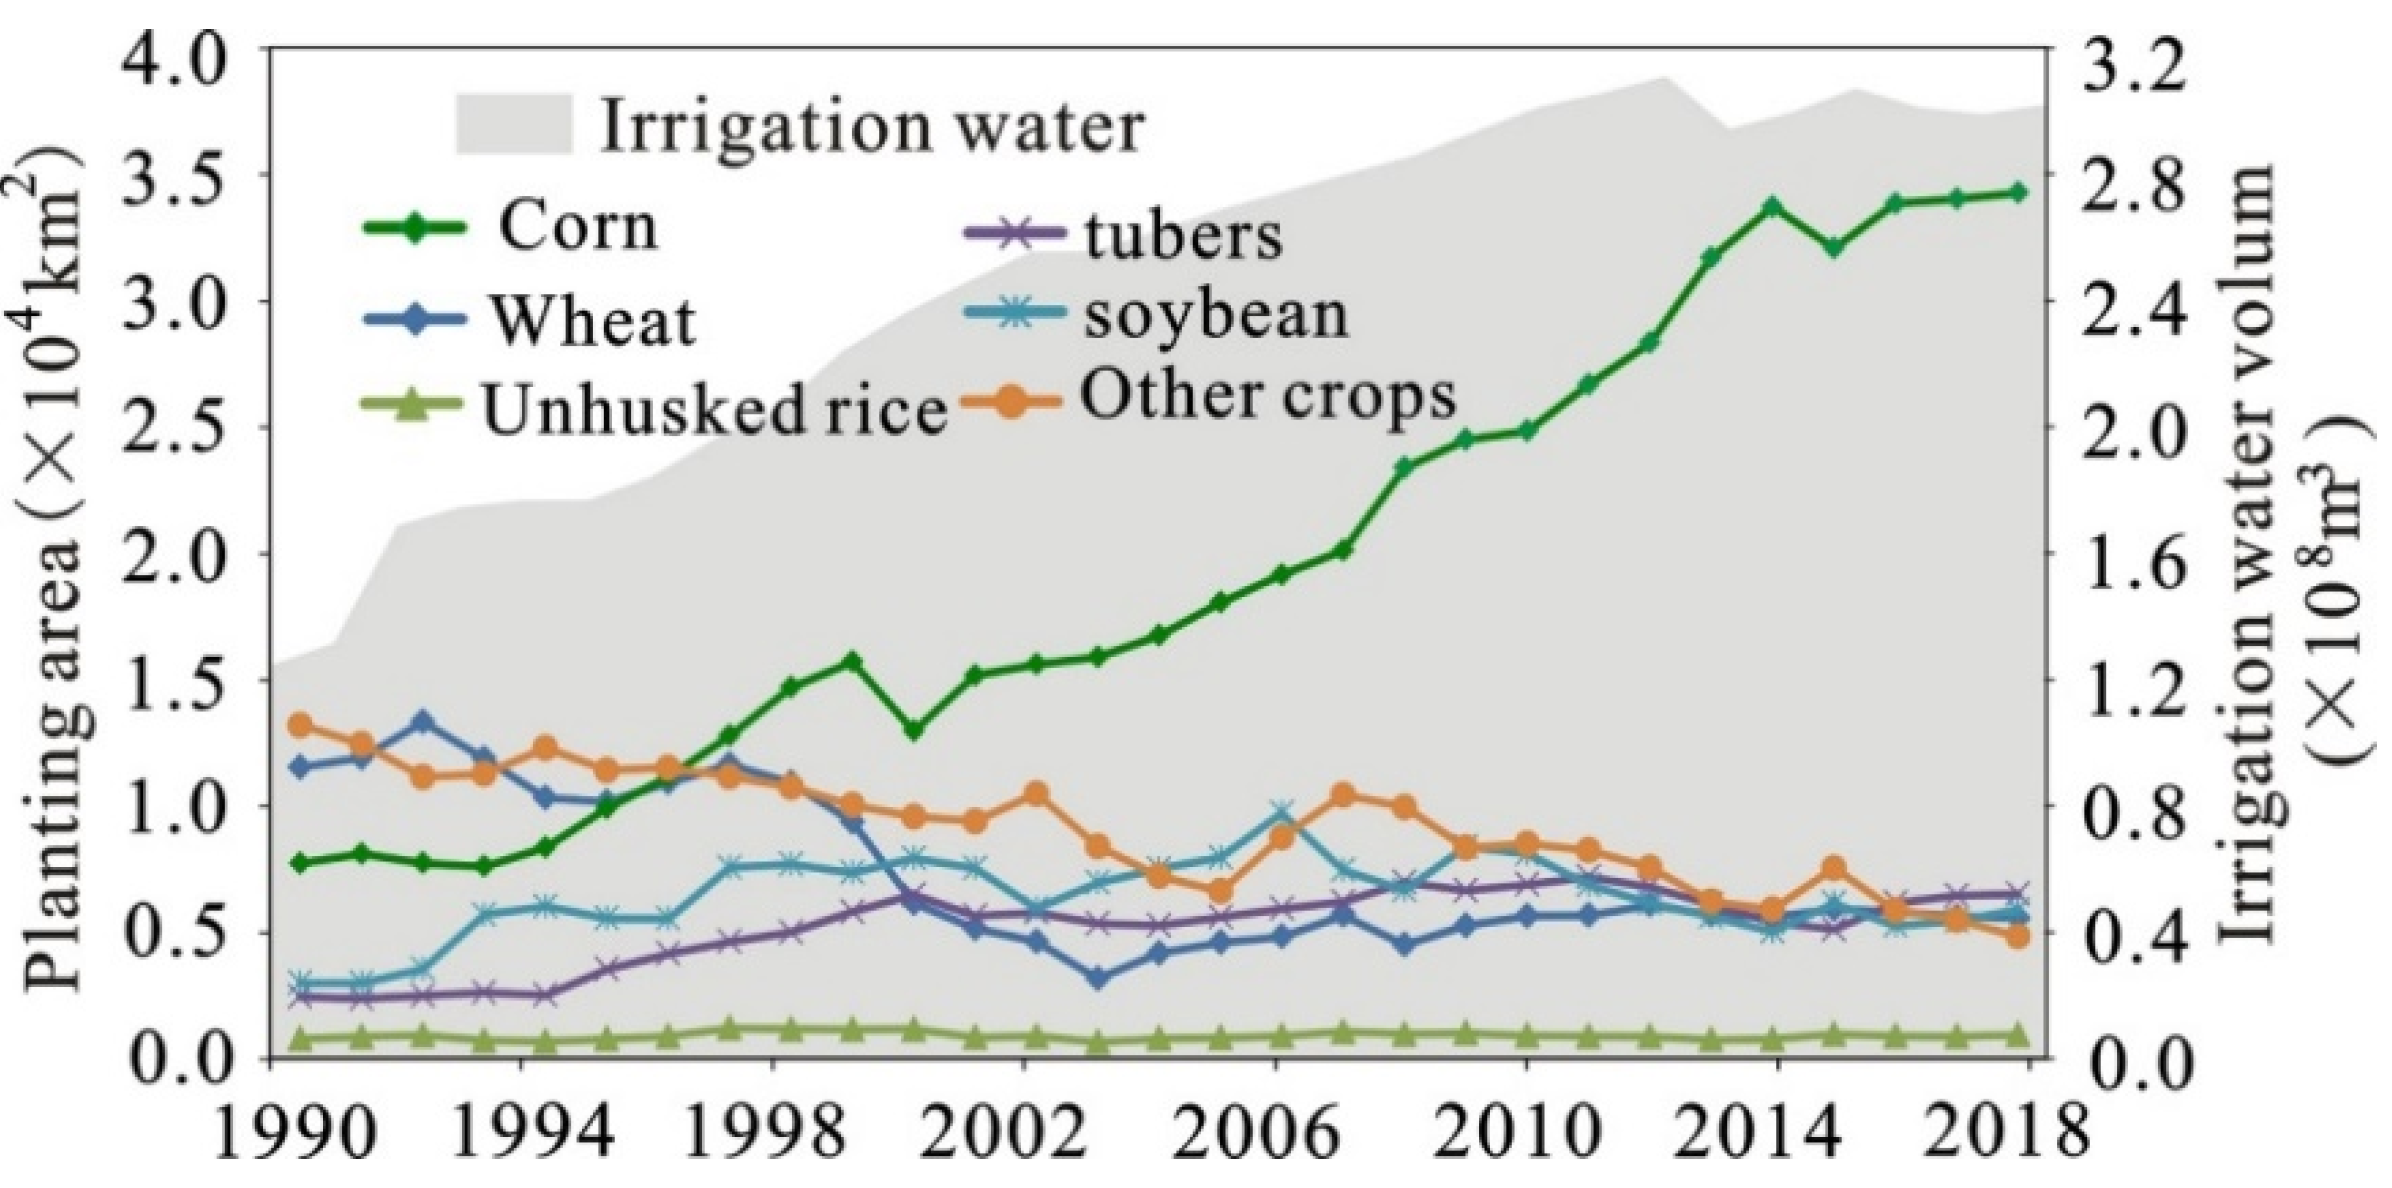
4.1. The Wind Erosion Modulus and the Water Constraint for Sustainable Agricultural Development
4.2. The Effect of the Grain for Green Project on Eliminating Soil Wind Erosion
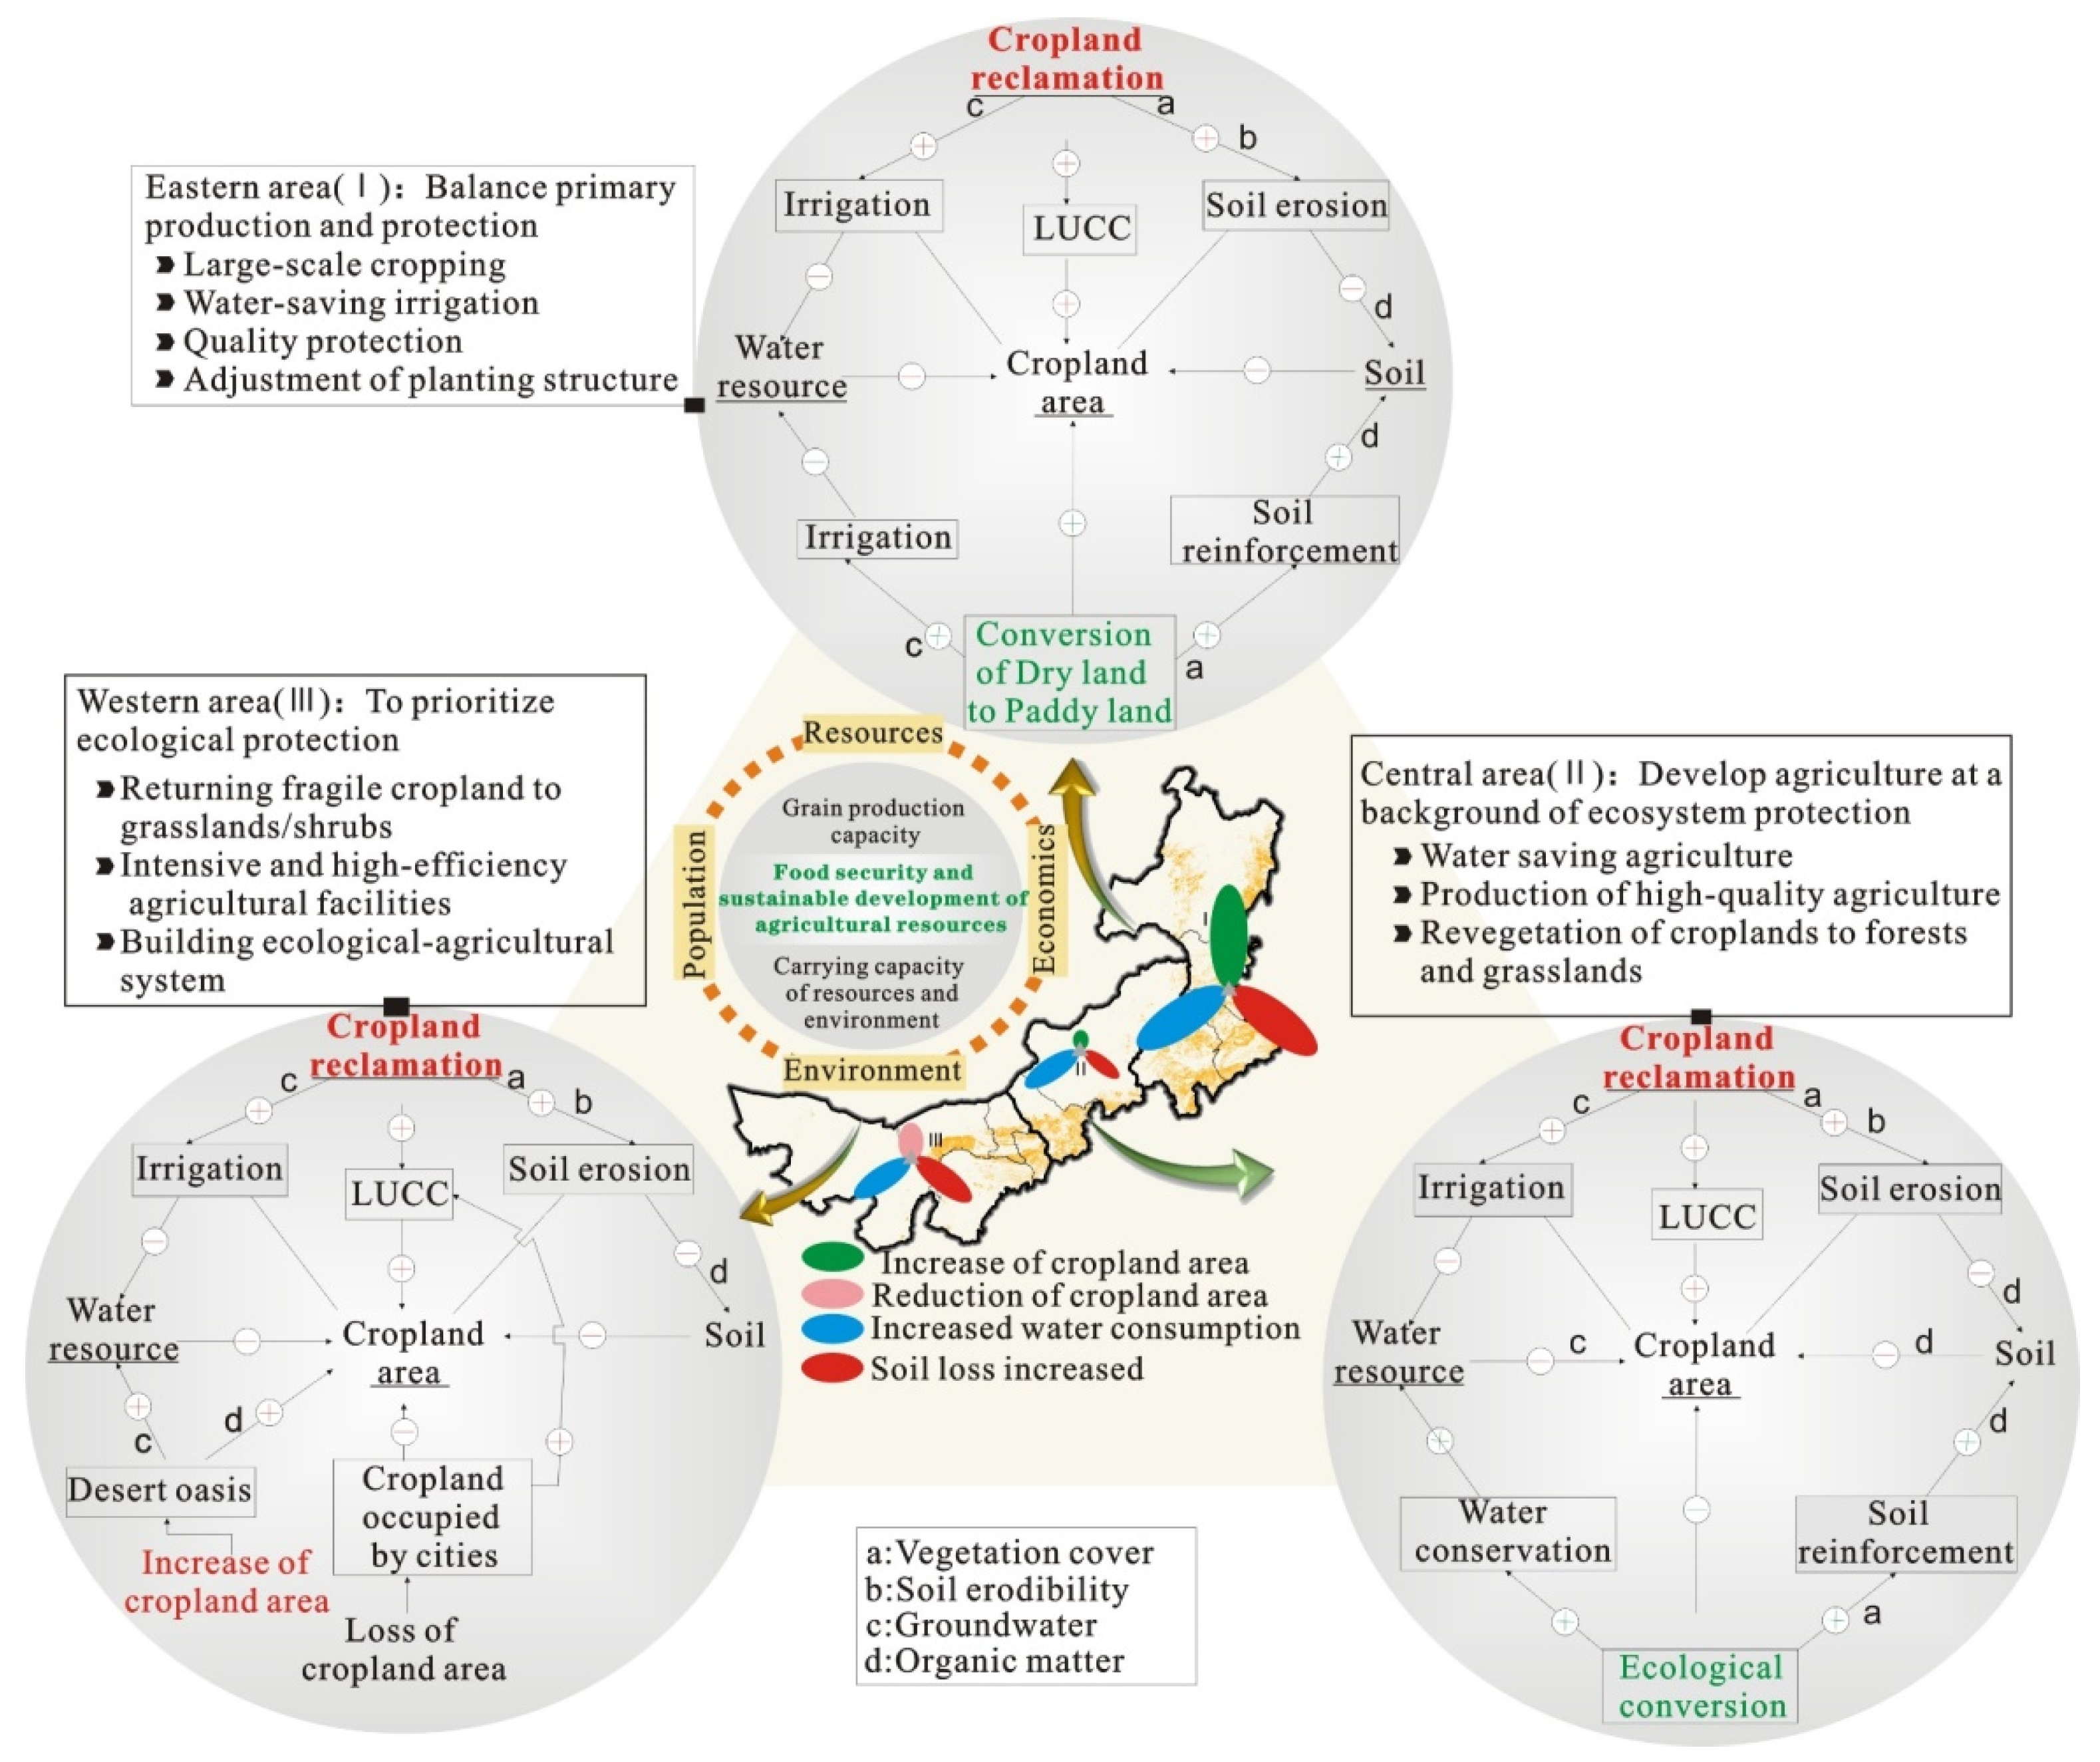
4.3. Cropland Evolution for Sustainable Agriculture and Food Security in Inner Mongolia
4.4. Limitation of This Study and Future Directions
5. Conclusions
Author Contributions
Funding
Data Availability Statement
Conflicts of Interest
References
- Power, A.G. Ecosystem services and agriculture: Tradeoffs and synergies. Philos. Trans. R. Soc. B Biol. Sci. 2010, 365, 2959–2971. [Google Scholar] [CrossRef]
- Pretty, J.; Benton, T.G.; Bharucha, Z.P.; Dicks, L.V.; Flora, C.B.; Godfray, H.C.J.; Goulson, D.; Hartley, S.; Lampkin, N.; Morris, C. Global assessment of agricultural system redesign for sustainable intensification. Nat. Sustain. 2018, 1, 441–446. [Google Scholar] [CrossRef]
- Schimel, D.S. Drylands in the earth system. Science 2010, 327, 418–419. [Google Scholar] [CrossRef]
- Koutroulis, A.G. Dryland changes under different levels of global warming. Sci. Total Environ. 2019, 655, 482–511. [Google Scholar] [CrossRef] [PubMed]
- Assessment, Millennium Ecosystem. Ecosystems and Human Well-Being; Island Press: Washington, DC, USA, 2005; Volume 5. [Google Scholar]
- Campbell-Platt, G. Food Science and Technology; John Wiley & Sons: Hoboken, NJ, USA, 2017. [Google Scholar]
- Rockström, J.; Steffen, W.; Noone, K.; Persson, Å.; Chapin, F.S.; Lambin, E.F.; Lenton, T.M.; Scheffer, M.; Folke, C.; Schellnhuber, H.J. A safe operating space for humanity. Nature 2009, 461, 472–475. [Google Scholar] [CrossRef] [PubMed]
- Piao, S.; Ciais, P.; Huang, Y.; Shen, Z.; Peng, S.; Li, J.; Zhou, L.; Liu, H.; Ma, Y.; Ding, Y. The impacts of climate change on water resources and agriculture in China. Nature 2010, 467, 43–51. [Google Scholar] [CrossRef] [PubMed]
- Su, Y.-Z.; Zhao, H.-L.; Zhang, T.-H.; Zhao, X.-Y. Soil properties following cultivation and non-grazing of a semi-arid sandy grassland in northern china. Soil Tillage Res. 2004, 75, 27–36. [Google Scholar] [CrossRef]
- Sigler, W.A.; Ewing, S.A.; Jones, C.A.; Payn, R.A.; Miller, P.; Maneta, M. Water and nitrate loss from dryland agricultural soils is controlled by management, soils, and weather. Agric. Ecosyst. Environ. 2020, 304, 107158. [Google Scholar] [CrossRef]
- Pierce, F.; Lal, R. Monitoring the impact of soil erosion on crop productivity. In Soil Erosion Research Methods; Taylor & Francis: Oxford, UK, 2017; pp. 235–263. [Google Scholar]
- Nordstrom, K.F.; Hotta, S. Wind erosion from cropland in the USA: A review of problems, solutions and prospects. Geoderma 2004, 121, 157–167. [Google Scholar] [CrossRef]
- Liu, M.-X.; Wang, J.-A.; Yan, P.; Liu, L.-Y.; Ge, Y.-Q.; Li, X.-Y.; Hu, X.; Song, Y.; Wang, L. Wind tunnel simulation of ridge-tillage effects on soil erosion from cropland. Soil Tillage Res. 2006, 90, 242–249. [Google Scholar] [CrossRef]
- Zhang, X.; Zhou, Q.; Chen, W.; Wang, Y.; Tong, D.Q. Observation and modeling of black soil wind-blown erosion from cropland in northeastern china. Aeolian Res. 2015, 19, 153–162. [Google Scholar] [CrossRef]
- Zhang, Z.; Luo, J.; Chen, B. Spatially explicit quantification of total soil erosion by rtk gps in wind and water eroded croplands. Sci. Total Environ. 2020, 702, 134716. [Google Scholar] [CrossRef]
- Li, J.; Ma, X.; Zhang, C. Predicting the spatiotemporal variation in soil wind erosion across central asia in response to climate change in the 21st century. Sci. Total Environ. 2020, 709, 136060. [Google Scholar] [CrossRef] [PubMed]
- Zhao, Y.; Wu, J.; He, C.; Ding, G. Linking wind erosion to ecosystem services in drylands: A landscape ecological approach. Landsc. Ecol. 2017, 32, 2399–2417. [Google Scholar] [CrossRef]
- Bryan, B.A.; Gao, L.; Ye, Y.; Sun, X.; Connor, J.D.; Crossman, N.D.; Stafford-Smith, M.; Wu, J.; He, C.; Yu, D. China’s response to a national land-system sustainability emergency. Nature 2018, 559, 193–204. [Google Scholar] [CrossRef] [PubMed]
- Wei, W.; Wang, B.; Niu, X. Soil erosion reduction by grain for green project in desertification areas of northern china. Forests 2020, 11, 473. [Google Scholar] [CrossRef]
- Gao, S.; Wang, Y.; Shan, M.; Teng, Y.; Hong, N.; Sun, Y.; Mao, J.; Ma, Z.; Xiao, J.; Azzi, M. Wind-tunnel and modelled pm10 emissions and dust concentrations from agriculture soils in tianjin, northern china. Aeolian Res. 2020, 42, 100562. [Google Scholar] [CrossRef]
- LU, S.-S.; LIU, Y.-S.; LONG, H.-L.; Xing-Hang, G. Agricultural production structure optimization: A case study of major grain producing areas, china. J. Integr. Agric. 2013, 12, 184–197. [Google Scholar] [CrossRef]
- Chi, W.; Zhao, Y.; Kuang, W.; He, H. Impacts of anthropogenic land use/cover changes on soil wind erosion in china. Sci. Total Environ. 2019, 668, 204–215. [Google Scholar] [CrossRef]
- Ning, J.; Liu, J.; Kuang, W.; Xu, X.; Zhang, S.; Yan, C.; Li, R.; Wu, S.; Hu, Y.; Du, G. Spatiotemporal patterns and characteristics of land-use change in china during 2010–2015. J. Geogr. Sci. 2018, 28, 547–562. [Google Scholar] [CrossRef]
- Tang, H.; Chen, Y.; Li, X. Driving mechanisms of desertification process in the horqin sandy land—A case study in zhalute banner, inner mongolia of china. Front. Environ. Sci. Eng. China 2008, 2, 487. [Google Scholar] [CrossRef]
- Zhang, W.; Chen, S.; Chen, J.; Wei, L.; Han, X.; Lin, G. Biophysical regulations of carbon fluxes of a steppe and a cultivated cropland in semiarid inner mongolia. Agric. For. Meteorol. 2007, 146, 216–229. [Google Scholar] [CrossRef]
- Tao, J.; Zhang, G.; Wang, J.; Dong, J. Variation of cropland phenology in mid-eastern inner mongolia. Sci. Agric. Sin. 2011, 44, 4583–4592. [Google Scholar]
- Chen, H.; Shao, L.; Zhao, M.; Zhang, X.; Zhang, D. Grassland conservation programs, vegetation rehabilitation and spatial dependency in inner mongolia, china. Land Use Policy 2017, 64, 429–439. [Google Scholar] [CrossRef]
- Liu, J.; Kuang, W.; Zhang, Z.; Xu, X.; Qin, Y.; Ning, J.; Zhou, W.; Zhang, S.; Li, R.; Yan, C. Spatiotemporal characteristics, patterns, and causes of land-use changes in china since the late 1980s. J. Geogr. Sci. 2014, 24, 195–210. [Google Scholar] [CrossRef]
- Holben, B.N. Characteristics of maximum-value composite images from temporal avhrr data. Int. J. Remote Sens. 1986, 7, 1417–1434. [Google Scholar] [CrossRef]
- Fryrear, D.; Bilbro, J.; Saleh, A.; Schomberg, H.; Stout, J.; Zobeck, T. Rweq: Improved wind erosion technology. J. Soil Water Conserv. 2000, 55, 183–189. [Google Scholar]
- Guo, Z.; Zobeck, T.; Zhang, K.; Li, F. Estimating potential wind erosion of agricultural lands in northern china using the revised wind erosion equation and geographic information systems. J. Soil Water Conserv. 2013, 68, 13–21. [Google Scholar] [CrossRef]
- Jiang, C.; Wang, F.; Zhang, H.; Dong, X. Quantifying changes in multiple ecosystem services during 2000–2012 on the loess plateau, china, as a result of climate variability and ecological restoration. Ecol. Eng. 2016, 97, 258–271. [Google Scholar] [CrossRef]
- Zhang, H.; Fan, J.; Cao, W.; Harris, W.; Li, Y.; Chi, W.; Wang, S. Response of wind erosion dynamics to climate change and human activity in inner mongolia, china during 1990 to 2015. Sci. Total Environ. 2018, 639, 1038–1050. [Google Scholar] [CrossRef]
- Chi, W.; Bai, W.; Liu, Z.; Dang, X.; Kuang, W. Wind erosion in inner mongolia plateau using the revised wind erosion equation. Ecol. Environ. Sci. 2018, 27, 1024–1033. [Google Scholar]
- Wuepper, D.; Borrelli, P.; Finger, R. Countries and the global rate of soil erosion. Nat. Sustain. 2020, 3, 51–55. [Google Scholar] [CrossRef]
- Zhao, Y.; Chi, W. Ecological and Environmental Consequences of Ecological Projects in the Beijing-Tianjin Sand Source Region, China, EGU General Assembly Conference Abstracts. 2020, p. 12375. Available online: https://ui.adsabs.harvard.edu/abs/2020EGUGA.2212375Z/abstract (accessed on 20 April 2021).
- Fallahzade, J.; Karimi, A.; Naderi, M.; Shirani, H. Soil mechanical properties and wind erosion following conversion of desert to irrigated croplands in central iran. Soil Tillage Res. 2020, 204, 104665. [Google Scholar] [CrossRef]
- Zhao, Y.; Chi, W.; Kuang, W.; Bao, Y.; Ding, G. Ecological and environmental consequences of ecological projects in the beijing–tianjin sand source region. Ecol. Indic. 2020, 112, 106111. [Google Scholar] [CrossRef]
- Al-Sheikh, A.; Delgado, J.; Barbarick, K.; Sparks, R.; Dillon, M.; Qian, Y.; Cardon, G. Effects of potato–grain rotations on soil erosion, carbon dynamics and properties of rangeland sandy soils. Soil Tillage Res. 2005, 81, 227–238. [Google Scholar] [CrossRef]
- Chowaniak, M.; Głąb, T.; Klima, K.; Niemiec, M.; Zaleski, T.; Zuzek, D. Effect of tillage and crop management on runoff, soil erosion and organic carbon loss. Soil Use Manag. 2020, 36, 581–593. [Google Scholar] [CrossRef]
- Komissarov, M.; Klik, A. The impact of no-till, conservation, and conventional tillage systems on erosion and soil properties in lower austria. Eurasian Soil Sci. 2020, 53, 503–511. [Google Scholar] [CrossRef]
- Dang, Y.P.; Dalal, R.C.; Menzies, N. No-Till Farming Systems for Sustainable Agriculture: Challenges and Opportunities; Springer Nature: Berlin/Heidelberg, Germany, 2020. [Google Scholar]
- He, Y.; Presley, D.R.; Tatarko, J.; Blanco-Canqui, H. Crop residue harvest impacts wind erodibility and simulated soil loss in the central great plains. Gcb Bioenergy 2018, 10, 213–226. [Google Scholar] [CrossRef]
- Zhang, G.; Fei, Y.; Liu, C.; Yan, M.; Wang, J. Adaptation between irrigation intensity and groundwater carrying capacity in north china plain. Trans. Chin. Soc. Agric. Eng. 2013, 29, 1–10. [Google Scholar]
- Li, F.-R.; Kang, L.-F.; Zhang, H.; Zhao, L.-Y.; Shirato, Y.; Taniyama, I. Changes in intensity of wind erosion at different stages of degradation development in grasslands of inner mongolia, china. J. Arid Environ. 2005, 62, 567–585. [Google Scholar] [CrossRef]
- Breshears, D.D.; Whicker, J.J.; Zou, C.B.; Field, J.P.; Allen, C.D. A conceptual framework for dryland aeolian sediment transport along the grassland–forest continuum: Effects of woody plant canopy cover and disturbance. Geomorphology 2009, 105, 28–38. [Google Scholar] [CrossRef]
- Qi, Y.; Dong, Y.; Peng, Q.; Xiao, S.; He, Y.; Liu, X.; Sun, L.; Jia, J.; Yang, Z. Effects of a conversion from grassland to cropland on the different soil organic carbon fractions in inner mongolia, china. J. Geogr. Sci. 2012, 22, 315–328. [Google Scholar] [CrossRef]
- Ouyang, Z.; Zheng, H.; Xiao, Y.; Polasky, S.; Liu, J.; Xu, W.; Wang, Q.; Zhang, L.; Xiao, Y.; Rao, E. Improvements in ecosystem services from investments in natural capital. Science 2016, 352, 1455–1459. [Google Scholar] [CrossRef] [PubMed]


| Period | East | Center | West | Inner Mongolia | ||||
|---|---|---|---|---|---|---|---|---|
| Annual Change Area (km2/a) | Annual Change Rate (%) | Annual Change Area (km2/a) | Annual Change Rate (%) | Annual Change Area (km2/a) | Annual Change Rate (%) | Annual Change Area (km2/a) | Annual Change Rate (%) | |
| 1990–1995 | 1506.30 | 13.16 | 11.52 | 0.28 | 164.28 | 3.24 | 1682.10 | 8.17 |
| 1995–2000 | 1215.51 | 9.38 | 205.07 | 4.84 | −178.04 | −3.51 | 1242.53 | 5.58 |
| 2000–2005 | 231.37 | 1.63 | −69.30 | −1.71 | −4.49 | −0.09 | 157.58 | 0.67 |
| 2005–2010 | 71.72 | 0.50 | −9.89 | −0.24 | 8.53 | 0.16 | 70.37 | 0.30 |
| 2010–2015 | 123.99 | 0.86 | −117.30 | −2.89 | −60.25 | −1.16 | −53.55 | −0.23 |
| 2015–2018 | −1.50 | −0.01 | −2.66 | −0.04 | 20.10 | 0.24 | 15.94 | 0.04 |
| 1990–2018 | 562.14 | 27.49 | 3.31 | 0.45 | −10.34 | −1.14 | 555.10 | 15.10 |
Publisher’s Note: MDPI stays neutral with regard to jurisdictional claims in published maps and institutional affiliations. |
© 2021 by the authors. Licensee MDPI, Basel, Switzerland. This article is an open access article distributed under the terms and conditions of the Creative Commons Attribution (CC BY) license (https://creativecommons.org/licenses/by/4.0/).
Share and Cite
Chi, W.; Zhao, Y.; Kuang, W.; Pan, T.; Ba, T.; Zhao, J.; Jin, L.; Wang, S. Impact of Cropland Evolution on Soil Wind Erosion in Inner Mongolia of China. Land 2021, 10, 583. https://doi.org/10.3390/land10060583
Chi W, Zhao Y, Kuang W, Pan T, Ba T, Zhao J, Jin L, Wang S. Impact of Cropland Evolution on Soil Wind Erosion in Inner Mongolia of China. Land. 2021; 10(6):583. https://doi.org/10.3390/land10060583
Chicago/Turabian StyleChi, Wenfeng, Yuanyuan Zhao, Wenhui Kuang, Tao Pan, Tu Ba, Jinshen Zhao, Liang Jin, and Sisi Wang. 2021. "Impact of Cropland Evolution on Soil Wind Erosion in Inner Mongolia of China" Land 10, no. 6: 583. https://doi.org/10.3390/land10060583
APA StyleChi, W., Zhao, Y., Kuang, W., Pan, T., Ba, T., Zhao, J., Jin, L., & Wang, S. (2021). Impact of Cropland Evolution on Soil Wind Erosion in Inner Mongolia of China. Land, 10(6), 583. https://doi.org/10.3390/land10060583