Article

Can Famine Be Averted? A Spatiotemporal Assessment of The Impact of Climate Change on Food Security in The Luvuvhu River Catchment of South Africa

by
Geoffrey Mukwada
1,2,3,*,
Sabelo M. Mazibuko
1,3,
Mokhele Moeletsi
4 and
Guy M. Robinson
5,6
1
Department of Geography, QwaQwa Campus, University of the Free State, Phuthaditjhaba 9886, South Africa
2
Department of Geography, W.A. Franke College of Forestry, Conservation of the University of Montana, Missoula, MT 59812, USA
3
AfroMontane Research Unit, QwaQwa Campus, University of the Free State, Phuthaditjhaba 9866, South Africa
4
Agricultural Research Council, Institute for Soil, Climate and Water, Private Bag X79, Pretoria 0001, South Africa
5
Department of Geography, Environment and Population, School of Social Sciences, University of Adelaide, Adelaide 5005, Australia
6
Department of Land Economy, University of Cambridge, Cambridge CB3 9EP, UK
*
Author to whom correspondence should be addressed.
Land 2021, 10(5), 527; https://doi.org/10.3390/land10050527
Submission received: 31 March 2021 / Revised: 2 May 2021 / Accepted: 10 May 2021 / Published: 14 May 2021
(This article belongs to the Special Issue Land Use and Climate Change Effects on Food Security in Africa)

Abstract

:
Climate change has proved to be a threat to food security the world over. Using temperature and precipitation data, this paper examines the differential effects climate change has on different land uses in the Luvuvhu river catchment in South Africa. The paper uses the Normalised Difference Vegetation Index (NDVI) and Vegetation Condition Index (VCI), which were calculated from Landsat images, and the Standardised Precipitation Index (SPI) for a sample of years between 1980 and 2016 to assess how drought and flood frequency have affected the agricultural environment. The results indicate that the lowest SPI values were recorded in 1996/1997, 2001/2002 and 2014/2015, suggesting the occurrence of drought during these years, while the highest SPI values were recorded in 1997/1998, 2002/2003 and 2004/2005. The relationship between three-month SPI (SPI_3) and VCI was strongest in grassland, and subsistence farming areas with the correlation coefficients of 0.8166 (p = 0.0022) and −0.6172 (p = 0.0431), respectively, indicating that rainfall variability had a high negative impact on vegetation health in those land uses with shallow-rooted plants. The findings of this study are relevant to disaster management planning in South Africa, as well as development of farming response strategies for coping with climate hazards in the country.

1. Introduction

The Luvuvhu River Catchment Area (LRCA) is a sub-catchment of the Limpopo River Basin (LRB), which covers parts of Botswana, South Africa, Mozambique and Zimbabwe. The LRCA constitutes the upper reaches of the LRB in South Africa. It is situated in Limpopo Province [1], one of South Africa’s most agriculturally important provinces [2,3]. The LRCA experiences a subtropical climate, which favours subsistence farming, commercial crops and livestock farming [4], making agriculture the mainstay of the local economy [5,6]. Commercial farming in this province involves the cultivation of coffee, tea, citrus, mangoes, papayas (pawpaw), avocados, bananas, litchis and forestry in high rainfall areas of the Drakensberg and Soutpansberg Mountains [2,3,7], making it a key employer in the region. Limpopo Province is one of the leading producers of maize and export fruits in South Africa [8], demonstrating its importance in food security and South Africa’s cash economy. Maize is the main staple crop for the majority of people in South Africa. Recurrence of drought and floods poses huge threats to the local economy. For instance, droughts were reported in 1981/1982, 1982/1983, 1983/1984, 1986/1987, 1988/1989, 1989/1990, 1991/1992, 1994/1995, 2002/2003, 2004/2005, 2006/2007, 2007/2008 and 2009/2010, 2011/2012 and 2014/2015 [9], while the LRB as a whole experienced floods in 1981, 1985, 1996, 1997, 1999–2001, 2003, 2008, 2010 and 2011 [10,11]. Studies have defined a drought as an atmospheric hazard which is associated with continuous decreases in precipitation over an extended period [12]. Depending on the time scale, extent, and intensity of drought, different types of drought exist, and their definitions differ based on the subject at hand [13].
On the other hand, a flood is a high flow of water, usually occurring after heavy rainfall which flows over the banks of a river or steep surface [11]. However, other causes of floods are failures of dams to hold water during times of heavy rainfall, paved areas or hard surfaces in built-up areas decreasing infiltration and increased runoff and blocked pipes due to sediment deposition by flood water [14,15]. Riverine floods often occur in areas that are close to the river [16]. Moreover, urbanisation, deforestation, poor agricultural practices are some of the human-induced activities which increase the intensity and frequency of droughts and floods [5].
In the LRCA, agricultural activities have been responsible for the destruction of riparian vegetation [17]. The riparian vegetation has been over-utilised for firewood and replaced by crops in the cultivated land and orchards [5]. The drought and floods which are frequently experienced in the area are water-related natural disasters, which not only affect crop yields, livestock productivity and water availability, but also vegetation [18]. For example, the 2000 floods made significant impacts on the lower Letaba and Luvuvhu rivers. During these floods alien plants such as the Cocklebur, Sesbania and Ageratum were washed into the area [5]. By contrast, the 1993 drought influenced the effect of upstream activities that caused the low flows of the river. The LRCA has experienced some land cover and land use changes, which include clearance of forest and shrub lands to make space for small-scale agriculture and livestock grazing. These have been cited as the potential cause of the reduced base flow of the Luvuvhu river [6].
In the LRCA vegetation is dominated by woodlands, grassland, thickets and bushland vegetation [5,17]. The riparian vegetation plays an important role in moderating the impacts of flooding on surrounding areas, acting as a buffer or filter, preventing nutrients, sediments and contamination from entering the river and acting as a buffer to erosion through stabilisation of the river banks; therefore riparian vegetation should be conserved. The main land uses within the LRCA are agriculture, forestry and settlements. Large-scale vegetable farms are common near the Albasini Dam, and small-scale agricultural land dominates the northern highlands [6]. Semi-commercial and small-scale farming is mostly practiced along the riverbanks. Farmers prefer to plant crops along the riverbanks where the land is flat and fertile, especially in areas where water is easily accessible for agricultural activities [11].
In the LRCA, the main land uses include commercial dryland farming (10 percent), commercial irrigation agriculture (3 percent), range land (50 percent), conservation areas (30 percent) and urban areas (3 percent) [19]. Subsistence farming plays an important role in reducing unemployment in the catchment area, where many people struggle with unemployment. The LRCA is regarded as an economically poor and underdeveloped region, where people practice farming and livestock management to sustain their livelihoods [6,20].
Due to their financial and environmental impacts, floods often have devastating impacts on crops and human life [16,21]. In rain-fed agricultural areas, floods are mainly caused by erratic and heavy rainfall [22]. The physical causes of floods are linked to precipitation, topography, soil type and runoff, while contributing anthropogenic factors are usually associated with development and land use changes [11]. Flash floods, fluvial floods, and riverine floods are fairly common in areas that experience erratic rainfall. Flash floods occur after heavy or excessive rainfall has occurred within a short period of time and they are prevalent in all terrains and landscapes [11,16]. Fluvial floods are distinguished from flash floods by a timescale of less than six hours [11]. Flash floods occur within a short period of time with little chance to react. Riverine and fluvial floods usually occur due to high rainfall in the high-altitude areas, or inflows of high-water volumes into rivers after heavy rainfall [16].
In contrast, drought relates to a condition when there is a deficit of rainfall. There are different types of drought, including meteorological, agricultural, hydrological and social droughts. A meteorological drought is defined as the extent of precipitation departure from normal in comparison with long-term average rainfall [23]. The prolonged abnormal precipitation deficit affects the agricultural sector, especially in rain-fed agricultural areas [24]. The occurrence of below-normal rainfall results in decreased cultivated land, which affects yields from agricultural land [25]. Water shortages characterising times of drought result in crop and livestock losses [25]. Better understanding the impacts of drought on agriculture could allow farmers to adapt and develop ways that can enhance agricultural production [26].
Agricultural drought on the other hand is a lack of soil moisture, causing decreases in agricultural production and lack of water for livestock [23,27,28]. Agricultural drought is triggered by a deficiency of precipitation over an extended period of time, which could be weeks, months, a season or longer [29,30]. Lack of rainfall results in crop failure, thus affecting food production [31]. It is important that pro-active adaptation measures are developed for rural communities to adapt to the changes in climate and occurrence of natural hazards, such as droughts and floods [32].
Hydrological droughts are associated with the effects of precipitation on surface or subsurface water resources, including stream flows, ground water, reservoirs and lakes [23,33]. Lack of rainfall during times of drought affects water availability in rivers and dams which are used for irrigation [32].
Finally, socioeconomic droughts affect human life in terms of supply of and demand for economic goods and services, and this type of drought is interrelated with meteorological, hydrological and agricultural droughts [23]. In rain-fed agricultural areas, drought impacts negatively on livelihoods, employment and income from agricultural production [26]. High frequencies of natural hazards, such as droughts and floods, increase migration of people in search for jobs and often results in abandonment of agriculture [34].
The LRCA is prone to extreme events (both floods and droughts), a situation which undermines not only the viability of the agricultural economy but also agriculture-based livelihoods in the catchment. However, while the occurrence of these hazards has been brought to the fore in recent research, little is known about the actual effect of these hazards on different agricultural activities and the degree to which different agricultural land uses are vulnerable to these hazards. Therefore, the purpose of this study was to fill this gap. In this paper, we use both climate and green indices to determine the relationship between conditions that lead to drought and changes that occur in different categories of land cover and land use types in the LRCA.

2. Materials and Methods
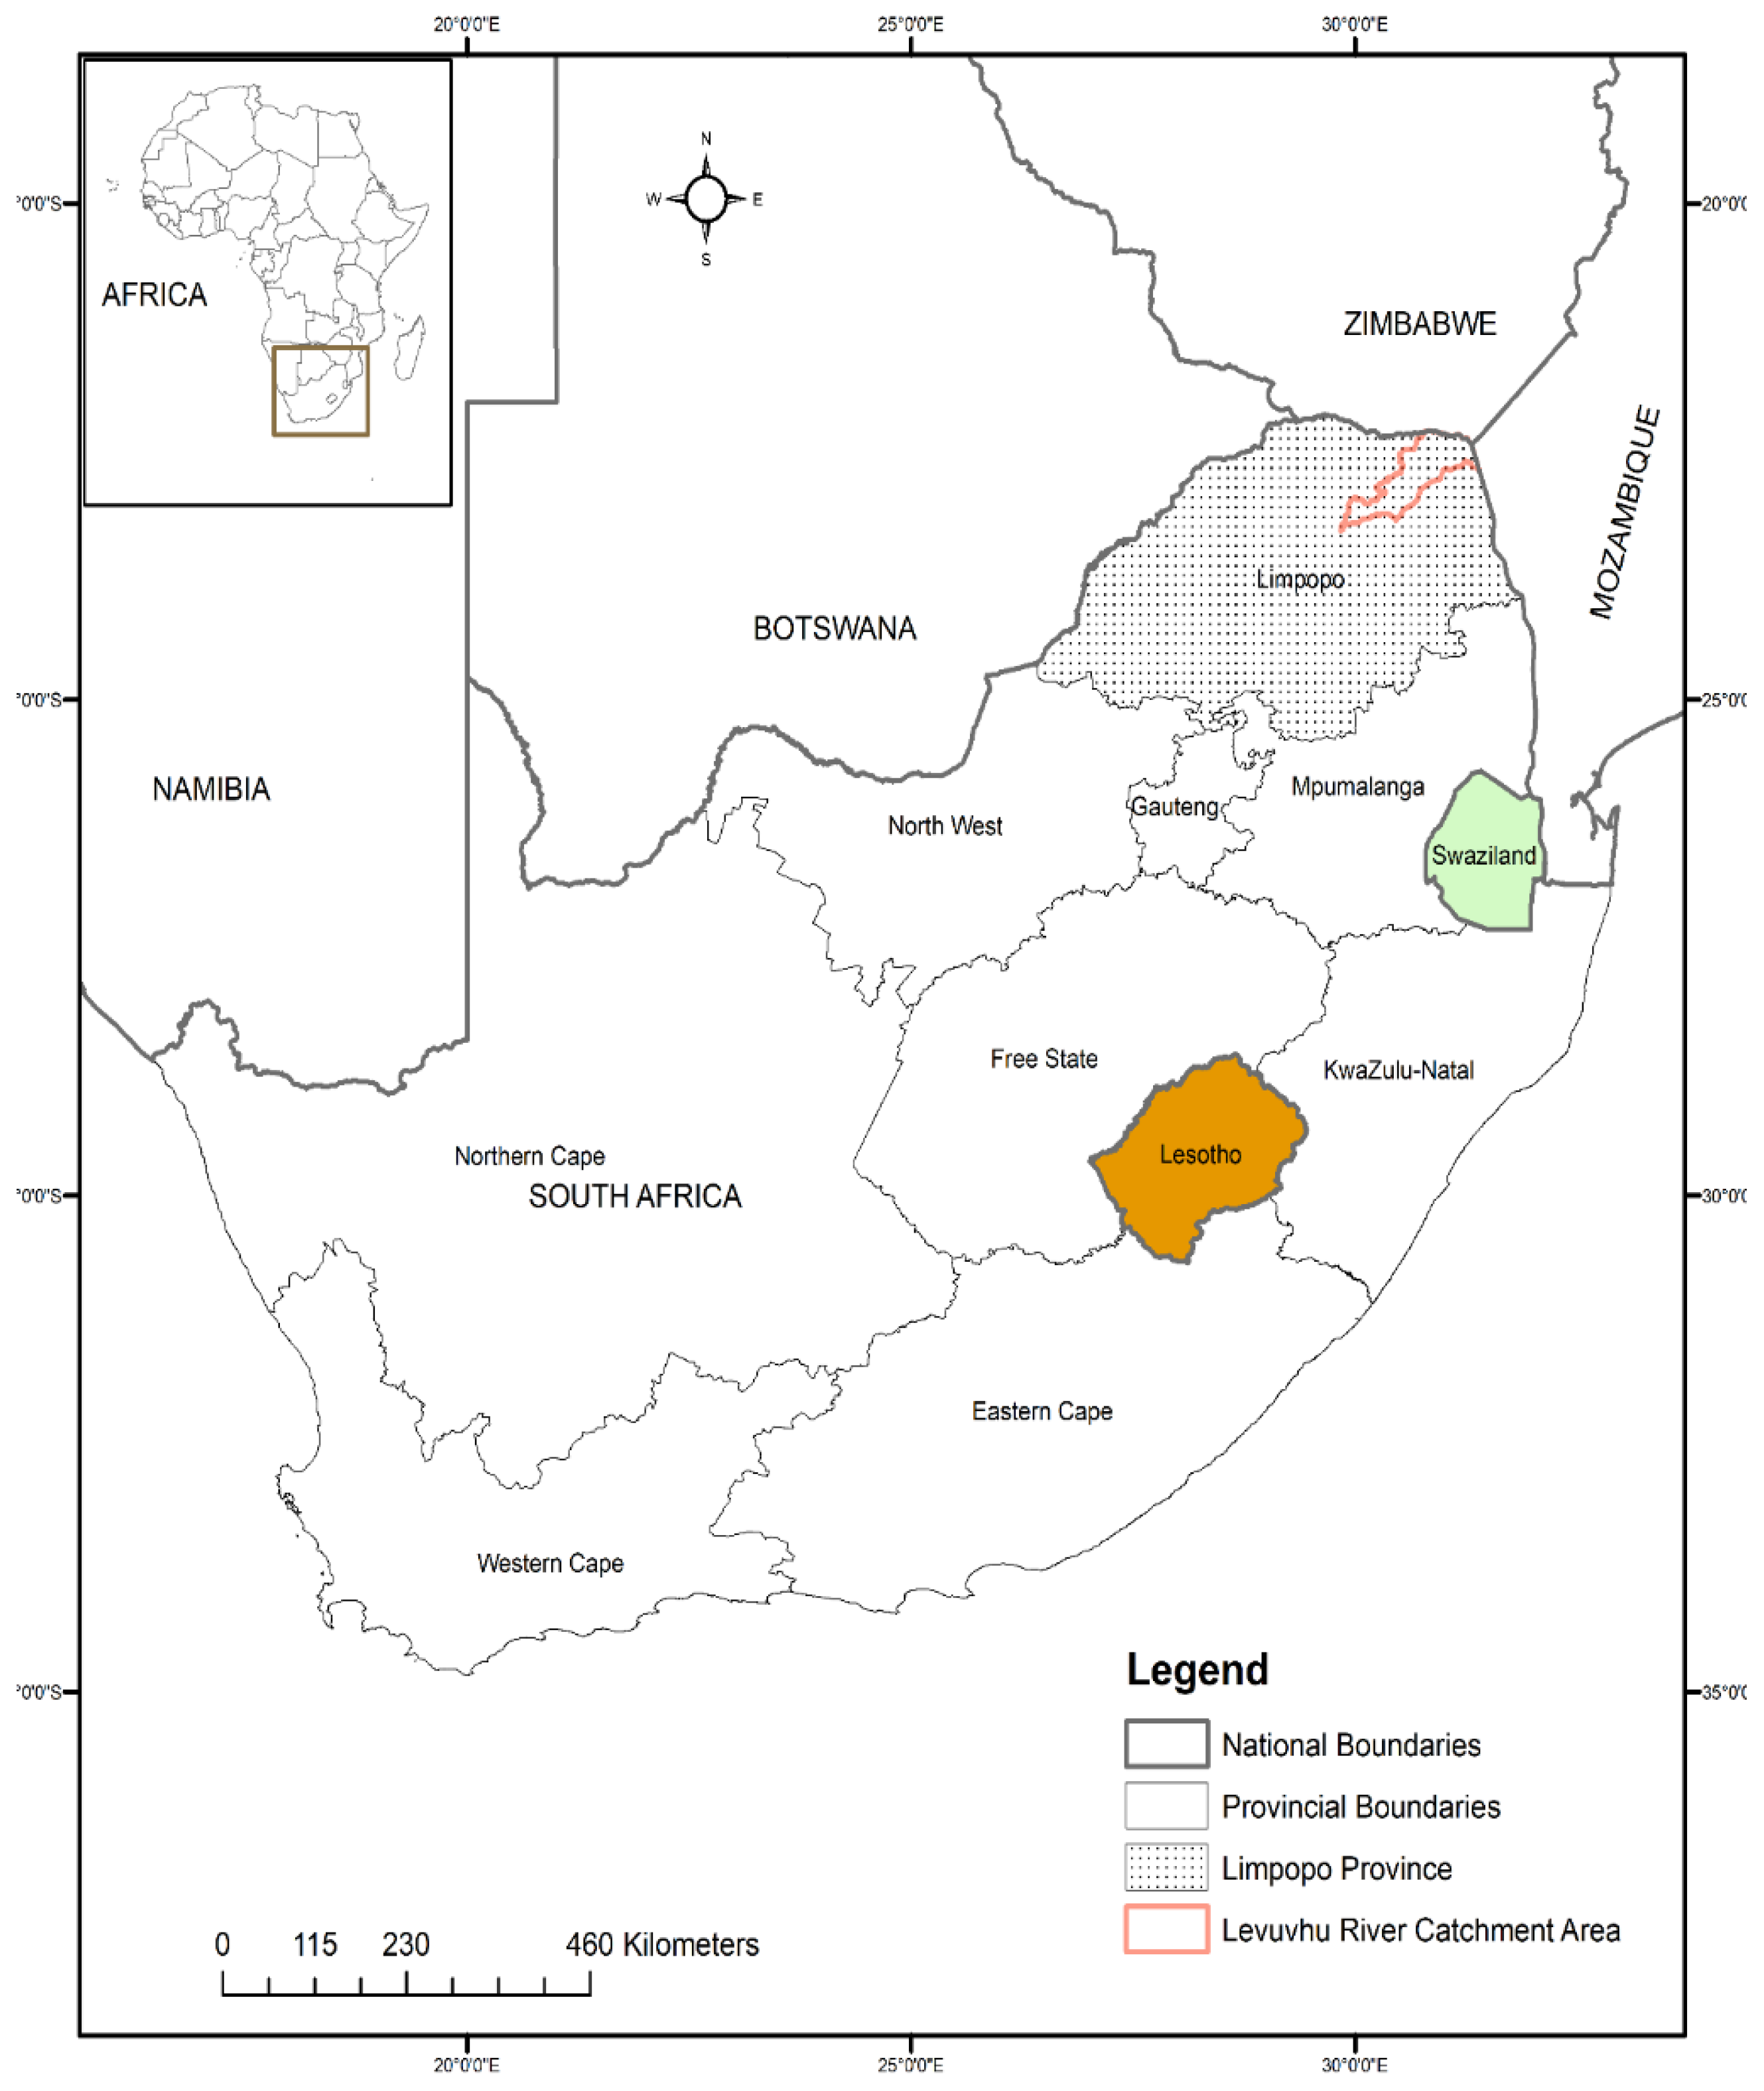
2.1. Study Area

The LRCA is situated in the Limpopo Province of South Africa (Figure 1). The Vhembe District (VD), where the LRCA is located, is a remote area, affected by high rates of poverty and unemployment [5]. In this district, agriculture is one of the main solutions to these two problems. The Water Management Area (WMA) of Luvuvhu/Letaba contributes less than 1 percent of the country’s Gross Domestic Product (GDP), but agriculture, fisheries and forestry contribute 11.9 percent nationally [35]. The biophysical and environmental conditions of the district favour agriculture, and that is the primary reason why most of the people in the area rely on agriculture as a source of income and employment. Subsistence farming is the dominant form of agriculture in the LRCA [5].

2.2. Meteorological Data

Climate data used in this study consist of gridded monthly rainfall data from the Climate Research Unit (CRU TS4.04) for the period between 1960 and 2015. The latitude and longitude grid points covering the Luvuvhu River Catchment Area (LRCA) for which monthly rainfall data were downloaded are shown in Figure 1. The data were downloaded from Climate Explorer (https://climexp.knmi.nl/start.cgi (accessed on 18 December 2020). The spatial resolution of the data is 0.5 × 0.5 degrees and the monthly rainfall data cover a period of 55 years from 1960 to 2015. The study period spans a long enough time to comply with the World Meteorological Organisation (WMO) standards, which require a minimum of 30 years [29,33]. Monthly rainfall data were used to compute the SPI values for each of the 15 grid points evenly distributed over the study area. The SPI values were used to identify years of drought and above-normal rainfall [33]. Mckee et al.’s [36] classification of SPIs was used to identify drought, normal and above-normal rainfall years, while VCI classification was adopted from Zambrano et al. [37] (Table 1).
According to McKee et al.’s [36] classification, there are seven categories of SPI values, including those denoting near normal (−0.99–0.99), moderately wet (1.0–1.49), severely wet (1.50–1.99), extremely wet (≥2.0), moderately dry (−1.49–−1.0), severely dry (−1.99–−1.50) and extremely dry (≤−2.0) (with corresponding SPI ranges in brackets). The years with SPI values within the range between −0.99 and 0.99 were identified as near-normal years. The years with positive SPI values above 0.99 were identified as above-normal years, which suggest possibilities of floods and SPI values below −0.99 identified as drought years [38].
Station data were not used in this study because of inconsistencies in how rainfall was recorded and gaps in the data.
Monthly rainfall data from October to April cover the agricultural season in the catchment area. The three-month time scale of December, January and February (DJF), which corresponds to the middle of the rainfall season, was used to assess rainfall variability in the catchment area. The SPI_3 was used to assess the response of vegetation to precipitation, as suggested by other authors [29,30]. The SPI_3 was selected because of high spatial variability, which can be associated with short-term agro-meteorological anomalies that can result in crop failure [1,39].

2.3. Remote Sensing Data
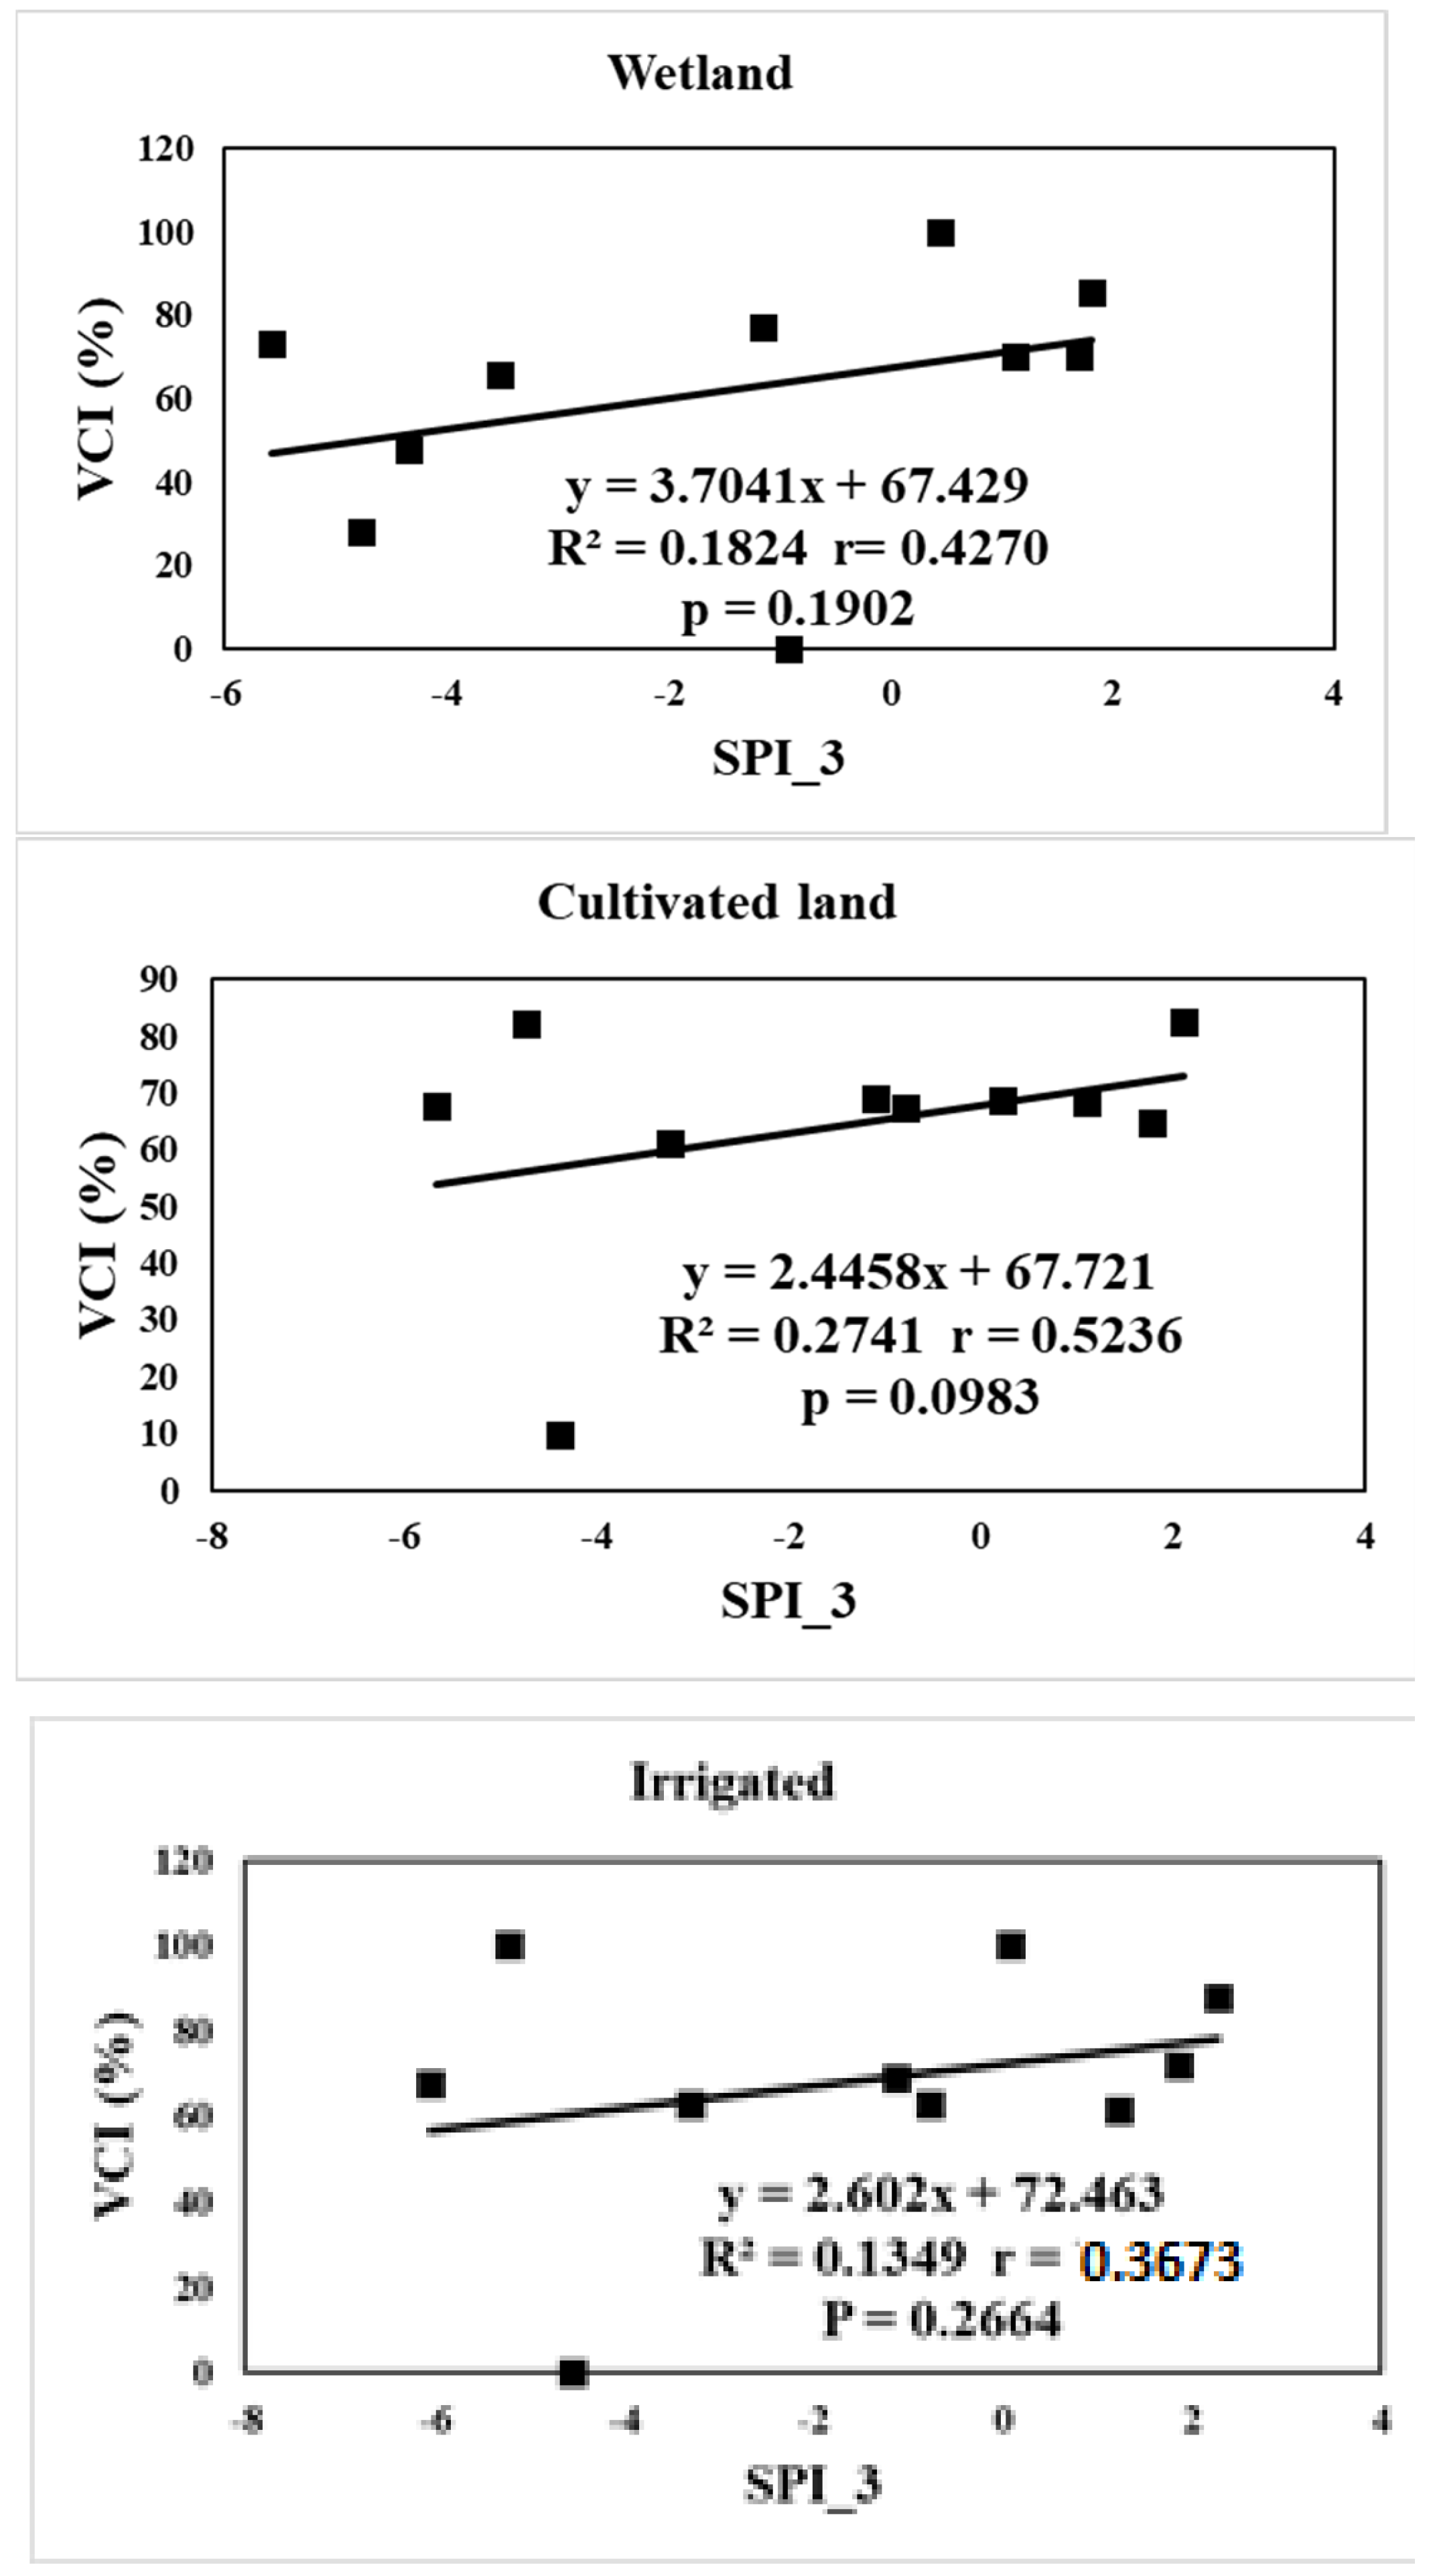
Long term Landsat data (1980–2015) were downloaded from the Earth Explorer through the United States Geological Survey (USGS) site (https://earthexplorer.usgs.gov accessed on 10 December 2020), using WRS2 and 169 path and 76 row [6,30]. Before any analysis was done, the Landsat images were radiometrically and atmospherically corrected. Images for April were considered due to the one-month lag response of vegetation to precipitation [40]. Values of vegetation indices were extracted using drawing marker algorithms embedded in ArcGIS version 10.3. Landsat images with a cloud cover less than 10 percent and haze-free were used.
NDVI was calculated using the formula NDVI = (NIR − R)/(NIR + R), where R is the visible red Band and NIR is the Near Infrared Band.
NDVI values range from −1 to +1; values close to −1 indicate vegetation with the worst vigour and sparse vegetation and values from 0 to +1 indicate dense vegetation with the best vigour. However, low NDVI values (0.1 or less) could also represent areas covered by barren rocks, sand or snow, while moderate NDVI values between 0.2 and 0.5 show sparse vegetation cover such as shrubs and grasslands. Dense vegetation, such as temperate and tropical forests, reflect high NDVI values in an approximately 0.6 to 0.9 range [33]. The severity of drought can be measured by the actual NDVI of the current month and long-term mean of NDVI [29].
The VCI was calculated from NDVI values. Mean VCI was calculated using ArcGIS software by applying the cell statistics algorithm. The VCI was calculated using the formula:
VCI = ((NDVImax − NDVImin)/(NDVImax + NDVImin)) × 100)
where NDVImax and NDVImin are the monthly maximum and minimum, respectively. The land cover and land use types found in the study area include grasslands, forest, wetlands, subsistence farming, cultivated and irrigated lands. The VCI measures the severity of drought on a scale that ranges from 0 to 100, with 0 indicating extremely dry conditions and 100 high and healthy vegetation [41]. Where the VCI is calculated from the NDVI, it is possible to classify drought according to Kogan’s (1990) classification [42], into extreme, severe, moderate, and mild and no drought [43,44,45]. VCI values below 35 percent are an indication of drought, VCI around 50 percent show fair vegetation health, and VCI between 50 and 100 percent indicate optimal or above-normal vegetation health [17]. Pearson Product Moment Correlation (PPMC) analyses were run to assess the relationship between SPI_3 and vegetation and specifically to determine levels of precipitation that were responsible for particular states of vegetation condition. PPMC was employed for a number of reasons. First, both SPI_3 and VCI are continuous variables which are measurable on a ratio scale. Secondly, there were no outliers in the data, while linearity was relatively high. Thirdly, SPI_3 and VCI data were available for each of the years that were included in the analyses. The following formula was used to calculate the correlation coefficients.
p = r n x y ) ( x ) ( y n x 2 ( x ) 2 n y 2 ( y ) 2
where p = correlation coefficient; x = SPI_3; and y = VCI.
The assessment of the status of vegetation health using one or more indices is common, especially where vegetation indices are used in conjunction with meteorological indices to assess the spatial and temporal characteristics of vegetation health [37].

3. Results

Figure 2 shows the temporal variability of SPI values for the LRCA for the period between 1980 and 2016. The variability of SPI reflects the variability of drought severity across the catchment. As shown in Figure 2 and Figure 3, the three-month SPI values indicate that there was a total of seven drought years since 1995/1996, with a severe one in 1996/1997 and an extremely severe one in 2001/2002. Since 1995/1996, there has been a total of three severely wet years. Before 1995, rainfall was near normal. This confirms the widely held general view that climate change is accompanied by extreme events. The results of this study differ from those of an earlier study by Nkuna and Odiyo [3], which reported 1982/1983 and 1991/1992 as severely dry years. With SPI_3 values of −0.7 and −0.8, respectively, 1982/1983 and 1991/1992 were years of near-normal rainfall. An extreme drought was recorded in 2001/2002, when an SPI_3 value of −2.3 was recorded. During this year, widespread crop failure and livestock deaths, as well as household food shortages, were reported in the catchment. Low precipitation leads to soil moisture deficit, perpetuates agricultural drought, and reduces agricultural yields [46]. A study by Kogan et al. [47] showed that the frequent occurrence of drought increases malnutrition and hunger, which subsequently increases food insecurity. Rainfall plays a critical role in crop production, since it is the main source of water for irrigation and livestock farming [48].
High rainfall, as indicated by SPI values close to +2, which were recorded in 1997/1998, 2002/2003 and 2004/2005, are characteristic of occurrence of flood events which could also affect farming activities in the LRCA. Besides increasing livestock mortality rates in areas characterized by poor adaptive capacity, excessive rainfall results in floods and ponding, leading to conditions that are a conducive environment for the outbreak of pests and diseases with negative impacts on crop yields [49,50,51]. Floods also destroy infrastructure, for instance, silos used to store agricultural harvests, and this increases food insecurity [45], as well as roads, making transportation of agricultural produce difficult.
The years 1994/1995, 1997/1998, 2002/2003 and 2004/2005 were associated with SPI values ≥1.0, indicating the severely wet conditions that characterized these years. In 2004/2005, relatively high SPI values were recorded in the catchment, reaching a maximum of 1.60, indicating that 2004/2005 was a severely wet year for the catchment.
While SPIs varied globally within the LRCA, when considering the entire timescale (1980–2016), they also varied spatially from year to year, depending on local conditions, as shown in Figure 3. The Landsat data for the 1980–2016 period depict 1991, 1992, 1995, 2003, 2015 and 2016 as the driest years, due to low vegetation vigour recorded in these years (Figure 3). The lowest vegetation vigour was recorded in the northwestern and southeastern part of the catchment, where the landscape is dominated by grassland, subsistence farming and cultivated land. However, portions of areas in the northern part of the catchment, which are characterized by wetlands and forests, recorded the highest vegetation vigour. Even though rainfall was low during the above years, wetlands and forests managed to retain soil moisture, thus yielding a slow response of the vegetation to precipitation deficits. The lowest vegetation vigour was recorded in the southeastern parts of the catchment. During the 1991 and 1992 rainfall seasons, higher SPI values were concentrated in the southwestern parts of the catchment area, which are dominated by wetlands, commercial cultivation, subsistence farming and irrigated land. Thus, wet conditions were most prevalent in the northern and southern parts of the catchment. These areas are dominated by forests and grasslands, and the dominant land uses include commercial cultivation and subsistence farming.
In 1992, 1995, 2002 and 2015, low VCI values were recorded in the southeastern and western parts of LRCA, though only a small portion of the catchment exhibited low vegetation vigour.
Forest, subsistence, and commercial cultivation land uses are the dominant land uses in these areas. NDVI results for 1995 correlate highly with the SPIs, suggesting that rainfall variability plays an important role in vegetation growth. The results indicate that drought conditions were experienced towards the western and central northern parts of the catchment, where large swaths of vegetation were severely affected. In 2002, NDVI values depicted the highest vegetation vigour in the northern part of the catchment area. In the northern parts of the catchment, persistent good vegetation health depends on the deep rooting systems that enable trees to access underground water. In the southeastern part, which mostly comprises irrigated areas, the higher NDVIs are attributable to supplementary water supply in the irrigation systems that are operated there.
As noted in Figure 3, in 2014/2015 the northern and southern central parts of the catchment recorded lower vegetation health compared with the rest of the catchment, which recorded higher NDVI and VCI values. In contrast, the northwestern and southeastern parts of the catchment area, where vegetation is dominated by wetlands, grassland and forest cover, and where the dominant land uses include subsistence farming, as well as commercial dryland and irrigation crop farming, recorded higher NDVI and VCI values. Grassland areas are characterized by shallow rooting systems and tend to react more quickly to changes in rainfall.
The period of 2015/2016 recorded very poor vegetation health conditions. While this year received near-normal rainfall (Figure 2), the drought that occurred in the preceding year had different effects on land uses and environmental conditions, including the state of vegetation health in different locations in the catchment, as shown in Figure 3. Vegetation type plays a pivotal role in the ability of plants to respond to rainfall variability, especially in rain-fed agricultural areas. As stated earlier, the NDVI was used to assess changes in vegetation health in different land use categories between 1991 and 2016. The results (Figure 4) indicate that, during the drought years of 1992 and 2016, low NDVI values were recorded in all land cover and land use areas, suggesting that vegetation health was negatively affected by low rainfall. During these years, vegetation in grassland areas was characterised by low NDVI values. This is due to the quick response that grass has to moisture deficit. To the contrary, irrigated and wetland vegetation showed a slower response, because of the supplementary supply of water that keeps the soil moist.
During the 1995 drought year, vegetation in irrigated and forested areas recorded the highest NDVI values, compared with the rest of the catchment. High NDVI values indicate favourable cropping conditions or healthy plants, including crops. Findings from a study by Rimkus et al. [52] suggested that forest and irrigated lands are usually characterized by high values of NDVI. During the 1995 drought, subsistence farming, cultivated land and grassland areas recorded positive NDV values above 0.4, indicating that vegetation in these areas was fairly healthy. This is because the drought was moderate (Figure 2) and only had a mild effect on the environment. However, wetlands exhibited the lowest NDVI values of −0.4 during that drought year, and the low NDVI recorded in wetland areas could be due to the high sensitivity of wetland species to drought (Figure 4). The prevalence of negative NDVI values in wetlands results from the abundance of water caused by temporary flooding [53]. Other factors that prevent vegetation in wetlands from experiencing optimal growth include lack of nutrients and diseases. In wetlands, the accumulation of excessive water in soils suppresses NDVIs [54].
Though 2011 was a relatively dry year, with an SPI value of −1.2 (Figure 2), vegetation health in irrigated and wetland areas was high (Figure 4). This is due to continuous water supply in these areas.
As stated earlier, healthy vegetation reflects high NDVI values and stressed vegetation mostly reflects low NDVI vales (Figure 4). With the exception of cases when the ground is submerged, wetlands and irrigated areas record the highest NDVI values, a reflection of high vegetation vigour and biomass. Due to the nature of conditions in wetland ecosystems, this vegetation is least affected by climatic factors such as drought. On the other hand, subsistence farming areas were associated with the lowest NDVI values due to the fact that the natural vegetation and agricultural crops in these areas mostly depend on rainfall and are to some extent affected by the low water holding capacity of the soil in these areas. In forests, due to the ability of trees to access underground water through their well-established deep rooting systems, vegetation is least affected by rainfall variability. In subsistence and grazing areas, vegetation changes resulting from deforestation also contribute to low NDVIs. Similarly, NDVIs for grasslands are reduced by overgrazing, especially in drought years.
Figure 5 provides a summary of the results which were obtained when VCI and SPI values were correlated. Only grasslands and subsistence farming areas exhibited significant correlation between VCI and SPI, with correlation coefficients of 0.8166 (p = 0.0022), and −0.6172 (p = 0.0431), respectively. As shown by these results, in these areas rainfall variability had a higher impact on vegetation than in other areas. Vegetation and crops in subsistence farming areas rely on rains as the main source of water supply, compared with other areas. The relatively high VCI values in forest and woodland areas arise from the fact that vegetation in these areas does not rely on natural rainfall only, but also on available groundwater. In general, trees have deeply rooted systems which enable them to draw water from the phreatic zone, unlike shallow-rooted plants in natural grasslands and subsistence farming areas.

4. Discussion

An important finding of this study is that, although there is intermittent occurrence of wet and drought conditions due to high rainfall variability within the LRCA, as shown in the results of this study, there is an emerging trend showing dominance of negative SPI values. The results of this study clearly demonstrate that the climatic hazards that are most prevalent in the LRCA are more associated with rainfall deficit than with excessive rainfall. The dominance of negative SPI values in the time series signifies increasing aridity. Precipitation plays a pivotal role in determining crop growth and insufficient rainfall reduces plant vigour, depending on the nature of land cover or land use conditions [55]. This is clearly demonstrated in the results of this study, which show recurrence of severe droughts in the LRCA. This confirms the validity of earlier research, which demonstrated that rainfall is poorly distributed within the LRCA, while data are often inaccurate and difficult to obtain in near real time [56].
The second important finding of the study is that subsistence farming areas are the most vulnerable to drought conditions. While this has been noted in the corpus of literature on drought occurrence in the Limpopo Basin for instance [16,21,22], a new finding emerging from the current study is the drought-induced prevalence of low vegetation health in shallow-rooted cropping areas where subsistence farming is mostly practiced. During drought years, NDVIs in subsistence farming areas are low, compared with those in commercially cultivated and forested areas. In the LRCA, the majority of farmers practice subsistence farming, hence the recurrence of drought conditions in the catchment poses a huge threat to the majority of farmers, whose only means of livelihood is subsistence agriculture. However, it should be noted that in Limpopo Province as a whole, unreliable rainfall and increasing temperatures hinder farmers from achieving high yields [18]. Any limits imposed on food production means that rural poverty will worsen among people who depend on agriculture for their livelihood. A study by Maponya and Mpandeli [4] suggests that a decline in agricultural production will not only affect the people in Limpopo Province but the whole of South Africa, since the province constitutes part of the breadbasket of the country. The results of this study confirm findings from earlier research which reported Limpopo Province as getting drier as a result of increasing frequency of droughts [1]. Previous research has shown that in some parts of the province farmers often sell their livestock as a way of coping with drought conditions [57].
The third key finding of this study is the strong correlation between SPI and VCI values. This is not surprising considering that rainfall is the main source of water supply in the LRCA. However, with the exception of subsistence farming areas, this relationship is positive for all land uses in the catchment, though it is only statistically significant for grassland areas. To the contrary, in the subsistence farming areas, the correlation between SPI and VCI is negative. Poor performance of vegetation in these areas can be attributed to low soil fertility, deforestation, high stocking densities and poor land management and farming skills, as well as high levels of poverty. Due to poverty, most subsistence farmers are unable to procure agricultural inputs, hence the low NDVIs, which signify poor crop health. This limitation is worsened by poor land management and farming skills and tends to increase food insecurity in the catchment. Based on this reality, policy makers need to take into consideration the heterogeneity of land uses in the LRCA in order to make relevant policies to reduce food insecurity and avert famine in the catchment, including policies that render support for subsistence farmers to shift from growing shallow-rooted crops to deep-rooted crops through establishment of orchards. With income derived from sales of produce, the farmers can acquire food for their households.
In this study, we not only demonstrated the need to assess the impacts of climate hazards on all land cover and land use conditions, but also the importance of employing remote sensing and GIS in these assessments. Earlier research has established that Limpopo Province is affected by inter-annual rainfall variability which subjects the province to drought [58], though drought occurs in all climatic zones [59]. Drought and flood analyses require continuous and rapidly acquired data, yet access to such data is difficult and expensive [56], while meteorological data may not be available, especially in Africa. The evolution of new technologies such as remote sensing and GIS techniques may be the only available source of data required to monitor and assess droughts and floods [60]. The use of remote sensing and GIS easily allows monitoring, retrieving, storing and manipulating of data and enables the data to be used in the analysis of risks and natural hazards such as drought and floods [17]. Timely and accurate information is regularly required by authorities to locate and identify areas affected by droughts and floods so that appropriate mitigation strategies can be implemented [17]. The mitigation of droughts and floods requires relevant information in real time [61], a need demonstrated in the results of this study. Moreover, timely prediction and monitoring of a climate phenomenon require continuous real-time data. It is not possible to effectively collect continuous data using conventional methods [24,48]. Traditional methods of assessing droughts and floods rely on rainfall data, which is limited. Due to the high variability of rainfall in the LRCA, careful planning and sound policies are needed in order for food security to be realized, hence the need for accurate environmental assessment. Remote sensing tools offer excellent possibilities of collecting this vital data [62]. Satellite technology collects long-term data continuously, near real time and can collect large amounts of information [63].
The application of different indices provided a mechanism for validating the results of this study. However, the degree to which the indices unveiled the presence or absence of climate hazards or the extent to which these indices correlate with each other differs according to local conditions, including nature of land cover and land use, as well as due to prevailing environmental conditions. For example, wetlands recorded low NDVIs when submerged, while they recorded high NDVIs under drought conditions. This is because the response of vegetation depends on the amount, intensity and distribution of precipitation [64], as well as location specific conditions such as nature of land cover and land use.
The results of this study indicate that the recurrence of extreme climate events brought about by climate change, namely floods and drought, are a threat to food security in the LRCA. Earlier studies [9,65] indicated that changes in rainfall patterns in the LRCA are a threat to the production of maize, the main agricultural in the catchment. Therefore, developing drought-tolerant cultivars of maize or drought-resistant crops such as sorghum and millet has to be considered as an adaptation priority strategy by subsistence farmers in the LRCA. Farmers need to be trained to make better use of weather forecast data to enable them to adjust their operations based on seasonal rainfall forecasts. Government support is required to ensure that the opportunity to implement this strategy is not missed. Lack of agricultural support to farmers exposes farming communities to natural hazards such as drought [66]. Due to their poor economic status and the under-development of the catchment, farmers in the LRCA, who depend on rain-fed farming to produce food, require increased support to enable them to acquire irrigation equipment and mitigate the impacts of drought in the catchment. The dependence on low rainfall for crop production reduces yields in areas dominated by shallow-rooted crops such as maize, sorghum and millet, and limit farmers’ contribution to food security. In rangelands, which are fragile, farmers need to decrease stocking rates in order to reduce reliance on diminishing pastures and reduce overgrazing. This is likely to be the biggest hurdle as many communal farmers in South Africa regard livestock holding as a symbol of wealth.
In concluding this discussion, it is worth noting that this study was not based on data from meteorological stations. Station data were not used in this study because of inconsistencies in how rainfall was recorded and gaps in the data. Hence, the precipitation data that were used to computed SPI values were CRU-TS (4.04) gridded data. Lack of meteorological station data is a problem prevalent not just in South Africa, but in most developing countries.

5. Conclusions

As shown in the results of this study, the climate of the LRCA is changing, as signified by increasing rainfall variability and drought recurrence. There is heterogeneity in the impacts of drought, depending on land cover and land use, and subsistence farming areas are the most vulnerable compared with other land use types. The growing of drought resistant crops could be one of the short-term strategies of reducing food insecurity and chances of famine. However, a longer-term strategy could involve policies that support subsistence farmers to shift to deep-rooted cropping systems that generate income for their households. Government support is needed to ensure that farmers receive technical skills that will enable them to shift from shallow-rooted to deep-rooted crops. The application of remote sensing and GIS to promote the quality of environmental monitoring constitute part of the technical skills needed in the implementation of food security enhancement strategies. A shift from subsistence farming to this semi-commercial, orchard-based farming system would be a form of livelihood diversification in the catchment. However, the viability of all these strategies requires both technical support and further research.

Author Contributions

Conceptualization, G.M, M.M. and S.M.M.; Methodology, G.M. and S.M.M.; Formal analysis, S.M.M. and G.M.; Writing, G.M., G.M.R. and S.M.M. All authors have read and agreed to the published version of the manuscript.

Funding

Water Research Commission, Grant No. K5/2403//4), and the Agricultural Research Council (ARC) Professional Development Programme, Grant No. P07000065.

Data Availability Statement

Not applicable.

Acknowledgments

The authors wish to acknowledge financial support for this research received from the Water Research Commission (WRC), South Africa, under the project “The modelling of rainy season characteristics and drought in relation to crop production in the Levubu catchment of the Limpopo Province climatology and climate change perspective.” (Grant No. K5/2403//4), and the Agricultural Research Council (ARC) Professional Development Programme (Grant No. P07000065).

Conflicts of Interest

The authors declare no conflict of interest.

References

  1. Trambauer, P.; Maskey, S.; Werner, M.; Pappenberger, F.; van Beek, L.; Uhlenbrook, S. Identification and simulation of space–time variability of past hydrological drought events in the Limpopo River basin, Southern Africa. Hydrol. Earth Syst. Sci. 2014, 18, 2925–2942. [Google Scholar] [CrossRef] [Green Version]
  2. Department of Water Affairs and Forestry (DWAF). South Africa. Luvuvhu/Letaba Water Management Area: International Strategic Perspective. Report No. 02/000/00/0304. 2004. Available online: http://www.dwaf.gov.za/Documents/Other/WMA/2/optimised/LUVUVHU%20LETABA%20REPORT.pdf (accessed on 23 March 2021).
  3. Nkuna, T.R.; Odiyo, J.O. The relationship between temperature and rainfall variability in the Levubu sub-catchment, South Africa. Int. J. Environ. Sci. 2016, 1, 66. [Google Scholar]
  4. DWAF. Luvuvhu/Letaba Water Management Area: Internal Strategic Perspective. Report No. 02/000/00/0304. 2001. Available online: http://www.dwaf.gov.za/Documents/Other/WMA/2/optimised/LUVUVHU%20LETABA%20REPORT.pdf (accessed on 23 March 2021).
  5. DWAF. State of the Rivers Report—Letaba and Luvuvhu River Systems, 2001. Available online: http://www.dwa.gov.za/iwqs/rhp/state_of_rivers/state_of_letluv_01/luvuvhu.html (accessed on 23 March 2021).
  6. Griscom, H.R.; Miller, S.N.; Gyedu-Ababio, T.; Sivanpillai, R. Mapping land cover change of the Luvuvhu catchment, South Africa for environmental modelling. GeoJournal 2010, 75, 163–173. [Google Scholar] [CrossRef]
  7. Mashau, M.; Moyane, J.; Jideani, I. Assessment of post-harvest losses of fruits at Tshakhuma fruit market in Limpopo Province, South Africa. Afr. J. Agric. Res. 2012, 7, 4145–4150. [Google Scholar]
  8. Mazibuko, S.M.; Mukwada, G.; Moeletsi, M.E. Assessing the frequency of drought/flood severity in the Luvuvhu River Catchment, Limpopo Province, South Africa. Water SA 2021, 47. [Google Scholar] [CrossRef]
  9. Masupha, T.E.; Moeletsi, M.E. Use of standardized precipitation evapotranspiration index to investigate drought relative to maize, in the Luvuvhu River catchment area, South Africa. Phys. Chem. Earth Parts A B C 2017, 102, 1–9. [Google Scholar] [CrossRef]
  10. Musyoki, A.; Thifulufelwi, R.; Murungweni, F.M. The impact of and responses to flooding in Thulamela Municipality, Limpopo Province, South Africa. Jàmbá 2016, 8, 1–10. [Google Scholar] [CrossRef]
  11. Singo, L.; Kundu, P.; Odiyo, J.; Mathivha, F.; Nkuna, T. Flood frequency analysis of annual maximum stream flows for Luvuvhu river catchment, Limpopo province, South Africa. In Proceedings of the 16th SANCIAHS National Hydrology Symposium, Pretoria, South Africa, 1–3 October 2012. [Google Scholar]
  12. Dalezios, N.; Blanta, A.; Spyropoulos, N. Assessment of remotely sensed drought features in vulnerable agriculture. Nat. Hazards Earth Syst. Sci. 2012, 12, 3139–3150. [Google Scholar] [CrossRef] [Green Version]
  13. Nicolas, D.R.; Blantaib, A.; Spyropoulos, N.; Pismichosic, N.; Boukouvalaid, E. Spatiotemporal classification of drought severity. In Proceedings of the International Conference on Information and Communication Technologies for Sustainable Agri-Production and Environment (HAICTA 2011), Skiathos, Greece, 8–11 September 2011; pp. 171–182. [Google Scholar]
  14. Munyai, R.B. An Assessment of Community Flood Vulnerability and Adaptation: A Case Study of Greater Tzaneen Local Municipality, South Africa. Ph.D. Thesis, University of Venda, Thohoyou, South Africa, 2017. [Google Scholar]
  15. Ngie, A. A GIS Approach for Flood Vulnerability and Adaptation Analysis in Diepsloot, Johannesburg. Ph.D. Thesis, University of Johannesburg, Johannesburg, South Africa, 2012. [Google Scholar]
  16. Revilla-Romero, B.; Hirpa, F.A.; Pozo, J.T.-D.; Salamon, P.; Brakenridge, R.; Pappenberger, F.; De Groeve, T. On the use of global flood forecasts and satellite-derived inundation maps for flood monitoring in data-sparse regions. Remote Sens. 2015, 7, 15702–15728. [Google Scholar] [CrossRef] [Green Version]
  17. Chhabra, A.S.; Ghosh, S.; Dwivedi, V.K. Assessment of flood induced area using geo-spatial technique. Assessment 2016, 9, 301–304. [Google Scholar]
  18. Devereux, S. The impact of droughts and floods on food security and policy options to alleviate negative effects. Agric. Econ. 2007, 37, 47–58. [Google Scholar] [CrossRef]
  19. Alfieri, L.; Thielen, J. A European precipitation index for extreme rain-storm and flash flood early warning. Meteorol. Appl. 2015, 22, 3–13. [Google Scholar] [CrossRef] [Green Version]
  20. Dogondaji, M.B.; Muhammed, A. Analysis of meteorological drought in Sokoto State for the past four decades (1970–2009). Int. Lett. Nat. Sci. 2014, 20, 52–64. [Google Scholar] [CrossRef] [Green Version]
  21. Gebrehiwot, T.; Van Der Veen, A.; Maathuis, B. Spatial and temporal assessment of drought in the Northern highlands of Ethiopia. Int. J. Appl. Earth Obs. Geoinf. 2011, 13, 309–321. [Google Scholar] [CrossRef]
  22. Abbas, S.; Nicol, J.E.; Qamer, F.M.; Xu, J. Characterization of drought development through remote sensing: A case study in Central Yunnan, China. Remote Sens. 2014, 6, 4998–5018. [Google Scholar] [CrossRef] [Green Version]
  23. Edossa, D.C.; Babel, M.S.; Gupta, A.D. Drought analysis in the Awash river basin, Ethiopia. Water Resour. Manag. 2010, 24, 1441–1460. [Google Scholar] [CrossRef]
  24. Ghanbari, S.; Bayad, H.; Rezayi, S. Socio–economical impact assessment of drought on the rural agriculture: A case study of rural districts in Southern Iran. Int. J. Environ. Prot. Policy 2015, 3, 53–56. [Google Scholar] [CrossRef]
  25. Dalezios, N.; Blanta, A.; Spyropoulos, N.; Tarquis, A. Risk identification of agricultural drought for sustainable Agroecosystems. Nat. Hazards Earth Syst. Sci. 2014, 14, 2435. [Google Scholar] [CrossRef] [Green Version]
  26. Sruthi, S.; Aslam, M.M. Agricultural drought analysis using the NDVI and land surface temperature data; a case study of Raichur district. Aquat. Procedia 2015, 4, 1258–1264. [Google Scholar] [CrossRef]
  27. Bhavani, R.P.; Joshi, P. Long-term agricultural performance and climate variability for drought assessment: A regional study from Telangana and Andhra Pradesh states, India. Nat. Hazards Risk 2017, 8, 822–840. [Google Scholar]
  28. Winkler, K.; Gessner, U.; Hochschild, V. Identifying droughts affecting agriculture in Africa based on remote sensing time series between 2000–2016: Rainfall anomalies and vegetation condition in the context of ENSO. Remote Sens. 2017, 9, 831. [Google Scholar] [CrossRef] [Green Version]
  29. Masih, I.; Maskey, S.; Mussa, F.; Trambauer, P. A review of droughts on the African continent: A geospatial and long-term perspective. Hydrol. Earth Syst. Sci. 2014, 18, 3635. [Google Scholar] [CrossRef] [Green Version]
  30. Mata-Lima, H.; Alvino-Borba, A.; Pinheiro, A.; Mata-Lima, A.; Almeida, J.A. Impacts of natural disasters on environmental and socio-economic systems: What makes the difference? Ambiente Soc. 2013, 16, 45–64. [Google Scholar] [CrossRef]
  31. Othman, M.; Ash’aari, Z.; Muharam, F.; Sulaiman, W.; Hamisan, H.; Mohamad, N.; Othman, N. Assessment of drought impacts on vegetation health: A case study in Kedah. In IOP Conference Series: Earth and Environmental Science; IOP Publishing: Bristol, UK, 2016; pp. 1–13. [Google Scholar]
  32. Wanders, N.; Wada, Y.; Van Lanen, H.A.J. Global hydrological droughts in the 21st century under a changing hydrological regime. Earth Syst. Dyn. 2015, 6, 1–15. [Google Scholar] [CrossRef] [Green Version]
  33. Adhikari, S. Drought impact and adaptation strategies in the Mid-Hill farming system of Western Nepal. Environments 2018, 5, 101. [Google Scholar] [CrossRef] [Green Version]
  34. World Meteorological Organisation (WMO). Limpopo River Basin; World Meteorological Organisation: Geneva, Switzlerand, 2012; Available online: http://www.wmo.int/pages/prog/hwrp/chy/chy14/documents/ms/Limpopo_Report.pdf (accessed on 21 March 2021).
  35. Kundu, P.; Mathivha, F.; Nkuna, T. The Use of GIS and Remote Sensing Techniques to Evaluate the Impact of Land Use and Land Cover Change on the Hydrology of Luvuvhu River Catchment in Limpopo Province; WRC Report No. 2246/1/15; Water Research Commission: Pretoria, South Africa, 2015; ISBN 978-1-4312-0705-3. [Google Scholar]
  36. Mpandeli, S.; Nesamvuni, E.; Maponya, P. Adapting to the impacts of drought by smallholder farmers in Sekhukhune District in Limpopo Province, South Africa. J. Agric. Sci. 2015, 7, 115. [Google Scholar] [CrossRef]
  37. Odiyo, J.O.; Makungo, R.; Nkuna, T.R. Long-term changes and variability in rainfall and streamflow in Luvuvhu River Catchment, South Africa. S. Afr. J. Sci. 2015, 111, 1–9. [Google Scholar] [CrossRef]
  38. Masupha, E.T. Drought Analysis with Reference to Rain-Fed Maize for Past and Future Climate Conditions over the Luvuvhu River Catchment in South Africa. Ph.D. Thesis, University of South Africa, Pretoria, South Africa, 2017. [Google Scholar]
  39. McKee, T.B.; Doesken, N.J.; Kleist, J. The relationship of drought frequency and duration to time scales. In Proceedings of the 8th Conference on Applied Climatology, Anaheim, CA, USA, 17–22 January 1993; pp. 179–183. [Google Scholar]
  40. Zambrano, F.; Lillo-Saavedra, M.; Verebist, K.; Lagos, O. Sixteen years of agricultural drought assessment of the BioBío region in Chile using a 250 m resolution Vegetation Condition Index (VCI). Remote Sens. 2016, 8, 530. [Google Scholar] [CrossRef] [Green Version]
  41. Shah, R.; Bharadiya, N.; Manekar, V. Drought index computation using standardized precipitation index (SPI) method for Surat District, Gujarat. Aquat. Procedia 2015, 4, 1243–1249. [Google Scholar] [CrossRef]
  42. Kogan, F.N. Remote sensing of weather impacts on vegetation in non-homogeneous areas. Int. J. Remote Sens. 1990, 11, 1405–1419; [Google Scholar] [CrossRef]
  43. Munyati, C.; Kabanda, T.A. Using multitemporal Landsat TM imagery to establish land use pressure induced trends in forest and woodland cover in sections of the Soutpansberg Mountains of Venda region, Limpopo Province, South Africa. Reg. Environ. Chang. 2009, 9, 41–56. [Google Scholar] [CrossRef]
  44. Quiring, S.M.; Ganesh, S. Evaluating the utility of the Vegetation Condition Index (VCI) for monitoring meteorological drought in Texas. Agric. For. Meteorol. 2010, 150, 330–339. [Google Scholar] [CrossRef]
  45. Dutta, D.; Kundu, A.; Patel, N.; Saha, S.; Siddiqui, A. Assessment of agricultural drought in Rajasthan (India) using remote sensing derived Vegetation Condition Index (VCI) and Standardized Precipitation Index (SPI). Egypt. J. Remote Sens. Space Sci. 2015, 18, 53–63. [Google Scholar] [CrossRef] [Green Version]
  46. Codjoe, S.N.A.; Owusu, G. Climate change/variability and food systems: Evidence from the Afram Plains, Ghana. Regional. Environ. Chang. 2011, 11, 753–765. [Google Scholar] [CrossRef]
  47. Kogan, F.; Guo, W.; Yang, W. Drought and food security prediction from NOAA new generation of operational satellites. Geomat. Nat. Hazards Risk 2019, 10, 651–666. [Google Scholar] [CrossRef] [Green Version]
  48. Mkuhlani, S.; Mupangwa, W.; Nyagumbo, I. Maize yields in varying rainfall regimes and cropping systems across Southern Africa: A modelling assessment. In University Initiatives in Climate Change Mitigation and Adaptation; Filho, W.L., Leal-Arcas, R., Eds.; Springer: Cham, Switzerland, 2019; pp. 203–228. [Google Scholar]
  49. Barbieri, A.; Fertonani, D.; Phluido Inc. Baseband Unit with Adaptive Fronthaul Link for a Distributed Radio Access Network. U.S. Patent 10,355,895, 1 March 2019. [Google Scholar]
  50. Masipa, T.S. The impact of climate change on food security in South Africa: Current realities and challenges ahead. Jàmbá 2017, 9, 1–7. [Google Scholar] [CrossRef] [Green Version]
  51. Monyela, B.M. A Two-Year Long Drought in Summer 2014/2015 and 2015/2016 over South Africa. Master’s Thesis, University of Cape Town, Cape Town, South Africa, 2017. [Google Scholar]
  52. Rimkus, E.; Stonevicius, E.; Kilpys, J.; Maciulyte, V.; Valiukas, D. Drought identification in the Eastern Baltic region using NDVI. Earth Syst. Dynam. 2017, 8, 627. [Google Scholar] [CrossRef] [Green Version]
  53. Lane, C.R.; Liu, H.; Autry, B.C.; Anenkhonov, O.A.; Chepinoga, V.V.; Wu, Q. Improved wetland classification using eight-band high resolution satellite imagery and a hybrid approach. Remote Sens. 2014, 6, 12187–12216. [Google Scholar] [CrossRef] [Green Version]
  54. Pei, F.; Wu, C.; Liu, X.; Li, X.; Yang, K.; Zhou, Y.; Wang, K.; Xu, L.; Xia, G. Monitoring the vegetation activity in China using vegetation health indices. Agric. For. Meteorol. 2018, 248, 215–227. [Google Scholar] [CrossRef]
  55. Khosravi, I.; Safari, A.; Homayouni, S. Separability analysis of multifrequency SAR polarimetric features for land cover classification. Remote Sens. Lett. 2017, 8, 1152–1161. [Google Scholar] [CrossRef]
  56. Muthumanickam, D.; Kannan, P.; Kumaraperumal, R.; Natarajan, S.; Sivasamy, R.; Poongodi, C. Drought assessment and monitoring through remote sensing and GIS in western tracts of Tamil Nadu, India. Int. J. Remote Sens. 2011, 32, 5157–5176. [Google Scholar] [CrossRef]
  57. Department of Economic Development, Environment and Tourism (DEDET). Climate Support Programme (CSP)—Climate Change Adaptation Strategies. Limpopo Provincial Government, South Africa, 2015. Available online: http://www.ledet.gov.za/wp-content/uploads/2015/10/Limpopo-Climate-Adaptation-Strategy-Report-REVISED.pdf (accessed on 23 March 2021).
  58. Edossa, D.C.; Woyessa, Y.E.; Welderufael, W.A. Analysis of droughts in the central region of South Africa and their association with SST anomalies. Int. J. Atmosp. Sci. 2014, 508953. [Google Scholar] [CrossRef] [Green Version]
  59. Rouault, M.; Richard, Y. Intensity and spatial extension of drought in South Africa at different time scales. Water SA 2003, 29, 489–500. [Google Scholar] [CrossRef] [Green Version]
  60. Jiao, W.; Zhang, L.; Chang, Q.; Fu, D.; Cen, Y.; Tong, Q. Evaluating an enhanced vegetation condition index (VCI) based on VIUPD for drought monitoring in the continental United States. Remote Sens. 2016, 8, 224. [Google Scholar] [CrossRef] [Green Version]
  61. Wetterhall, F.; Winsmius, H.C.; Dutra, E.; Werner, M.; Pappenberger, F. Seasonal predictions of agro-meteorological drought indicators for the Limpopo basin. Hydrol. Earth Syst. Sci. 2015, 19, 2577–2586. [Google Scholar] [CrossRef] [Green Version]
  62. Elbasit, M.A.A.; Adam, E.O.; Abu-Talib, K.; Ahmed, F.; Yashuda, H.; Ojha, C. Validation of satellite-based rainfall measurements in arid and semi-arid regions of Sudan. Nile Water Sci. Eng. J. 2014, 7, 78–85. [Google Scholar]
  63. Kefi, M.; Pham, T.D.; Kashiwagi, K.; Yoshino, K. Identification of irrigated olive growing farms using remote sensing techniques. Euro-Mediterr. J. Environ. Integr. 2016, 1, 3. [Google Scholar] [CrossRef] [Green Version]
  64. Otto, M.; Höpfner, C.; Curio, J.; Maussion, F.; Scherer, D. Assessing vegetation response to precipitation in northwest Morocco during the last decade: An application of MODIS NDVI and high-resolution reanalysis data. Appl. Clim. 2016, 123, 23–41. [Google Scholar] [CrossRef]
  65. Mulugisi, A. The Impacts of Heavy Rains on the Vegetation Cover in the Limpopo Province of South Africa. Ph.D. Thesis, North-West University, Potchefstroom, South Africa, 2015. [Google Scholar]
  66. Ntombela, S.; Nyhodo, B.; Ngqangweni, S.; Phahlane, H.; Lubinga, M. Economy-wide effects of drought on South African Agriculture: A computable general equilibrium (CGE) analysis. J. Dev. Agric. Econ. 2017, 9, 46–56. [Google Scholar]
Figure 1. Location of the Study Area: Luvuvhu Catchment Area of South Africa.
Land 10 00527 g001
Figure 2. Mean SPI_3 in in the LRCA for the 1980–2016 period.
Land 10 00527 g002
Figure 3. Spatial and temporal pattern of SPI_3, NDVI and VCI during the dry seasons at different croplands.
Land 10 00527 g003aLand 10 00527 g003b
Figure 4. Spatiotemporal variation of NDVI in different croplands for the period 1991 to 2015 in LRCA.
Land 10 00527 g004
Figure 5. Relationship between SPI and VCI on different land usages.
Land 10 00527 g005aLand 10 00527 g005b
Table 1. Drought classification scheme of SPI and VCI.
Drought Classes SPI VCI
Extreme SPI< −2.00VCI< 10
Severe−2.0SPI< −1.510VCI< 20
Moderate−1.5SPI< −1.020VCI30
Mild−1.0SPI< 0.030VCI40
No drought0.0SPI< 40< VCI100
Source: [9,37].
Publisher’s Note: MDPI stays neutral with regard to jurisdictional claims in published maps and institutional affiliations.

