
Radiation Effect of Urban Agglomeration’s Transportation Network: Evidence from Chengdu–Chongqing Urban Agglomeration, China

Abstract
1. Introduction
2. Literature Review
2.1. Urban Spatial Structure
2.2. UA Transportation
2.3. The Field Strength Model
2.4. UA Transportation Field
3. Model Development
3.1. Quantifying the Mass of Field Source
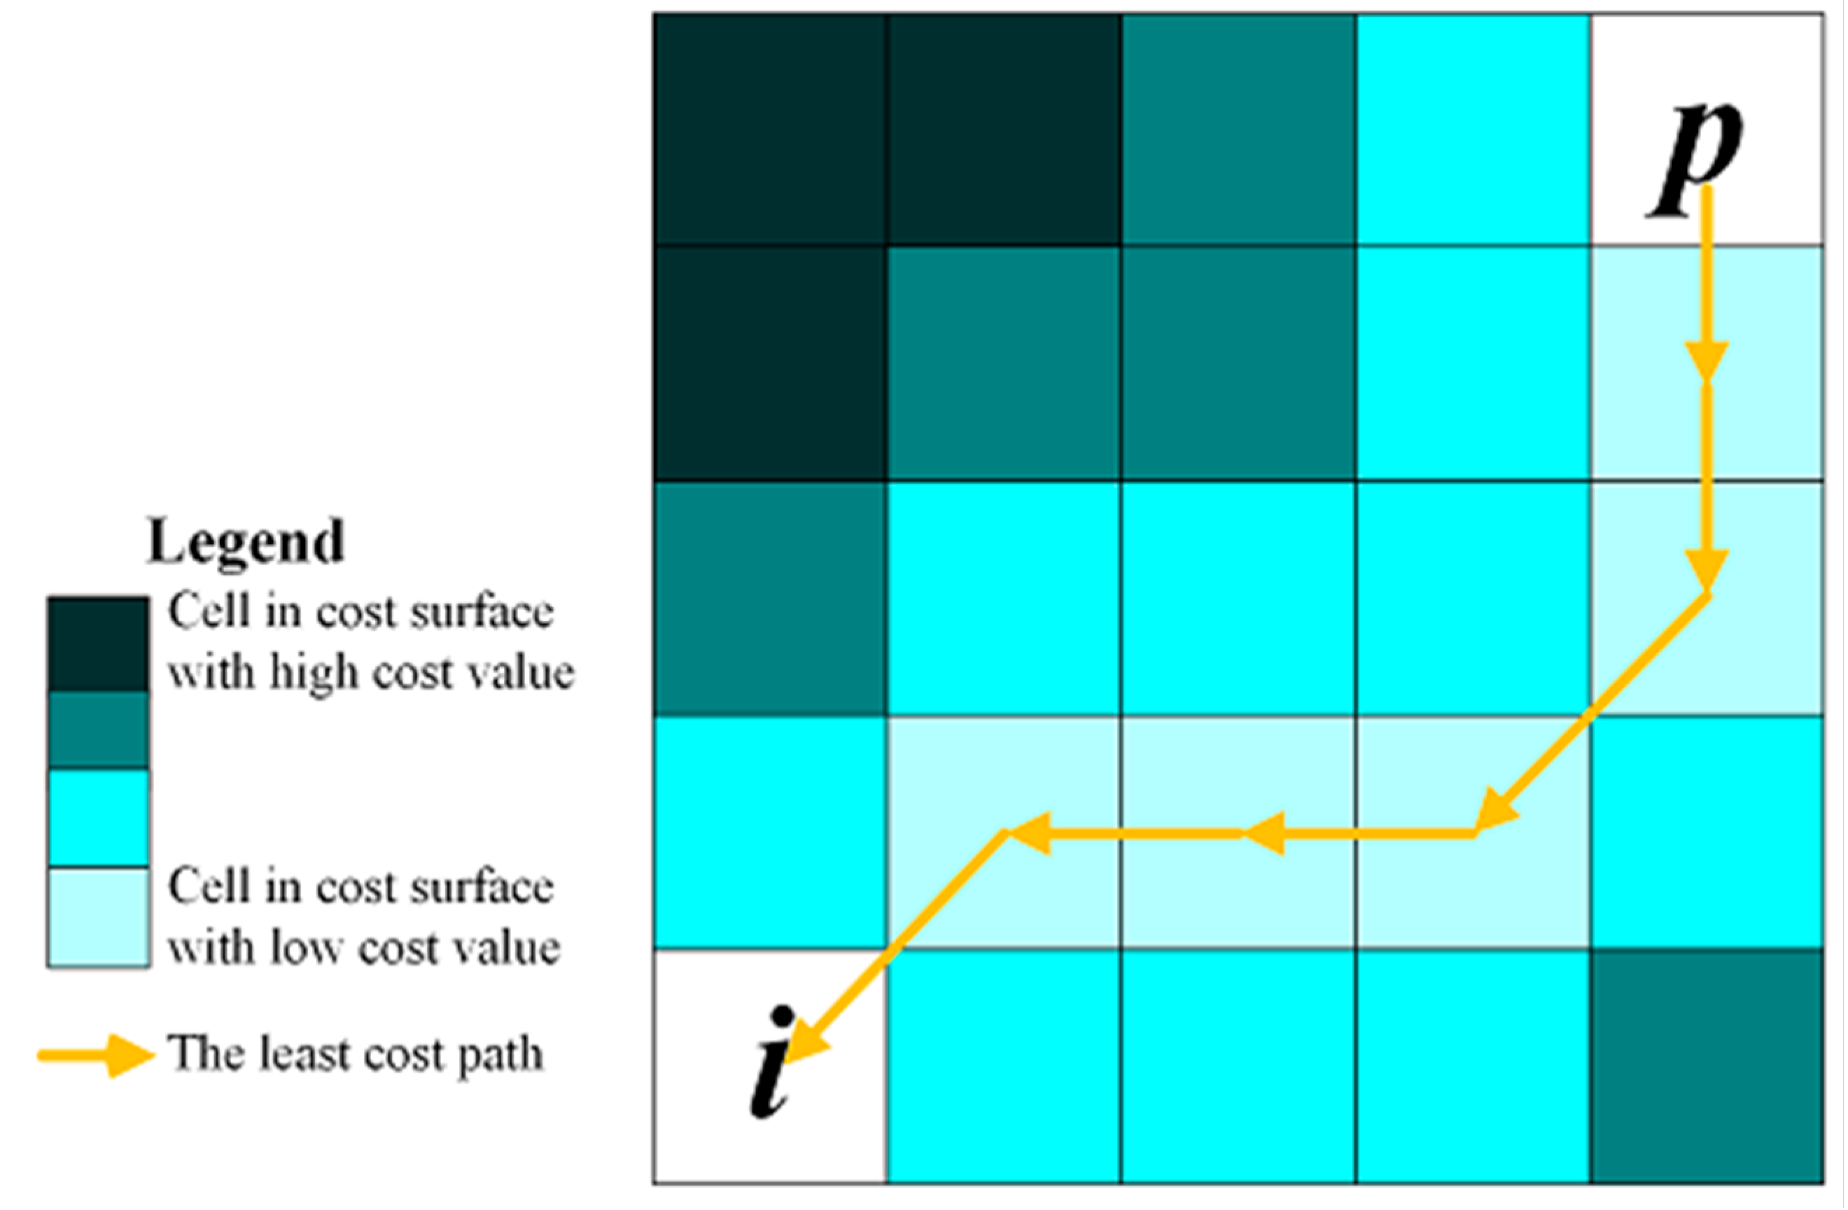
3.2. Measuring the Field Distance
3.3. Quantifying Radiation Sphere
4. Data
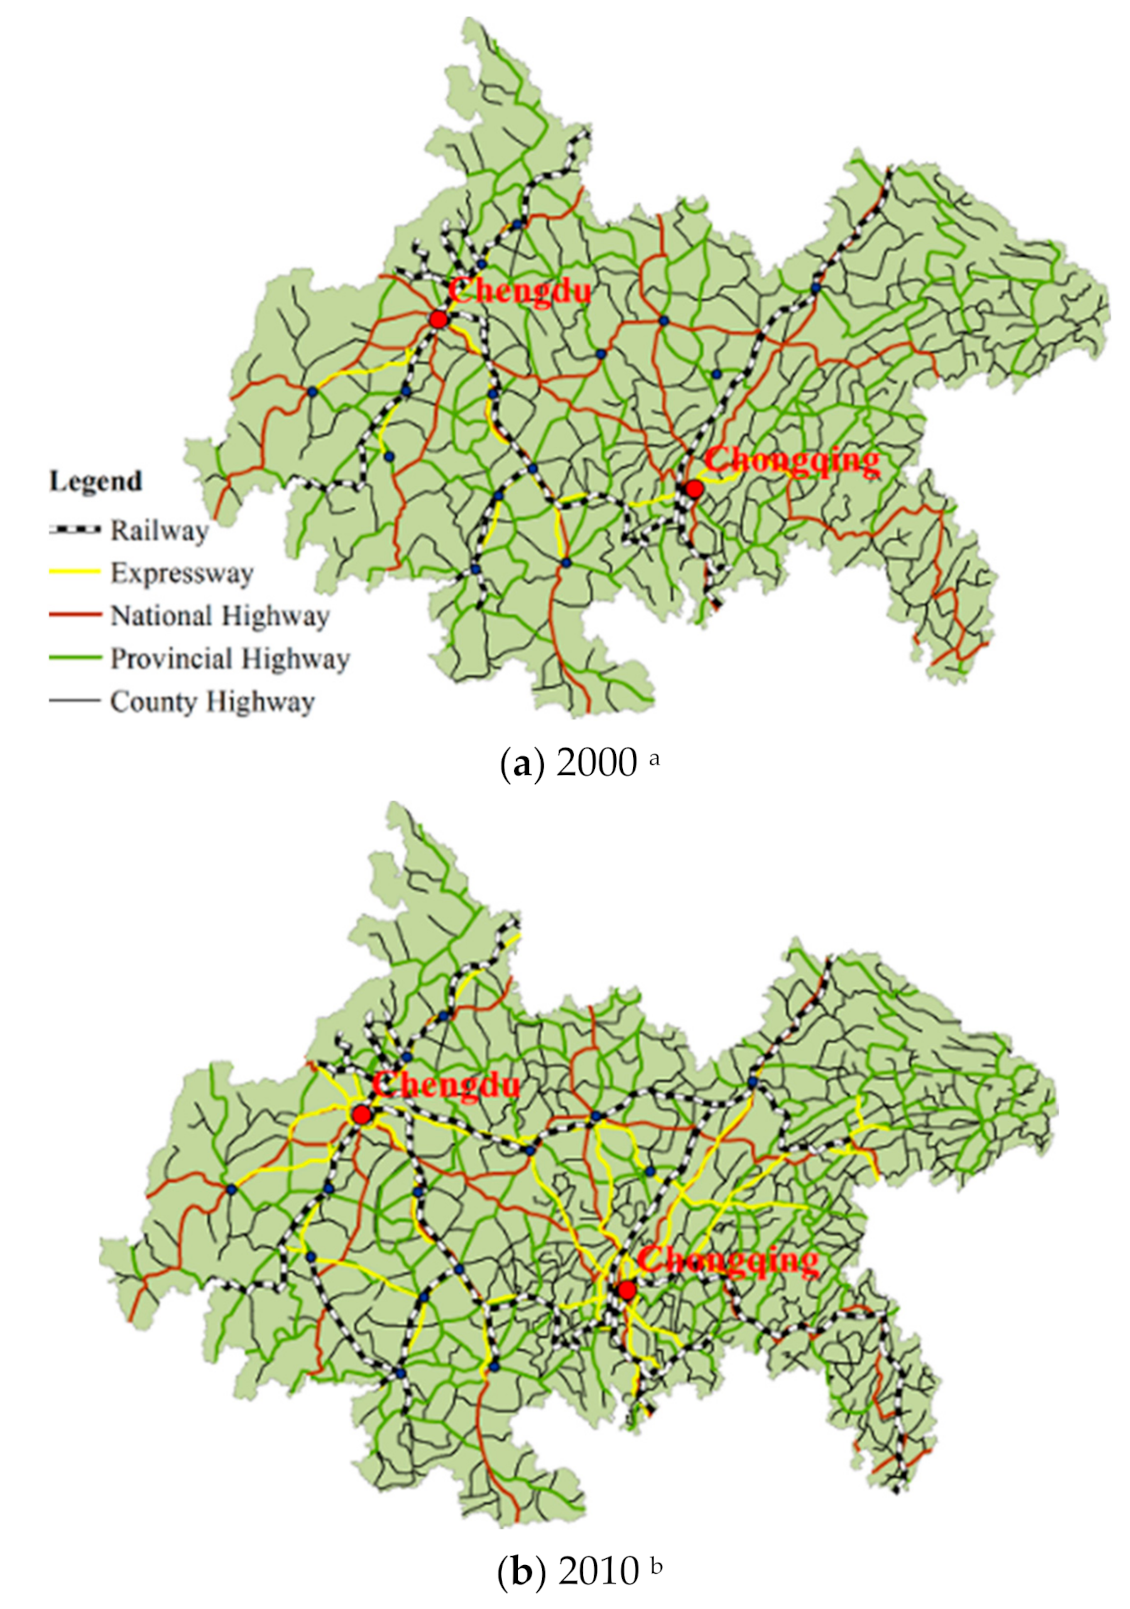
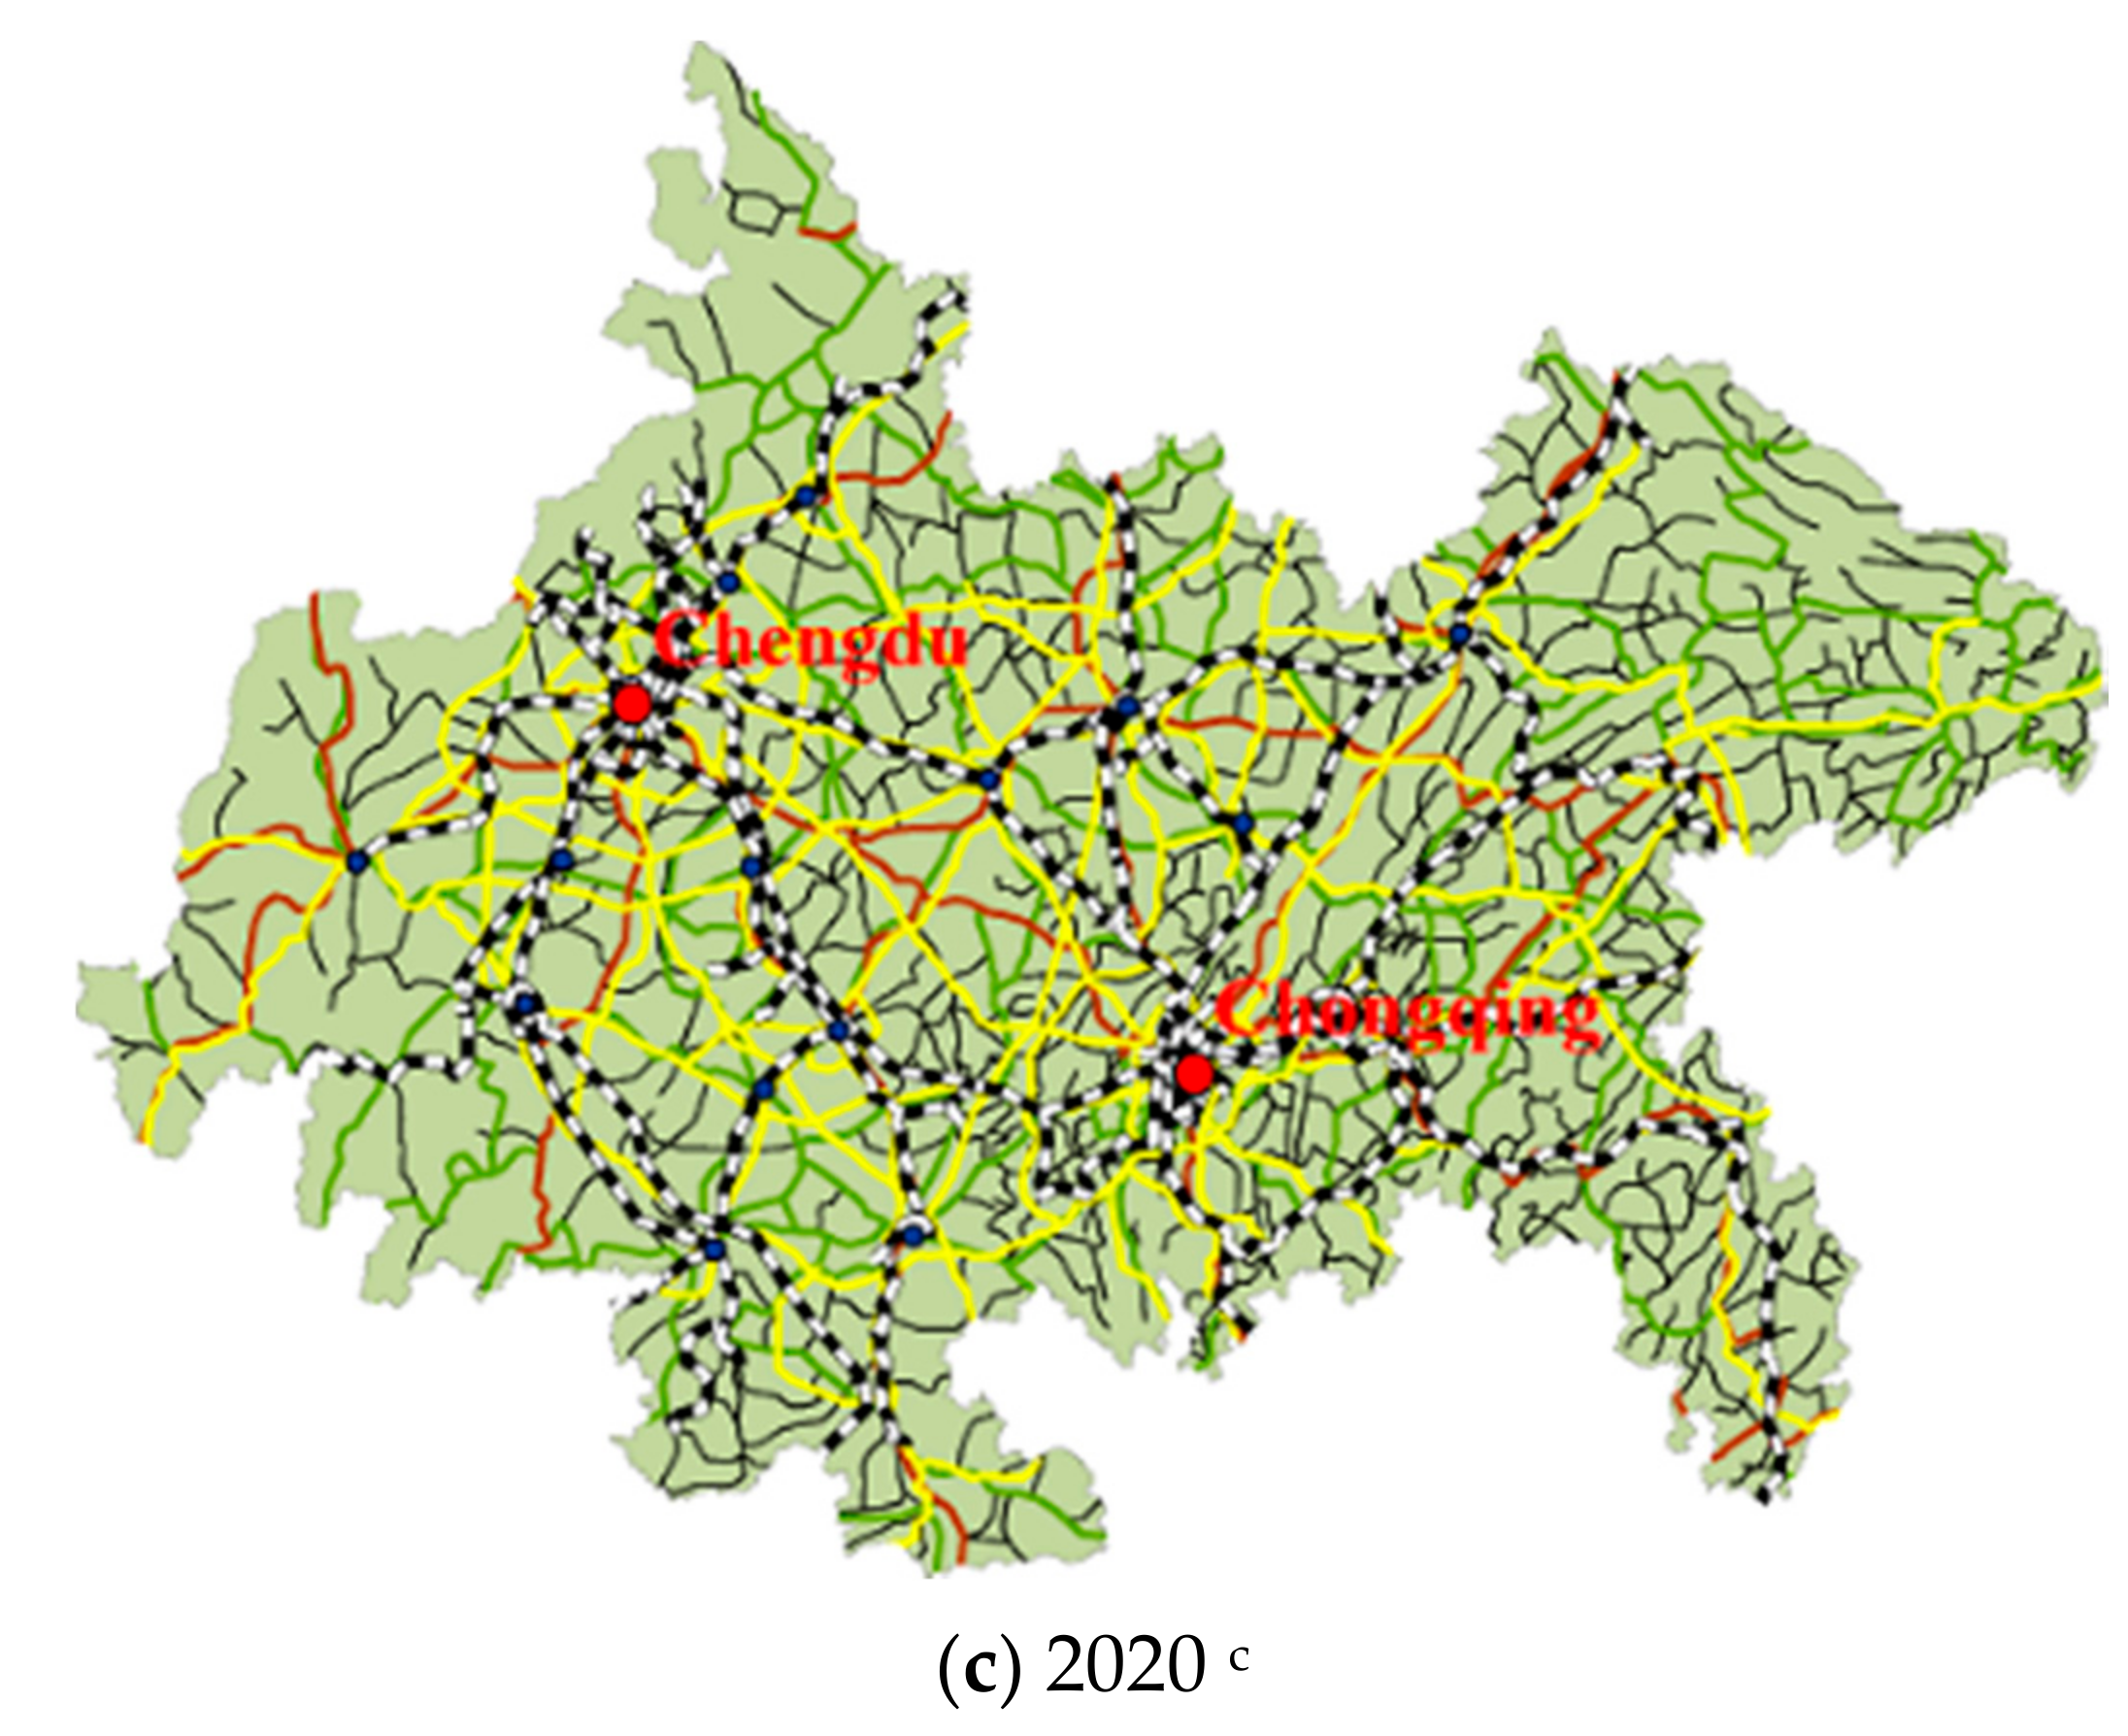
4.1. A Typical Case in China
4.2. Data Collection
5. Results of the Data Analysis
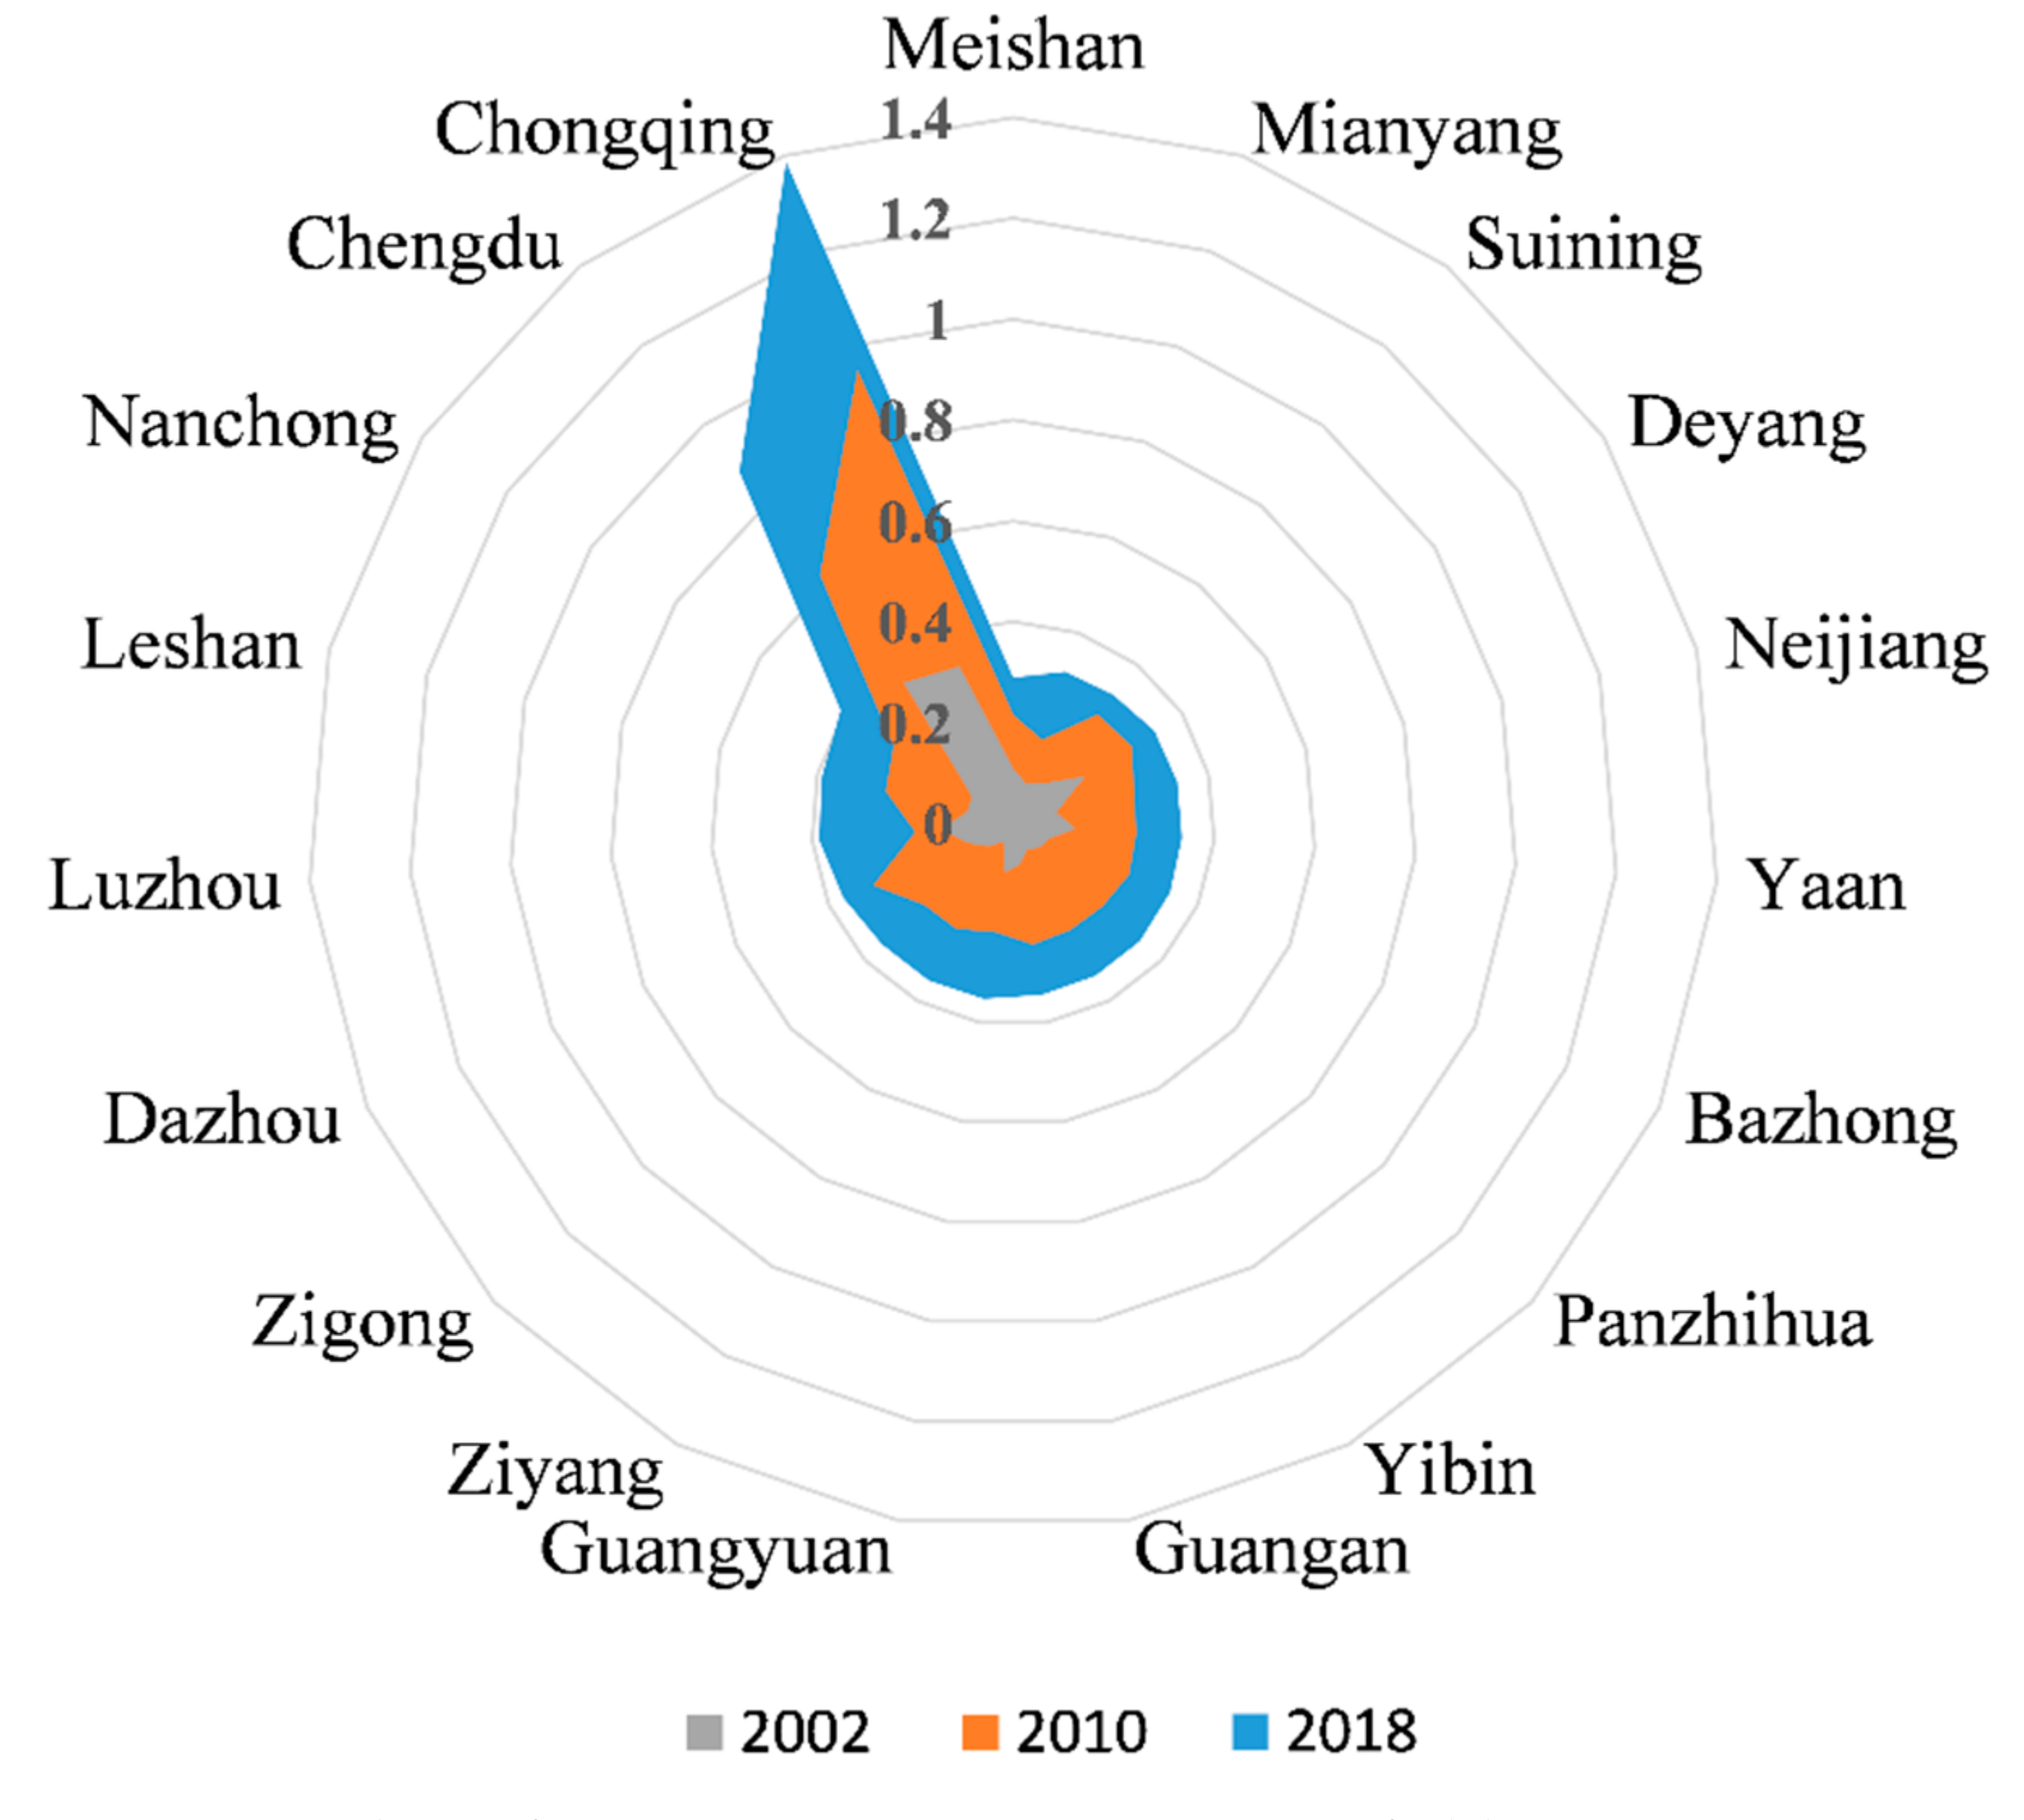
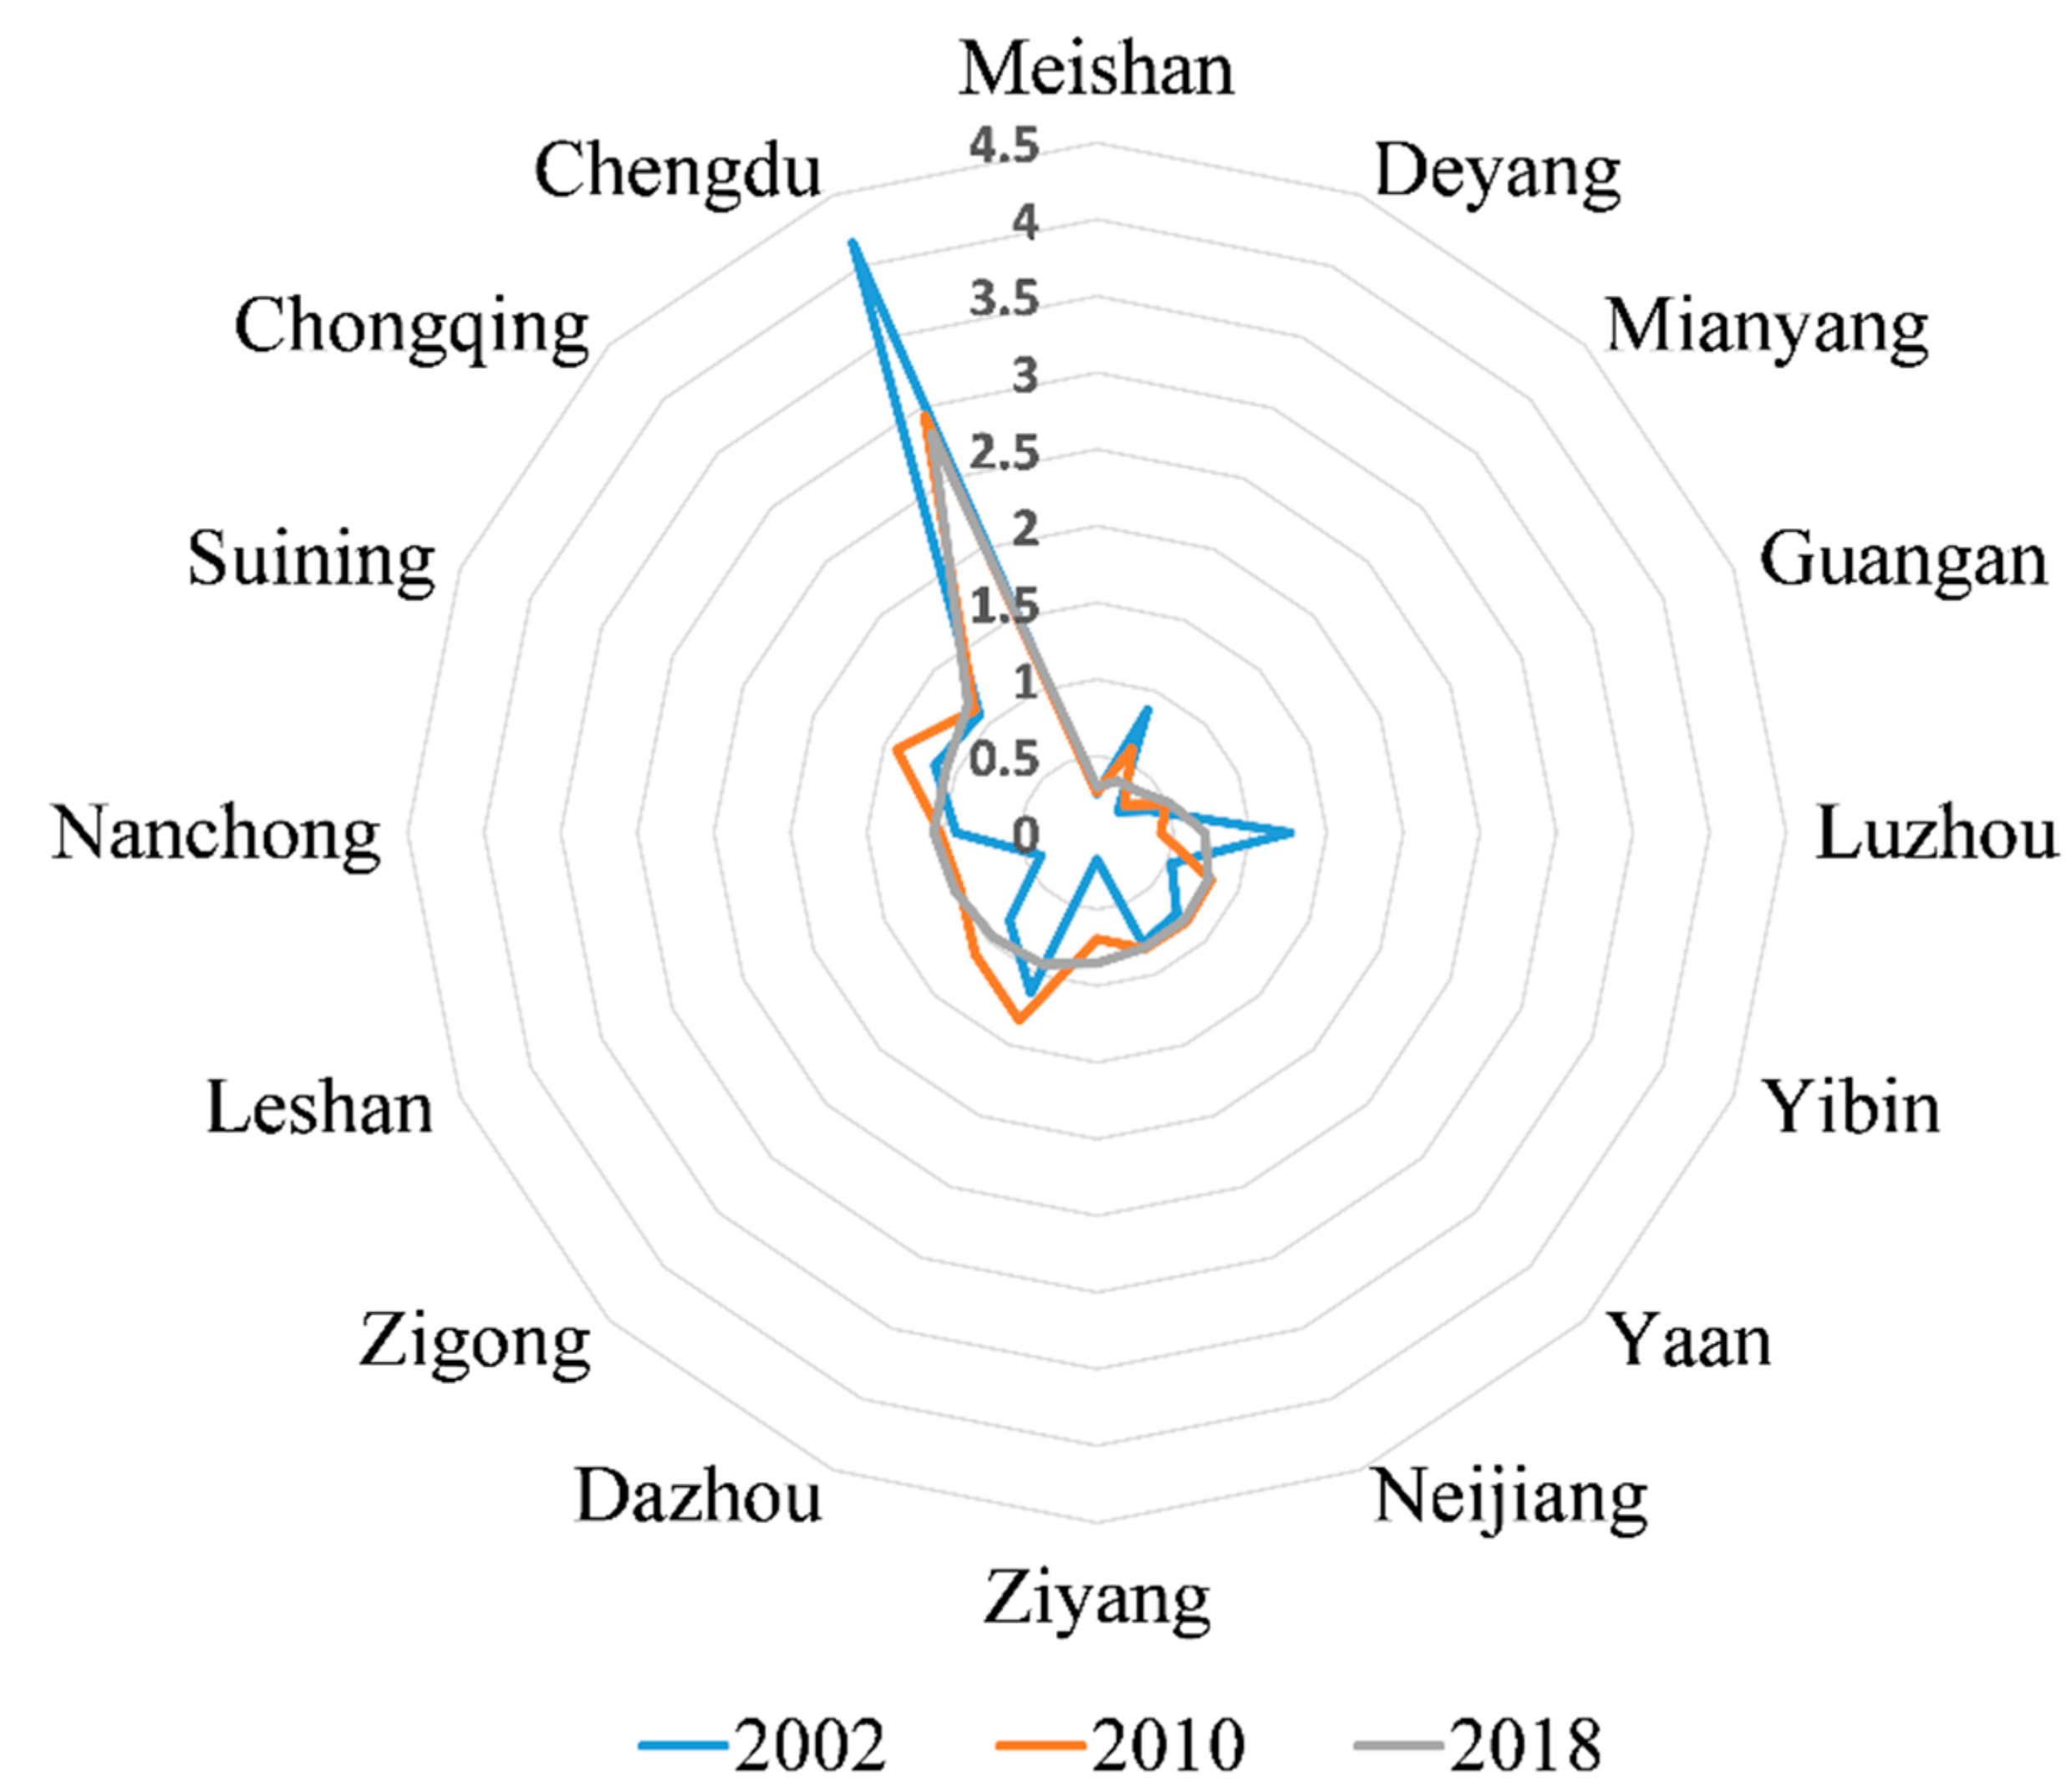
5.1. The Mass of Transportation Field Source
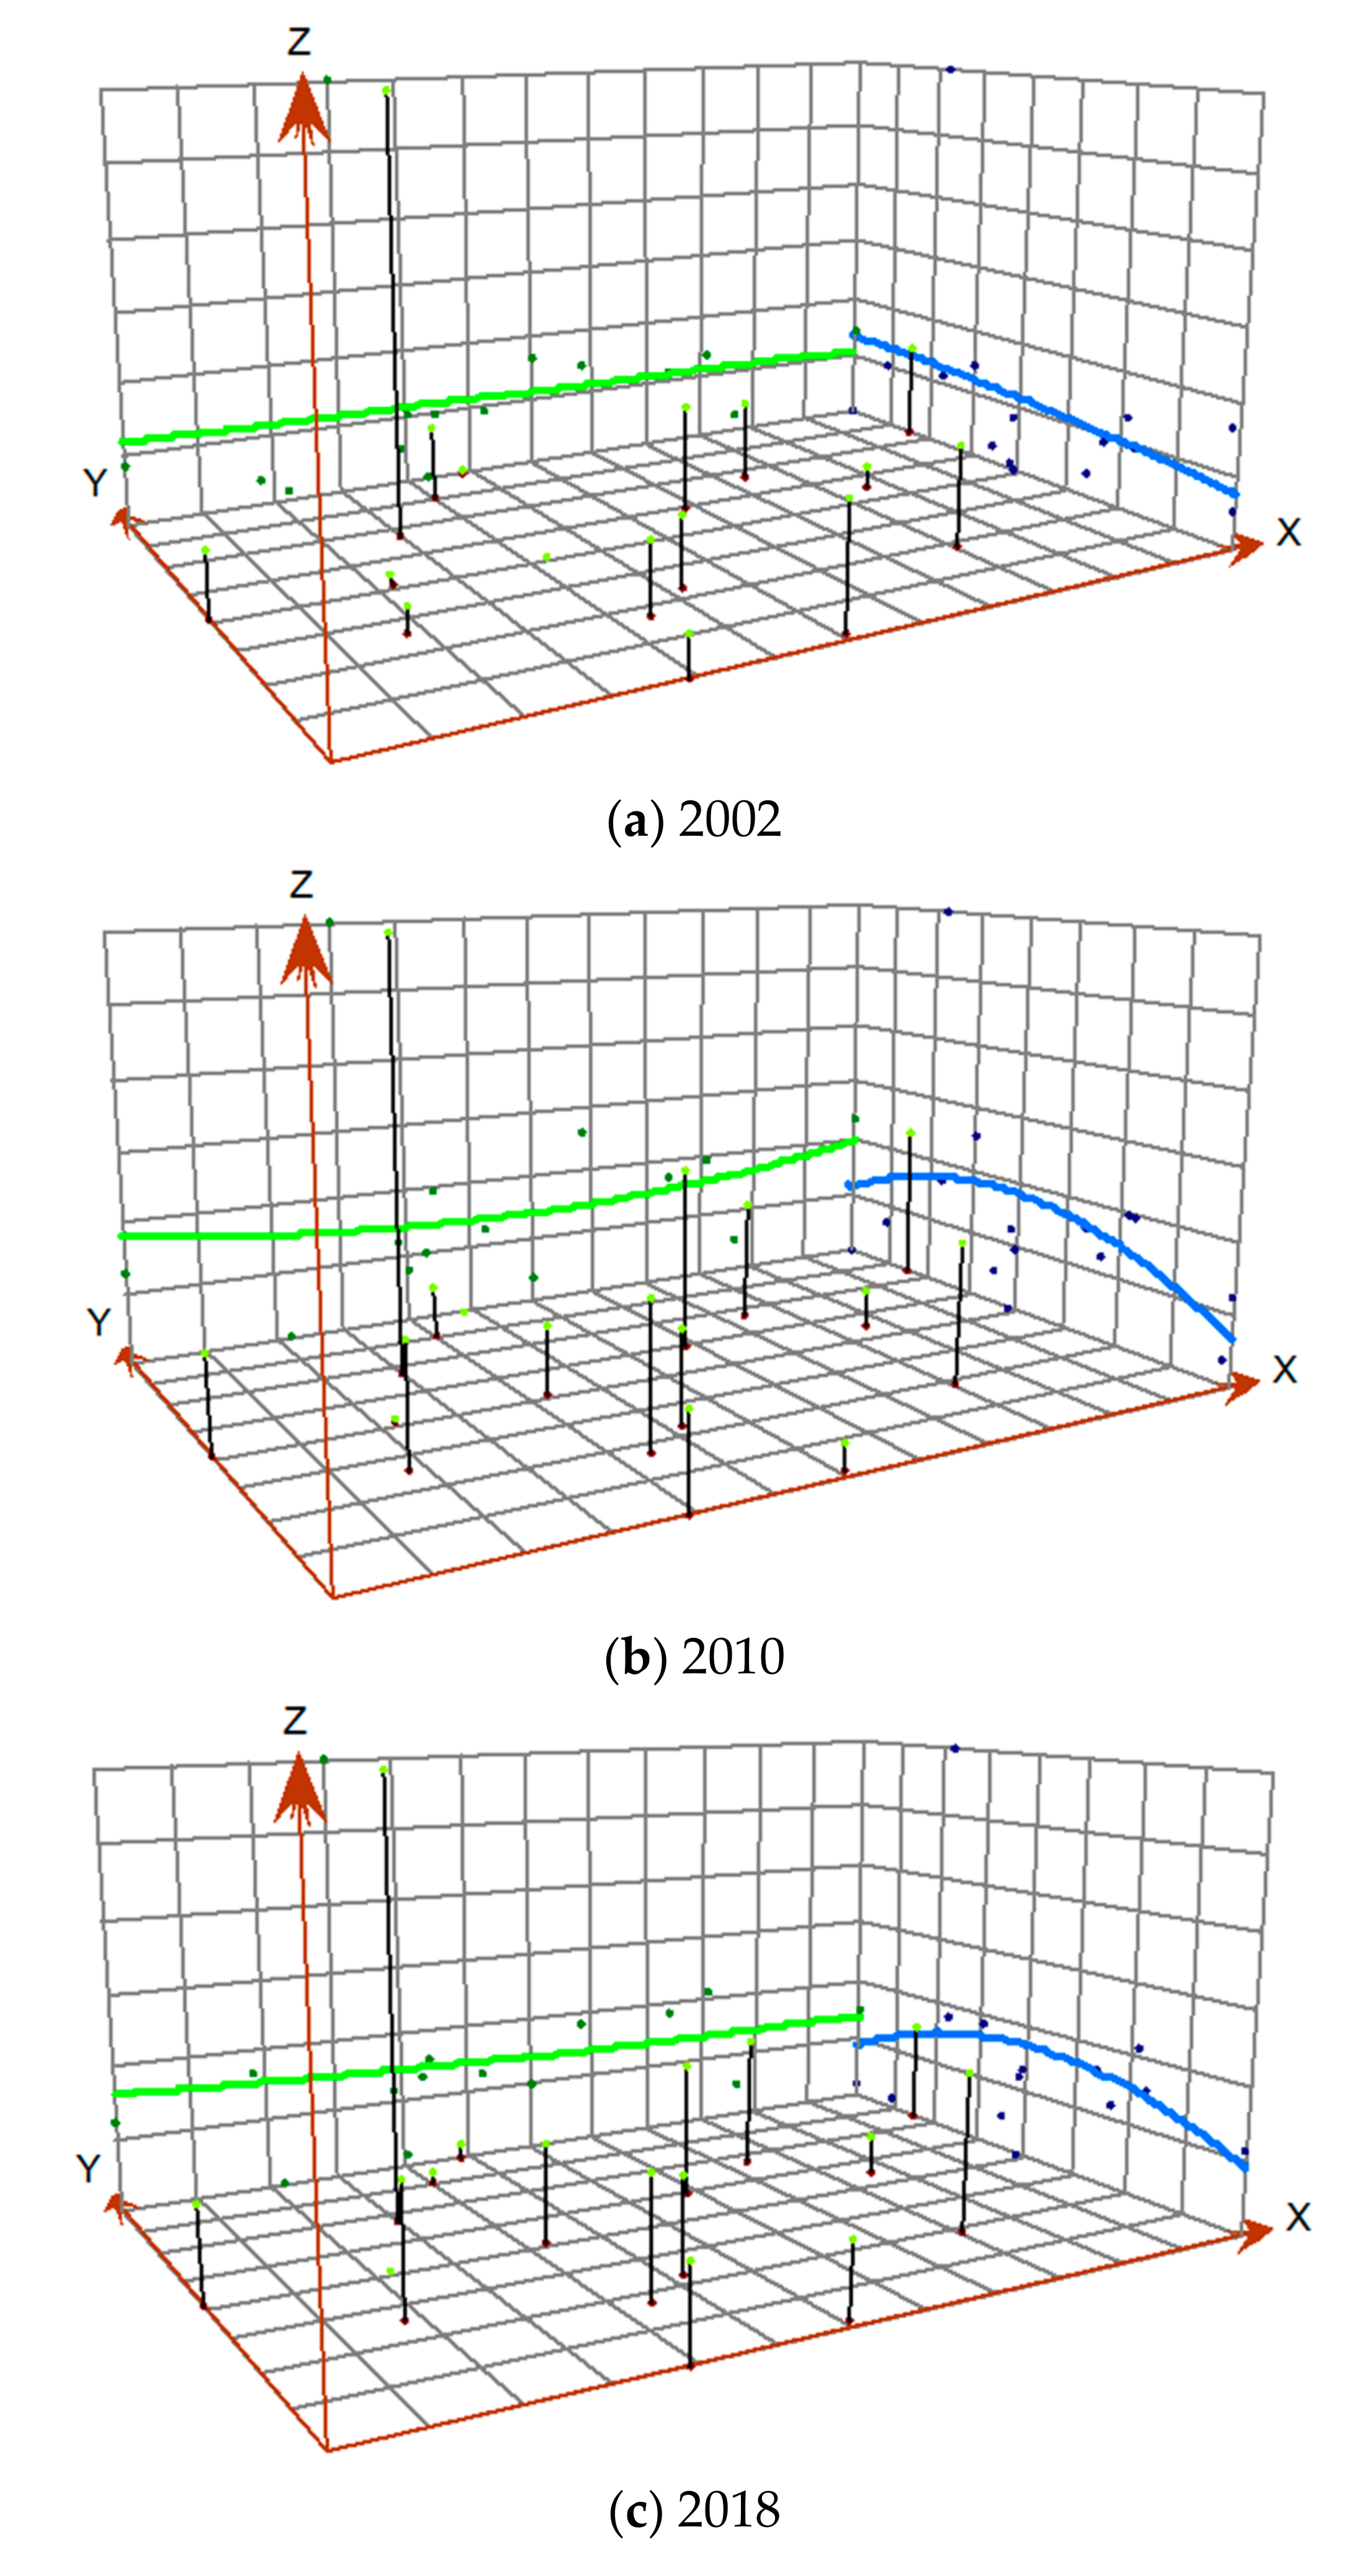
5.2. Field Distance
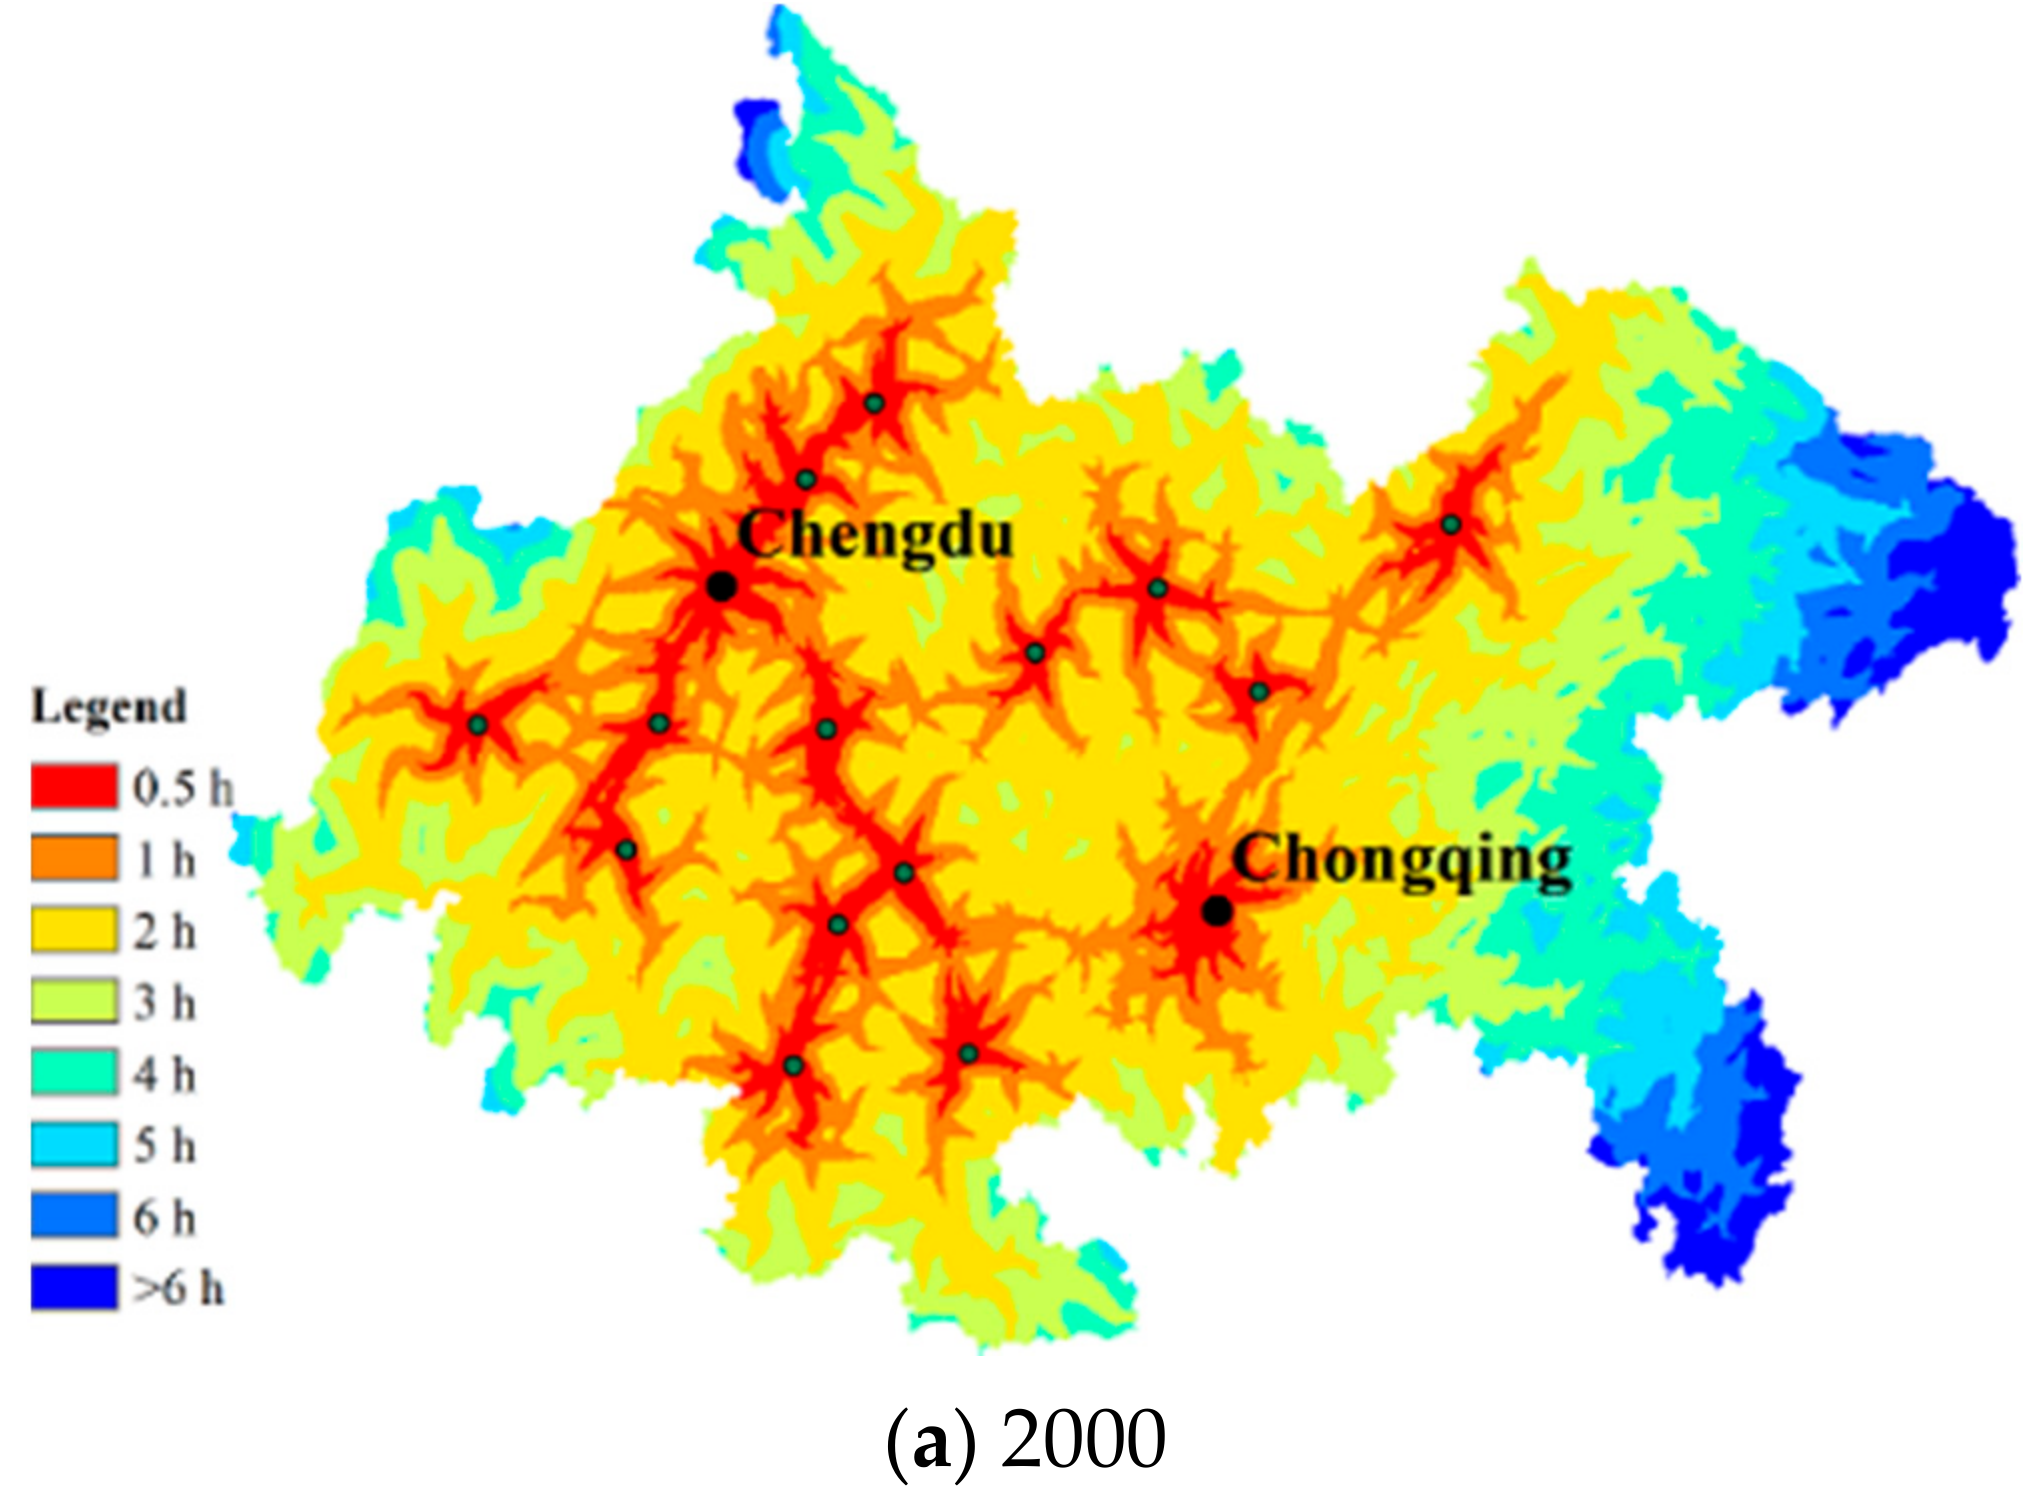
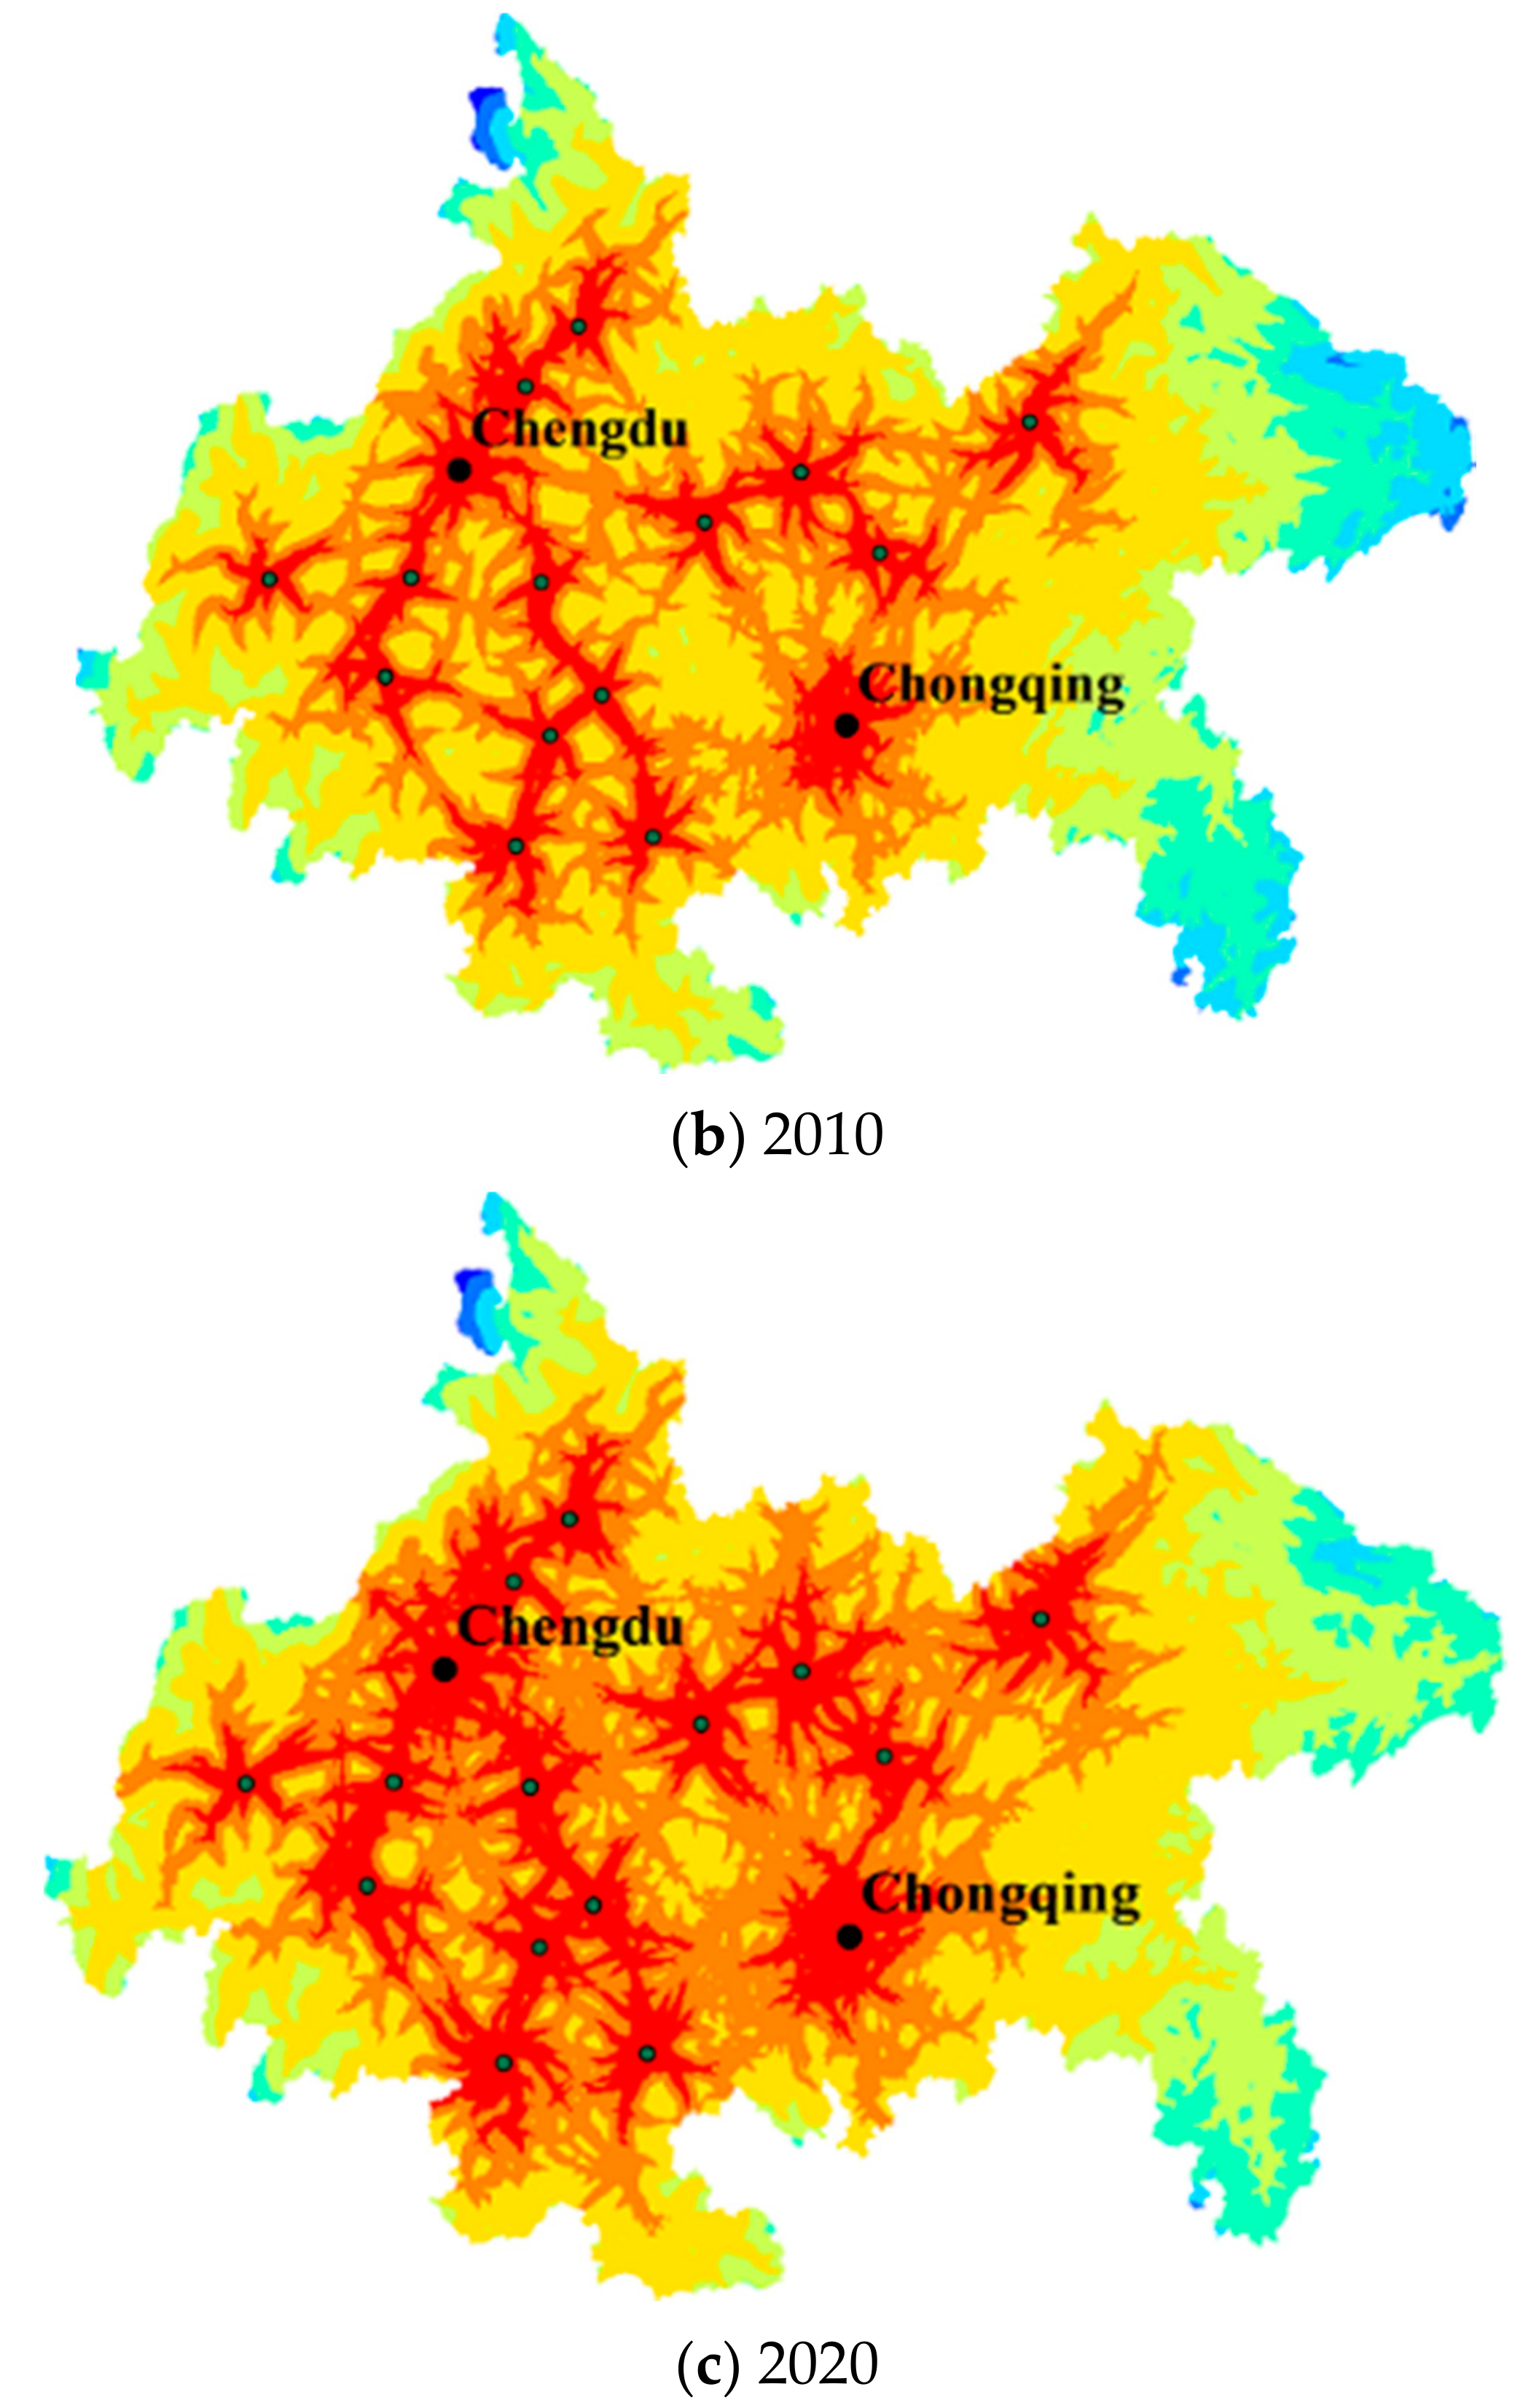
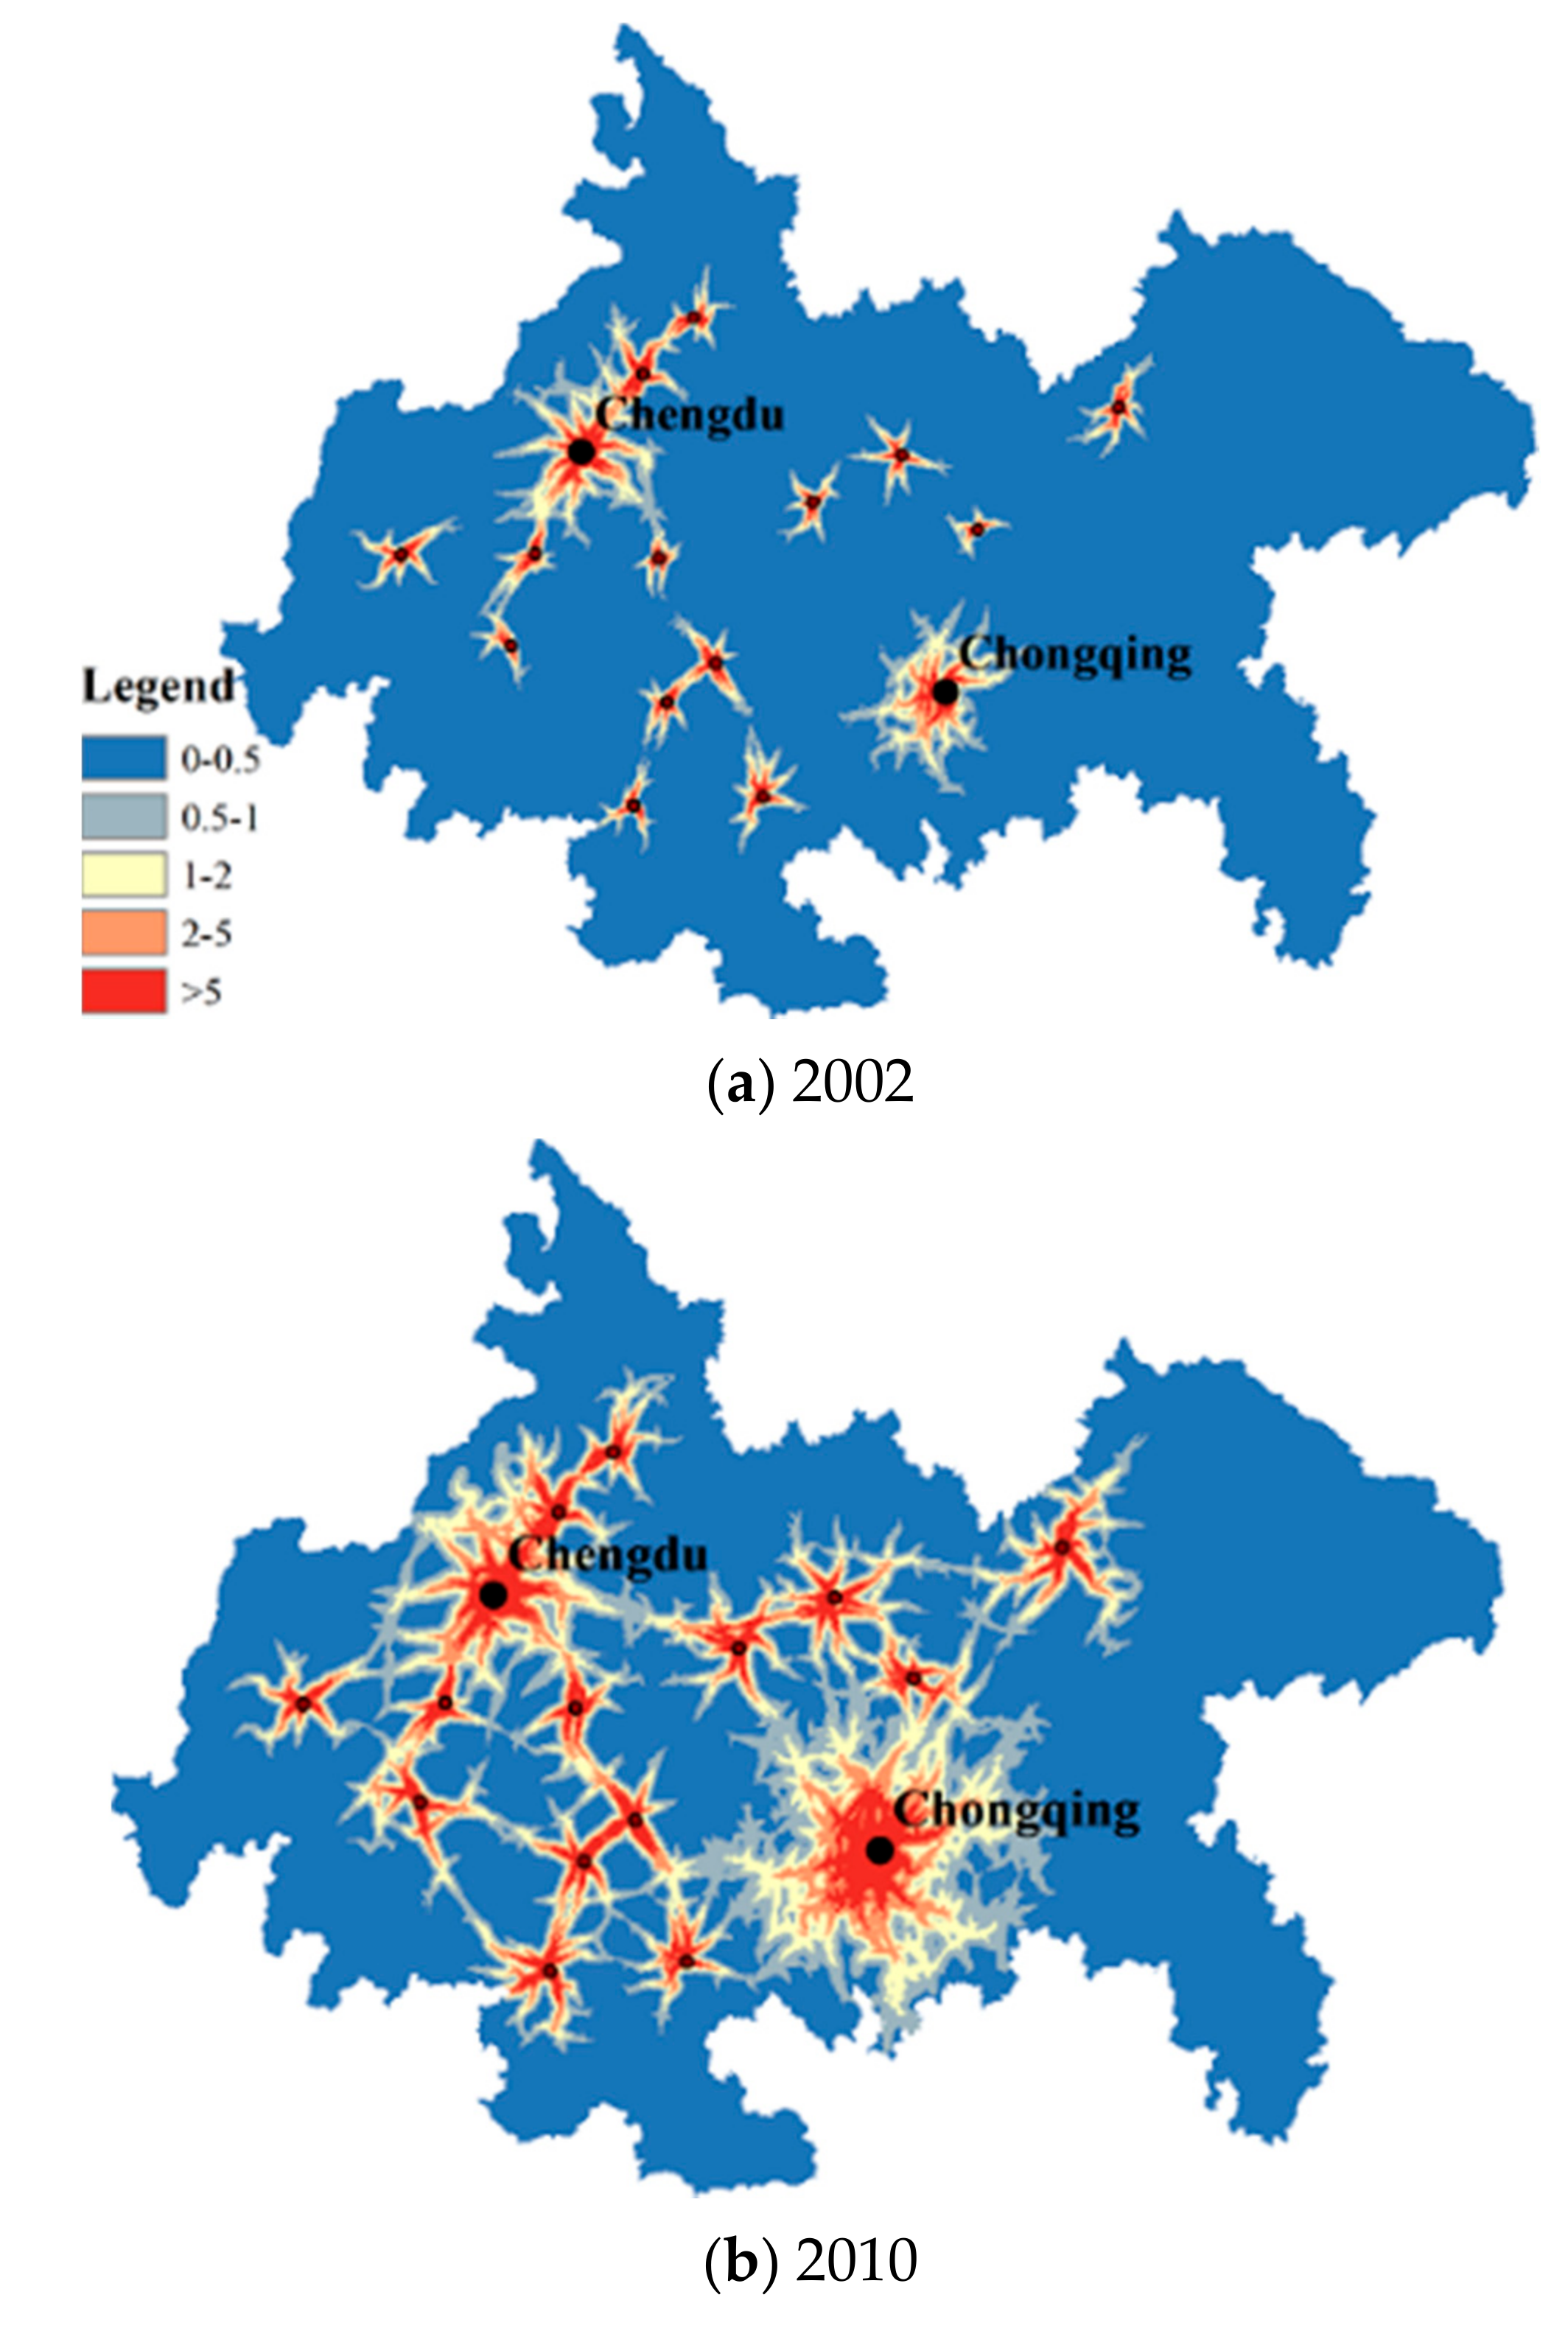
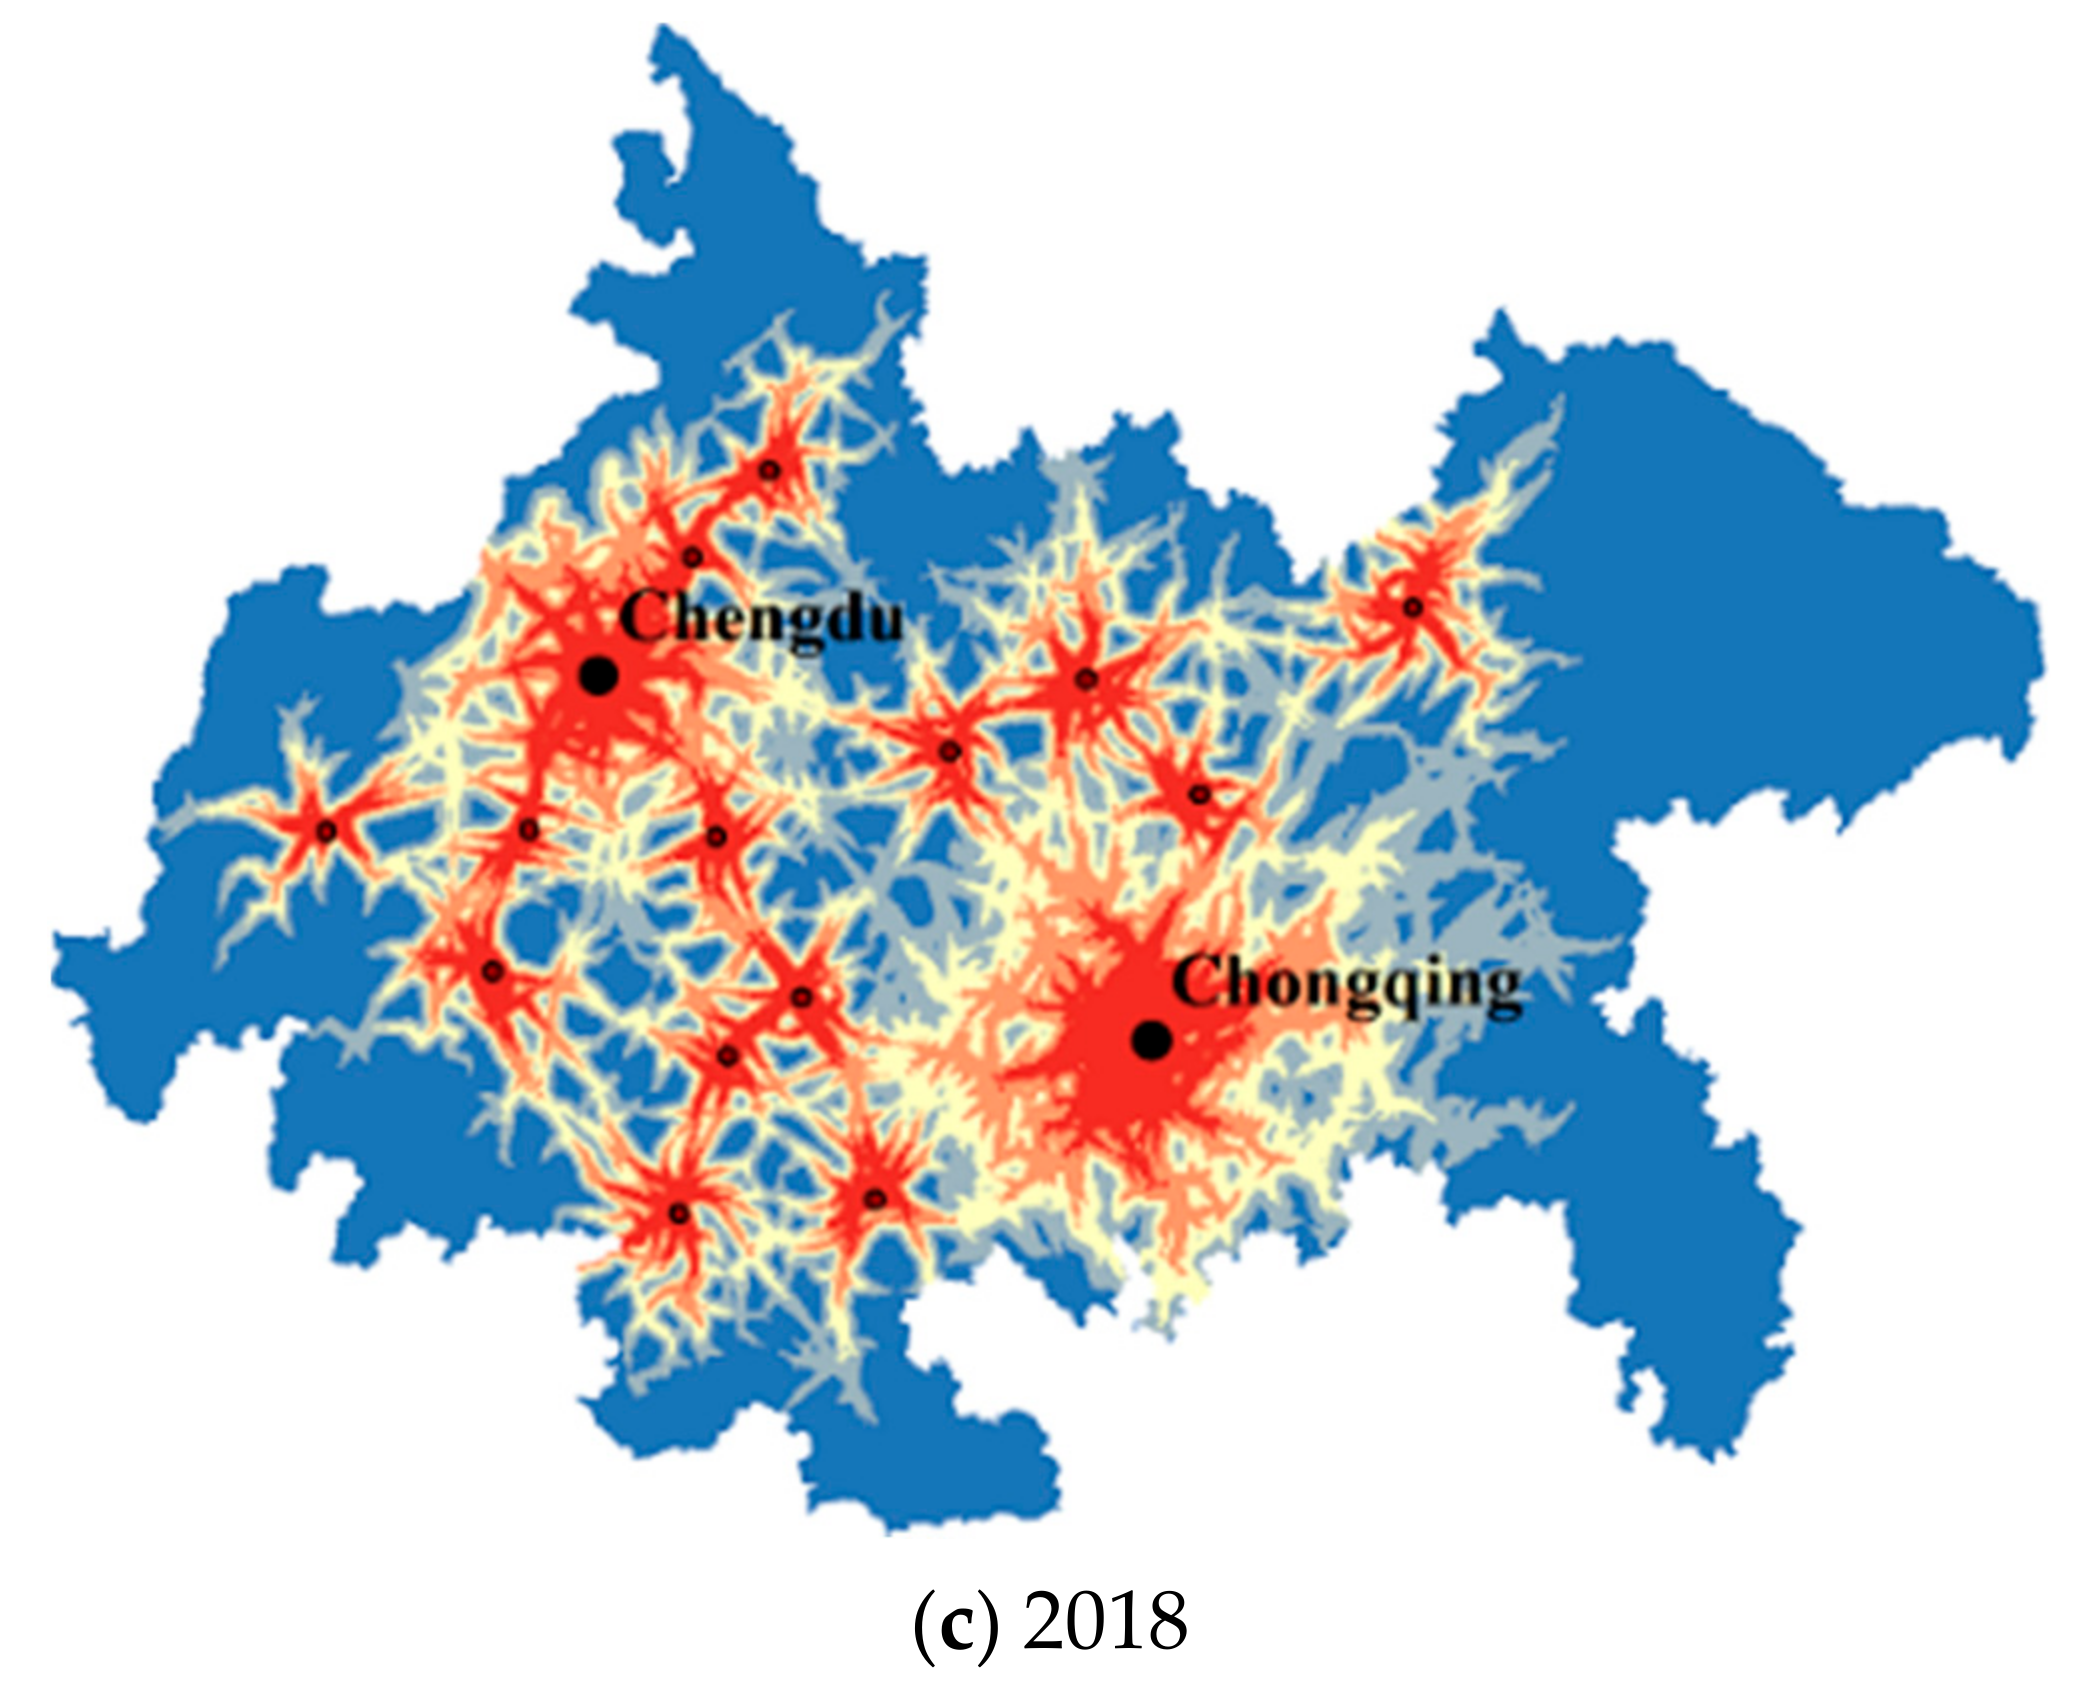
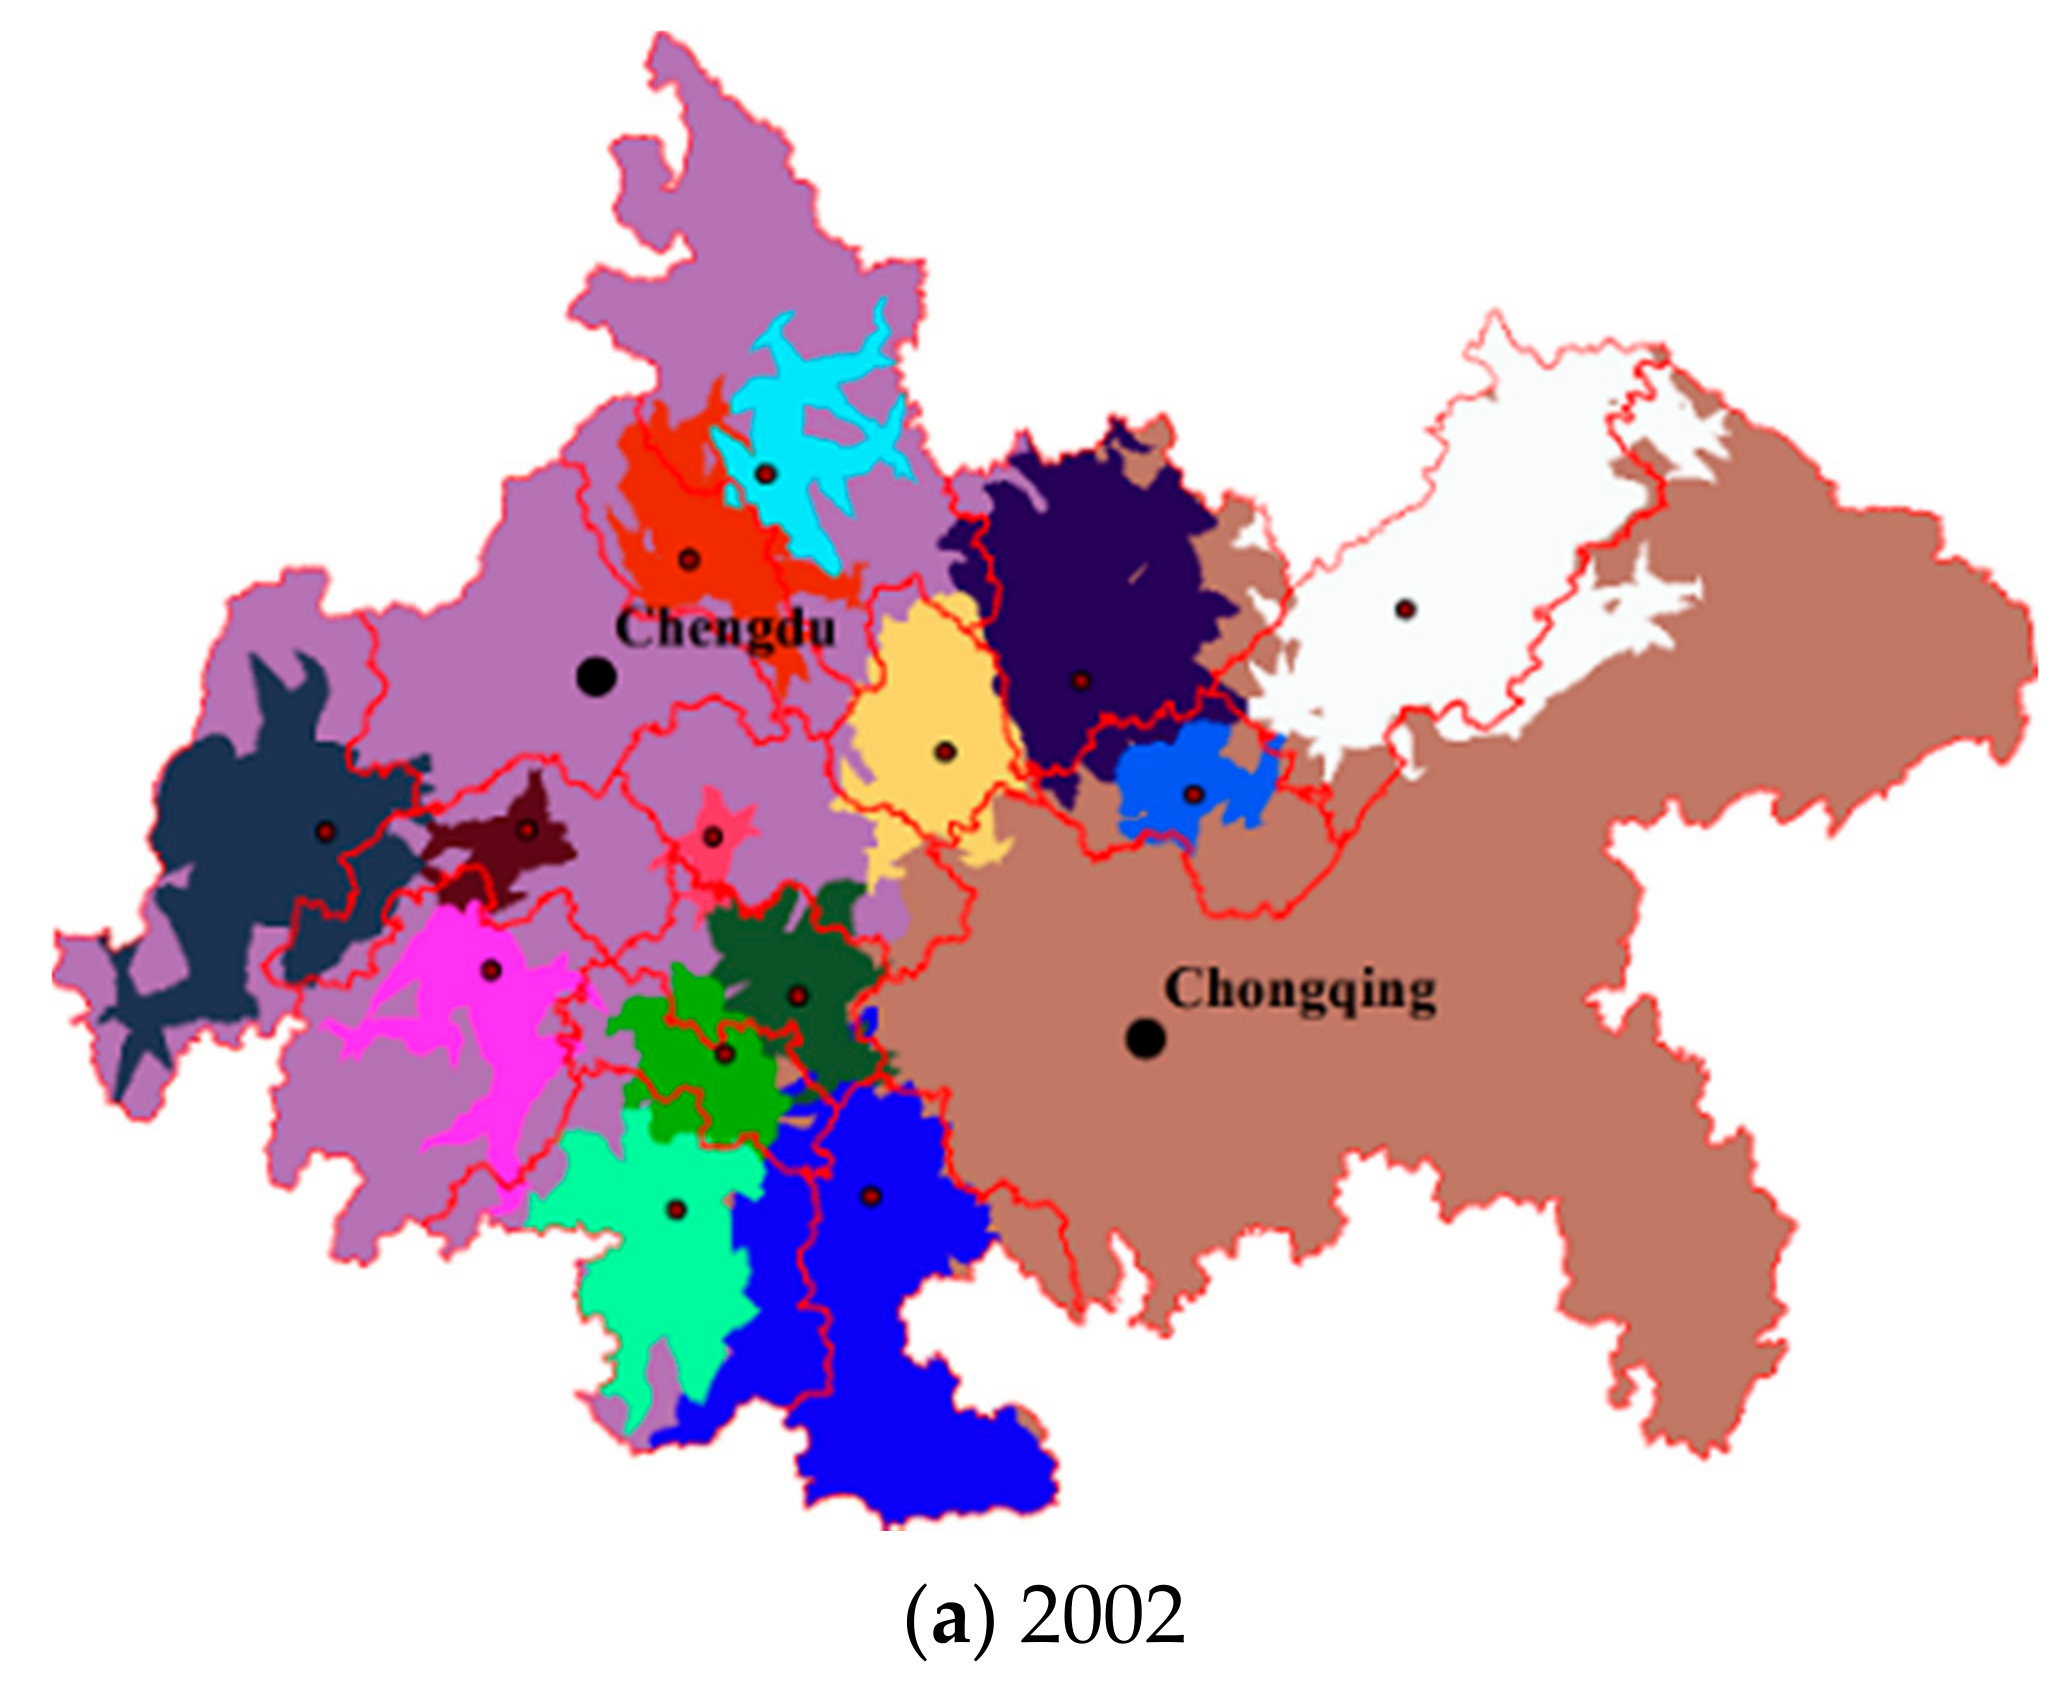
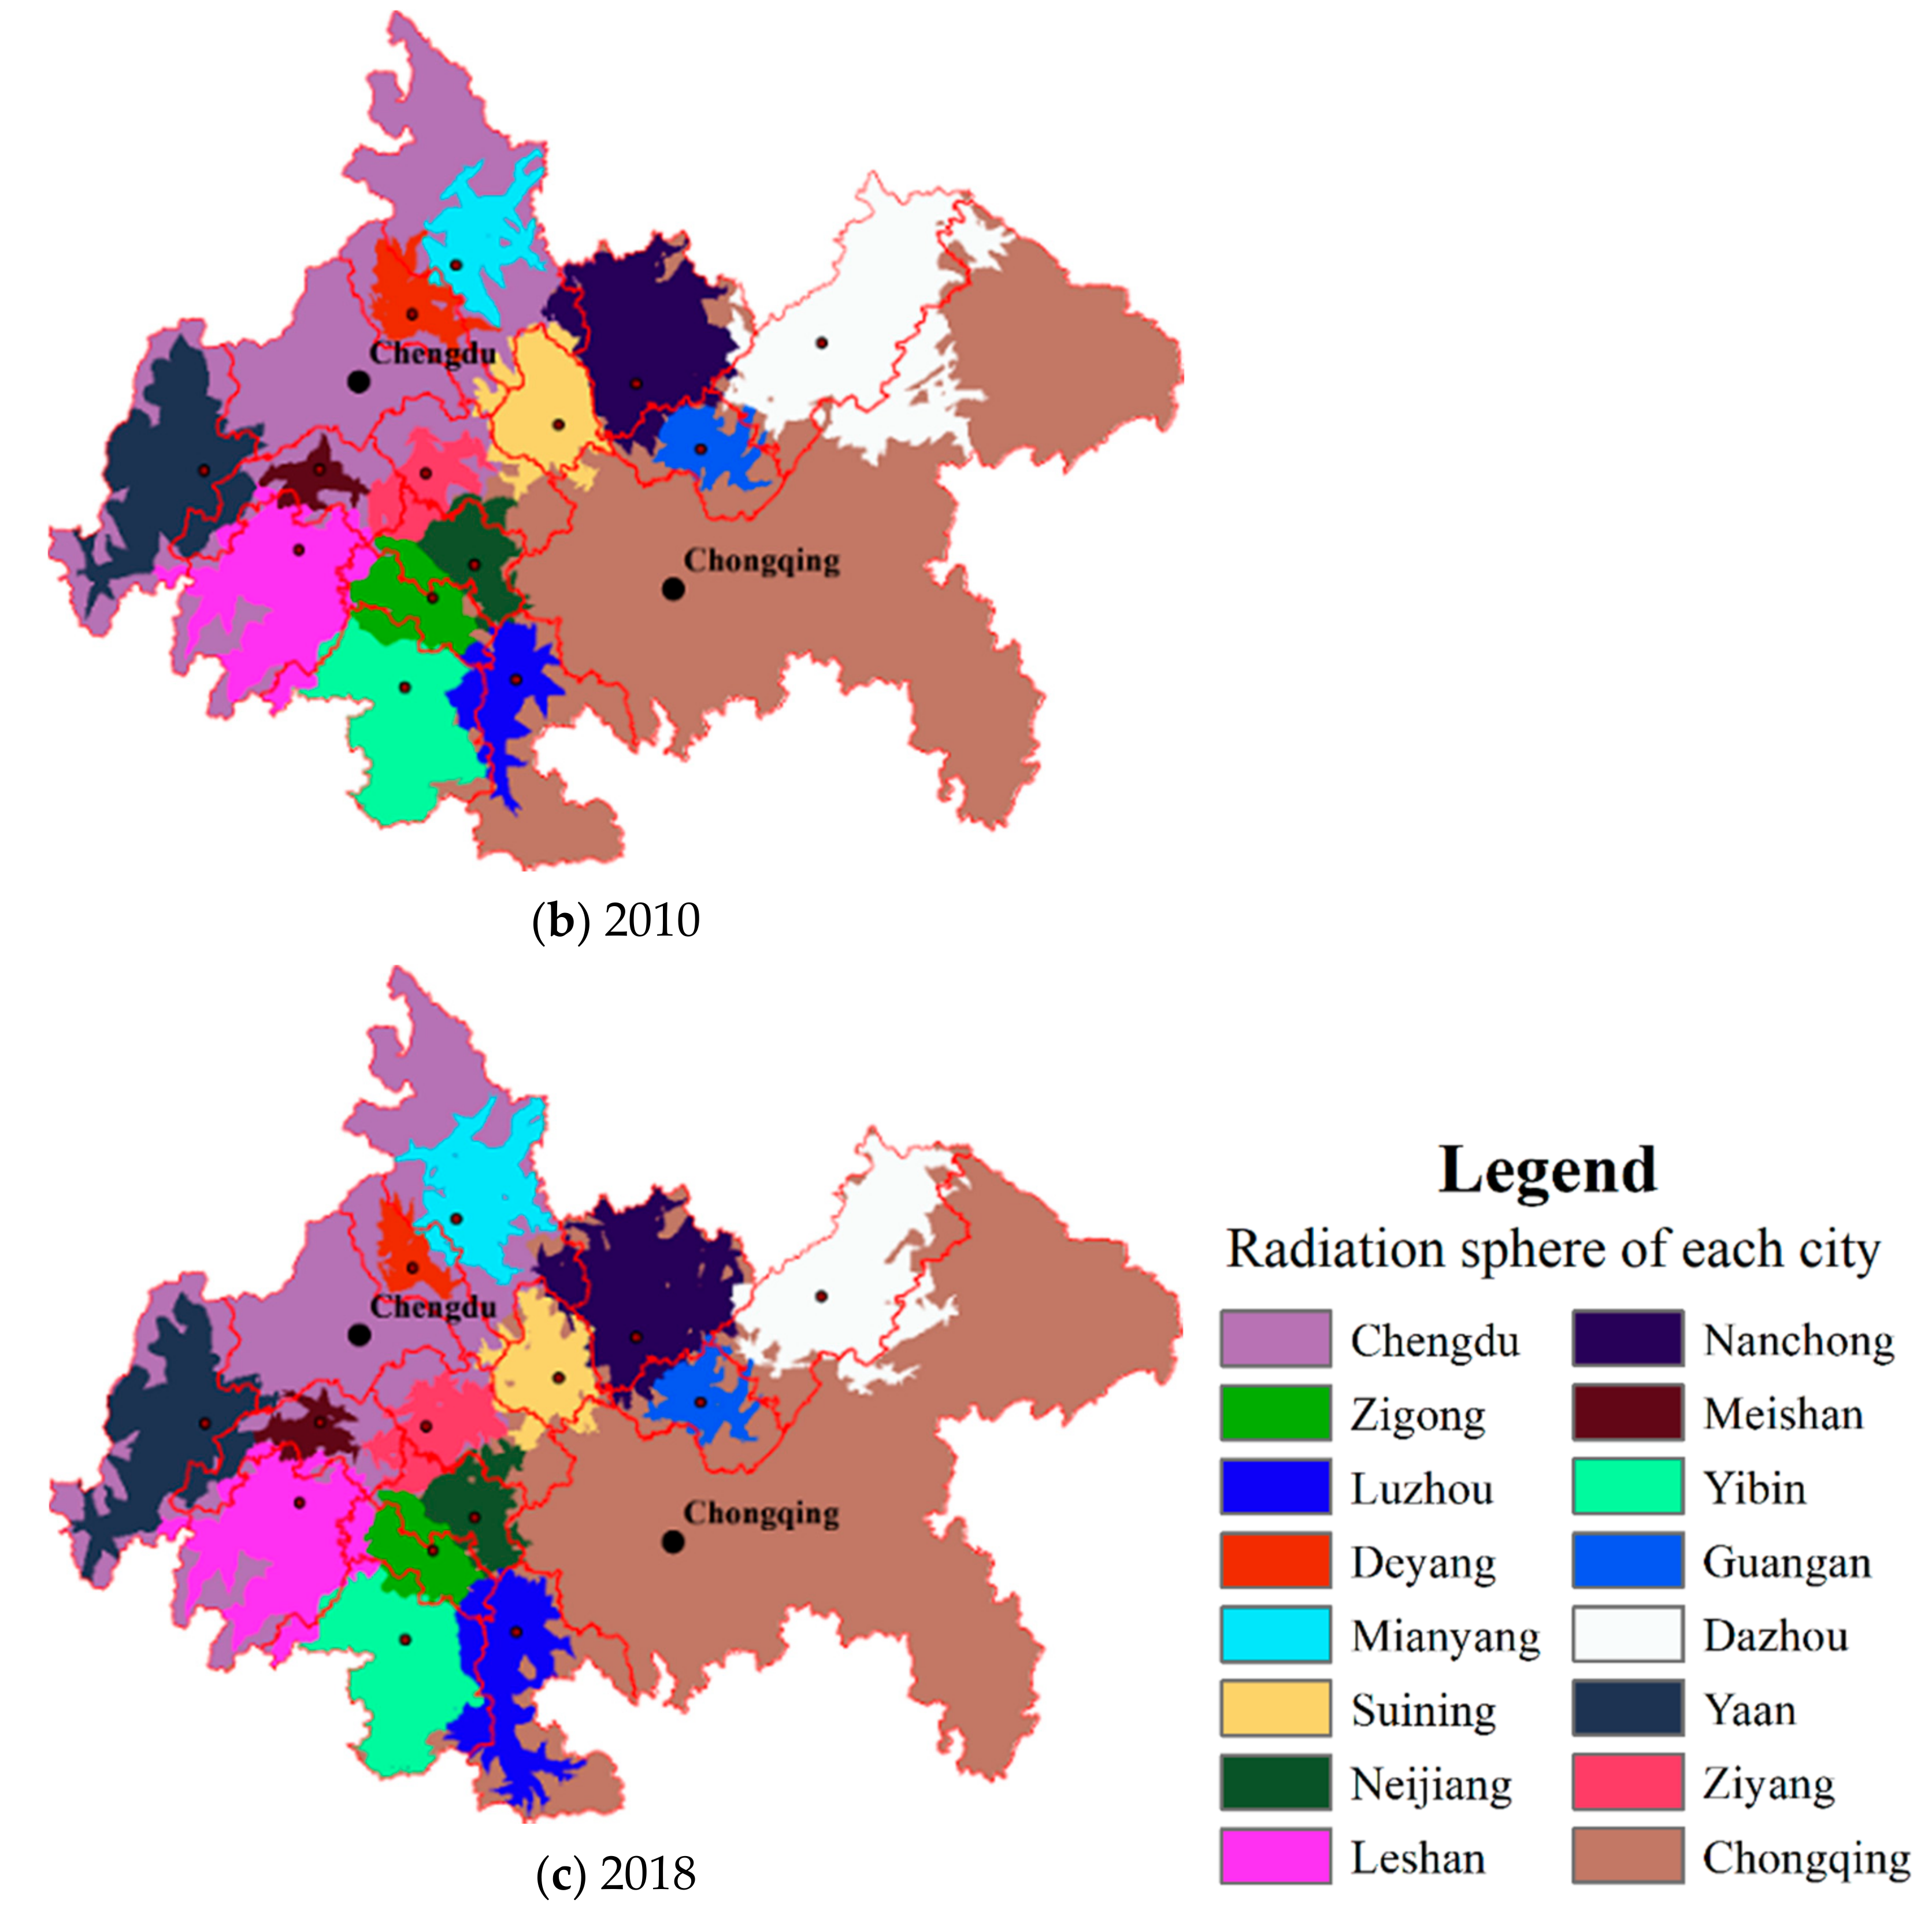
5.3. Radiation Sphere
6. Findings and Discussion
7. Conclusions, Policy Implications, and Limitations
- (1)
- The overall situation of UA accessibility should be improved in a systematical way by enhancing the density of road networks beyond urban centers to provide a basis for strengthening the interaction between cities and the radiation effect of cities’ transportation systems.
- (2)
- Greater efforts are needed to ensure the continuous improvement of each UA city’s transportation system. Thereby, the overall promotion of UA’s transportation network can depend on the transportation radiation effects of every city, and be realized in a “point-to-polygon” way.
- (3)
- In the plan of UA transportation development, the effect of growth poles should be considered. If a UA’s transportation development is arranged in the first stage, the limited resources of transportation construction and development should be tilted toward the growth-pole cities or used for the cultivation of new traffic growth poles. In the second stage, it should focus on the overall improvement of the traffic level of the entire UA.
- (4)
- The design of UA transport network spatial pattern should accord with the characteristics of UA spatial structure, so as to provide a basic framework for UA development in a polycentric or compact model.
Author Contributions
Funding
Acknowledgments
Conflicts of Interest
Appendix A

| Dimensions | Code | Indicator | Unit | 2002 | 2010 | 2018 | ||||||
|---|---|---|---|---|---|---|---|---|---|---|---|---|
| Max | Min | Mean | Max | Min | Mean | Max | Min | Mean | ||||
| Transportation infrastructure | X1 | Total highway mileage | km | 31,060 | 1769 | 5845.1053 | 116,949 | 4438 | 16994 | 157,483 | 4812.224 | 21,741.262 |
| X2 | Mileage of classified highway | km | 21,936 | 1046 | 4190.7368 | 80,006 | 2706 | 12,538.316 | 133,942 | 3929.294 | 19,332.706 | |
| X3 | The proportion of classified highway | km | 0.9333 | 0.4592 | 0.6995 | 0.8952 | 0.5898 | 0.7602 | 0.9950 | 0.7966 | 0.9045 | |
| X4 | Density of highway network (population) | km/104 persons | 17.8791 | 5.2257 | 10.6387 | 48.0877 | 17.6769 | 26.9853 | 66.3458 | 18.7867 | 34.1485 | |
| X5 | Density of highway network (land area) | km/102 km2 | 92.1227 | 17.8138 | 42.8899 | 179.1125 | 36.7599 | 116.1898 | 235.2120 | 44.6063 | 145.0333 | |
| Passenger transport | X6 | Highway passenger volume | 104 persons | 58,512 | 1850 | 10,832.474 | 122,125 | 2249 | 18,395.924 | 52,150 | 1654 | 6566.1053 |
| X7 | Waterway passenger volume | 104 persons | 2046 | 0 | 272.2105 | 1277 | 0 | 220.8432 | 735 | 0 | 170.3158 | |
| X8 | Airline passenger volume | 104 persons | 379.26 | 0 | 29.0167 | 1287.9 | 0 | 114.8249 | 5295 | 0 | 477.2105 | |
| X9 | Turnover of highway passenger | 104 persons·km | 1,938,700 | 52,822 | 315,770.16 | 3,510,300 | 86,248 | 569,851.84 | 2,604,300 | 59,718 | 347,165.26 | |
| X10 | Passenger traffic density of highway | 104 persons·km/km | 96.7224 | 21.8076 | 47.5189 | 129.8885 | 13.6998 | 31.5511 | 32.1042 | 4.9749 | 15.5006 | |
| Freight transport | X11 | Highway freight volume | 104 tons | 26,076 | 969 | 4246.6842 | 69438 | 2215 | 9618.2105 | 107,064 | 3832 | 13,807.263 |
| X12 | Waterway freight volume | 104 tons | 1907 | 0 | 235.8421 | 9660 | 0 | 767.8947 | 19,452 | 0 | 1453.1579 | |
| X13 | Airline freight volume | tons | 105,300 | 0 | 7178.4211 | 220,000 | 0 | 16,382.053 | 665,000 | 0 | 43,736.211 | |
| X14 | Turnover of highway freight | 104 tons·km | 899,100 | 57,873 | 153,869.37 | 6,103,100 | 168,910 | 787,257.63 | 11,527,546 | 304,937 | 1,449,173.5 | |
| X15 | Freight traffic density of highway | 104 tons·km/km | 44.4881 | 12.0310 | 25.4934 | 98.8644 | 12.2888 | 47.4079 | 129.2712 | 21.9923 | 68.6883 | |
References
- Huang, Y.; Hong, T.; Ma, T. Urban network externalities, agglomeration economies and urban economic growth. Cities 2020, 107, 102882. [Google Scholar] [CrossRef]
- Burger, M.J.; Meijers, E.J. Agglomerations and the rise of urban network externalities. Pap. Reg. Sci. 2016, 95, 5–15. [Google Scholar] [CrossRef]
- Li, K.X.; Qi, G. Transport Connectivity and Regional Development in China. J. Int. Logist. Trade 2016, 14, 142–155. [Google Scholar] [CrossRef]
- Deng, T.; Shao, S.; Yang, L.; Zhang, X. Has the transport-led economic growth effect reached a peak in China? A panel threshold regression approach. Transportation 2014, 41, 567–587. [Google Scholar] [CrossRef]
- Tierney, S. High-speed rail, the knowledge economy and the next growth wave. J. Transp. Geogr. 2012, 22, 285–287. [Google Scholar] [CrossRef]
- Vaidyanathan, V.; King, R.A.; De Jong, M. Understanding urban transportation in India as polycentric system. Policy Soc. 2013, 32, 175–185. [Google Scholar] [CrossRef]
- Ryder, A. High speed rail. J. Transp. Geogr. 2012, 22, 303–305. [Google Scholar] [CrossRef]
- Shaw, S.-L.; Fang, Z.; Lu, S.; Tao, R. Impacts of high speed rail on railroad network accessibility in China. J. Transp. Geogr. 2014, 40, 112–122. [Google Scholar] [CrossRef]
- Li, C.; He, J.; Duan, X. Modeling the Collaborative Evolution of Urban Land Considering Urban Interactions under Intermediate Intervention, in the Urban Agglomeration in the Middle Reaches of the Yangtze River in China. Land 2020, 9, 184. [Google Scholar] [CrossRef]
- Fang, C.; Yu, D. Urban agglomeration: An evolving concept of an emerging phenomenon. Landsc. Urban Plan. 2017, 162, 126–136. [Google Scholar] [CrossRef]
- Zhou, D.; Bonafoni, S.; Zhang, L.; Wang, R. Remote sensing of the urban heat island effect in a highly populated urban agglomeration area in East China. Sci. Total Environ. 2018, 628–629, 415–429. [Google Scholar] [CrossRef]
- Zhou, H.; Gao, H. The impact of urban morphology on urban transportation mode: A case study of Tokyo. Case Stud. Transp. Policy 2020, 8, 197–205. [Google Scholar] [CrossRef]
- Christoforou, Z.; Corbillé, E.; Farhi, N.; Leurent, F. Managing planned disruptions of mass transit systems. Transp. Res. Rec. J. Transp. Res. Board 2016, 2541, 46–55. [Google Scholar] [CrossRef]
- Schneider, A.; Mertes, C.M. Expansion and growth in Chinese cities, 1978–2010. Environ. Res. Lett. 2014, 9, 024008. [Google Scholar] [CrossRef]
- Sun, X. Multi-indicator Evaluation and Analysis of Coordinated Industrial Development of Urban Agglomerations. Chin. J. Urban Environ. Stud. 2017, 5, 1750006. [Google Scholar] [CrossRef]
- Faber, B. Trade integration, market size, and industrialization: Evidence from China’s National Trunk Highway System. Rev. Econ. Stud. 2014, 81, 1046–1070. [Google Scholar] [CrossRef]
- Ahlfeldt, G.M.; Feddersen, A. From periphery to core: Measuring agglomeration effects using high-speed rail. J. Econ. Geogr. 2017, 18, 355–390. [Google Scholar] [CrossRef]
- López, E.; Gutiérrez, J.; Gómez, G. Measuring Regional Cohesion Effects of Large-scale Transport Infrastructure Investments: An Accessibility Approach. Eur. Plan. Stud. 2008, 16, 277–301. [Google Scholar] [CrossRef]
- Monzón, A.; Ortega, E.; López, E. Efficiency and spatial equity impacts of high-speed rail extensions in urban areas. Cities 2013, 30, 18–30. [Google Scholar] [CrossRef]
- Zhang, L.; Lu, Y. Regional accessibility of land traffic network in the Yangtze River Delta. J. Geogr. Sci. 2007, 17, 351–364. [Google Scholar] [CrossRef]
- Jiao, J.; Wang, J.; Jin, F.; Dunford, M. Impacts on accessibility of China’s present and future HSR network. J. Transp. Geogr. 2014, 40, 123–132. [Google Scholar] [CrossRef]
- Levinson, D.M. Accessibility impacts of high-speed rail. J. Transp. Geogr. 2012, 22, 288–291. [Google Scholar] [CrossRef]
- Chen, J.; Chen, J.; Miao, Y.; Song, M.; Fan, Y. Unbalanced development of inter-provincial high-grade highway in China: Decomposing the Gini coefficient. Transp. Res. Part D Transp. Environ. 2016, 48, 499–510. [Google Scholar] [CrossRef]
- Derudder, B.; Liu, X.; Kunaka, C.; Roberts, M. The connectivity of South Asian cities in infrastructure networks. J. Maps 2013, 10, 47–52. [Google Scholar] [CrossRef]
- Lan, F.; Da, H.; Wen, H.; Wang, Y. Spatial Structure Evolution of Urban Agglomerations and Its Driving Factors in Mainland China: From the Monocentric to the Polycentric Dimension. Sustainability 2019, 11, 610. [Google Scholar] [CrossRef]
- Anas, A.; Arnott, R.; Small, K.A. Urban spatial structure. J. Econ. Lit. 1998, 36, 1426–1464. [Google Scholar]
- Stathakis, D.; Tsilimigkas, G. Measuring the compactness of European medium-sized cities by spatial metrics based on fused data sets. Int. J. Image Data Fusion 2014, 6, 42–64. [Google Scholar] [CrossRef]
- Kloosterman, R.C.; Musterd, S. The polycentric urban region: Towards a research agenda. Urban Stud. 2001, 38, 623–633. [Google Scholar] [CrossRef]
- Yang, T.; Jin, Y.; Yan, L.; Pei, P. Aspirations and realities of polycentric development: Insights from multi-source data into the emerging urban form of Shanghai. Environ. Plan. B Urban Anal. City Sci. 2019, 46, 1264–1280. [Google Scholar] [CrossRef]
- Qi, W.; Fang, C.; Song, J. Measurement and spatial distribution of urban agglomeration industrial compactness in China. Chin. Geogr. Sci. 2008, 18, 291–299. [Google Scholar] [CrossRef]
- Li, Z.; Wang, Y.; Zhao, S. Study of Intercity Travel Characteristics in Chinese Urban Agglomeration. Int. Rev. Spat. Plan. Sustain. Dev. 2015, 3, 75–85. [Google Scholar] [CrossRef][Green Version]
- Bertinelli, L.; Black, D. Urbanization and growth. J. Urban Econ. 2004, 56, 80–96. [Google Scholar] [CrossRef]
- Zeng, C.; Zhao, Z.; Wen, C.; Yang, J.; Lv, T. Effect of Complex Road Networks on Intensive Land Use in China’s Beijing-Tianjin-Hebei Urban Agglomeration. Land 2020, 9, 532. [Google Scholar] [CrossRef]
- Garcia-López, M.-À. Urban spatial structure, suburbanization and transportation in Barcelona. J. Urban Econ. 2012, 72, 176–190. [Google Scholar] [CrossRef]
- Zheng, X.-P. Economies of Network, Urban Agglomeration, and Regional Development: A Theoretical Model and Empirical Evidence. Reg. Stud. 2007, 41, 559–569. [Google Scholar] [CrossRef]
- Dutta, I.; Das, A. Application of geo-spatial indices for detection of growth dynamics and forms of expansion in English Bazar Urban Agglomeration, West Bengal. J. Urban Manag. 2019, 8, 288–302. [Google Scholar] [CrossRef]
- Li, Y.; Xiong, W.; Wang, X. Does polycentric and compact development alleviate urban traffic congestion? A case study of 98 Chinese cities. Cities 2019, 88, 100–111. [Google Scholar] [CrossRef]
- He, Q.; Zeng, C.; Xie, P.; Tan, S.; Wu, J. Comparison of urban growth patterns and changes between three urban agglomerations in China and three metropolises in the USA from 1995 to 2015. Sustain. Cities Soc. 2019, 50, 101649. [Google Scholar] [CrossRef]
- Fageda, X.; Olivieri, C. Transport infrastructure and regional convergence: A spatial panel data approach. Pap. Reg. Sci. 2019, 98, 1609–1631. [Google Scholar] [CrossRef]
- Verma, A.; Sudhira, H.; Rathi, S.; King, R.; Dash, N. Sustainable urbanization using high speed rail (HSR) in Karnataka, India. Res. Transp. Econ. 2013, 38, 67–77. [Google Scholar] [CrossRef]
- Kruszyna, M.; Śleszyński, P.; Rychlewski, J. Dependencies between demographic urbanization and the agglomeration road traffic volumes: Evidence from Poland. Land 2021, 10, 47. [Google Scholar] [CrossRef]
- Chen, C.-L. Reshaping Chinese space-economy through high-speed trains: Opportunities and challenges. J. Transp. Geogr. 2012, 22, 312–316. [Google Scholar] [CrossRef]
- Mejia-Dorantes, L.; Paez, A.; Vassallo, J.M. Transportation infrastructure impacts on firm location: The effect of a new metro line in the suburbs of Madrid. J. Transp. Geogr. 2012, 22, 236–250. [Google Scholar] [CrossRef]
- Onofrio, R. Is the Law of Universal Gravitation Valid at Short Distances? Mod. Phys. Lett. A 1998, 13, 1401–1406. [Google Scholar] [CrossRef]
- Anderson, J.E. The Gravity Model. Annu. Rev. Econ. 2011, 3, 133–160. [Google Scholar] [CrossRef]
- De Benedictis, L.; Taglioni, D. The Gravity Model in International Trade. In The Trade Impact of European Union Preferential Policies; Springer Science and Business Media LLC: Berlin/Heidelberg, Germany, 2011; pp. 55–89. [Google Scholar]
- Tchrakian, D.H. Electric and Magnetic gravitational fields in vacuum. Gen. Relativ. Gravit. 1975, 6, 151–156. [Google Scholar] [CrossRef]
- Chen, Y. Urban gravity model based on cross-correlation function and Fourier analyses of spatio-temporal process. Chaos Solitons Fractals 2009, 41, 603–614. [Google Scholar] [CrossRef]
- Karemera, D.; Oguledo, V.I.; Davis, B. A gravity model analysis of international migration to North America. Appl. Econ. 2000, 32, 1745–1755. [Google Scholar] [CrossRef]
- Wang, D.; Niu, Y.; Sun, F.; Wang, K.; Qian, J.; Li, F. Evolution and spatial characteristics of tourism field strength of cities linked by high-speed rail (HSR) network in China. J. Geogr. Sci. 2017, 27, 835–856. [Google Scholar] [CrossRef]
- Camagni, R.; Capello, R.; Caragliu, A. The Rise of Second-Rank Cities: What Role for Agglomeration Economies? Eur. Plan. Stud. 2014, 23, 1069–1089. [Google Scholar] [CrossRef]
- Matsumoto, H. International urban systems and air passenger and cargo flows: Some calculations. J. Air Transp. Manag. 2004, 10, 239–247. [Google Scholar] [CrossRef]
- Jin, F.; Chen, Z. Evolution of transportation in China since reform and opening up: Patterns and principles. J. Geogr. Sci. 2019, 29, 1731–1757. [Google Scholar] [CrossRef]
- Magalhães, M.T. Spatial coverage index for assessing national and regional transportation infrastructures. J. Transp. Geogr. 2016, 56, 53–61. [Google Scholar] [CrossRef]
- Song, G.; Yang, J. Measuring the spatiotemporal variation and evolution of transport network of China’s megaregions. J. Geogr. Sci. 2016, 26, 1497–1516. [Google Scholar] [CrossRef]
- Liu, X.; Derudder, B.; Wu, K. Measuring Polycentric Urban Development in China: An Intercity Transportation Network Perspective. Reg. Stud. 2016, 50, 1302–1315. [Google Scholar] [CrossRef]
- Yang, H.; Dobruszkes, F.; Wang, J.; Dijst, M.; Witte, P. Comparing China’s urban systems in high-speed railway and airline networks. J. Transp. Geogr. 2018, 68, 233–244. [Google Scholar] [CrossRef]
- Guo, L.M.; Zhu, H.B.; Zhang, N.X. Numerical study of traffic flow considering the probability density distribution of the traffic density. Int. J. Mod. Phys. C 2017, 28, 1750026. [Google Scholar] [CrossRef]
- Lee, J.; Kim, J.H. Phantom Traffic: Platoon Formed at Low Traffic Density. J. Transp. Eng. Part A Syst. 2019, 145, 04018082. [Google Scholar] [CrossRef]
- Hong, W.; Su, M. Influence of Rapid Transit on Accessibility Pattern and Economic Linkage at Urban Agglomeration Scale in China. Open Geosci. 2019, 11, 804–814. [Google Scholar] [CrossRef]
- Campbell, K.B.; Rising, J.A.; Klopp, J.M.; Mbilo, J.M. Accessibility across transport modes and residential developments in Nairobi. J. Transp. Geogr. 2019, 74, 77–90. [Google Scholar] [CrossRef]
- Zhu, Z.; Zhang, A.; Zhang, Y. Connectivity of intercity passenger transportation in China: A multi-modal and network approach. J. Transp. Geogr. 2018, 71, 263–276. [Google Scholar] [CrossRef]
- Lee, H.-S. The networkability of cities in the international air passenger flows 1992–2004. J. Transp. Geogr. 2009, 17, 166–175. [Google Scholar] [CrossRef]
- Andreasen, M.H.; Møller-Jensen, L. Access to the city: Mobility patterns, transport and accessibility in peripheral settlements of Dar es Salaam. J. Transp. Geogr. 2017, 62, 20–29. [Google Scholar] [CrossRef]
- Prabhakar, N.; Anbarasi, L.J. Exploration of the global air transport network using social network analysis. Soc. Netw. Anal. Min. 2021, 11, 1–12. [Google Scholar] [CrossRef]
- Parr, J.B. Growth-pole strategies in regional economic planning: A retrospective view. Part 1. Origins and advocacy. Urban Stud. 1999, 36, 1195–1215. [Google Scholar] [CrossRef]


| Dimensions | Code | Indicator | Unit | Sources |
|---|---|---|---|---|
| Transportation infrastructure | X1 | Total highway mileage | km | [23] |
| X2 | Mileage of classified highway | km | [53] | |
| X3 | The proportion of classified highway | km | [23] | |
| X4 | Density of highway network (by population) | km/104 persons | [54] | |
| X5 | Density of highway network (by land area) | km/102 km2 | [54] | |
| Passenger transport | X6 | Highway passenger volume | 104 persons | [57] |
| X7 | Waterway passenger volume | 104 persons | [54] | |
| X8 | Airline passenger volume | 104 persons | [52,57] | |
| X9 | Turnover of highway passenger | 104 persons·km | [53] | |
| X10 | Passenger traffic density of highway | 104 persons·km/km | [58,59] | |
| Freight transport | X11 | Highway freight volume | 104 tons | [54,56] |
| X12 | Waterway freight volume | 104 tons | [54] | |
| X13 | Airline freight volume | tons | [52,56] | |
| X14 | Turnover of highway freight | 104 tons·km | [53] | |
| X15 | Freight traffic density of highway | 104 tons·km/km | [58,59] |
| Year | Railway | Expressway | National Highway | Provincial Highway | County Highway |
|---|---|---|---|---|---|
| 2000 | 100 a | 90 d | 80 d | 60 d | 40 d |
| 2010 | 120 b | 100 e | 80 e | 70 e | 40 e |
| 2020 | 140 c | 100 f | 80 f | 70 f | 40 f |
| Isochronous Traffic Rings | Area (km2) | Proportion for the Area | Ten-Year Growth Rate | |||||
|---|---|---|---|---|---|---|---|---|
| 2000 | 2010 | 2020 | 2000 | 2010 | 2020 | 2010 | 2020 | |
| 0.5 h | 18,332 | 28,496 | 46,153 | 7.45% | 11.57% | 18.74% | 55.44% | 61.96% |
| 1 h | 62,297 | 89,562 | 122,101 | 25.30% | 36.37% | 49.58% | 43.77% | 36.33% |
| 2 h | 152,402 | 180,446 | 198,864 | 61.91% | 73.28% | 80.76% | 18.40% | 10.21% |
| 3 h | 196,475 | 219,062 | 230,528 | 79.81% | 88.96% | 93.61% | 11.50% | 5.23% |
| 4 h | 218,983 | 237,072 | 244,243 | 88.95% | 96.28% | 99.18% | 8.26% | 3.02% |
| 5 h | 229,988 | 245,217 | 245,682 | 93.42% | 99.58% | 99.77% | 6.62% | 0.19% |
| 6 h | 238,986 | 246,087 | 246,138 | 97.08% | 99.94% | 99.95% | 2.97% | 0.02% |
| Year Cities | 2002 | 2010 | 2018 |
|---|---|---|---|
| Chongqing | 89,540 | 93,339 | 97,816 |
| Chengdu | 59,691 | 42,173 | 40,379 |
| Dazhou | 18,783 | 21,948 | 15,411 |
| Deyang | 5111 | 3502 | 2148 |
| Guangan | 2370 | 3110 | 3235 |
| Mianyang | 3922 | 5177 | 7732 |
| Meishan | 1817 | 1873 | 2130 |
| Nanchong | 11,476 | 12,778 | 13,256 |
| Neijiang | 4210 | 4411 | 4376 |
| Leshan | 5016 | 12,299 | 12,766 |
| Luzhou | 15,466 | 5140 | 8628 |
| Suining | 6085 | 7537 | 5689 |
| Yaan | 11,157 | 12,405 | 12,177 |
| Yibin | 7008 | 10,728 | 10,489 |
| Ziyang | 993 | 3979 | 4900 |
| Zigong | 3540 | 4918 | 4207 |
Publisher’s Note: MDPI stays neutral with regard to jurisdictional claims in published maps and institutional affiliations. |
© 2021 by the authors. Licensee MDPI, Basel, Switzerland. This article is an open access article distributed under the terms and conditions of the Creative Commons Attribution (CC BY) license (https://creativecommons.org/licenses/by/4.0/).
Share and Cite
Yao, Z.; Ye, K.; Xiao, L.; Wang, X. Radiation Effect of Urban Agglomeration’s Transportation Network: Evidence from Chengdu–Chongqing Urban Agglomeration, China. Land 2021, 10, 520. https://doi.org/10.3390/land10050520
Yao Z, Ye K, Xiao L, Wang X. Radiation Effect of Urban Agglomeration’s Transportation Network: Evidence from Chengdu–Chongqing Urban Agglomeration, China. Land. 2021; 10(5):520. https://doi.org/10.3390/land10050520
Chicago/Turabian StyleYao, Zhangfeng, Kunhui Ye, Liang Xiao, and Xiaowei Wang. 2021. "Radiation Effect of Urban Agglomeration’s Transportation Network: Evidence from Chengdu–Chongqing Urban Agglomeration, China" Land 10, no. 5: 520. https://doi.org/10.3390/land10050520
APA StyleYao, Z., Ye, K., Xiao, L., & Wang, X. (2021). Radiation Effect of Urban Agglomeration’s Transportation Network: Evidence from Chengdu–Chongqing Urban Agglomeration, China. Land, 10(5), 520. https://doi.org/10.3390/land10050520