Abstract
Deforestation and land degradation remain two major economic and environmental threats in Côte d’Ivoire. This study assessed land use and land cover (LULC) change and farmers’ perceptions of the drivers and effects of deforestation and land degradation in south-western Côte d’Ivoire. We used remotely sensed data to determine LULC change trends, and a household survey to collect farmers’ perceptions of deforestation and land degradation. A total of 411 households were interviewed using a structured questionnaire and the focus group discussions involved 25 farmers. Landsat image analysis reported a drastic LULC change and a conversion of forestlands into agriculture from 1987 to 2015 at a rate of 1.44%/year and 3.44%/year for dense forests and degraded forests, respectively. The household survey revealed that the major causes of deforestation perceived by farmers included population growth (79.3%), extensive agriculture (72.9%), migration (54.2%) and logging (47.7%). Land degradation evolved, from a shortened fallow period (46.7%) and an inappropriate application of inputs (31.4%). The perceived major effects linked to deforestation encompassed land degradation (70.6%), loss of biodiversity (63.8%), global warming (56.9%) and loss of livelihood assets (54.3%). Therefore, this study recommends participatory landscape planning, reforestation and capacity building of stakeholders for sustainable intensification of the production systems to reduce LULC challenges for enhanced productive and protective functions of remaining forests.
1. Introduction
Forests play an important role in the socio-economic wellbeing and livelihoods of the rural population [1]. Land degradation and deforestation hurt rural people and the rural economy by exacerbating poverty and food insecurity [2,3,4]. Estimated at 16 million hectares in the 1900s, Côte d’Ivoire’s forest cover declined from about 7.9 million hectares in 1990 to 3.4 million hectares in 2015 [5,6]. This rate of deforestation is one of the highest rates in the world [7] and is mainly due to anthropogenic pressures on forests for agriculture, timber and fuelwood needs [8,9]. In recent decades, the south-east and south-west regions were the most exposed to deforestation due to the existence of important pioneer fronts at the limits of forest massifs [10]. As a result, the south-west region, one of the main cocoa supply zones in the world, has faced dramatic deforestation in the last three decades [11], food and nutrition insecurity [12], pests and epidemics, and a loss of biodiversity [7,13,14]. This region has attracted hundreds of thousands of migrants from other parts of the country and neighbouring countries, resulting in a high population density [15]. This situation led to rainforest clearance for the establishment of agricultural plantations, mainly cocoa, rubber and oil palm [15,16]. Additionally, illegal logging of forest resources has contributed to deforestation and significant degradation of forests in rural areas as well as in the public and private domains including national parks, nature reserves and gazetted forests [17]. Furthermore, the shift of Côte d’Ivoire’s cocoa belt from the east to the west in the 1980s caused by the massive expansion of cocoa plantations [18], coupled with illegal logging [17] and the dense road network [19], led to the removal of most of the forests and degraded most of the remaining forestland [11]. This situation caused an unprecedented loss of biodiversity and ecosystem services [13,20,21], land degradation [11,22], and pest and disease outbreaks [23]. Moreover, since the 1970s, a change in rainfall patterns has been observed in the region, a sign of climate change and human action on the environment [24,25,26].
Several underlining causes of deforestation were identified, including agricultural expansion, population growth, illegal logging, wildfires and mining [27,28,29]. These studies showed variation among the causes of deforestation and land degradation. However, the dynamics of these drivers, their link to regional- and national-level socio-economic context and farmers responses in developing adoptable solutions are poorly understood.
The growing demand for the sustainable management of vulnerable landscapes has called for the development of strategies to address key landscape-related issues such as climate change mitigation, biodiversity conservation, deforestation reduction and improvement of living conditions in rural areas. In the region, the land use and land cover (LULC) is constantly changing, resulting in a fragmented ecosystem. The main drivers of these changes include complex socio-economic and environmental factors combined. Among these causes, demographic pressure and population dynamics, the importance of cash crops, unrealistic rainfall trends, markets and the local economy could be the most important causes [30,31,32]. To reduce pressure on remnant forests, it is therefore important to balance the needs of agricultural production with the protection of the environment.
In this Upper Guinea forest landscape, the Taï National Park (TNP), a World Heritage Site and Biosphere Reserve, remains the main natural and undisturbed rainforest [11,20]. Agricultural land expansion coupled with the recent political crisis in the country has increased pressure on the wider region of TNP and threatened the environmental sustainability of the landscape.
Despite the massive deforestation, conservation incentives have mainly focused on protected areas (National Parks, Gazetted Forests, etc.) and local populations are not always involved in their protection and their perceptions considered.
With the ongoing rapid changes of the LULC in the region, climate projections showing perpetual deterioration and regarding requirements of developing sustainable landscape management strategies, it is important to understand the perceptions of local people on experienced changes in their environment, its effects on their livelihoods and strategies to be adopted.
This article seeks to characterize the current trend in LULC change in the south-west region, farmer perceptions on the drivers and effects of deforestation and land degradation and proposes recommendations for the sustainable management of the remaining forests and advise stakeholders on appropriate decision-making. To achieve this, the trends and drivers of LULC were mapped out and local farmers’ perception were compared to the outputs of remote sensing data analysis. The assumptions tested are threefold: firstly, it is stipulated that forestlands are converted into agricultural lands with a high deforestation estimate, while secondly, it is asserted that farmers’ perceptions of deforestation and LULC trends rely on the socioeconomic characteristic of the households; thirdly, it is envisaged that farmers have a reliable perception vis-a-vis to the trends of each LULC type.
The specific questions addressed in this study included:
- -
- How and why is LULC changing in the wider Tai region? What are the trends of each LULC type?
- -
- What are the drivers of LULC change? Which ones are the most relevant direct and indirect driving forces of deforestation and land degradation?
- -
- How reliable is the perception of local farmers?
Common methods for the identification of driving forces of LULC change in the forest ecosystems are remote sensing, statistical analysis, interviews of local actors or a combination of the above-mentioned methods [33].
The current study employed a combination of methodological approaches, which allows the analysis of trends and drivers of LULC change and provides details on the reliability of local farmer perception by comparing the findings.
2. Materials and Methods
2.1. Study Area
The study was conducted in the peripheral zone of the TNP so-called Espace Taï. It is composed of the TNP (a biodiversity conservation area and largest protected rainforest in West Africa) and its surrounding subdistricts (Figure 1). This area is located between 4°50′ and 6°42′ north latitude and between 6°30′ and 7°56′ west longitude, comprised between the Cavally and Sassandra rivers, with an altitude ranging between less than 100 m above sea level (m a.s.l.) in the south and more than 250 m a.s.l. in the north.
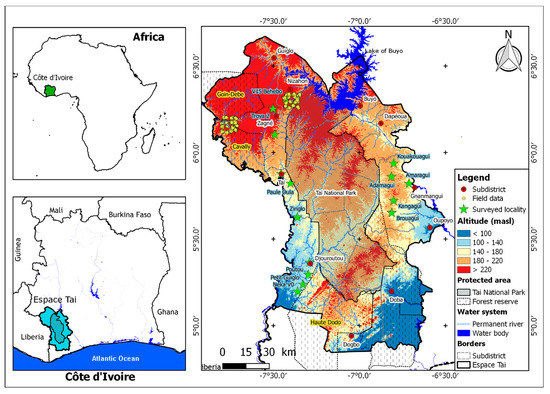
Figure 1.
Map of the study area showing surveyed localities in south-western Côte d’Ivoire.
Administratively, the Espace Taï stretches over 11 sub-districts of three regions (Nawa, Cavally and San-Pedro). This region, covering about 17,334 km² in south-western Côte d’Ivoire, is home to 842,640 inhabitants regrouped in 150,583 households according to the 2014 General Census of Population and Housing [34].
The region is dominated by a subequatorial climate, characterized by the existence of two rainy seasons alternating with two dry seasons. The heaviest rainfall is in June, during the long rainy season, and the mean annual rainfall is 1700 mm but varies from 1500 mm in the north-east to 2200 mm in the south-west of the park [35]. The landscape is covered by a rainforest ecosystem in the TNP and many cropping systems dominated by cocoa farms within the four forest reserves and the rural zone [20].
The region is drained by numerous permanent watercourses which are divided between two large watersheds (Sassandra and Cavally) and two basins of small coastal rivers (San Pedro and Nero) [36]. Moreover, it is covered by highly desaturated ferralitics soils highly prone to leaching and several inland valleys located in watershed downslopes, which are generally fertile and suitable for food crops (cassava, rainfed rice, banana, etc.) and cash crops (cocoa, coffee, oil palm and rubber) [37,38,39].
Agriculture dominates the economy and contributes mainly (more than 75%) to employment with the majority involved in cocoa production as the major source of income. The wider TNP area belongs to the ombrophile sector [40], which was once originally covered by tropical forest but has been severely degraded and reduced by agriculture and logging [11,41]. Farmers practice extensive full-sun mono-cropping of cocoa, which has degraded the environment over time [16]. Presently, the TNP, a World Heritage Site, remains the main natural and undisturbed forest in the area [11,20]. The flora of this region has a special character, due to the existence of endemism, which is mainly located at the specific level, except for some genera such as Triphyophyllum, for example. In the northern part of the TNP, primary dense forests are of Eremospatha macrocarpa and Diospyros mannii types [42].
This region is home to around 145 species of mammals, representing 93% of the mammal species in the Upper Guinean forest zone [35,42,43].
2.2. LULC Analysis
LULC diachronic change was assessed using historical and current high-resolution and cloud-free satellite images. Orthorectified Collection 1 Level-1 Landsat Thematic Mapper (TM) and Operational Land Imager/Thermal Infrared Sensor (OLI/TIRS) images with a 30 m spatial resolution of two periods (1987 and 2015), acquired from the USGS Landsat archive via Earth Explorer (http://earthexplorer.usgs.gov, accessed on 9 April 2021) with a less than 10% cloud filtering, were used in this study (Table S1).
Field data collection was carried out between January 2014 and December 2015 aiming to gather representative datasets in different land-use types and using a stratified and hierarchical sampling framework based on the sentinel sites of 10 × 10 km each [44]. In total, we visited 305 out of 480 plots generated purposively in three sentinel sites centred in the localities Behebo V15 (near Nizahon), Bohie (near the Compagnie Heveicole du Cavally—CHC headquarters) and Petit Bondoukou (near Oupoyo). Additionally, we marked 121 additional points selected in dominant land-uses during tracking plots. At each sampling plot, the vegetation structure/strata, land-use type and history were recorded and supplemented with a photo. All the 426 land-use points were converted into polygons by digitization on Landsat OLI false-color composite using bands near-infrared (B5), shortwave infrared (B6) and visible red (B4) in the corresponding red, green and blue (RGB) color channels or RGB(5,6,4). An additional 102 polygons were digitized through on-screen scanning of visually distinct areas such as waterbodies, rainforests and settlements from Bing Aerial and false-colour composite on QGIS. We digitalized polygons for 1987 (Landsat TM) based on LULC categories identified through the false-colour composite images RGB(4,5,3).
The similarity in spectral signatures of major cash crops within Landsat images did not allow us to disaggregate data on the areas occupied by these main cash crops, except rubber plantations. The identified independent LULC classes through colour composite and signature check and their description are presented in Table 1.

Table 1.
LULC definitions used in this study.
Due to persistent cloud cover in the southern part of the region, the study area was subset into two equal parts at the parallel 5°36′ N. Only the north half of the Espace Taï, covering 10,800 km², was assessed in this research.
2.3. Farmer’s Perceptions
This research focused on the perception of deforestation and land degradation by agricultural households over time, used focus group discussions (FGDs) and household interviews.
2.3.1. Interviews
Household interviews were conducted in June 2015 and aimed to assess farmers’ perception of deforestation and land degradation in the landscape. A total of 411 women and men were randomly selected through the use of structured interviews. The sample size was calculated at the 95% confidence interval and a ±5% level of precision [46].
Towns or villages involved in the study were sampled along defined transects in 15 census districts. A census district is a geographic area containing at least 1200 households. Around the TNP, we selected three sites for the household survey. Five census districts were thus selected in the east of the park, from Angagui to Zheogui, five in the north-west region of the park from Zro to Kéibly and five in the south-west of the TNP ranging from Djouroutou to Neka (Figure 1). About 30 agricultural households were sampled in each district.
The household survey questionnaire was designed after a literature review about farmer perceptions of deforestation and land degradation and its impacts on agriculture sustainability. The questionnaire adopted was composed of closed format questions with single or multiple choices. The interviews targeted key issues such as drivers, impacts, consequences, control and mitigation strategies of deforestation and land degradation.
2.3.2. Focus Group Discussions and Key-Informant Interviews
Focus group discussions (FGDs) and key-informant interviews were carried out to triangulate the obtained information from the household interviews and gain an in-depth and detailed understanding of local farmer’s perceptions on occurred LULC changes in the studied landscape and their associated underlying drivers. A total of 15 FGDs were carried out in 15 districts where household interviews were conducted in the same period. Each FGD consisted of 25 farmers including about 15 heads of households at the end of the survey. We used a purposive sampling method based on theoretical saturation to identify attendees for the FGD based on their knowledge of the study area. Key data collected are on people’s perceptions of deforestation, land degradation and perceived impacts on their livelihoods, households’ and community response strategies and possible livelihood support options.
In this study, key-informant interviews were held in Soubré with active technical stakeholders around the TNP who were familiar with the sustainability issues in the study area. These key-informants included eight officers from the local office of the following institutions and organizations: the National Rural Development Support Agency (ANADER), the Forest Development Corporation (SODEFOR), the Ivorian Parks and Reserves Office (OIPR), the Ministry of Agriculture (four departmental officers), and the Ministry of Water and Forests. The discussions allowed to assess their perceptions of forest degradation and the challenges faced by people and institutions as a result of deforestation in the area. Two of the authors conducted key-informant interviews—Dr. Amos Gyau, an agricultural economist, and Dr. Jean-Luc Kouassi, an agroforestry and GIS specialist.
2.4. Data Analysis
The study employed a combination of approaches and techniques, including GIS-based processing, descriptive statistics and regression analysis for data analysis.
Firstly, LULC analysis was carried out using QGIS and R software (Figure 2). We preprocessed downloaded Landsat images using radiometric correction and harmonization, as well as haze reduction and histogram equalization to reduce atmospheric interference and to improve the quality of images. Furthermore, we used image mosaicking, which consisted of joining the identical bands of the three scenes together in a unique image and extracted the area of the images covered by the study. We selected the Random Forest (RF) algorithm, combining decision tree algorithms and aggregation techniques, for image classification through the R package RandomForest [47]. The accuracy of the classified images was assessed using ground data and confusion matrix [48]. Additionally, we performed post-classification filtering and change detection to analyse changes between two classified images [49,50,51]. The annual rate of change of each LULC class was computed for all land types using the widely adopted formula proposed by Puyravaud [52].
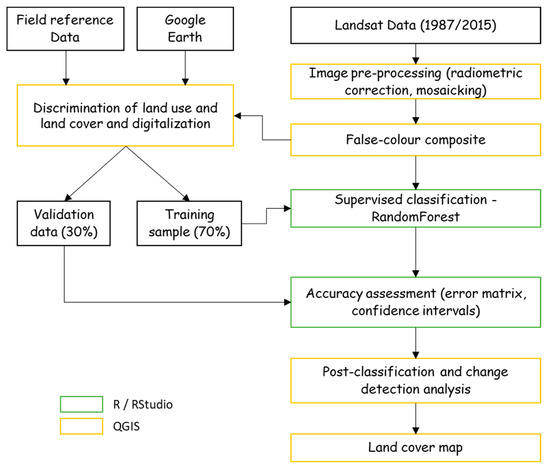
Figure 2.
The LULC mapping process.
Secondly, basic descriptive statistics, such as mean, frequency and percentage, were used to provide insights into farmers’ perceptions of deforestation and land degradation collected from individual interviews. The significance of differences between responses on drivers of LULC changes in the different zones was assessed using the Pearson chi-squared test at a 95% confidence interval. We used logistic regressions to identify the key factors affecting deforestation/forest degradation experiences and good perceptions of LULC changes (deforestation and expansion of agricultural lands). We compared farmers’ perceptions of LULC change trends with trends found in remotely sensed data analysis. Positive values of the annual rate of change indicated an upward trend while negative value showed a downward trend. We coded “True” when local perceptions were similar to the GIS-based trend and “False” when a difference between the perceptions and satellite data trend was observed. Independent variables included socioeconomic characteristics, such as the status of the respondent, gender of the respondent and the household head, age of the respondent, origin, household size, residence length, education, income from agricultural, non-agricultural and forest products, number of cultivated crops (food and crops) and cocoa farm holding. We included all these variables in a backward stepwise regression and the best model was estimated for minimizing the Akaike information criterion (AIC) and maximizing the likelihood ratio test (LRT). This binary logistic regression showed the probability of the effects of the independent variables (predictors) on the dependent variables (Lesschen et al., 2005) [53]:
where
- Y is the dependent variable indicating the likelihood that Y = 1;
- is the constant term (intercept);
- … are the coefficients of associated independent variables;
- … are the independent variables.
We computed the average marginal effects (AME) [54], the pseudo R-squared value (Nagelkerke) and Likelihood ratio test (Lesschen et al., 2005) in addition to model fit statistics.
These analyses were carried out using the package questionnaire [55], margins [54] and stats of R software [56].
Data collected through FGDs and key informant interviews were coded, meaningful descriptions were identified and a causal loop diagram was developed from insights of these discussions. The latter, representing a thematic map of analysis, was created to determine the relationships between perceived drivers, impacts, consequences, control and mitigation strategies of deforestation and land degradation using VENSIM PLE.
3. Results
3.1. Trends of LULC Change
3.1.1. Classification Accuracy Assessment
The results of the accuracy assessment based on errors to estimate the quality of the classified images produced using the RF model are shown in the confusion matrix in Table 2. The accuracy assessment showed an overall accuracy of 97.34% and 94.53% with a kappa coefficient of 0.95 and 0.92, respectively, for 1987 and 2015. The out-of-bag (OOB) error was estimated at 2.5% in 1987 and 2.63% in 2015. The results showed confusions between dense forests, degraded forests, other cash crops and food crops–fallows.
Table 2.
Confusion matrix based on pixels of the LULC of 1987 and 2015 of south-western Côte d’Ivoire.
3.1.2. LULC Change Analysis
The supervised classification using the RF algorithm produced LULC maps covering 1987 and 2015 (Figure 3). These maps showed that during the 28-year period, forest cover decreased drastically, except the TNP, while agricultural land increased. The maps also revealed permanent forest loss in the Goin-Debe forest reserve due to agricultural expansion.
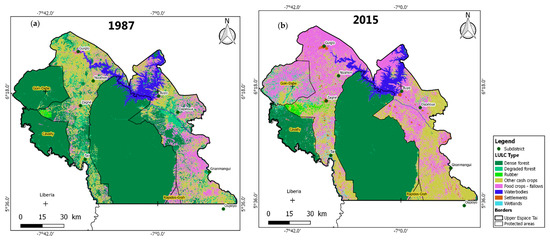
Figure 3.
LULC map of 1987 (a) and 2015 (b) of the Upper Espace Taï, Côte d’Ivoire.
The coverage areas of each of the eight classes identified in the Upper Espace Taï Region and LULC change trends from 1987 to 2015 are presented in Table 3. In 1987, dense forests were the most dominant LULC in the landscape, covering 58.15% of the total studied area, followed by other cash crops (19.35%), food crops/fallows (10.55%), degraded forests (6.64%), waterbodies (4.81%), rubber plantations (0.24%), settlements (0.24%), and wetlands (0.02%). The same trend was observed in 2015 with a substantial decrease in dense forestlands (38.88%) and an increase in agricultural lands (food crops, other cash crops and wetlands). During the studied period, dense forests, degraded forests and waterbodies harshly declined in the landscape with the highest net loss found in dense forestlands (2071.56 km2) with an annual rate of 1.44% per year, followed by degraded forestlands (432.94 km2) at a rate of 3.33% per year. Conversely, rubber plantations, other cash crops, food crops/fallows, wetlands and settlements substantially expanded in the same period. The highest net gain was in food crops/fallows (1793.95 km2) with an annual rate of 3.39% per year, followed by other cash crops (338.76 km2) at an annual rate of 0.59% per year. Rubber plantations, settlements and wetlands experienced the strongest gains at an annual rate of 6.98%, 7.06% and 13.16% per year, respectively.
Table 3.
LULC change trends in the Upper Espace Taï Region over the period 1987–2015 in south-western Côte d’Ivoire.
In the different forest management zones found in the landscape, LULC trends differed according to their management type (Table S2).
In gazetted forests, results revealed that dense forestlands declined from 93.79% in 1987 to 37.85% in 2015 at an annual rate of 3.24% per year and a net loss of 31.09 km2/year. The other LULC experienced substantial gains in the studied period. Wetlands (13.25%/year), settlements (8.87%/year), rubber plantations (8.81%/year), other cash crops (8.57%/year), food crops (8.17%/year) and degraded forests (8.09%/year) registered strong gains between 1987 and 2015. In the rural area, the results showed that the area occupied by dense forests decreased from 23.34% to 1.6%, representing a net loss of 1201.65 km2, followed by degraded forests, which lost 612.26 km2 between 1987 and 2015. Dense forests, degraded forests and waterbodies decreased at an annual rate of 9.57%, 8.71% and 0.14% per year. On the other hand, wetlands experienced strong gains at an annual rate of 13.14% per year, followed by settlements, rubber plantations, food crops/fallows and other cash crops, increasing at a corresponding rate of change of 7.14%, 6.88%, 3% and 0.11% per year, respectively.
3.1.3. LULC Change Matrix
The LULC changes from one class to another in comparison with the total area of each LULC class from 1987 to 2015 were assessed using a crosstabulation change matrix. This matrix showed the magnitude of LULC changes taking place within the landscape in different LULC types (Table 4). In the studied area, all LULC types experienced changes and the intensity of change differed according to their type. During the 28-year period, 91.06% of waterbodies did not experience any change, followed by rubber plantations (84.91%), settlements (77.33%), dense forests (65.98%), food crops–fallows (47.17%), other cash crops (39.23%), degraded forests (2.9%) and wetlands (0.63%).
Table 4.
LULC change matrix from 1987 to 2015 in south-western Côte d’Ivoire.
Dense forests and degraded forests were mainly converted into agricultural lands (other cash crops and food crop–fallow areas). The majority of other cash crops was converted to food crop–fallow areas (1067.98 km2). Conversely, the majority of food crops–fallows transitioned to other cash crops areas (504.4 km2). A small proportion of rubber plantations (12.68%) were converted to other cash crops areas. The marginal areas of waterbodies (34.58 km2) have become food crop–fallow areas. Moreover, 16.05% of settlements transitioned to food crop–fallow areas. Urbanization consumed agricultural lands (wetlands, food crops–fallows and other cash crops). Almost 64.12% of wetlands have been transformed into food crops–fallows in the landscape.
3.2. Farmers’ Perceptions
3.2.1. Socioeconomic and Demographic Characteristics of Sampled Households
The socioeconomic and demographic attributes of the sampled households are presented in Table 5. Most respondents (82.2%) were men between the ages of 17 and 81 with an average of 43.5 years. These respondents were either the head of the household (74.21%) or relatives of the head of household (24.58%). In this population, half of the heads of households were over 41 years old and only 5% of them were under 20 years old. The average age of the wives of heads of households was 33 years. About 86.86% of heads of households were married and only 9% of those interviewed were single. Regarding their education status, 75% of the respondents were literate (having been in school for at least five years) with an average of 2.55 years expended at school and 25% had never attended school. A large share (75%) of their wives had spent less than five years in the formal education system.
Table 5.
Sampled household characteristics in the studied landscape (N = 411) in south-western Côte d’Ivoire.
The results also indicated that the household size ranged from one person to 16 people, with an average of 7.92 persons with a 50:50 ratio between men and women. All the sampled households (100%) were engaged in farming activities and agricultural activities remained the main source of income for the households interviewed. It is also worth noting that a larger proportion (90%) of households depended mainly on agriculture. The majority (75.18%) of the respondents grew cocoa and their cocoa farm size varied from 0.5 to 71 hectares, with an average of 5.19 hectares.
3.2.2. Migration in the Region
The analysis of data revealed that more than half (50.12%) of the households in the study were non-native migrants. Native people from surveyed localities represented 8.27% of the sampled population. The Ivorians from other regions occupied 41.61% of the sample. The internal migration was strongly dominated by Baoulé (52.63%).
The respondents settled in the landscape for about 22 years. This value was 25 years for the Ivorian non-native migrants. These trends clearly showed that non-native populations settled long before the socio-political crisis in Côte d’Ivoire. These migrants were engaged in various activities, which impacted the land cover, as revealed the analysis of the questionnaire and focus group discussions.
3.2.3. Perception of Forest
In a participatory rural appraisal, households defined the forest as “a set of trees” or “a place where large trees can be found in large numbers”. The study showed that the types of forests found in the areas were composed of primary forests (23.84%), secondary forests (59.37%), gazetted forests (51.82%) and open forests (45.99%). The other types of forest identified by households were sacred forests, village forests and fallows. Firewood (91%) and lumber (69.1%) were the main wood products from the forests of these different study locations. Populations use firewood as domestic fuel while timbers were mainly intended for marketing.
About 59.85% of the surveyed households indicated a great contribution of non-wood forest products to their income as opposed to the rest for whom there is no contribution.
3.2.4. Drivers of Deforestation and Land Degradation
- Deforestation
The study indicated that the majority (89.78%) of the households found that deforestation was a reality in the study area. It resulted from an increase in the cultivated area and a reduction of the forest cover and the number of trees compared to the past. Significant differences (p < 0.05) were found between farmers’ perceptions of deforestation and surveyed sites, while no significant differences were identified between deforestation experience and household characteristics (age and gender). Deforestation took place at a rapid rate according to 32.36% of questioned people, while for 33.4% and 28.95% of the respondents, it occurred moderately and slowly, respectively. However, key informants from different institutions and FGDs perceived that the forest cover had considerably declined from 1987 to 2015.
The perceived causes of deforestation are presented in Figure 4. The results showed that extensive agriculture (97.08%), shifting cultivation (48.91%), logging (47.69%) and fuelwood consumption (28.71%) remained the main direct drivers of deforestation. Harvesting practices, charcoal production, bushfires and infrastructure development such as roads and schools contributed to deforestation in a relatively small proportion (Figure 4a).
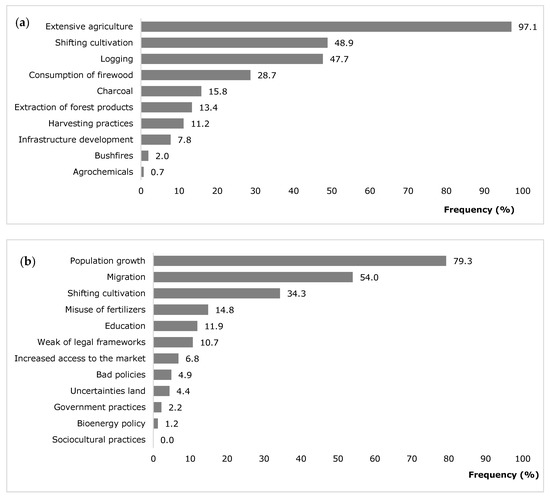
Figure 4.
Perceived (a) direct and (b) indirect causes of deforestation in the study area in south-western Côte d’Ivoire.
This study revealed that the main indirect causes of deforestation were population growth (79.82%), migration (54.01%) and shifting cultivation practices (34.3%). Only a small proportion of interviewees indicated that the misuse of fertilizers and herbicides, education, weak legal frameworks, poor policies, increased market access, and land tenure uncertainties were part of the underlying drivers of deforestation (Figure 4b).
Agriculture remained the main driver of rapid and moderate deforestation (94.4%) because it represented the most important means of subsistence for households. In addition to human activities causing deforestation, other factors mainly due to environmental issues include droughts and bushfires driven by lightning.
- Land degradation
In addition to deforestation, lands were also exposed to degradation as a result of cultural practices and other human activities (Figure 5). The study showed that nutrient depletion (72.02%) was the most important cause of land degradation. The shortening of the fallow period (46.72%) and the inappropriate application of inputs (31.39%) also contribute to land degradation. Only a small percentage of people interviewed stated that overgrazing, war and conflict, inappropriate irrigation and the occurrence and spread of weeds and invader plants and bush encroachment could contribute to land degradation in the study area.
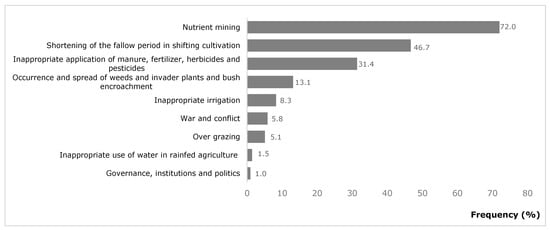
Figure 5.
Perceptions of the causes of land degradation in the community in south-western Côte d’Ivoire.
3.2.5. Effects and Benefits of Deforestation
According to respondents, the effects of deforestation could be either positive (51.34%) or negative (48.66%). On the one hand, the study showed that negative effects linked to deforestation on community and ecosystems encompassed land degradation (70.6%), loss of biodiversity (63.8%), global warming (56.9%) and loss of livelihood assets (54.3%) (Figure 6a). Besides, deforestation increased household poverty mainly by causing a loss of production (69.6%), reducing land availability (61.6%), the loss of biodiversity (61.1%), increasing temperature (56%) and drought (37.7%) (Figure 6b). Furthermore, the study revealed that deforestation had socioeconomic effects by reducing food production (89.8%), reducing income (72%), and increasing health problems (46.2%). A small proportion (9%) of households experienced a loss in spiritual, aesthetic, cultural landscape and heritage values (Figure 6c).
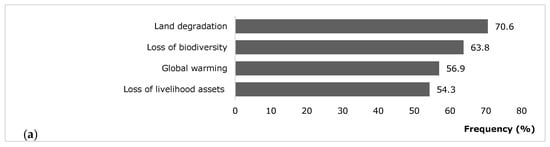
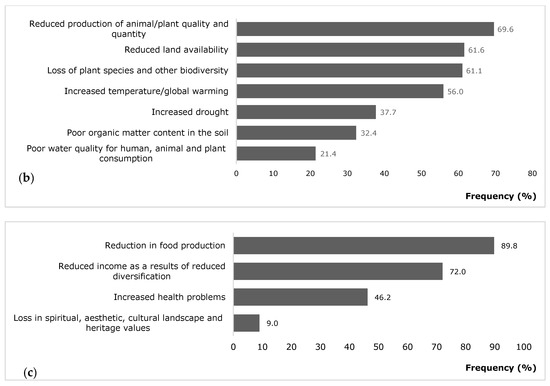
Figure 6.
Perception of the negative effects of deforestation on (a) community, (b) production services and (c) socio-economic activities in south-western Côte d’Ivoire.
On the other hand, the results of the study revealed that deforestation had notable socio-economic benefits for households by contributing to livelihoods (85.6%) and by representing a source of income (88.6%) and employment (30.2%). By deforesting lands, farmers established food and cash crops while foresters set up sawmills that provided income and contributed to their livelihoods. Besides, sawmills are established in the landscape. These farms and sawmills are a source of employment for some young people looking for quick revenue.
3.2.6. Perceived LULC Trends
Local people experienced a dramatic change in LULC over the last 30 years in the study area. Significant differences were found among the interviewed households in perceptions about LULC changes and surveyed sites (p < 0.001). However, no significant differences were observed between LULC trends and household characteristics (age and gender). Respondents perceived that shrubland, woodland and forestland considerably declined in the studied landscape. Results showed that 89.9%, 77.7% and 94.9% of local communities correctly perceived that woodland, shrubland and forestland declined, respectively (Figure 7). Conversely, agricultural land and grassland had notably increased.
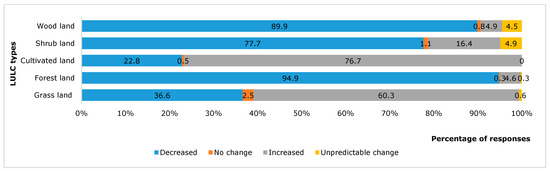
Figure 7.
Respondent perceptions of observed trends at the landscape level in south-western Côte d’Ivoire.
Key informants from different institutions and FGDs also correctly perceived that forest cover and woodland drastically declined in the last decades from 1987 to 2015 due to the creation and expansion of farms, as well as mining activities. Inversely, agricultural land and grassland increased in the studied landscape.
3.2.7. Strategies to Reduce and Prevent Deforestation
Deforestation could be reduced by implementing adapted strategies to the region. In this study, the respondents argued that the main strategies to reduce deforestation were reforestation (41.2%), forest protection (26.8%), repression (18.2%) and sensitization (16.6%) (Figure 8). A small proportion proposed non-logging (8.1%), fallowing (3.9%), off-forest income-generating activities (3.9%) or other strategies (10%) such as participatory forest management, reducing agricultural lands, payment for ecosystem services, etc.
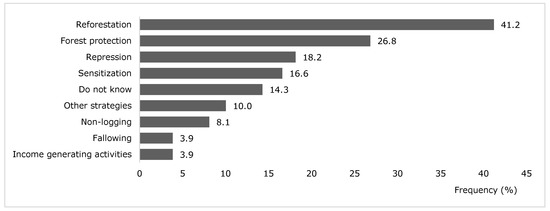
Figure 8.
Perceptions of main strategies against deforestation in the community of south-western Côte d’Ivoire.
Similar results were also revealed during key informant interviews and FGDs with reforestation through agroforestry and forest plantation, forest protection, repression and sensitization to fight against the loss of forest reserves.
The findings of this study in a participatory approach regarding drivers, consequences, control measures and mitigation of deforestation and land degradation are summarized in the simplified causal loop diagram (Figure S1).
3.3. Comparison of GIS-Based LULC Trends and Farmers’ Perceptions
Regarding GIS-based analysis, our results showed that 89.78% of farmers perceived a change (deforestation) in the landscape. Socioeconomic factors affecting this perception were presented in Table 6.
Table 6.
Socioeconomic determinants affecting respondents on perceived deforestation.
The results showed that the household head education level, agricultural income, origin and duration of residence positively and significantly (p < 0.05) affected experiencing deforestation by household. For every year increase in the duration of residence, the probability of perceiving deforestation significantly increased by 0.6%. For every discrete change in the number of natives, the number of household heads attending secondary school and the number of households that do not know their agricultural income positively and significantly increased the probability of deforestation experience in the landscape while every discrete change in the number of households without agricultural income negatively influenced deforestation perception.
Furthermore, only farmers that perceived that forest lands and woodlands decreased while cultivated lands, shrublands and grasslands increased had the good perception of LULC change trends. The determinants of the good perception of forestlands, cultivated lands, shrublands, grasslands and woodland trends are presented in Tables S2–S6.
4. Discussion
4.1. Trends in LULC Change
The high kappa coefficient for RF classification models is encouraging, and the model accuracy performance is consistent with studies that have successfully discriminated LULC categories in other natural environments using RF [57,58]. The overall accuracies of classifications are greater than 94% with a kappa coefficient above 0.92 (Table 2) showing that the results of these classifications are excellent according to Landis and Koch [59] and Girard and Girard [60]. Indeed, according to accuracy standards proposed by these authors, a kappa coefficient higher than 0.80 shows an “Excellent” classification result, while a kappa between 0.61 and 0.80 indicates a “Good” classification result. Confusions identified in LULC classes could be explained by the complexity and the heterogeneity of the landscape [61]. Additionally, issues in selecting determined LULC classes on colour composite including similarity in different LULC class spectrum (different objects having the same spectrum) and differences in the LULC class spectrum (same objects having different spectra) could lead to misclassification [62].
The significant decline of forestlands (dense forests and degraded forests) experienced in the landscape during the studied period was executed to benefit agricultural activities. This conversion of forestlands to agricultural lands was carried out for economic purposes. Indeed, due to the constant high price of cocoa and other cash crops, farmers migrate into the region to grow cash crops, mainly cocoa, which substantially threatens biodiversity [63]. This situation was similarly consistent in all forest management zones, except in the protected area, where forestlands remained unchanged. Forest conservation in this late area is due to the protection and coercive efforts through the increased monitoring of forests that permitted the conversion of degraded lands into forests [64,65]. However, in the gazetted forests, forestlands experienced massive encroachment for agricultural expansion purposes, even though there are some remaining forests ecosystems in the gazetted forest of Cavally. Indeed, gazetted forests have been illegally infiltrated since the 1990s following foreign migrations in the region [66]. The encroachment is ubiquitous in areas where intensive logging has taken place in the past or in inhabited areas that have developed over the years. The level of deterioration observed in the gazetted forests is a sign of failure in forest management. The institution responsible for forest resource management at the local and national level (SODEFOR) face complex challenges that almost prevent them from fully applying forest laws. The results reported by Koné [65] and Amani [67] identify institutional weaknesses as contributing factors to forest encroachment in gazetted forests. Moreover, the socio-political crisis during the period 2002 to 2011 emphasised legal and institutional weaknesses and facilitated a massive migration and infiltration of predominantly foreign populations into gazetted forests for cocoa growing, which has negatively impacted the forestlands [28,64,68,69,70,71].
The severe forestland decline experienced in rural areas (off-protected and gazetted areas) is due to their conversion into cocoa plantations. Indeed, landowners perceive positive short-term returns from agricultural activities and negative returns by conserving the forest. Therefore, agricultural expansions represent the major threat of forest ecosystems in the landscape. Several authors underline that cocoa crops are traditionally established at the detriment of primary forests in Côte d’Ivoire [16,21,72,73]. Moreover, some authors reported the deterioration of living conditions for cocoa communities in rural areas due to ageing cocoa plantations and land degradation resulting in lower productivity, increased susceptibility of cocoa plantations to climate change impacts and pests and diseases attacks in Côte d’Ivoire [26,74,75,76]. This situation increased the migration of communities into gazetted forests for fertile lands favourable for farming [28]. Furthermore, the results of this study highlight that settlements expanded in the landscape by about seven-fold, from 25.39 km2 to 183.11 km2, representing a net gain of 157.71 km2. The high expansion rate of settlements is due to the development of residential areas for economic purposes (agriculture, business, trade, etc.). The presence of major roads in the landscape accelerated the expansion of settlements and forest encroachment [19,77]. Globally, Liu et al. [78] showed that cities have expanded by 80% from 1985 to 2015. This expansion, impacting agricultural lands, is linked to population growth and showed the incapacity of available inhabited lands to sustain population growth [78].
Our results suggest that wetland areas substantially changed in the landscape. The low area of wetlands in 1987 and the high conversion rate of wetlands into other LULC classes could be explained by the fact that heavy crown cover hides wetlands in the satellite images. Baker et al. [79] argued that Landsat imagery is often unable to distinguish between a feature’s different sub-classes, particularly in wetlands in heavy forestlands.
4.2. Local People Perceptions
The findings of this study, based on household surveys, FGDs, and key informant interviews, showed that people moved to the region three decades ago. These results were consistent with those of Varlet [80] who found that the region has experienced two major waves of migration, the first consisting of Ivorian migrants in the 1970s and the second composed of non-Ivorian migrants around the 1980s. The third wave of migration occurred during the recent socio-politics crisis of Côte d’Ivoire. These migrations, for agricultural purposes, have negatively impacted the landscape of the south-western region of Côte d’Ivoire [19,81].
Besides migration, local farmers perceived agricultural expansion, logging, firewood collection, charcoal production and settlements as the important direct causes of deforestation in the Espace Taï. These drivers were triggered by population growth, migration, land misuses, lack of education, lack of law enforcement and bad policies, and land tenure uncertainties. These findings are consistent with other similar studies done in other parts of the world [32,33,77,82,83,84,85,86,87,88]. Agriculture (extensive agriculture and shifting cultivation) is the major cause of deforestation, basically due to farming practices. Key reasons may be the result of the relatively low usage of sustainable intensification strategies that will enable farmers to increase production on relatively smaller land size. Most of the farmers still use rudimentary farming practices including shifting cultivation, which is extensive and requires more forest to be cleared when other parts are being left to fallow. Earlier studies in Côte d’Ivoire found expansion of agricultural lands driven by population growth, flexible immigration policies and the economic attractiveness of cash crops as the main driver of deforestation in Côte d’Ivoire [9,19,64,65,73,89,90]. Furthermore, between 1998 and 2014, the population of the area increased from 384,981 to 842,640 inhabitants, with an annual growth rate of 4.89%, almost double the national rate of 2.55% [34]. Firewood collection and charcoal production are part of the most important proximate causes of deforestation in the region. This is also directly associated with the fact that rural populations rely exclusively on firewood and charcoal for cooking [64]. Of course, about 87% of the Ivorian population depend on firewood and charcoal for energy [9]. This situation is triggered by the high poverty level and low coverage of electricity and alternative sources of energy. Additional factors include the lack of legal enforcement and population education [65].
Regarding land degradation, the main drivers encompassed nutrient mining, shortening of the fallow period in shifting cultivation and inappropriate application of manure, fertilizer, herbicides and pesticides as the most important causes of land degradation. Mbow et al. [91] argued that land degradation is a multi-faceted and complex phenomenon aggravating poverty that can be seen as both a cause and a consequence of nutrient and land resource depletion. Moreover, Stocking and Murnaghan [92] showed that nutrient mining is the biggest cause of fertility decline in the land degradation process. Furthermore, the drivers of this process vary from place to place and over time, according to specific human environment conditions [93]. Land degradation can also lead to loss of vegetation cover and thus makes them susceptible to climatic hazards such as droughts and wildfires [93].
Local farmers interviewed for this study highlighted land degradation, loss of biodiversity, global warming and loss of livelihood assets as negative effects of deforestation. Rural communities in the wider TNP area depend on sales of forest and agricultural products and systematically perceived each change in the landscape including landscape degradation, biodiversity loss, decline or failure of agricultural production, decline in soil fertility, frequent and prolonged droughts and erratic rainfall. Several studies emphasised the impact of deforestation on rainfall declining. Deforestation exacerbated evapotranspiration decline and can reduce rainfall by up to 50% over the Congo basin [94]. Moreover, deforestation affects biodiversity by destroying habitats and reducing animal populations. Bitty et al. [13] argued that drastic deforestation in gazetted forests particularly reduced primate populations in Côte d’Ivoire and exposed animals to poaching and trafficking. Moreover, deforestation is driving global warming by increasing the concentrations of greenhouse gases (GHGs) in the atmosphere, which could negatively affect cocoa farming and the cocoa belt in Côte d’Ivoire and Ghana in the future [95]. This situation could explain the failure of cocoa replanting in the country [15,74]. The climatic uncertainty and the decrease in the forested areas lead to an important decline in agricultural productivity [96].
Even though negative effects seem to be the norm, our study showed that deforestation can generate some very short-term and unsustainable benefits. Forest clearance for agricultural purposes and charcoal production enhance farmers’ livelihoods and represent the main source of income and employment in the region. Therefore, the economic benefits from tree crops drive their expansion but not their intensification, thereby causing more forest clearing, especially in areas with weak enforcement of forest protection laws [82].
The results of this study, according to the regression analysis of household interviews, revealed that determinants of deforestation perception in the study area included the household head’s education level, agricultural income and the origin and duration of residence. This result is likely explained by the fact that households that have more agricultural income have deforested more land for producing food and cash crops compared to households that have less agricultural income. Additionally, the duration of residence linked to the origin of households and the different waves of migration experienced by the region has a great part in deforestation. Natives are considered as forest-friendly users as forests provide them several services (food, medicine, etc.) while migrants, driven by incomprehensive land policies (“land belongs to those who cultivate it”), as well as the desire to rapidly make a profit from their investments and take over and secure landownership, massively destroy forests for agricultural purposes mainly to grow cocoa due to its attractive farm gate price. These findings are consistent with several studies undertaken in the region [19,80,81,97]. Wyman and Stein [98] revealed that increased household head education was highly correlated with a decreased probability of deforestation in Belize.
We also found that forestlands and woodlands have declined while agricultural lands, shrublands and grasslands have increased in the landscape. These results are confirmed by the results of the remote sensing data analysis, which emphasised a drastic decline in forestlands and a sharp increase in agricultural lands between 1987 and 2015 in the wider TNP region. The results of this study resonate with other similar studies in Côte d’Ivoire [11,28,69,70,71] The socioeconomic factors that lead to the perception of these trends by smallholder households are multi-fold, including the age for forestland decline and the origin of respondents for cultivated land increase. This result suggests that households lead by aged men are more likely to identify a forest cover trend in the landscape. Migrants are susceptible to establish several agricultural activities and may find the correct trend of cultivated lands.
Therefore, reforestation through forest plantations and agroforestry is the main strategy for forest restoration in the landscape according to interviewees. These results are consistent with several studies undertaken in the region which showed the willingness of farmers to plant compatible tree species in their cocoa farms to sustain its production [39,99]. Shaded cocoa agroforestry, which does not involve the total removal of trees, has been reported to provide comparable revenues for farmers while preserving elements of habitat critical for animal populations [13]. Farmers’ interest and willingness to adopt this practice are driven by extension and certification programs [99]. Therefore, extension efforts should continue and forestry policies should support certification programs and propose other payment for ecosystem services to encourage farmers in cocoa agroforestry adoption. Abdulai et al. [100] found that accessibility to training on good agricultural practices, the availability of quality planting materials (access to hybrid cocoa seeds) and the cultivation of the optimum plot size to ensure high input use and management efficiency are some important factors for yield improvement to avoid potential deforestation in the climatically suitable wetter zones or remaining forest areas. In degraded gazetted forests, Bitty et al. [13] suggested forest regeneration focusing on native tree species in line with forest landscape restoration principles [101] and ecological restoration principles and standards [102]. Natural forest regeneration is more cost-effective than tree planting and has better biodiversity outcomes including high carbon sequestration [103].
A continuum of strategies starting from avoidance (sensitization, protection, repression, stop grazing, etc.) to mitigation (rehabilitation) and then to restoration should be implemented to tackle deforestation in the landscape. Strengthening and enforcing forest protection laws supplemented by a large and effective awareness could minimise the extent of agricultural encroachment into forests and preserve biodiversity within and around protected areas [82,104]. In contrast, Kesse [105] found that the repressive forestry policy combined with land tenure legislation failed to encourage local people to use forests sustainably and lead SODEFOR to promote a participatory forest management approach. Traditionally, the foresters are trained as para-militaries and their advisory role is not obvious on the ground. The new forest policy on forest preservation, rehabilitation and expansion focused on an inclusive, participative and multi-stakeholder approach to regreen the country by increasing forest cover above 20% of its total area through gazetted forest protection, agroforestry promotion and large-scale reforestation, and should therefore be implemented in a land-use planning and incentives approaches.
5. Conclusions
The current study investigated the trends and the driving forces of LULC change in south-west Côte d’Ivoire using a mixed-method approach including remotely sensed data, ground-truthing data and various socio-economic data analysis.
Firstly, the remote sensing data analysis revealed that LULC trends showed massive deforestation experienced around the TNP and in the forest reserves of Goin Débé and Cavally. Conversely, agricultural lands showed a substantial upward trend.
Secondly, the household survey showed that the natural factors included drought, wildfires, and soil erosion and anthropogenic factors including the conversion of forestlands to agricultural lands, mainly cash crops such as cocoa, oil palm, rubber and coffee, were the main drivers. Although respondents perceived deforestation to have negative consequences, such as a decline in land quality for production and rainfall reduction, some positive aspects, such as its contribution to income, were perceived.
Thirdly, the comparison of the household survey and GIS-based LULC trend showed that local farmers have a good perception of LULC change. This perception corresponds in the majority of cases to the analysis of satellite data. At the scale of the landscape, various strategies including awareness raising, forest protection, and reforestation have been adopted to address the issue of deforestation and land degradation. Agroforestry also appears to be a solution to reconcile the benefits of trees and the sustainable livelihoods of communities through agricultural production. Further researches should focus on the way to enhance farmers’ true participation, leading to wider adoption of sustainable agricultural practices to enhance yield, restore soil fertility and reduce pressure on forestlands.
Supplementary Materials
The following are available online at https://www.mdpi.com/article/10.3390/land10040429/s1, Figure S1: Photographs of visited land uses in the Espace Taï, Figure S2: Causal loop diagram from focus group discussions examining drivers, consequences, control and mitigation strategies of deforestation and land degradation in south-western Côte d’Ivoire, Table S1: LULC change trends in different forest management domains in the Upper Espace Taï Region over the period 1987 to 2015 in south-western Côte d’Ivoire, Table S2: Socioeconomic determinants affecting respondents good perception of the trend of cultivated lands, Table S3: Socioeconomic determinants affecting respondents good perception of the trend of cultivated lands, Table S4: Socioeconomic determinants affecting respondents good perception of the trend of grasslands, Table S5: Socioeconomic determinants affecting respondents good perception of the trend of shrublands, Table S6: Socioeconomic determinants affecting respondents good perception of the trend of woodlands.
Author Contributions
Conceptualization, J.-L.K., A.G., L.D. and C.K.; methodology, J.-L.K., A.G. and L.D.; data curation, J.-L.K.; writing—original draft preparation, J.-L.K.; writing—review and editing, J.-L.K., A.G., L.D. and C.K.; supervision, Y.B.; project administration, C.K.; funding acquisition, C.K. All authors have read and agreed to the published version of the manuscript.
Funding
This research was funded by IDH—The Sustainable Trade Initiative through the Initiative for Sustainable Landscapes (ISLA), grant number LND.40.2015.1.
Data Availability Statement
The household dataset generated and analysed during the current study is available in the Mendeley repository: [http://dx.doi.org/10.17632/rvd9nbxtdr.2 (accessed on 9 April 2021)].
Acknowledgments
We acknowledge the use of data available from the U.S. Geological Survey. We are also grateful to all the team of enumerators involved in this study led by Roland Aka. This research was approved by the Autorité de Régulation des Télécommunications de Côte d’Ivoire (ARTCI), License Number 2017-0279.
Conflicts of Interest
The authors declare no conflict of interest.
References
- Osei-Tutu, P.; Nketiah, K.; Kyereh, B.; Owusu-Ansah, M.; Faniyan, J. Hidden Forestry Revealed: Characteristics, Constraints and Opportunities for Small and Medium Forest Enterprises in Ghana; Tropenbos International and International Institute for Environment and Development: London, UK, 2010. [Google Scholar]
- Appiah, M.; Blay, D.; Damnyag, L.; Dwomoh, F.K.; Pappinen, A.; Luukkanen, O. Dependence on forest resources and tropical deforestation in Ghana. Environ. Dev. Sustain. 2009, 11, 471–487. [Google Scholar] [CrossRef]
- Shackleton, C.M.; Shackleton, S.E.; Buiten, E.; Bird, N. The importance of dry woodlands and forests in rural livelihoods and poverty alleviation in South Africa. For. Policy Econ. 2007, 9, 558–577. [Google Scholar] [CrossRef]
- Gerber, N.; Nkonya, E.; von Braun, J. Land Degradation, Poverty and Marginality. In Marginality; Springer Netherlands: Dordrecht, The Netherlands, 2014; pp. 181–202. [Google Scholar] [CrossRef]
- BNETD. Réalisation d’une Étude Sur: Identification, Analyse et Cartographie des Causes de la Déforestation et de la Dégradation des Forêts en Côte d’Ivoire; Bureau National d’Etudes Techniques et de Développement (BNETD): Abidjan, Côte d’Ivoire, 2016.
- FAO. SEP-REDD+. Données Forestières de Base Pour la REDD+ en Côte d’Ivoire: Cartographie de la Dynamique Forestière de 1986 à 2015; FAO: Abidjan, Côte d’Ivoire, 2017. [Google Scholar]
- World Bank. Pour que Demain ne Meure Jamais: La Côte d’Ivoire Face au Changement Climatique; World Bank Group: Washington, DC, USA, 2018. (In French) [Google Scholar]
- Chatelain, C.; Dao, Q.-H.; Gautier, L.; Spichiger, R.-E.; Dao, H.; Gautier, L.; Spichiger, R.-E. Forest cover changes in Côte d’Ivoire and Upper Guinea. In Biodiversity of West African Forests: An Ecological Atlas of Woody Plant Species; Poorter, L., Bongers, F., Kouamé, F.Y.N., Hawthorne, W.D., Eds.; CABI Publishing: Wallingford, UK, 2004; pp. 15–32. [Google Scholar]
- Etc Terra-Rongead; BNETD. Analyse Qualitative des Facteurs de Déforestation et de Dégradation des Forêts en Côte d’Ivoire; Ministère de l’Environnement et du Développement Durable: Abidjan, Côte d’Ivoire, 2016.
- Brou, Y.T.; Oszwald, J.; Bigot, S.; Servat, E. Risques de déforestation dans le domaine permanent de l’État en Côte d’Ivoire: Quel avenir pour ses derniers massifs forestiers? Télédétection 2005, 5, 105–121. [Google Scholar]
- Chatelain, C.; Bakayoko, A.; Martin, P.; Gautier, L. Monitoring tropical forest fragmentation in the Zagné-Taï area (west of Taï National Park, Côte d’Ivoire). Biodivers. Conserv. 2010, 19, 2405–2420. [Google Scholar] [CrossRef]
- Agbo, A.E.; Kouamé, C.; N’Doua, N.D.; Kouassi, A.; Brou, K. Assessment of Cocoa Producers’ Children Nutritional Status in the Nawa Region, Côte d’Ivoire. J. Food Nutr. Res. 2017, 5, 606–613. [Google Scholar] [CrossRef][Green Version]
- Bitty, E.A.; Gonedele Bi, S.; Bene, J.-C.K.; Kouassi, P.K.; McGraw, W.S. Cocoa Farming and Primate Extirpation Inside Cote d’Ivoire’s Protected Areas. Trop. Conserv. Sci. 2015, 8, 95–113. [Google Scholar] [CrossRef]
- Benhin, J.K.A.; Barbier, E.B. Structural Adjustment Programme, deforestation and biodiversity loss in Ghana. Environ. Resour. Econ. 2004, 27, 337–366. [Google Scholar] [CrossRef]
- Ruf, F.O. Tree crops as deforestation and reforestation agents: The case of cocoa in Côte d’Ivoire and Sulawesi. In Agricultural Technologies and Tropical Deforestation; Angelsen, A., Kaimowitz, D., Eds.; CABI: Wallingford, UK, 2001; pp. 291–315. [Google Scholar] [CrossRef]
- Ruf, F.O.; Zadi, H. Cocoa: From Deforestation to Reforestation. In Proceedings of the First International Workshop on Sustainable Cocoa Growing, Panama City, Panama, 29 March–3 April 1998; p. 36. [Google Scholar]
- Ekanza, S.-P. Pillage, fraude et corruption sur la filière du bois. In Le Modèle Ivoirien en Questions: Crises, Ajustements, Recompositions; Contamin, B., Memel-Fotê, H., Eds.; KARTHALA & ORSTOM: Abidjan, Côte d’Ivoire, 1997; pp. 191–204. [Google Scholar]
- Affou, Y.; Tano, K. La boucle du cacao en Côte d’Ivoire: Une situation migratoire inverse. In Migration, Changements Sociaux et Développement; Quesnel, A., Vimard, P., Eds.; ORSTOM: Paris, France, 1991; pp. 307–315. [Google Scholar]
- Ruf, F.O.; Varlet, F. The myth of zero-deforestation cocoa in Côte d’Ivoire. In Zero Deforestation: A Commitment to Change; Pasiecznik, E.N., Savenije, H., Eds.; Tropenbos International: Wageningen, The Netherlands, 2017; pp. 86–92. [Google Scholar]
- Kolongo, D.T.S.; Decocq, G.; Yao, C.Y.A.; Blom, E.C.; Van Rompaey, R.S.A.R. Plant Species Diversity in the Southern Part of the Taï National Park (Côte d’Ivoire). Biodivers. Conserv. 2006, 15, 2123–2142. [Google Scholar] [CrossRef]
- Ruf, F.O.; Schroth, G. Chocolate forests and monocultures: A historical review of cocoa growing and its conflicting role in tropical deforestation and forest conservation. In Agroforestry and Biodiversity Conservation in Tropical Landscapes; Schroth, G., da Fonseca, G.A.B., Harvey, C.A., Gascon, C., Vasconcelos, H.L., Izac, A.-M.N., Eds.; Island Press: Washington, DC, USA, 2004; pp. 107–134. [Google Scholar]
- Ouattara, A.A.; Krouba, G.l.D.; Kouakou, A.C.A.; Adopo, A.l.R.; Fauret, P.; Coulibaly, B.; Kaba, D.; Koffi, Y.J.J.; Assi Kaudjhis, J.P.; Courtin, F. Pression anthropique et dynamique paysagère en zone de forêt ivoirienne dans la région de Méagui. Tropicultura 2018, 36, 183–194. [Google Scholar] [CrossRef]
- Diby, L.; Kouassi, G.; N’Guessan, M.P.; Yao, E.; Oro, F.; Aynekulu, E.; Kassin, E.; Kouame, C.; Coe, R.; Shepherd, K. Cocoa Land Health Surveillance: An Evidence-Based Approach to Sustainable Management of Cocoa Landscapes in the Nawa Region, South-West Côte d’Ivoire; World Agroforestry Centre (ICRAF): Abidjan, Côte d’Ivoire, 2014; Volume 193. [Google Scholar]
- Goula, B.T.A.; Savané, I.; Fadika, V.; Konan, B.; Kouadio, G.B. Impact de la variabilité climatique sur les ressources hydriques des bassins du N’Zo et N’Zi en Côte d’Ivoire (Afrique Tropicale Humide). VertigO 2006, 7, 1–12. [Google Scholar] [CrossRef]
- Goula, B.T.A.; Soro, E.G.; Kouassi, W.; Srohourou, B. Tendances et ruptures au niveau des pluies journalières extrêmes en Côte d’Ivoire (Afrique de l’Ouest). Hydrol. Sci. J. 2012, 57, 1067–1080. [Google Scholar] [CrossRef]
- Läderach, P.; Martinez-Valle, A.; Schroth, G.; Castro, N. Predicting the future climatic suitability for cocoa farming of the world’s leading producer countries, Ghana and Côte d’Ivoire. Clim. Chang. 2013, 119, 841–854. [Google Scholar] [CrossRef]
- Kouassi, J.-L.; Wandan, N.; Mbow, C. Assessing the Impact of Climate Variability on Wildfires in the N’Zi River Watershed in Central Côte d’Ivoire. Fire 2018, 1, 36. [Google Scholar] [CrossRef]
- Barima, Y.S.S.; Kouakou, A.T.M.; Bamba, I.; Sangne, Y.C.; Godron, M.; Andrieu, J.; Bogaert, J. Cocoa crops are destroying the forest reserves of the classified forest of Haut-Sassandra (Ivory Coast). Glob. Ecol. Conserv. 2016, 8, 85–98. [Google Scholar] [CrossRef]
- Kouadio, B.Y.; Dawson, J.O.; Mendoza, G.A. Deforestation and managerial scales in Côte d’Ivoire. J. Sustain. For. 2016, 35, 397–416. [Google Scholar] [CrossRef]
- Lambin, E.F.; Turner, B.L.; Geist, H.J.; Agbola, S.B.; Angelsen, A.; Bruce, J.W.; Coomes, O.T.; Dirzo, R.; Fischer, G.; Folke, C.; et al. The causes of land-use and land-cover change: Moving beyond the myths. Glob. Environ. Chang. 2001, 11, 261–269. [Google Scholar] [CrossRef]
- Lambin, E.F.; Meyfroidt, P. Global land use change, economic globalization, and the looming land scarcity. Proc. Natl. Acad. Sci. USA 2011, 108, 3465–3472. [Google Scholar] [CrossRef]
- Geist, H.J.; Lambin, E.F. Proximate Causes and Underlying Driving Forces of Tropical Deforestation: Tropical forests are disappearing as the result of many pressures, both local and regional, acting in various combinations in different geographical locations. Bioscience 2002, 52, 143–150. [Google Scholar] [CrossRef]
- Kleemann, J.; Baysal, G.; Bulley, H.N.N.; Fürst, C. Assessing driving forces of land use and land cover change by a mixed-method approach in north-eastern Ghana, West Africa. J. Environ. Manag. 2017, 196, 411–442. [Google Scholar] [CrossRef]
- INS. Recensement Général de la Population et de l’Habitat (RGPH) de 2014; Institut National de la Statistique: Abidjan, Côte d’Ivoire, 2014. [Google Scholar]
- Adou, Y.C.Y.; Blom, E.C.; Dengueadhé, K.T.S.; Van Rompaey, R.S.A.R.; N’Guessan, E.K.; Wittebolle, G.; Bongers, F. Diversité Floristique et Végétation dans le Parc National de Taï, Côte d’Ivoire; Tropenbos Côte d’Ivoire séries: Wageningen, The Netherlands, 2005. [Google Scholar]
- Girard, G.; Sircoulon, J.; Touchebeuf, P. Aperçu sur les régimes hydrologiques. In Le Milieu Naturel de la Côte d’Ivoire; Avenard, J.-M., Eldin, M., Girard, G., Touchebeuf, P., Guillaumet, J.-L., Adjanohoun, E., Perraud, A., Eds.; ORSTOM: Paris, France, 1971; pp. 109–155. [Google Scholar]
- Mund, J.-P. Rice production on inland-valleys soils (Bas-Fonds) of the south-west Ivory Coast—Agro-ecological conditions and specific pedological determinations. In Deutscher Tropentag 1999 in Berlin; Tropeng: Berlin, Germany, 1999; p. 12. [Google Scholar]
- Perraud, A. Les sols. In Le Milieu Naturel de la Côte d’Ivoire; Avenard, J.-M., Eldin, M., Girard, G., Touchebeuf, P., Guillaumet, J.-L., Adjanohoun, E., Perraud, A., Eds.; ORSTOM: Paris, France, 1971; pp. 265–391. [Google Scholar]
- Smith Dumont, E.; Gnahoua, G.M.; Ohouo, L.; Sinclair, F.L.; Vaast, P. Farmers in Côte d’Ivoire value integrating tree diversity in cocoa for the provision of ecosystem services. Agrofor. Syst. 2014, 88, 1047–1066. [Google Scholar] [CrossRef]
- Chatelain, C.; Kadjo, B.; Kone, I.; Refisch, J. Relations Faune-Flore Dans le Parc National de Taï: Une Étude Bibliographique; Tropenbos Côte d’Ivoire: Abidjan, Côte d’Ivoire, 2001. [Google Scholar]
- Chatelain, C. Possibilités d’application de l’imagerie Satellitaire à Haute Résolution Pour l’étude des Transformations de la Végétation en Côte d’Ivoire Forestière; Université de Genève: Genève, Switzerland, 1996. [Google Scholar]
- UICN/BRAO. Evaluation de L’efficacité des Aires Protégées: Parcs et Réserves de Côte d’Ivoire; UICN: Gland, Switzerland; Cambridge, UK, 2008. [Google Scholar]
- Martin, C. The Rainforests of West Africa: Ecology—Threats—Conservation; Birkhäuser Basel: Basel, Switzerland, 1991. [Google Scholar]
- Vågen, T.-G.; Shepherd, K.D.; Walsh, M.G.; Winowiecki, L.; Tamene Desta, L.; Tondoh, E.J. The Africa Soil Information Service (AfSIS) Technical Specifications: Soil Health Surveillance; CIAT: Nairobi, Kenya, 2010. [Google Scholar]
- Asubonteng, K.; Pfeffer, K.; Ros-Tonen, M.; Verbesselt, J.; Baud, I. Effects of Tree-crop Farming on Land-cover Transitions in a Mosaic Landscape in the Eastern Region of Ghana. Environ. Manag. 2018, 62, 529–547. [Google Scholar] [CrossRef] [PubMed]
- Ross, K.C.; Clark, L.D.; Padgett, T.C.; Renckly, T.R. Air University Sampling and Surveying Handbook: Guidelines for Planning, Organizing, and Conducting Surveys; Padgett, T.C., Renckly, T.R., Eds.; University Press of the Pacific: Honolulu, HI, USA, 2006. [Google Scholar]
- Liaw, A.; Wiener, M. Classification and Regression by random Forest. R News 2007, 2, 18–22. [Google Scholar]
- Congalton, R.G.; Green, K. Assessing the Accuracy of Remotely Sensed Data; CRC Press: Boca Raton, FL, USA, 2019. [Google Scholar]
- van Oort, P.A.J. Interpreting the change detection error matrix. Remote Sens. Environ. 2007, 108, 1–8. [Google Scholar] [CrossRef]
- Macleod, R.D.; Congalton, R.G. A quantitative comparison of change detection algorithms for monitoring eelgrass from remotely sensed data. Photogramm. Eng. Remote Sens. 1998, 64, 207–2016. [Google Scholar]
- Mas, J.-F. Monitoring land-cover changes: A comparison of change detection techniques. Int. J. Remote Sens. 1999, 20, 139–152. [Google Scholar] [CrossRef]
- Puyravaud, J.-P. Standardizing the calculation of the annual rate of deforestation. For. Ecol. Manag. 2003, 177, 593–596. [Google Scholar] [CrossRef]
- Lesschen, J.P.; Verburg, P.H.; Staal, S.J. Statistical Methods for Analysing the Spatial Dimension of Changes in Land Use and Farming Systems; LUCC Focus 3 Office: Nairobi, Kenya; ILRI: Wageningen, The Netherlands, 2005. [Google Scholar]
- Leeper, T.J. Interpreting Regression Results Using Average Marginal Effects with R’s Margins; R Foundation for Statistical Computing: Vienna, Austria, 2018. [Google Scholar]
- Barnier, J.; Briatte, F.; Larmarange, J. Questionr: Functions to Make Surveys Processing Easier. R Package Version 0.6.1. Available online: http://cran.r-project.org/package=questionr (accessed on 15 December 2020).
- R Core Team. R: A Language and Environment for Statistical Computing; R Foundation for Statistical Computing: Vienna, Austria, 2019. [Google Scholar]
- Mellor, A.; Haywood, A.; Stone, C.; Jones, S. The Performance of Random Forests in an Operational Setting for Large Area Sclerophyll Forest Classification. Remote Sens. 2013, 5, 2838–2856. [Google Scholar] [CrossRef]
- Rodriguez-Galiano, V.F.; Ghimire, B.; Rogan, J.; Chica-Olmo, M.; Rigol-Sanchez, J.P. An assessment of the effectiveness of a random forest classifier for land-cover classification. ISPRS J. Photogramm. Remote Sens. 2012, 67, 93–104. [Google Scholar] [CrossRef]
- Landis, J.R.; Koch, G.G. The Measurement of Observer Agreement for Categorical Data. Biometrics 1977, 33, 159–174. [Google Scholar] [CrossRef] [PubMed]
- Girard, M.-C.; Girard, C. Traitement des Données de Télédétection, 2nd ed.; Dunod: Paris, France, 1999. [Google Scholar]
- Sokeng, V.J.; Akpa, Y.L.; Assoma, T.; Kouame, F.; Corgne, S.; Rudant, J.-P.; Ouattara, T.; Sorho, F.; Yao, N.; Kouame, P. Suivi par télédétection des affectations des terres pour la promotion d’une agriculture intégrée au développement forestier en Côte d’Ivoire. In Proceedings of the Conférence OSFACO: Des Images Satellites Pour la Gestion Durable des Territoires en Afrique, Cotonou, Benin, 13–15 March 2019; pp. 1–17. [Google Scholar]
- Foody, G.M. Status of land cover classification accuracy assessment. Remote Sens. Environ. 2002, 80, 185–201. [Google Scholar] [CrossRef]
- Malan, B.B. Volatility and stabilization of the price of coffee and cocoa in Côte d’Ivoire. Agric. Econ. 2013, 59, 333–340. [Google Scholar]
- UNEP. Côte d’Ivoire: Post-Conflict Environmental Assessment; United Nations Environment Programme: Nairobi, Kenya, 2015. [Google Scholar]
- Koné, I. Wildlife in Jeopardy Inside and Outside Protected Areas in Côte d’Ivoire: The Combined Effects of Disorganization, Lack of Awareness, and Institutional Weakness. In Conservation Biology: Voices from the Tropics; Sodhi, N.S., Gibson, L., Raven, P.H., Eds.; John Wiley & Sons: Hoboken, NJ, USA, 2013; pp. 26–32. [Google Scholar]
- Akindès, F. Les contradictions des politiques d’aménagement des forêts classées en Côte-d’Ivoire. In Le Modèle Ivoirien en Questions: Crises, Ajustements, Recompositions; Contamin, B., Memel-Fotê, H., Eds.; KARTHALA & ORSTOM: Abidjan, Cote d’Ivoire, 1997; pp. 293–310. [Google Scholar]
- Amani, Y.C. Logiques des infiltrations paysannes dans les forêts classées en Côte d’Ivoire. Eur. J. Sci. Res. 2011, 66, 143–152. [Google Scholar]
- Andrieu, J.; Barima, Y.S.S.; Moreno, D.; Vignal, M.; Zerbo, R. Modélisation rétrospective du défrichement de la forêt classée du Haut-Sassandra (Côte d’Ivoire) dans un contexte de conflits armés (2001–2013). Espac. Géographique 2018, 47, 219. [Google Scholar] [CrossRef]
- Sangne, C.Y.; Barima, Y.S.S.; Bamba, I.; N’Doumé, C.-T.A. Dynamique forestière post-conflits armés de la Forêt classée du Haut-Sassandra (Côte d’Ivoire). VertigO 2015, 15, 1–18. [Google Scholar] [CrossRef]
- Ousmane, S.; Dibi, N.H.; Kouassi, K.H.; Kouassi, K.É.; Ouattara, K. Crises politico-militaires et dynamique de la végétation du Parc national du Mont Péko en Côte d’Ivoire. Bois Forêts des Trop. 2020, 343, 27–37. [Google Scholar] [CrossRef]
- Bamba, I.; Barima, Y.S.S.; Sangne, Y.C.; Andrieu, J.; Assi-Kaudjhis, J.P. Partition du territoire et dynamique des végétations pendant la période de conflit en Côte d’Ivoire. Tropicultura 2018, 36, 141–154. [Google Scholar] [CrossRef]
- Schroth, G.; Harvey, C.A. Biodiversity conservation in cocoa production landscapes: An overview. Biodivers. Conserv. 2007, 16, 2237–2244. [Google Scholar] [CrossRef]
- Ruf, F.O.; Schroth, G.; Doffangui, K. Climate change, cocoa migrations and deforestation in West Africa: What does the past tell us about the future? Sustain. Sci. 2015, 10, 101–111. [Google Scholar] [CrossRef]
- Kassin, K.E.; Doffangui, K.; Kouamé, B.; Yoro, R.G.; Assa, A. Variabilité pluviométrique et perspectives pour la replantation cacaoyère dans le Centre Ouest de la Côte d’Ivoire. J. Appl. Biosci. 2008, 12, 633–641. [Google Scholar]
- Andres, C.; Comoé, H.; Beerli, A.; Schneider, M.; Rist, S.; Jacobi, J. Cocoa in Monoculture and Dynamic Agroforestry. In Sustainable Agriculture Reviews; Lichtfouse, E., Ed.; Springer International Publishing: Berlin/Heidelberg, Germany, 2016; Volume 19, pp. 121–153. [Google Scholar] [CrossRef]
- Kanohin, F.O.; Saley, M.B.; Aké, G.E.; Savané, I. Variabilité climatique et productions de café et cacao en zone tropicale humide: Cas de la région de Daoukro (Centre-est de la Côte d’Ivoire). Int. J. Innov. Appl. Stud. 2012, 1, 194–215. [Google Scholar]
- Lambin, E.F.; Geist, H.J.; Lepers, E. Dynamics of Land-use and land-cover change in tropical regions. Annu. Rev. Environ. Resour. 2003, 28, 205–241. [Google Scholar] [CrossRef]
- Liu, X.; Huang, Y.; Xu, X.; Li, X.; Li, X.; Ciais, P.; Lin, P.; Gong, K.; Ziegler, A.D.; Chen, A.; et al. High-spatiotemporal-resolution mapping of global urban change from 1985 to 2015. Nat. Sustain. 2020. [Google Scholar] [CrossRef]
- Baker, C.; Lawrence, R.L.; Montagne, C.; Patten, D.T. Change detection of wetland ecosystems using Landsat imagery and change vector analysis. Wetlands 2007, 27, 610–619. [Google Scholar] [CrossRef]
- Varlet, F. Étude des Terroirs et Couloirs Écologiques Entre le Parc National de Taï et le Parc National de Grebo; Wild Chimpanzee Foundation: Abidjan, Côte d’Ivoire, 2013. [Google Scholar]
- Ongolo, S.; Kouassi, K.S.; Chérif, S.; Giessen, L. The Tragedy of Forestland Sustainability in Postcolonial Africa: Land Development, Cocoa, and Politics in Côte d’Ivoire. Sustainability 2018, 10, 4611. [Google Scholar] [CrossRef]
- Acheampong, E.O.; Macgregor, C.J.; Sloan, S.; Sayer, J. Deforestation is driven by agricultural expansion in Ghana’s forest reserves. Sci. Afr. 2019, 5, e00146. [Google Scholar] [CrossRef]
- Chakravarty, S.; Ghosh, S.K.; Suresh, C.P.; Dey, A.N.; Shukla, G. Deforestation: Causes, Effects and Control Strategies. In Global Perspectives on Sustainable Forest Management; Clement, A.O., Ed.; IntechOpen: London, UK, 2012; pp. 3–28. [Google Scholar]
- Dimobe, K.; Ouédraogo, A.; Soma, S.; Goetze, D.; Porembski, S.; Thiombiano, A. Identification of driving factors of land degradation and deforestation in the Wildlife Reserve of Bontioli (Burkina Faso, West Africa). Glob. Ecol. Conserv. 2015, 4, 559–571. [Google Scholar] [CrossRef]
- Kissinger, G.; Herold, M.; De Sy, V. Drivers of Deforestation and Forest Degradation: A Synthesis Report for REDD+ Policymakers; Lexeme Consulting: Vancouver, BC, Canada, 2012. [Google Scholar]
- Shvidenko, A. Deforestation. In Encyclopedia of Ecology; Jorgensen, S.E., Fath, B., Eds.; Elsevier: Amsterdam, The Netherlands, 2008; pp. 853–859. [Google Scholar] [CrossRef]
- Tegegne, Y.T.; Lindner, M.; Fobissie, K.; Kanninen, M. Evolution of drivers of deforestation and forest degradation in the Congo Basin forests: Exploring possible policy options to address forest loss. Land Use Policy 2016, 51, 312–324. [Google Scholar] [CrossRef]
- Fasona, M.; Adeonipekun, P.A.; Agboola, O.; Akintuyi, A.; Bello, A.; Ogundipe, O.; Soneye, A.; Omojola, A. Drivers of Deforestation and Land-Use Change in Southwest Nigeria. In Handbook of Climate Change Resilience; Leal Filho, W., Ed.; Springer International Publishing: Cham, Switzerland, 2018; pp. 1–24. [Google Scholar] [CrossRef]
- Ehuitché, B.T. An analysis of dynamics of deforestation and agricultural productivity in Côte d’Ivoire. Int. Res. J. Agric. Sci. Soil Sci. 2015, 5, 103–111. [Google Scholar] [CrossRef]
- Ehuitché, B.T. An analysis of dynamics of deforestation and agricultural productivity in Côte d’Ivoire. In Promoting Green Economy: Implications for Natural Resources Development, Food Security and Poverty Reduction in Africa; Ayuk, E.T., Oku, E.E., Asubonteng, K.O., Nutakor, P., Eds.; United Nations University Institute for Natural Resources: Accra, Ghana, 2016; pp. 59–76. [Google Scholar] [CrossRef]
- Mbow, C.; Brandt, M.; Ouedraogo, I.; de Leeuw, J.; Marshall, M. What Four Decades of Earth Observation Tell Us about Land Degradation in the Sahel? Remote Sens. 2015, 7, 4048–4067. [Google Scholar] [CrossRef]
- Stocking, M.A.; Murnaghan, N. A Handbook for the Field Assessment of Land Degradation; Stocking, M.A., Murnaghan, N., Eds.; Routledge: London, UK, 2001. [Google Scholar]
- Mulinge, W.; Gicheru, P.; Murithi, F.; Maingi, P.; Kihiu, E.; Kirui, O.K.; Mirzabaev, A. Economics of Land Degradation and Improvement in Kenya. In Economics of Land Degradation and Improvement—A Global Assessment for Sustainable Development; Springer International Publishing: Cham, Switzerland, 2016; pp. 471–498. [Google Scholar] [CrossRef]
- Nogherotto, R.; Coppola, E.; Giorgi, F.; Mariotti, L. Impact of Congo Basin deforestation on the African monsoon. Atmos. Sci. Lett. 2013, 14, 45–51. [Google Scholar] [CrossRef]
- Schroth, G.; Läderach, P.; Martinez-Valle, A.I.; Bunn, C.; Jassogne, L. Vulnerability to climate change of cocoa in West Africa: Patterns, opportunities and limits to adaptation. Sci. Total Environ. 2016, 556, 231–241. [Google Scholar] [CrossRef] [PubMed]
- Brou, Y.T. Impacts des modifications bioclimatiques et de l’amenuisement des terres forestières dans les paysanneries ivoiriennes: Quelles solutions pour une agriculture durable en Côte d’Ivoire. Cuad. Geogr. 2009, 45, 13–29. [Google Scholar]
- Chauveau, J.-P. The Land Tenure Question in Côte d’Ivoire: A Lesson in History; International Institute for Environment and Development: London, UK, 2000. [Google Scholar]
- Wyman, M.S.; Stein, T.V. Modeling social and land-use/land-cover change data to assess drivers of smallholder deforestation in Belize. Appl. Geogr. 2010, 30, 329–342. [Google Scholar] [CrossRef]
- Gyau, A.; Smoot, K.; Kouame, C.; Diby, L.; Kahia, J.; Ofori, D. Farmer attitudes and intentions towards trees in cocoa (Theobroma cacao L.) farms in Côte d’Ivoire. Agrofor. Syst. 2014, 88, 1035–1045. [Google Scholar] [CrossRef]
- Abdulai, I.; Hoffmann, M.P.; Jassogne, L.; Asare, R.; Graefe, S.; Tao, H.-H.; Muilerman, S.; Vaast, P.; Van Asten, P.; Läderach, P.; et al. Variations in yield gaps of smallholder cocoa systems and the main determining factors along a climate gradient in Ghana. Agric. Syst. 2020, 181, 102812. [Google Scholar] [CrossRef]
- Besseau, P.; Graham, S.; Christophersen, T. Restoring Forests and Landscapes: The Key to a Sustainable Future; Besseau, P., Graham, S., Christophersen, T., Eds.; Global Partnership on Forest and Landscape Restoration: Vienna, Austria, 2018. [Google Scholar]
- Gann, G.D.; McDonald, T.; Walder, B.; Aronson, J.; Nelson, C.R.; Jonson, J.; Hallett, J.G.; Eisenberg, C.; Guariguata, M.R.; Liu, J.; et al. International principles and standards for the practice of ecological restoration. Second edition Restor. Ecol. 2019, 27. [Google Scholar] [CrossRef]
- Crouzeilles, R.; Beyer, H.L.; Monteiro, L.M.; Feltran-Barbieri, R.; Pessôa, A.C.M.; Barros, F.S.M.; Lindenmayer, D.B.; Lino, E.D.S.M.; Grelle, C.E.V.; Chazdon, R.L.; et al. Achieving cost-effective landscape-scale forest restoration through targeted natural regeneration. Conserv. Lett. 2020, e12709. [Google Scholar] [CrossRef]
- N’Goran, P.K.; Boesch, C.; Mundry, R.; N’Goran, E.K.; Herbinger, I.; Yapi, F.A.; Kühl, H.S. Hunting, Law Enforcement, and African Primate Conservation. Conserv. Biol. 2012, 26, 565–571. [Google Scholar] [CrossRef] [PubMed]
- Kesse, M.M. Recognizing local rights: New approaches—Co-management: A participatory approach to Sustainable forests in Cote d’Ivoire. In The Dynamics of Resource Tenure in West Africa; Toulmin, C., Delville, P.L., Traore, S., Eds.; International Institute for Environment and Development: Oxford, UK, 2002; pp. 121–130. [Google Scholar]


Publisher’s Note: MDPI stays neutral with regard to jurisdictional claims in published maps and institutional affiliations. |
© 2021 by the authors. Licensee MDPI, Basel, Switzerland. This article is an open access article distributed under the terms and conditions of the Creative Commons Attribution (CC BY) license (https://creativecommons.org/licenses/by/4.0/).