Article

Appropriate Management Scale of Farmland and Regional Differences under Different Objectives in Shaanxi Province, China

College of Urban and Environmental Sciences, Northwest University, Xi’an 710127, China
*
Author to whom correspondence should be addressed.
Land 2021, 10(3), 314; https://doi.org/10.3390/land10030314
Submission received: 17 February 2021 / Revised: 14 March 2021 / Accepted: 17 March 2021 / Published: 19 March 2021
(This article belongs to the Section Land Planning and Landscape Architecture)

Abstract

:
Agricultural development is facing two problems: insufficient grain production and low profit of farmers. There is a contradiction between the government’s goal of increasing production and the farmer’s goal of increasing profit. Exploring the appropriate management scale of farmland under different objectives is of great significance to alleviate the conflict of interests between the government and farmers. In this study the Cobb-Douglas production function model was used to measure the appropriate management scale of farmland under different objectives in Shaanxi Province and analyze the regional differences. Under the two objectives, the appropriate management scale of the Loess Plateau was the largest in the three regions, followed by Qinba Mountains and Guanzhong Plain. Farmland area and quality were the main influencing factors for the appropriate management scale of farmland under the goal of maximizing the farmland yield, while the nonagricultural employment rate and farmland transfer rate were the main influencing factors under the goal of maximizing farmers’ profits. It is easy for Shaanxi Province to increase farmers’ profits, but more land needed to be transferred to increase farmland yield. These results suggest that in order to balance the goal of increasing yield and profit, the transfer of rural surplus labor should be promoted, and the nonagricultural employment rate should be improved. In Loess Plateau, restoring the ecological environment and enhancing the farmland quality. In Guanzhong Plain, avoiding urban land encroachment on farmland. In Qinba Mountains, developing farming techniques and moderately increasing the intensity of farmland exploit.

1. Introduction

Appropriate management scale of farmland can be defined as a form of farmland management to obtain the best social and economic benefits by adjusting the scale of farmland or the way of farmland utilization [1,2]. Managing on an appropriate scale can achieve two goals. The goal of maximizing farmland production is to maximize the number of nonagricultural personnel supported by the farmland agricultural production. The goal of maximizing farmers’ profits is to maximize the total net income of rural households. Exploring the appropriate management scale of farmland under different objectives made the farmland management better adapt to the development requirements of market economy, which was of great significance to coordinate the production and profit goals, and eased the contradiction between the government and farmers [3]. Managing on an appropriate scale was the way to realize agricultural modernization [4]. In 1987, the Central Committee of the Communist Party of China (CPC) put forward for the first time that different forms of appropriate management scale of farmland should be adopted in rural areas. Government work report stressed that it is necessary to increase per unit area yield and expand production scale. In 2018, the China Central Conference on Rural Work decided to establish a policy for farmers, which can directly benefit farmers and guide them to consciously improve productivity.
Scholars generally have believed that managing on an appropriate scale and rationally allocating the production factors can effectively improve the production efficiency and the utilization rate of farmland resources [5,6]. Therefore, managing on an appropriate scale can simultaneously achieve economic and social benefits [7,8,9,10]. Previous studies had shown that the correlation between the appropriate management scale of farmland, the average profit of farmers, per capita farmland area, farmers’ agricultural production technology proficiency, the transfer rate of agricultural labor force to nonagricultural industries and other indicators can be quantified, and they confirmed that the scale was closely related to the management objectives [11,12]. On this basis, some scholars calculated the management scale of farmland that is conducive to maintaining national food security under the goal of maximizing land production [13]. However, grain crops are special commodities, which have small price elasticity of demand [14]. The marginal cost curve of individual farmers is the same as that of agriculture in general [15]. Previous studies have shown that when the farmland production is maximized, there is still room for the growth of farmers’ individual profits, and this phenomenon will exist for a long time [16]. In order to maximize farmers’ profits, some scholars had determined the management scale of farmland to make farmers’ net agricultural incomes equal to or slightly higher than that of other industries [17,18]. However, in this operation, farmers will choose to plant economic crops with high profit, which leads to a decline of grain crop yield and threatening food security [16,19]. The production objectives of the government and farmers are difficult to coordinate. These related research characteristics were “single goal, single model”.
However, China’s appropriate management scale of farmland was diverse, dynamic and different, so there was no unified measurement standard for the scale [20]. For a region, the appropriate management scale of farmland was different under different objectives. Under the same goal, different regions had different appropriate management scales. Therefore, this study used the modified Cobb-Douglas production function to respectively estimate the appropriate management scale of farmland in Shaanxi Province under the goal of maximizing farmland production and farmers’ profits. The differences and reasons of the appropriate management scale under different goals were analyzed. The study had an important significance for coordinating the government’s goal of increasing farmland production and farmers’ goal of increasing profit.

2. Materials and Methods

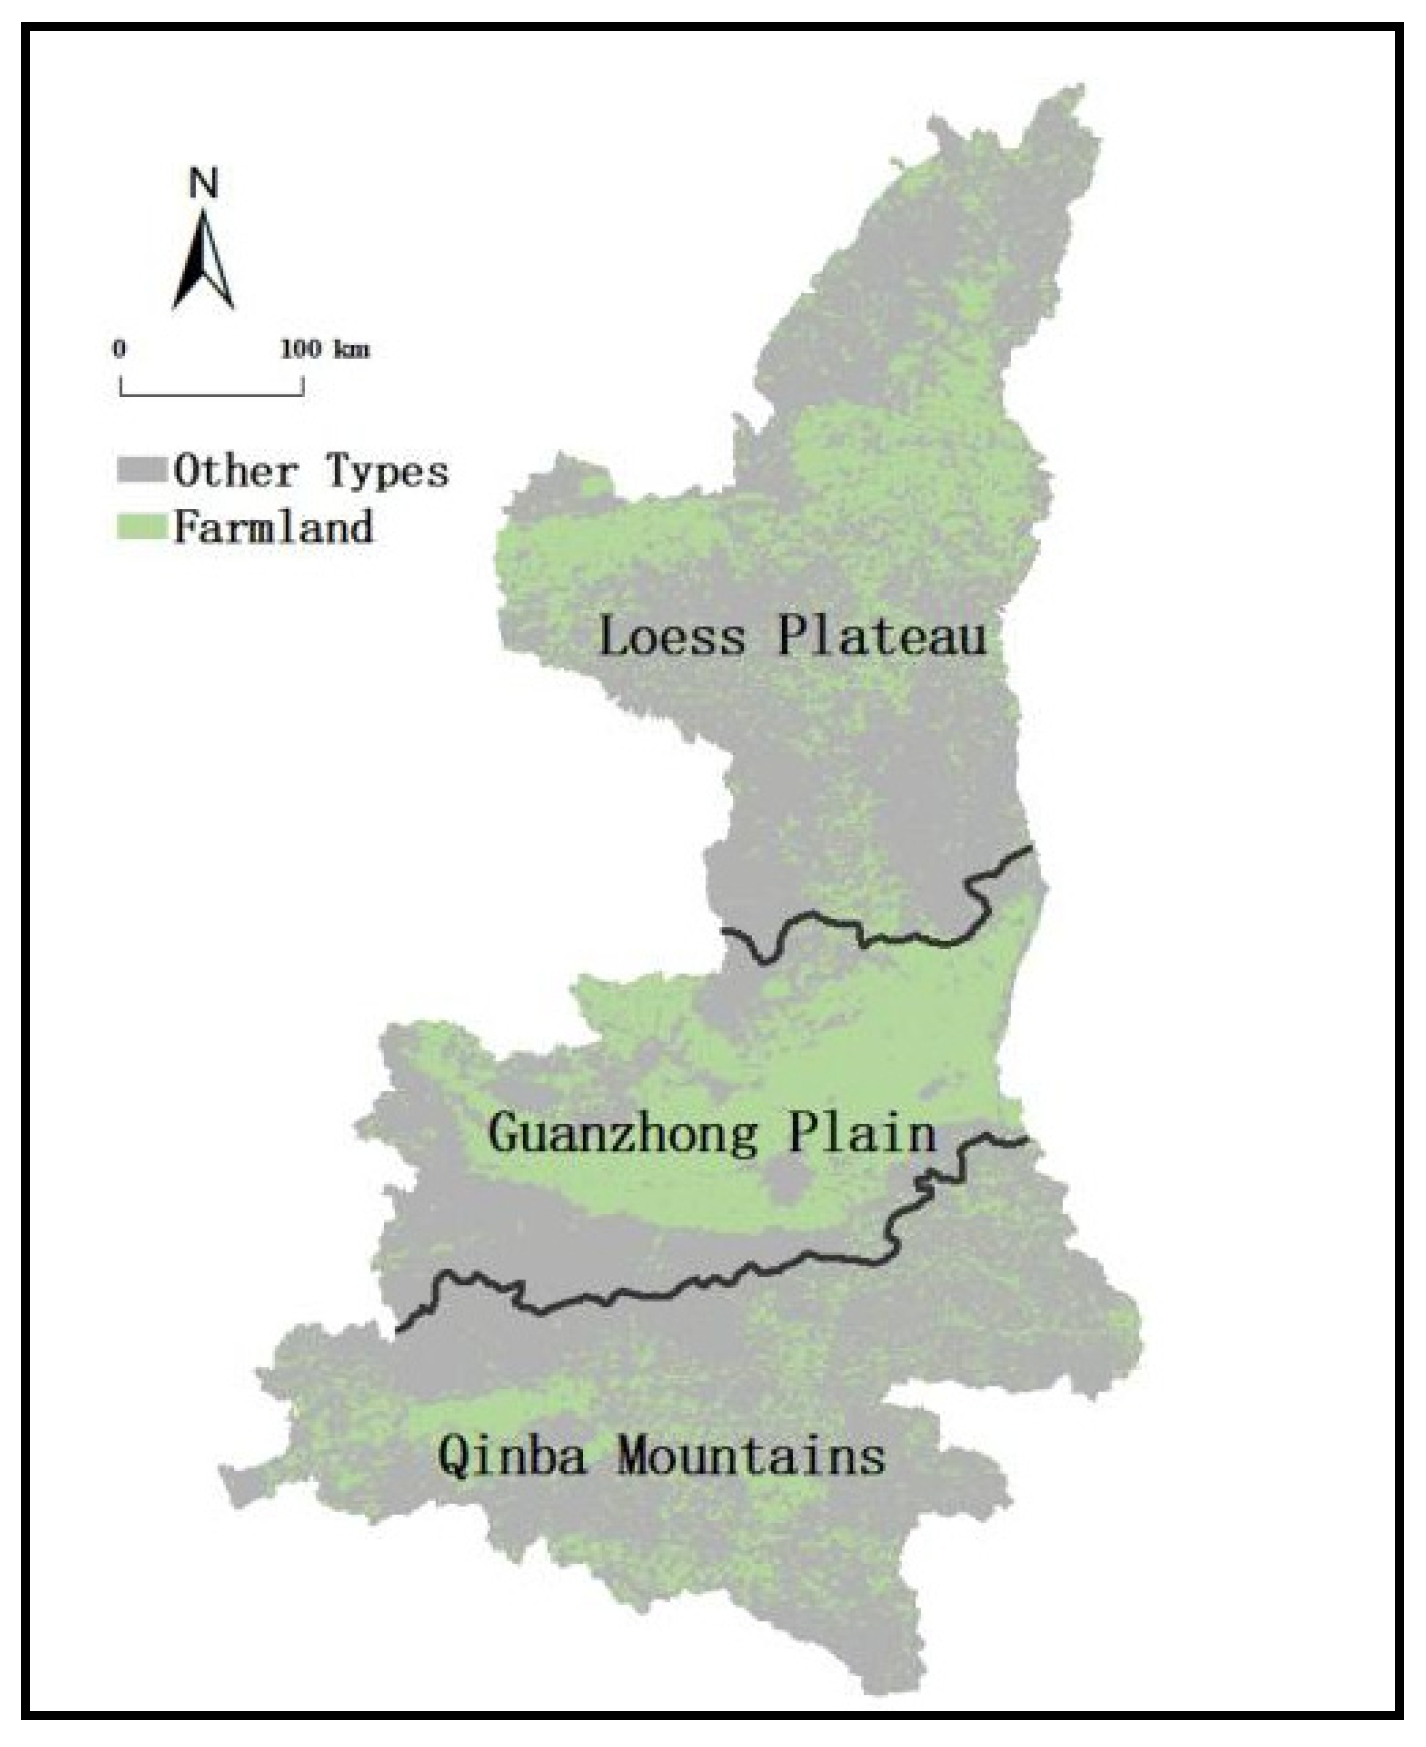
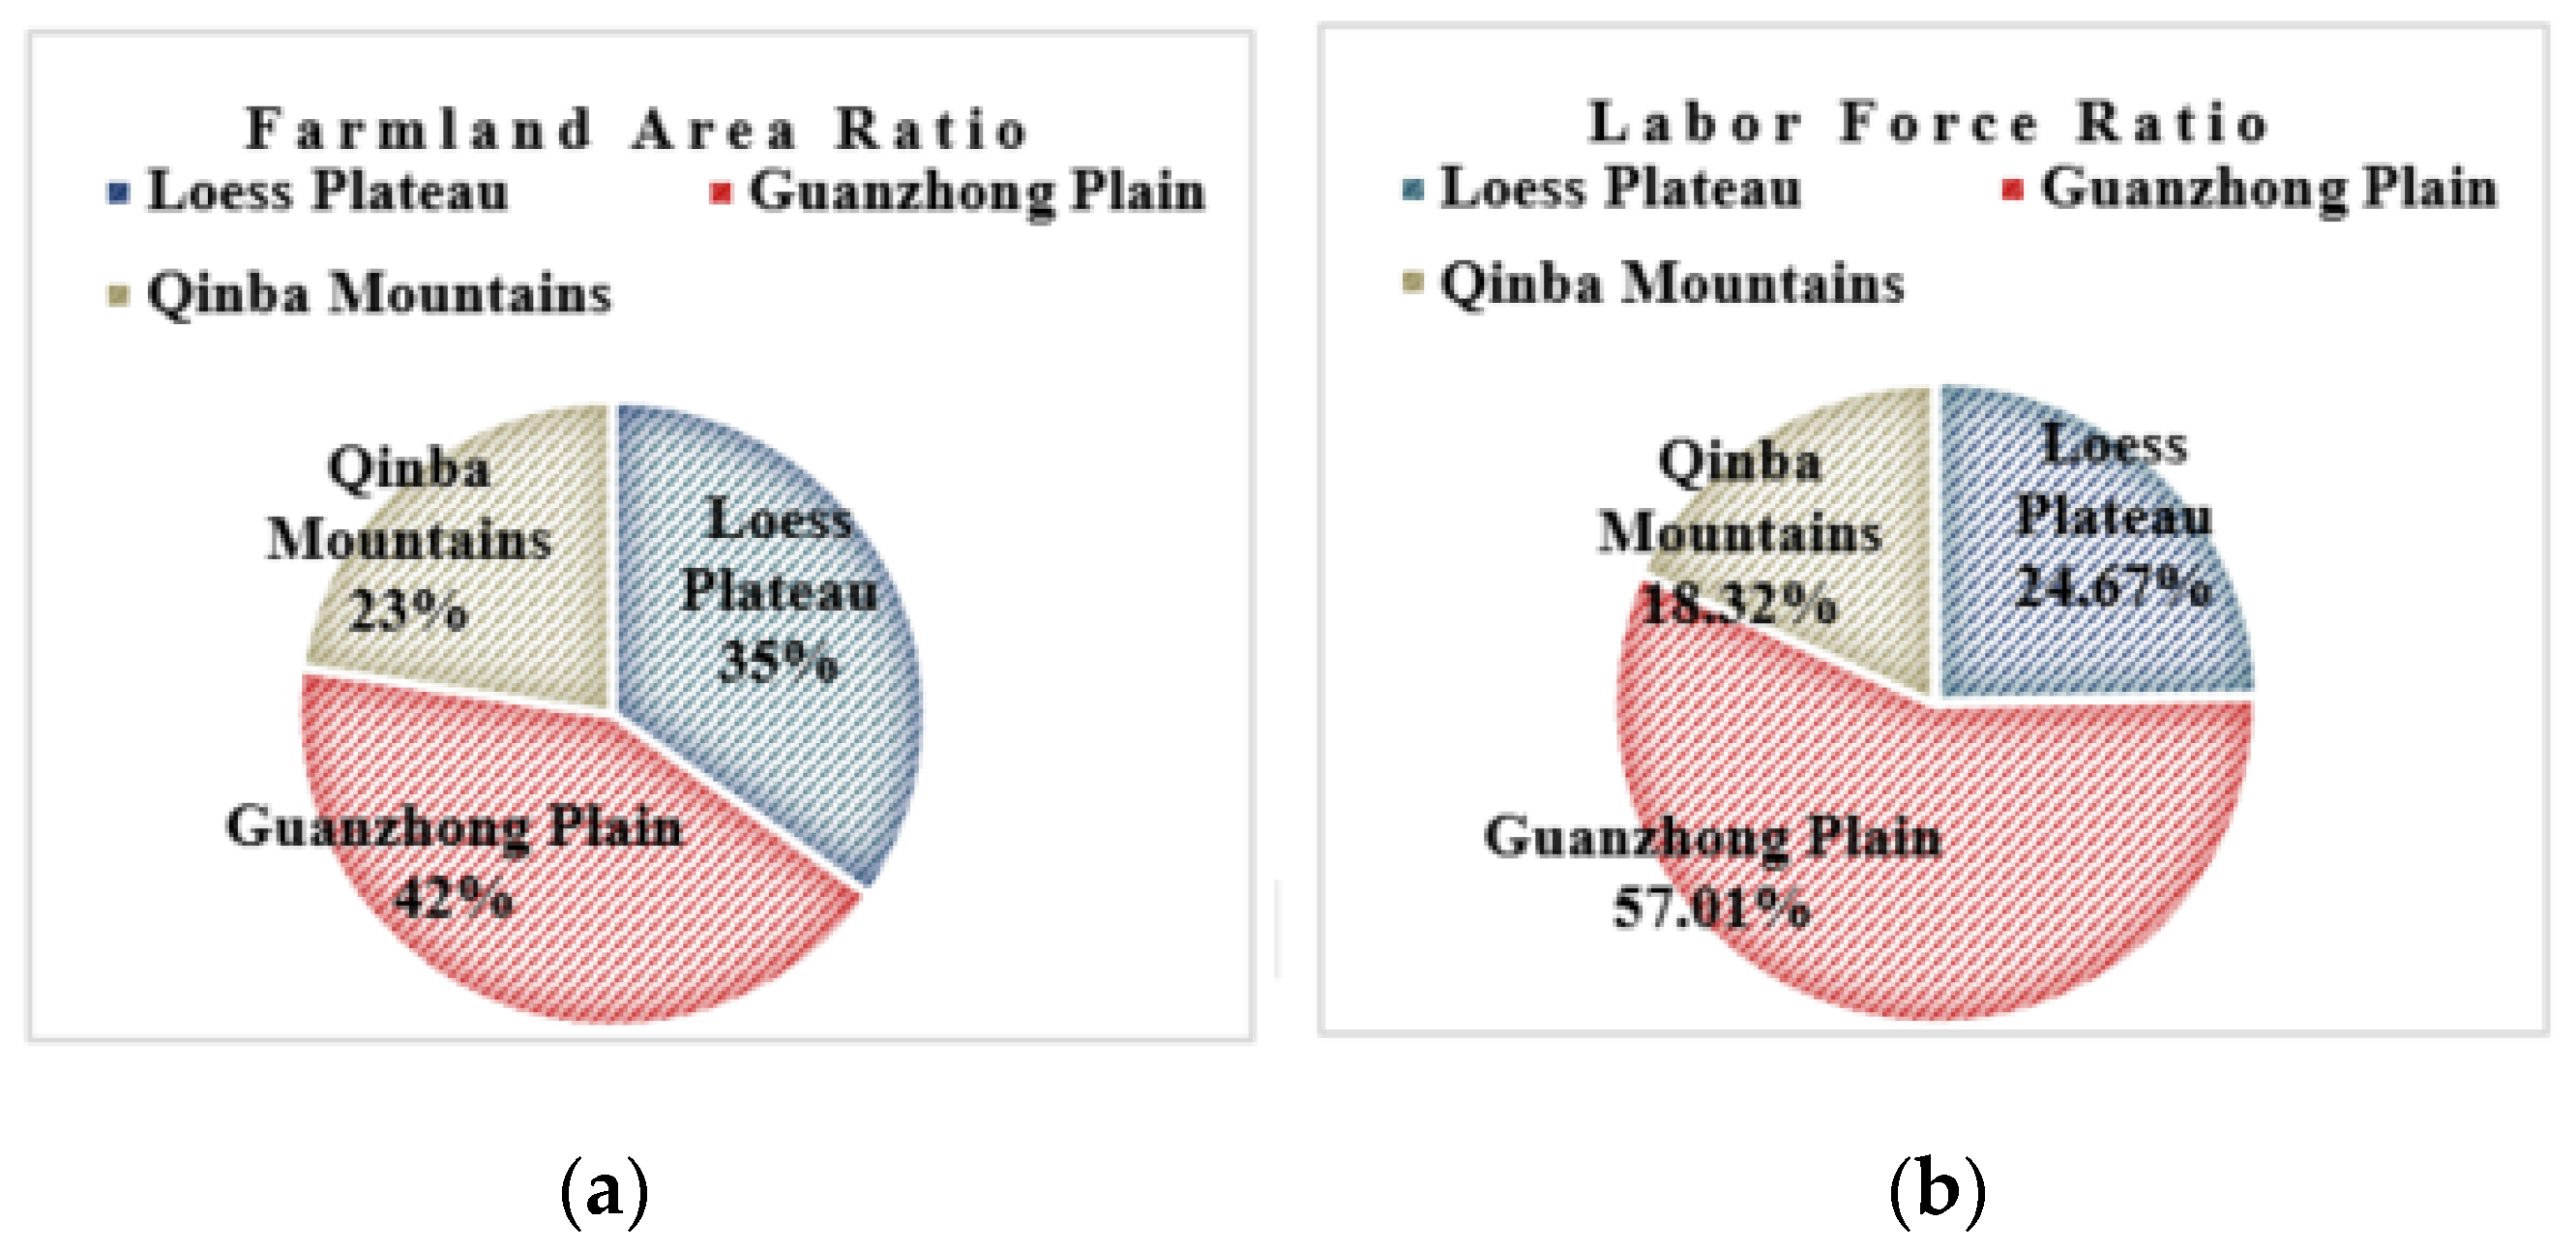
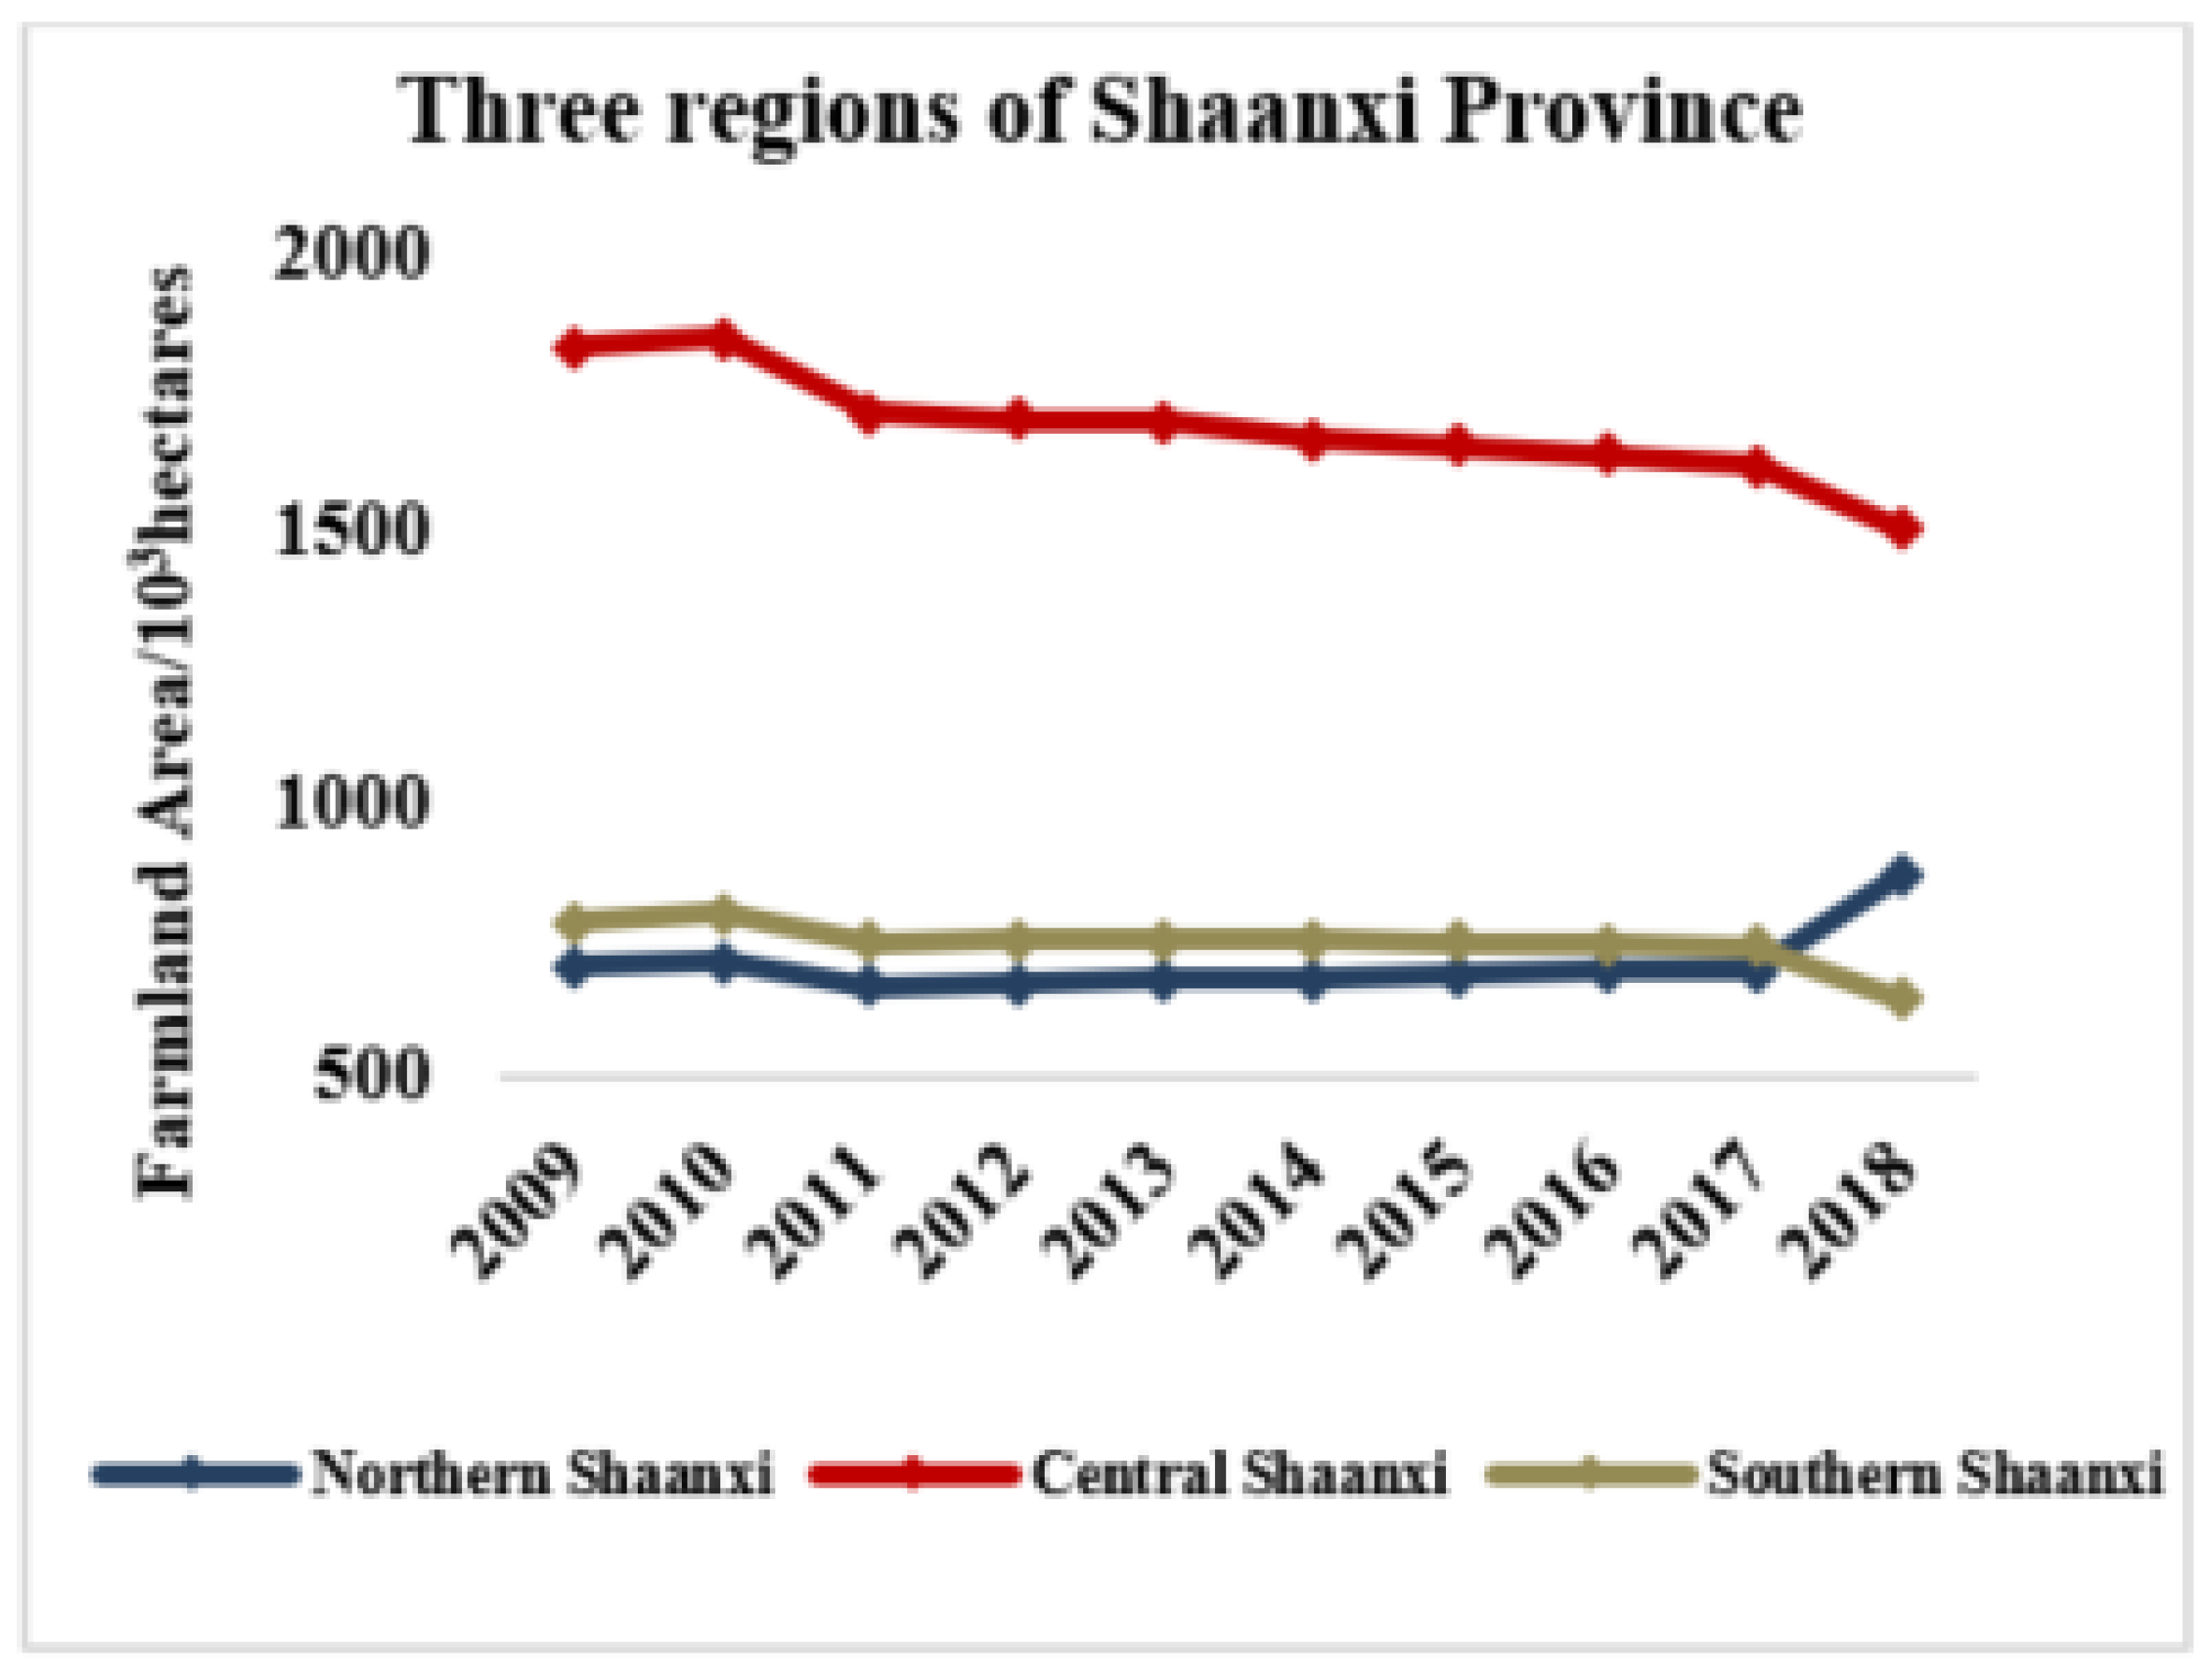
2.1. Overview of the Study Area

Shaanxi Province is located in the hinterland of China’s interior, in the middle reaches of the Yellow River, and its landform types and arable land components are complex and diverse. The total area is 20.56 million hm2, the permanent population is 38,762,100. As of 2018, the rural population was 16.18 million, accounting for 41.87% of the total population. The gross production value of the primary industry was USD 281.12 billion, the per capita disposable profit of rural residents was USD 1725.08, and the total farmland area was 3.01 million hm2. According to the natural geographical features such as topography and climate and socioeconomic features such as the level of economic development, Shaanxi Province is divided into three natural regions from north to south: The Loess Plateau Area, The Guanzhong Plain Area and The Qinba Mountains Area (Figure 1). In recent years, the regional layout and specialized division of labor have improved the overall speed and benefits of agricultural development in Shaanxi Province, but they have also further expanded the regional differences in farmland use [21]. Therefore, based on the measurement of the appropriate management scale of the overall farmland in Shaanxi Province, it was necessary to calculate the appropriate management scale of the farmland under different targets by region.

2.2. Data Sources

The data of the total grain production, the number of people in the primary industry, the total power of agricultural machinery, the amount of chemical fertilizers, and the sown area of food crops were mainly derived from the 2009–2018 Shaanxi Provincial Statistical Yearbook, Shaanxi Provincial Agricultural Statistics Annual Report, and Bulletin of Land and Resources of Shaanxi Province (Table 1). The data of labor wages, nonagricultural employment probability, and farmland transfer probability were from the data bulletin of the sample survey of the Shaanxi Research Team of the National Bureau of Statistics. The research sample areas include The Loess Plateau Area (Yan’an, Yulin), The Guanzhong Plain Area (Xi’an, Xianyang, Tongchuan, Weinan, Baoji), and The Qinba Mountains Area (Hanzhong, Ankang, Shangluo).

2.3. Research Methods

The basic data related to agricultural technology and economics mostly come from the measured observation values, experimental data or statistical survey data in the research area, and the heterogeneity was large. The use of Cobb-Douglas production function can enhance the accuracy of quantitative analysis [22]. The main influencing factors of farmland production rate were farmland area, labor force and means of production. Changes in the ranking of the three influence levels affect the production of farmland [23].

2.3.1. Appropriate Management Scale under the Goal of Maximizing Farmland Production Calculation

(1) The total grain production Q of farmland can be expressed by the Cobb-Douglas production function [24] as follows:
Q = A P α M β L γ
Q represents the total grain production, including the annual production of all kinds of grain crops in farmland. P represents the labor force of agriculture, forestry, animal husbandry and fishery, M represents the capital investment (total power of agricultural machinery and the total fertilizer application), and L represents the farmland area. α, β, γ represent the production elasticity of labor force, total capital investment, and farmland area, respectively. A is the sum of the effects of other influencing factors besides the above four factors.
(2) The total production cost C of farmland is expressed as follows:
C = i P + j M + k L
The i represents labor wages, j represents capital prices, and k represents farmland rent [25,26].
(3) Total farmland profit TR:
T R = S * Q C = S * A P α M β L γ i P j M k L
TR represents the total profit of farmland, and S represents the market price of agricultural products.
(4) Maximize TR:
In order to maximize the TR in Equation (3), the first derivative on the right side of the equation needs to be 0:
max T R = max ( S * A P α M β L γ i P j M k L ) T R P = α * S * A * P α 1 M β L γ i = 0 T R M = β * S * A * P α M β 1 L γ j = 0 T R L = γ * S * A * P α M β L γ 1 k = 0
The results are as follows:
P * = α * S * Q / i M * = β * S * Q / j L * = γ * S * Q / k
Additionally, the optimal farmland per labor scale under the maximization of farmland production is:
L * P * = γ α * i k

2.3.2. Appropriate Management Scale under the Goal of Maximizing Farmers’ Profit Calculation

According to the Jorgenson’s model, with the scale of agricultural surplus expanding, the rural surplus labor force is transferred, and the farmers are engaged in nonagricultural production. Under the goal of maximizing farmers’ profits, the measurement of the appropriate management scale of farmland needs to consider farmers’ income from agricultural production and nonagricultural production. The income of farmers from nonagricultural production is divided into employment income and farmland transfer income [27]. Therefore, the total income of farmers from nonagricultural production is:
l = l 1 + l 2 = p 1 W 1 ( T P ) + p 2 k ( R L )
Among them: l1 represents labor income from nonagricultural employment, l2 represents income from farmland transfer, p1 represents the probability of nonagricultural employment, p2 represents farmland transfer probability, W1 represents net income from nonagricultural employment, and k represents net income from transferred farmland units. (TP) represents the labor time invested in nonagricultural production. (TP) > 0, the farmers produce by themselves. (TP) < 0, the farmers hire labor for production. (RL) represents the area of farmland transfer. (RL) > 0, the farmers have outward transferring willingness. (RL) > 0, the farmers will accept another person’s farmland.
The total profit of farmers is:
T l = S Q C + l = S * A P α M β L γ i P j M k L + p 1 W 1 ( T P ) + p 2 k ( R L )
Similar to 2.1, the first derivative on the right side of the equation needs to be 0:
max T l = max [ S * A P α M β L γ i P j M k L + p 1 W 1 ( T P ) + p 2 k ( R L ) ] T l P = α * S * A P α 1 M β L γ i P 1 W 1 = 0 T l M = β * S * A P α M β 1 L γ j = 0 T l L = γ * S * A P α M β L γ 1 k p 2 k = 0
The results are as follows:
P * = α S Q i + p 1 W 1 M * = β S Q j L * = γ S Q ( 1 + p 2 ) k
The optimal farmland management scale per labor under the objective of maximizing farmers’ profit is:
L * P * = γ ( i + p 1 W 1 ) ( 1 + p 2 ) k α
Let the result of formula (4) be M1, then the optimal farmland management scale per labor is:
M 2 = γ ( i + p 1 W 1 ) ( 1 + p 2 ) k α = γ α * ( i + p 1 W 1 ) ( 1 + p 2 ) k = γ α * i k * ( i + p 1 W 1 ) ( 1 + p 2 ) i = M 1 * ( i + p 1 W 1 ) ( 1 + p 2 ) i

3. Results

3.1. The Appropriate Management Scale of Farmland in Shaanxi Province

The capital invested in agricultural production mainly is used to purchase machinery and fertilizer, but their prices fluctuate greatly every year [26]. Therefore, the capital investment is divided into two indexes: total mechanical power and fertilizer application. The production function of modified Cobb-Douglas production function is established as follows:
Q = A L α K 1 β 1 K 2 β 2 H γ
K1 represents the total power of agricultural machinery, K2 represents the amount of chemical fertilizer. β1 and β2 represent their output elasticity, respectively. The meanings of other symbols are consistent with formula (1).
The modified Cobb-Douglas production function was linearized and the appropriate management scale of farmland in Shaanxi Province was estimated under the goal of maximizing land production and farmers’ profit (Equation (10)). In order to prevent being affected by the collinearity between the independent variables, ridge regression analysis was used for verification.
ln Q = 40.786 + 0.026 ln P + 0.099 ln K 1 + 0.064 ln K 2 + 0.133 ln L           t   = ( 12.613 )       ( 5.009 )                   ( 1.073 )                         ( 9.707 )                 ( 16.091 )       R 2 =   0.808
The coefficients of each variable passed the T test at the significance level of 0.01. At least one of these factors, the total power of agricultural machinery, the number of people in the primary industry, the amount of chemical fertilizer, and the farmland area impacted on the total grain yield (F = 100.169, P = 0.000 < 0.05). These factors can explain 80.83% of the change in total grain yield (R2 = 0.8083), which showed that the model fitted well. The sum of these factors’ output coefficient was 0.322, which was less than 0.5. The test result showed that the level of large-scale agricultural production in Shaanxi Province was relatively low, and the scale economy had not yet formed (Table 2).
It can be seen that the product elasticity of farmland area was the largest among the four influencing factors in Shaanxi Province, which revealed that farmland was the most critical factor that determined the farmland management efficiency. The product elasticity of the total power of agricultural machinery and the amount of chemical fertilizer followed it, showing that a certain amount of mechanical power reserve and the amount of chemical fertilizer were the basic conditions for managing on an appropriate scale. The number of labor force’s product elasticity was the smallest. That means on the basis of current production, increasing the number of laborers only slightly improved the managing efficiency of farmland or basically remained unchanged.
Consistent with the linearization process of modified CD production function of Shaanxi Province, the linearization results of three regions can be obtained:
The Loess Plateau:
ln Q = 2.088 + 0.011 ln P + 0.165 ln K 1 + 0.231 ln K 2 + 0.125 ln L
The Guanzhong Plain:
ln Q = 58.967 + 0.027 ln P + 0.086 ln K 1 + 0.05 ln K 2 + 0.139 ln L
The Qinba Mountains:
ln Q = 19.614 + 0.014 ln P + 0.062 ln K 1 + 0.148 ln K 2 + 0.154 ln L
Substituting the p1, p2, W1, i, k of each area obtained from Section 2.2 into the formulas (11), (12) and (13), the appropriate management scale of farmland under different objectives per laborer of each region is obtained.
However, agricultural production in rural China is usually carried out by households rather than individual farmers. Therefore, the per household farmland area can better reflect the rural farmland management level. The average farmland area per household is obtained by multiplying the average farmland area per laborer and the average rural population (Table 3).

3.2. The Appropriate Management Scale of Farmland in the Three Regions

The calculation results in Table 2 showed that the optimal farmland area per household was 3.88 hm2 under the objective of maximizing farmland production in Shaanxi Province, while it was 2.17 hm2 under the objective of maximizing farmers’ profits. The current average farmland area per household in Shaanxi Province is 1.01 hm2. In order to manage on an appropriate scale, the average farmland area per household needed to be increased by 2.87 and 1.16 hm2, respectively. The smaller the gap between the optimal scale and the actual scale, the easier it is to achieve the management objectives. Therefore, it was easier for Shaanxi Province to achieve the goal of increasing farmers’ profits than increasing farmland production.
Under the goal of maximizing farmland production, the appropriate management scale of farmland in Loess Plateau was the largest (10.77 hm2/household), the Qinba Mountains was the second (7.81 hm2/household), the Guanzhong Plain was the smallest (3.66 hm2/household). This showed that when the production goals were the same, farmers in the Loess Plateau needed to use a larger farmland area, and the unit productivity of farmland was low and in Guanzhong Plain it was the highest. Qinba Mountains’ s unit productivity was between them and closer to the Loess Plateau.
Under this target, the actual management scale of farmland in the three major regions of Shaanxi Province was far from the appropriate management scale of farmland. The greater the gap between the actual scale and the optimal scale, the more severe the food security problem. The appropriate management scale of farmland in Guanzhong Plain was 4.74 times the actual scale, and the gap between the expected value and the actual value was larger than the other regions. Only an increase of 2.94 hm2 of farmland per household in this region can maximize the farmland production. The theoretical areas of the Loess Plateau and Qinba Mountains were 3.62 times and 4.6 times the actual values. The average farmland area per household needed to increase by 7.79 and 6.11 hm2 to manage on an appropriate scale. These above results indicated that the government needed to focus on increasing the productivity of farmland in Loess Plateau and pay more attention to the food supply problem in Guanzhong Plain and Qinba Mountains.
Under the goal of maximizing farmers’ profits, the appropriate management scale of farmland in Loess Plateau was slightly larger than that in Qinba Mountains, and in Guanzhong Plain, it was the smallest. The average farmland area per household was 5.67, 5.06, and 2.14 hm2. When the management scale was the same, farmers in Guanzhong Plain had the highest profit, followed by Qinba Mountains, and farmers in Loess Plateau had the least profit.
The difference between the optimal scale and the actual scale of the three major regions of Shaanxi Province under the goal of maximizing farmers’ profits was smaller than that under the goal of maximizing farmland production. If the actual management scale differs greatly from the optimal scale, it will be difficult for farmers to increase their profit. The optimal scale of Qinba Mountains, Guanzhong Plain and Loess Plateau was 2.98 times, 2.77 times, and 1.90 times of the actual scale, respectively. This means that the profit growth of farmers in the Qinba Mountains and Guanzhong Plain was in a bottleneck period. Transferring to the same area of farmland or the same amount of surplus labor had the most significant effect on the increase in per household profit in Loess Plateau.
The correlation analysis result showed that under different objectives, the appropriate management scale of farmland in Loess Plateau was the largest, followed by Qinba Mountains, and Guanzhong Plain was the smallest. Specifically, the farmland in Loess Plateau has great development potential, the farmland management in Qinba Mountains area has a certain space to improve. Meanwhile, the farmland development in Guanzhong Plain tended to be saturated.

4. Discussion

4.1. Regional Differences of the Appropriate Management Scale under the Goal of Maximizing the Farmland Production

Achieving food security is one of the important goals of agricultural sustainable development [28]. Calculating the appropriate management scale of farmland under the goal of maximizing farmland production has a positive effect on ensuring food security and promoting economic development [29]. This study showed that the farmland area was the climate factor most affecting the appropriate management scale of farmland. Due to the limited area and immovable location, the total area of farmland within a certain area was finite, and the natural attribute was difficult to change artificially [30]. If there is a big difference between the actual and the optimal farmland area per household, the actual farmland production is far from the target production. This means that the food reserves are insufficient and the food security problem is severe. Studies have shown that the farmland area determined the production by affecting the efficiency of farmland use [31,32,33]. The efficiency of farmland use reflected the farmland exploitation effect within a certain time and space, which had a strong correlation with the regional socioeconomic background [34]. The relevant studies had confirmed that the size of the labor force and the agricultural technology level were the main reasons for the large differences in the efficiency of farmland use between regions [35]. The efficiency of farmland use was usually high in areas with sufficient labor force and high level of agricultural technology [36]. All production factors transformed into farmland production to the greatest extent, and the unit farmland productivity was high. In this area, the farmland area put into production was smaller under the same production target. In line with this, the Guanzhong Plain was the area with the highest level of economic development and the most abundant labor force in Shaanxi Province. The unit farmland productivity was high and the per household appropriate management scale of farmland was the smallest. Conversely, the unit farmland productivity was low in Loess Plateau and Qinba Mountains, so it needed to occupy larger farmland area than that in Guanzhong Plain to ensure food supply. However, with the acceleration of urbanization, a large number of people were gathering in Guanzhong Plain. The proportion of rural labor force was higher than that of farmland (Figure 2). The existing farmland no longer met the rapid growth of food demand, solving the problem of food security was the major task of managing farmland on an appropriate scale in Guanzhong Plain. Therefore, the Guanzhong Plain should strictly observe the red line of farmland area to ensure the farmland amount. To achieve the goal of increasing farmland production, the area should avoid the construction land occupying a large amount of farmland, thereby ensuring food security.
Owing to the terrain fragmentation, and serious soil erosion, the eco-environment in in Loess Plateau was fragile and the soil fertility was impaired [37]. In addition, the region had long attached importance to the energy and chemical industry, and despised agriculture development so that the agricultural technology was backwards. Additionally, the Grain for Green Project directly reduced the farmland area. Increasing farmland production was restricted by natural conditions, technical level, and policy system. On the premise of implementing national policies, the Loess Plateau should combine farmland protection and utilization to improve the efficiency of farmland use utilization. Only by planting trees to fix sand and ameliorating ecological environment can we give full play to the advantages of farmland.
As some scholars point out, the efficiency of farmland use in mountainous areas is low and the agricultural production can only meet the basic living needs [38]. Frequent natural disasters, labor shortage, and the diversification of agricultural land structure were the main reasons for this phenomenon [37]. In Qinba Mountains, 80% of the farmland was mountainous area and the farmland area accounted for 10% of the available land [39]. In other words, Qinba Mountains’ farmland area was small (Figure 3), the degree of fragmentation was large, and the development cost was high [40]. The Qinba Mountains can vigorously develop agricultural production technology and improve the efficiency of farmland use because technology upgrading has a significant role in increasing farmland production [41].
In addition, expanding the management scale of the advantageous crops is conducive to increasing the total grain production of farmland [42]. Affected by climate and terrain, the three regions have different types of advantageous food crops [43]. The Loess Plateau is the main corn producing area in Shaanxi Province [44]. Guanzhong Plain’s climate is more humid, and the yield of wheat is larger [45]. The Qinba Mountains have a pleasant climate, but the main terrain is mountain, and all kinds of food crops have little production [42]. Therefore, the area of corn should be expanded in the Loess Plateau, the Guanzhong Plain should use wheat as the core of farmland management, and the scale and proportion of corn and wheat of the Qinba Mountains needs to be set up reasonably.

4.2. Regional Differences of the Appropriate Management Scale under the Goal of Maximizing Farmers’ Profit

Farmers’ production goal was obtaining the maximum profit [46]. Exploring the appropriate management scale of farmland under the goal of maximizing farmers’ profits was conducive to giving full play to the farmland revenue function [47], motivating inherent labor, absorbing new labor and promoting agricultural development. Some studies identified that the nonagricultural employment rate was the main restricting factor of the farmland management scale [48]. Under the background of urbanization, the agricultural population was shifting to the secondary and tertiary industries [49], which led to changes in the structure of rural households’ agricultural labor force. The structure of the labor force directly affected the farmland management scale. Usually, rural families with a large number of high-quality labor forces had the ability to use farmland efficiently [50]. This showed that with the same profit target, farmers with better labor structure occupied less farmland, and they get more profit with the same farmland area. In addition, farmers’ farmland transferred behavior was related closely to the management scale of farmland [51]. Farmers in economically developed areas with good quality of farmland had strong enthusiasm for transferring farmland and had preferable management efficiency of farmland [52]. In the same period, this area achieved the goal of maximizing profit to a greater extent and then the development of farmland tends to be saturated. In contrast to this, in underdeveloped area, the production technology was backward, and farmers had few nonagricultural employment opportunities. Expanding the farmland area was the main way for farmers to increase profit [53]. Therefore, farmers tended to accumulate farmland and lacked the willingness to transfer farmland. The vitality of agricultural production was insufficient and it is difficult to increase farmers’ profits.
Consistent with these findings, the Guanzhong Plain had the highest level of economic development and urbanization rate in Shaanxi Province. Farmers had a high average education level in this region. A large number of agricultural laborers were absorbed into the Guanzhong Plain each year. The farmland area per household under the goal of maximizing farmers’ profits was the smallest (2.14 hm2). However, after years of development and management, the Guanzhong Plain had entered a bottleneck period for farmland development. Due to the rigidity of farmland, it was hard to expand the farmland area (Figure 4). Therefore, encouraging the rural surplus labor to transfer and reducing the number of agricultural populations were the main ways to help Guanzhong Plain break through the bottleneck period of agricultural development and increase farmers’ profits.
The economic level of the Loess Plateau was high, but the labor force was insufficient, and the quality of farmland was poor. Terrible natural conditions led to large annual differences in farmland production and unstable profit of farmers. Affected by location and climate factors, the rural labor force in the Loess Plateau was seriously lost (Figure 5). Although the per capital farmland area was large, the utilization efficiency was low, resulting in a waste of resources. Increasing capital investment significantly improved farmland use efficiency and helped solve the problem of labor shortage [54]. It was necessary to increase investment in environmental management and concentrate funds on ecological construction in Loess Plateau. Through these ways, the quality of farmland and farmers’ profit were increased.
Restricted by unfavorable natural and socioeconomic conditions, the Qinba Mountains had more difficulty of increasing farmers’ profits than the others in Shanxi Province. The tectonic movement led to the fragmentation of the Qinba Mountains terrain, forming isolated hills and uplands. The area of ≥15° slope farmland accounts for about 40% of the province, and the forest area accounts for about 50% of the province. As the farmland was fragmented and scattered, it is difficult to manage on an appropriate scale. Besides, inconvenient transportation made the economic development of Qinba Mountains relatively backwards. In Qinba Mountains, farmers used low-tech production technologies and hardly made full use of farmland, and the farmland market was rigid [55]. Relevant studies showed that pure technical efficiency was the key to determine the efficiency of farmland use [56]. Expanding the effective irrigation area or enhancing the ability to resist natural disasters were conducive to managing on an appropriate scale [57]. Therefore, the Qinba Mountains should develop farming techniques suitable for mountain production, improve and upgrade mountain irrigation facilities, strengthen disaster prevention and reduction, so as to obtain scale economy and increase farmers’ profits.

4.3. Implication, Application and Limitation

This paper undertook an empirical analysis on the problem of managing on an appropriate scale in Shaanxi Province through the method of model construction and econometric analysis, which provided theoretical support for easing the contradiction between the government and farmers in farmland management. The results showed that there was a big difference between the government’s target and the farmer’s target in managing on an appropriate scale in Shaanxi province, the government and farmers had sharp conflicts in farmland management. Different regions have different constraints on achieving management on an appropriate scale. Hence, a set of measures need to be implemented to promote managing on an appropriate scale of all regions, which include accelerating the transfer of rural surplus labor, increasing the nonagricultural employment rate and the utilization rate of farmland. However, there are still some deficiencies.
First, because the farmland data before 2009 was difficult to obtain, the study only used the 10 years farmland data, which was a small timespan. Moreover, the unofficial statistical data affected the accuracy of the scale value measurement results to some extent. Secondly, the study only discussed the regional differentiation of appropriate management scale of farmland under different objectives in Shaanxi Province on the spatial scale, but lacked the analysis of evolution characteristics on the time scale. Finally, farmers not only grow food crops, but also engage in other types of agricultural production activities. The appropriate management scale of economic forest, orchard, tea garden, and other types of land needs to be further discussed.
It must be emphasized that the extensive use of chemical fertilizer and agricultural machinery is helpful to increase farmland production and farmers’ profits, but it also brings environmental problems such as soil eutrophication and water pollution [58,59]. In this context, how to coordinate food security, farmers’ profit increase and environmental protection will become the main direction of further research in the future [60].

5. Conclusions

The present study used the Cobb-Douglas production function model to calculate the appropriate management scale of farmland per household in Shaanxi Province under the goal of maximizing the production of farmland and farmers’ profits, exploring the regional differences and analyzing the constraints on managing on an appropriate scale. The main recommendations and suggestions are as follows:
(1) At present, the level of agricultural modernization in Shaanxi Province is low and each region has not realized scale economy. For the appropriate management scale of farmland in Shaanxi Province, the land factor has the most influence, the capital factor is moderate, and the labor force factor is the smallest. Expanding the area of farmland is the most direct way to realize management on an appropriate scale of farmland. However, affected by the policy of returning farmland to forest, there is an upper limit for the expansion of farmland. Therefore, the government should increase capital investment and develop new production technologies to increase the yield of farmland per unit area in the future. As too much agricultural labor force has no significant effect on promoting to manage on an appropriate scale, we can vigorously develop township enterprises and advance agricultural industrialization, providing more nonagricultural employment opportunities for farmers, which can reduce the waste of labor resources. At the same time, popularizing production knowledge and technology to the farmers who stay on the farmland for production is useful for improving the quality of workers.
(2) There is a big difference in the area of optimal farmland per household under different objectives in the three regions of Shaanxi Province. Under the goal of maximizing the farmland production, the appropriate management scale of farmland in Loess Plateau is the largest, but the farmland productivity is the lowest. The situation in Guanzhong Plain is opposite. Additionally, the scale and productivity of farmland in Qinba Mountains area are all moderate. To achieve this goal, we can adjust the land structure and merge scattered plots, to fully tap the farmland productive potential without damaging the ecological environment. Each region combines its own natural conditions, planting dominant crops, using farming machinery suitable for the terrain characteristics, so as to increase the yield of farmland. The difficulty degree of the three regions to achieve the goal of maximizing farmers’ profit from large to small is as follows: The Qinba Mountains, The Guanzhong Plain and The Loess Plateau. The biggest resistance to achieve this goal is the lack of vitality in the farmland transfer market. The government should establish and perfect the rural farmland transfer system, protect farmers’ basic rights and give them certain subsidies. It is helpful to improve the enthusiasm of farmers to transfer land. In addition, the local governments should innovate the forms of farmland transfer, such as Land Pool, Entrusted Farming, and so on, helping farmers to increase their profit through various ways.
(3) There are significant differences in the natural and socioeconomic environment among the three regions in Shaanxi Province. Except for the above-mentioned countermeasures, each region has different priorities for managing on an appropriate scale: (a) The Loess Plateau: restore the ecological environment and improve the farmland quality, which can lay a solid foundation for the use of new production technology. (b) The Guanzhong Plain: try to avoid the occupation of farmland by urban land in the process of urbanization. Give full play to the advantages of talents and resources. (c) The Qinba Mountains: accelerate economic progress. On this basis, moderately increase the intensity of farmland development. Improve farming technology and constantly adjust the structure of labor force and farmland use.

Author Contributions

Conceptualization, methodology, software, formal analysis, investigation, data curation, writing, review, editing, Q.Z.; visualization, supervision, F.L.; Z.C. All authors have read and agreed to the published version of the manuscript.

Funding

This research was financially supported by College Students Innovation and Entrepreneurship Training Program of Shaanxi Province (No. 2020281) and College Students Innovation and Entrepreneurship Training Program of China (No. S202010697111).

Institutional Review Board Statement

Not applicable.

Informed Consent Statement

Not applicable.

Data Availability Statement

Acknowledgments

We acknowledge the large number of scientists who have developed models and tools used to create the simulations used in this study.

Conflicts of Interest

The authors declare no conflict of interest.

References

  1. Carter, C.A.; Chen, J.; Chu, B. Agricultural productivity growth in China: Farm level versus aggregate measurement. China Econ. Rev. 2003, 14, 53–71. [Google Scholar] [CrossRef]
  2. Wu, B. An Empirical Analysis of the Impact of farmland Scale on Agricultural productivity in China—Based on 2002–2016 panel data. In Proceedings of the 2018 8th International Conference on Education, Management, Computer and Society (EMCS 2018), Shenyang, China, 2 November 2018; Francis Academic Press: Abingdon, UK, 2018. [Google Scholar]
  3. Supawat, R.; Zhang, Y. Examining the economic performance of Chinese farms: A dynamic efficiency and adjustment cost approach. Econ. Anal. Policy 2018, 57, 74–87. [Google Scholar]
  4. Jiao, B. The trend and enlightenment of large-scale farmland management in Japan. Fudan J. Soc. Sci. Ed. 2000, 396, 103–109. [Google Scholar]
  5. Sanzidur, R.; Mizanur, R. Impact of land fragmentation and resource ownership on productivity and efficiency: The case of rice producers in Bangladesh. Land Use Policy. 2008, 26, 95–103. [Google Scholar]
  6. Luo, Q. The Influencing Factors of the Moderate Scale Operation of Agriculture—On how to achieve the optimal scale of land operation in China. Econ. Res. Guide 2008, 4, 12–13. [Google Scholar]
  7. Zheng, S. Research on the appropriate scale of land management. Issues Agric. Econ. 1998, 19, 3–5. [Google Scholar]
  8. Chen, Z.; Wallace, E.H.; Scott, R. Farm technology and technical efficiency: Evidence from four regions in China. China Econ. Rev. 2009, 20, 153–161. [Google Scholar] [CrossRef] [Green Version]
  9. Song, X.; Zhang, L. What is an appropriate scale operation of agriculture—Also on the relationship with an appropriate scale operation of land. Theory Mon. 2016, 38, 156–161. [Google Scholar]
  10. Zhang, X.; Ge, X.; Peng, B. A preliminary study on the appropriate scale of land management. Econ. Geogr. 2002, 22, 351–355. [Google Scholar]
  11. Zhang, H.; Wu, C. Determination of conditions and appropriate scale of agricultural scale operation in Jiangsu and Zhejiang. Econ. Geogr. 1998, 18, 3–5. [Google Scholar]
  12. Yang, G.; Hu, L.; Wang, W. A study on the appropriate scale of farmland management of farmers and their performance: An empirical analysis based on the survey of farmers in 6 counties and cities in hubei. Resour. Sci. 2011, 33, 505–512. [Google Scholar]
  13. He, W.; Cheng, E. Effects of land fragmentation and returns to scale in the Chinese farming sector. Appl. Econ. 2010, 33, 183–194. [Google Scholar]
  14. Ren, W.; Wang, G. Microeconomics; Tsinghua Press: Beijing, China, 2016. [Google Scholar]
  15. Zhong, Q. Improving Demand Elasticity of Agricultural Products to Alleviate Agricultural Weakness. North. Econ. 2009, 1, 73–74. [Google Scholar]
  16. Song, Y.; Lan, X. Economic Analysis of Maximizing Farmers’ profit under the Condition of Food Security. Qinghai Soc. Sci. 2005, 6, 42–45. [Google Scholar]
  17. Ke, S.; Shu, Y. The analysis of moderate scale management of forestland for household in collective forest area base on maximum of profile—Taking 140 households in liaoning province as an example. For. Econ. 2016, 38, 17–21. [Google Scholar]
  18. Wang, J.; Ju, J. Determination method and Empirical Study on the appropriate scale of farmland. Sci. Technol. Manag. Land Resour. 2010, 27, 15–20. [Google Scholar]
  19. Li, W.; Jin, X. Problems and Countermeasures of Food Security in Northeast China. Jiangsu Commer. Forum 2020, 10, 25–27. [Google Scholar]
  20. Xu, Q.; Yin, R. Literature Review on the Issues of Proper Scale Management of Farmland in China. China Land Scie. 2010, 24, 75–81. [Google Scholar]
  21. Wang, Q.; Cha, G.; Jia, J. The Research of Economy in Shaanxi Province Based on Cobb-Douglas Production Function. Adv. Sci. Ind. Res. Cent. Sci. Eng. Res. Cent. 2013, 5, 71–77. [Google Scholar]
  22. Antonio, A.; Carlos, A. technical efficiency and farm size: A conditional analysis. Agric. Econ. 2003, 30, 241–250. [Google Scholar]
  23. Oryani, B.; Koo, Y.; Rezania, S.; Shafiee, A. investigating the asymmetric impact of energy consumption on reshaping future energy policy and economic growth in Iran using extended Cobb-Douglas production function. Energy 2021, 216, 119187. [Google Scholar] [CrossRef]
  24. Yao, Y. Non-agricultural employment structure and the development of land lease market. China Rural. Obs. 1999, 2, 3–5. [Google Scholar]
  25. Cha, J.; Zeng, L.; Xu, J. Investigation report on the operation status of hubei agricultural microeconomic organization. China Rural. Econ. 2001, 8, 26–33. [Google Scholar]
  26. Ma, Z.; Yu, Z. An empirical study on the moderate land operation scale of heilongjiang province under different social and economic objectives. Bus. Res. 2012, 145–150. [Google Scholar]
  27. Lu, J. Analysis of the promotion and application of new agricultural production technology and agricultural machinery. Times Agric. Mach. 2019, 46, 33–34. [Google Scholar]
  28. Wang, Q.; Cha, G. Study on Sustainable Development of Shaanxi Economy Based on Evaluation Function. In Proceedings of the 3rd International Conference on Advances in Energy and Environmental Science, Zhuhai, China, 25–26 July 2015. [Google Scholar]
  29. Hua, D.; Li, J.; Xu, Y. Influence of topographical factors on spatial distribution characteristics of soil nutrients in qinba mountain area. In Proceedings of the IOP Conference Series: Earth and Environmental Science, Prague, Czech Republic, 7–11 September 2020; Volume 558, p. 032025. [Google Scholar] [CrossRef]
  30. Yu, Y.; Li, J.; Zhou, Z. Multi-scale representation of trade-offs and synergistic relationship among ecosystem services in Qinling-Daba Mountains. Acta Ecol. Sin. 2020, 16, 5465–5477. [Google Scholar] [CrossRef]
  31. Lin, H.; Hulsbergen, K. A new method for analyzing agricultural land use efficiency, and its application in organic and conventional farming systemsin southern Germany. Eur. J. Agron. 2017, 83, 15–27. [Google Scholar] [CrossRef]
  32. Kuang, B.; Lu, X.; Zhou, M. Provincial cultivated land use efficiency in China: Empirical analysis based on the SBM-DEA model with carbon emissions considered. Technol. Forecast. Soc. Chang. 2020. [Google Scholar] [CrossRef]
  33. Sikor, T.; Daniel, M.; Stahl, J. Land fragmentation and cropland abandonment in albania: Implications for the roles of state and community in post-socialist land consolidation. World Dev. 2009, 37, 1411–1423. [Google Scholar] [CrossRef]
  34. Han, H.; Zhang, X. Static and dynamic cultivated land use efficiency in China:A minimum distance to strong efficient frontier approach. J. Clean. Prod. 2020, 246, 119002. [Google Scholar] [CrossRef]
  35. Zhang, L.; Zhu, D.; Xie, B. Spatiotemporal pattern evolvement and driving factors of farmland utilization efficiency of the major grain producing area in China. Resour. Sci. 2017, 39, 608–619. [Google Scholar]
  36. Zhang, R.; Jiao, H. Spatial-temporal pattern differentiation and its mechanism analysis of using efficiency for provincial cultivated land in China. Trans. Chin. Soc. Agric. Eng. 2015, 31, 277–287. [Google Scholar]
  37. Tang, Y. Regional differences of land use changes and influencing factors in shaanxi province. Bull. Soil Water Conserv. 2013, 33, 301–305. [Google Scholar]
  38. Liao, L.; Gao, X.; Long, H.; Tang, L.; Chen, K.; Ma, E. A comparative study of farmland use morphology in plain and mountainous areas based on farmers’ land use efficiency. Acta Geogr. Sin. 2021, 76, 471–486. [Google Scholar]
  39. Li, Y.; Zhang, X.; Cao, Z. Towards the progress of ecological restoration and economic development in China’s Loess Plateau and strategy for more sustainable development. Ecol. Res. 2021, 756, 143676. [Google Scholar]
  40. He, Y.; Nan, L. Study of pattern evolution and spatial distribution of agricultural land resource endowment in shaanxi province. Res. Soil Water Conserv. Ecol. Res. 2017, 24, 186–193. [Google Scholar]
  41. Li, J.; Ren, Z.; Zhou, Z. Ecosystem services and their values: A case study in the Qinba mountains of China. Ecol. Res. 2006, 21, 597–604. [Google Scholar] [CrossRef]
  42. Li, R. Countermeasures for adjustment of agricultural structure and development of industries restrained by resources and envi ronment in Northwest China. J. Nat. Resour. 2002, 6, 737–742. [Google Scholar]
  43. Li, Y.; Wang, C. Impacts of climate change on crop planting structure in Chin. Adv. Clim. Chang. Res. 2010, 6, 123–129. [Google Scholar]
  44. Wei, H. Meta Analysis on Impact of Tillage Practices on Yield and Water Use Efficiency of Spring Maize and Winter Wheat on the Loess Plateau. Research Center of Soil and Water Conservation and Ecological Environment. Master’s Thesis, Chinese Academy of Sciences and Ministry of Education, Xi’an, China, 2017. [Google Scholar]
  45. Wang, W.; Cao, X. Temporal and spatial variation characteristics of main grain. Chin. J. Agric. Resour. Reg. Plan. 2020, 41, 155–162. [Google Scholar]
  46. Li, X.; Zhou, X.; Qiao, J. Self-developing ability of rural households and its impact on growth of the household profit: A geographical study. Acta Geogr. Sin. 2009, 64, 643–653. [Google Scholar]
  47. Zhou, X.; Zeng, L.; Wang, J. Rating-revenue integrated appraisal model: A synthetical approach for cultivated land appraisal in China. Resour. Sci. 2002, 24, 35–41. [Google Scholar]
  48. Xu, Y. Analysis on the restrictive factors of land scale management. Issues Agric. Econ. 2006, 13–17. [Google Scholar]
  49. Ma, C.; Liu, L.; Ren, G. Analysis of coupling coordination degree between livelihood strategies and land use behavior of farmers in rapid urbanization area. Trans. Chin. Soc. Agric. Eng. 2018, 34, 249–256. [Google Scholar]
  50. Cheng, X. The Influence of Rural Labor Structure on Cropland Abandonment—A Case Study of Wuling Mountain Area. Master’s Thesis, Southwest University, Chong Qing, China, 2020. [Google Scholar]
  51. Lin, S. Efficiency evaluation of farmland scale management. Contemp. Econ. Res. 2000, 37–43. [Google Scholar]
  52. Zhan, H.; Zhang, L. Empirical research on the determinats of farmers’ behavior of land transfer—Based on 142 farmers in two counties of Jiangsu province. Resour. Environ. Yangtze Basin. 2009, 18, 658–663. [Google Scholar]
  53. Yao, Y. An empirical study on induced institutional change under collective decision. China Rural. Surv. 2000, 21, 11–19. [Google Scholar]
  54. Yang, J.; Yang, G.; Hu, X. Impact of agricultural labor aging on farmland use efficiency of rural households: An empirical study from regions of differing economic development levels. Resour. Sci. 2011, 33, 1691–1698. [Google Scholar]
  55. Li, T. Analysis on dynamic change of land use in Shaanxi Province. Geogr. Res. 2004, 157–164. [Google Scholar]
  56. Wu, Z.; Gao, L. Study on efficiency of cultivated land use at plot scale in hilly-mountainous region. Southwest China J. Agric. Sci. 2013, 26, 1971–1976. [Google Scholar]
  57. Yang, S.; Li, S.; Luo, L. Study on the farmland use efficiency and its influencing factors in shanxi province. China Land Sci. 2011, 25, 47–54. [Google Scholar] [CrossRef]
  58. Cui, Z.; Zhang, H. Pursuing sustainable productivity with millions of smallholder farmers. Nature 2018, 555, 363–366. [Google Scholar] [CrossRef] [PubMed]
  59. Shen, J.; Zhang, F. Sustainable resource use in enhancing agricultural development in China. Engineering 2018, 4, 588–589. [Google Scholar] [CrossRef]
  60. Shen, J.; Bai, Y. Rhizobiont: An interdisciplinary innovation and perspective for harmonizing resources, environment, and food security. Acta Pedol. Sin. 2021, 3, 3–10. [Google Scholar]
Figure 1. Farmland distribution in Shaanxi Province (2018).
Land 10 00314 g001
Figure 2. (a) Farmland distribution in Shaanxi Province; (b) labor force distribution in Shaanxi Province.
Land 10 00314 g002
Figure 3. Farmland area of three regions in Shaanxi Province (2018).
Land 10 00314 g003
Figure 4. Farmland area in Shaanxi Province (2009–2018).
Land 10 00314 g004
Figure 5. The size of the labor force in the Loess Plateau (2009–2018).
Land 10 00314 g005
Table 1. Descriptive statistics of selected variables (Shaanxi Province and China).
IndexMinimumMaximumMeanSDMedian
Shaanxi ProvinceChinaShaanxi ProvinceChinaShaanxi ProvinceChinaShaanxi ProvinceChinaShaanxi ProvinceChina
Total Grain Production/10 kt1194.70 53,082.10 1245.10 66,160.70 1218.87 60,875.87 16.65 4982.86 1221.26 60,448.20
Number of People in the Primary Industry/104779.00 75,828.00 855.50 77,640.00 800.98 76,956.70 25.96 663.70 790.50 77,115.00
Total Agricultural Machinery Power/104 kw1889.27 87,496.10 2667.27 111,728.10 2262.68 100,066.24 258.07 7047.70 2241.85 99,577.50
Chemical Fertilizers Amount/104 t23.19 5404.40 241.73 6022.60 200.21 5793.67 73.22 206.30 229.92 5849.10
Farmland Area/103 hm23005.98 59,261.40 3134.87 68,271.60 3079.68 64,089.44 42.71 3164.23 3074.99 64,006.40
Table 2. Ridge regression analysis results.
BSBetatPR2F
Constant40.7865.006-8.1480.000 **0.808F (4,95) = 100.169,
p = 0.000
Total Power of Agricultural Machinery/kw0.0990.0080.19612.6130.000 **
Number of Primary Industry/1040.0260.0050.1045.0090.000 **
Fertilizer Amount/ton0.0640.0070.1829.7070.000 **
Farmland Area/106 hectares0.1330.0080.29116.0910.000 **
*: Omission of the same number.
Table 3. The appropriate scale of farmland management per household for farmers under different goals.
AreaGoalExisting Scale (hm2/Household)The Appropriate Scale (hm2/Household)Scale-Up (hm2/Household)
Shaanxi ProvinceMaximize farmland production1.01 3.88 2.87
Maximize farmers’ profits1.01 2.17 1.16
Loess PlateauMaximize farmland production2.98 10.77 7.79
Maximize farmers’ profits2.98 5.672.69
Guanzhong PlainMaximize farmland production0.77 3.66 2.94
Maximize farmers’ profits0.77 2.14 1.37
Qinba MountainsMaximize farmland production1.70 7.81 6.11
Maximize farmers’ profits1.70 5.06 3.36
Publisher’s Note: MDPI stays neutral with regard to jurisdictional claims in published maps and institutional affiliations.

