
An Exploratory Analysis of Expert and Nonexpert-Based Land-Scape Aesthetics Evaluations: A Case Study from Wales


School of Geography, University of Leeds, Leeds LS2 9JT, UK
*
Author to whom correspondence should be addressed.
Land 2021, 10(2), 192; https://doi.org/10.3390/land10020192
Submission received: 15 January 2021
/
Revised: 9 February 2021
/
Accepted: 9 February 2021
/
Published: 13 February 2021
(This article belongs to the Section Land Planning and Landscape Architecture)
Abstract
:The debate over the conceptual constructs of landscape aesthetics, specifically whether landscape quality is inherently related to landscape physical characteristics or is subjectively “in the eye of the beholder,” has continued for years. Solutions accommodating both the biophysical and perceptual aspects of landscapes are thus desirable for landscape planners and policymakers. In response to policy shifts that emphasise both expert and public landscape perspectives, this study investigates the relationships between formal and informal landscape evaluations. It analyses crowdsourced data describing landscape aesthetic quality (Scenic-Or-Not) and authoritative landscape quality assessments (the Landscape Assessment Decision Making Process (LANDMAP) of Wales). Some agreement was found regarding landforms most likely to be perceived as scenic or unattractive by experts and non-experts, which aligns with previous landscape perception studies. However, contested landscape typologies are identified formal and informal landscape aesthetic evaluations are compared. Several limitations and implications for current formal landscape assessment paradigms (GIS based and vertical) are discussed and several approaches for capturing on-the-ground perceptions are suggested including recent extensions to GIS derived viewsheds (e.g., vertical voxel viewsheds).
1. Introduction
For many years there has been a vigorous debate on whether landscape quality relates to inherent physical landscape characteristics or is in the eye of the beholder [1,2]. Given these philosophical contrasts, a successful marriage of these objective and subjective paradigms has not yet been achieved, making landscape evaluation challenging. There have been numerous efforts to devise techniques for landscape assessment [3,4,5], and solutions that balance the perceptual and biophysical aspects of landscapes are still being sought [2]. Perceptual approaches to landscape aesthetic assessment are unavoidably problematic due to differentiated preferences driven by varying cultural backgrounds [6] and social stratum [7], as well as the cost of eliciting collective perspectives. Thus, biophysical approaches that rely heavily on expert knowledge remain favoured choices in landscape management and planning practices, such as nature preservation and designation [2,8,9]. Inevitably, such expert-based approaches have also faced criticism for their lack of objectivity, transparency, and replicability (even among experts) [2,10].
The development and ratification of the European Landscape Convention’s (ELC) landscape policy set a broader definition of landscape as, “an area... as perceived by people,” placing the public as central to any understanding of landscape. This document aims at pressing on the establishment of procedures for public participation in landscape management, protection, and planning practices [11]. The identification and classification of landscapes were underlined and the definition of landscape quality objectives derived from public consultations were required [12]. The focus of landscape assessments in the signatory countries has since shifted from expert to local/nonexpert knowledge in response to this guidance [13]. Despite emphasis on the public involvement, the formulation of landscape quality objectives has not been standardised and the concept of quality indicators in the ELC continues to be questioned [12]. As such, it is expedient for practitioners to avoid dealing with diverse perspectives and perceptions from multiple people [14].
The implementation of the ELC landscape policies, the UK Landscape Character Assessment (LCA) framework [15], has at its centre a hierarchical classification system of landscape character. The LCA initially uses a typology of landscape character based on the visual distinctiveness and continuity of combinations of geology, landform, soils, vegetation, land use, field patterns, and human settlement that is applied through spatial hierarchical mapping. Next, judgements are imparted about landscape character, leading to decisions concerning the management, planning, and protection of the various landscape types and areas. The process of characterisation in the first phase is considered objective while assigning quality or value in the second phase is subjective.
Notwithstanding, both processes in the framing of landscape characters and values are dominated by expert perspectives as the mainstay of formal landscape evaluation [16]. The expert appraisal of landscape aesthetic values as part of the LCA has been largely criticised as a subjective and opaque process, where the landscape perceptions held by the public have hitherto been insufficiently included [17].
A few landscape characteristics that are well-recognised by experts to contribute to scenic quality are used in the LCA classification scheme. For instance, physical factors such as topography, water, land cover, and human artefacts are seen as determinants of scenic quality, and the landscape is classified into relatively homogenous units of land (i.e., character areas) based on visual interpretations of these data. The characterisation of landscape description units (LDUs) based on static maps with the aid of GIS is claimed to be an objective process, utilising landscape perceptions from a birds-eye perspective rather than that of a human [18]. However, this overlooks the subjectivity involved in choosing predetermined criteria for LDUs [19]. Moreover, the subsequent on-site assessment heavily relies on the subjective judgments of experts at a few representative locations from which the valuation is formulated and generalised to the entire character area. Thus landscape-intrinsic qualities are assessed at limited, predefined locations and are subject to interpreter preferences, shaped by their professional backgrounds and experiences [7]. Such qualitative evaluations may overlook any interactive effects of landscape components, for example, visual screening effects caused by vegetative patterns or terrain [20], and scenic quality may be inappropriately extrapolated over a large area. There have been very few studies that have examined how professional landscape evaluations relate to those held by citizens.
Crowdsourced spatial information has been increasingly used to understand human/landscape interactions from local to continental scales [5,21,22]. Data generated by citizen sensors [23] have the potential to be more closely related to on-the-ground perceptions and less bounded by professional biases [4]. They also have the potential to contribute to formal landscape assessments. In the UK, a web-based crowdsourcing project, Scenic-Or-Not (http://scenicornot.datasciencelab.co.uk/ (accessed on 12 February 2021)) collects people’s landscape preferences at a granularity of 1 . Participants are invited to rate the scenicness of randomly presented photographs from each 1 grid on a 1 to 10 scale. Empirical studies using these data have investigated the impact of scenic beauty on human health [24] and happiness [25], explored the composition of landscape scenic beauty as perceived by the public [26], verified landscape scenic estimation based on Flickr and OpenStreetMap data [27] and constructed a language model to predict landscape scenic beauty [28]. In landscape evaluation, using photographs as proxies to elicit public landscape preferences is generally considered an acceptable approach for landscape aesthetic assessments, since each ground-level image approximates what people perceive at each specific location, despite a continuing debate on its reliability and validity [2,29,30]. Scenic-Or-Not’s wide and granular coverage provides a valuable resource that could be used within LCA practice, and to respond to the ELC’s policy to involve public perception.
It is not the intention of this study to aspire to any ultimate resolution for the landscape classification system, but instead to seek the benefits of synergy to supplement the formal practice of LCA. The central aim is to leverage the granular coverage of crowdsourced spatial data concerned with scenic beauty and evaluate the validity of the LDUs of the formal paradigm by investigating the variability of public opinions underneath these distinct character areas ”objectively” delineated by experts. Based on these units, this study attempts not only to understand which perspectives on landform typology are viewed differently between landscape architects and the public but also to identify which perspectives are unlikely to be disputed.
2. Data and Methods
2.1. Study Area
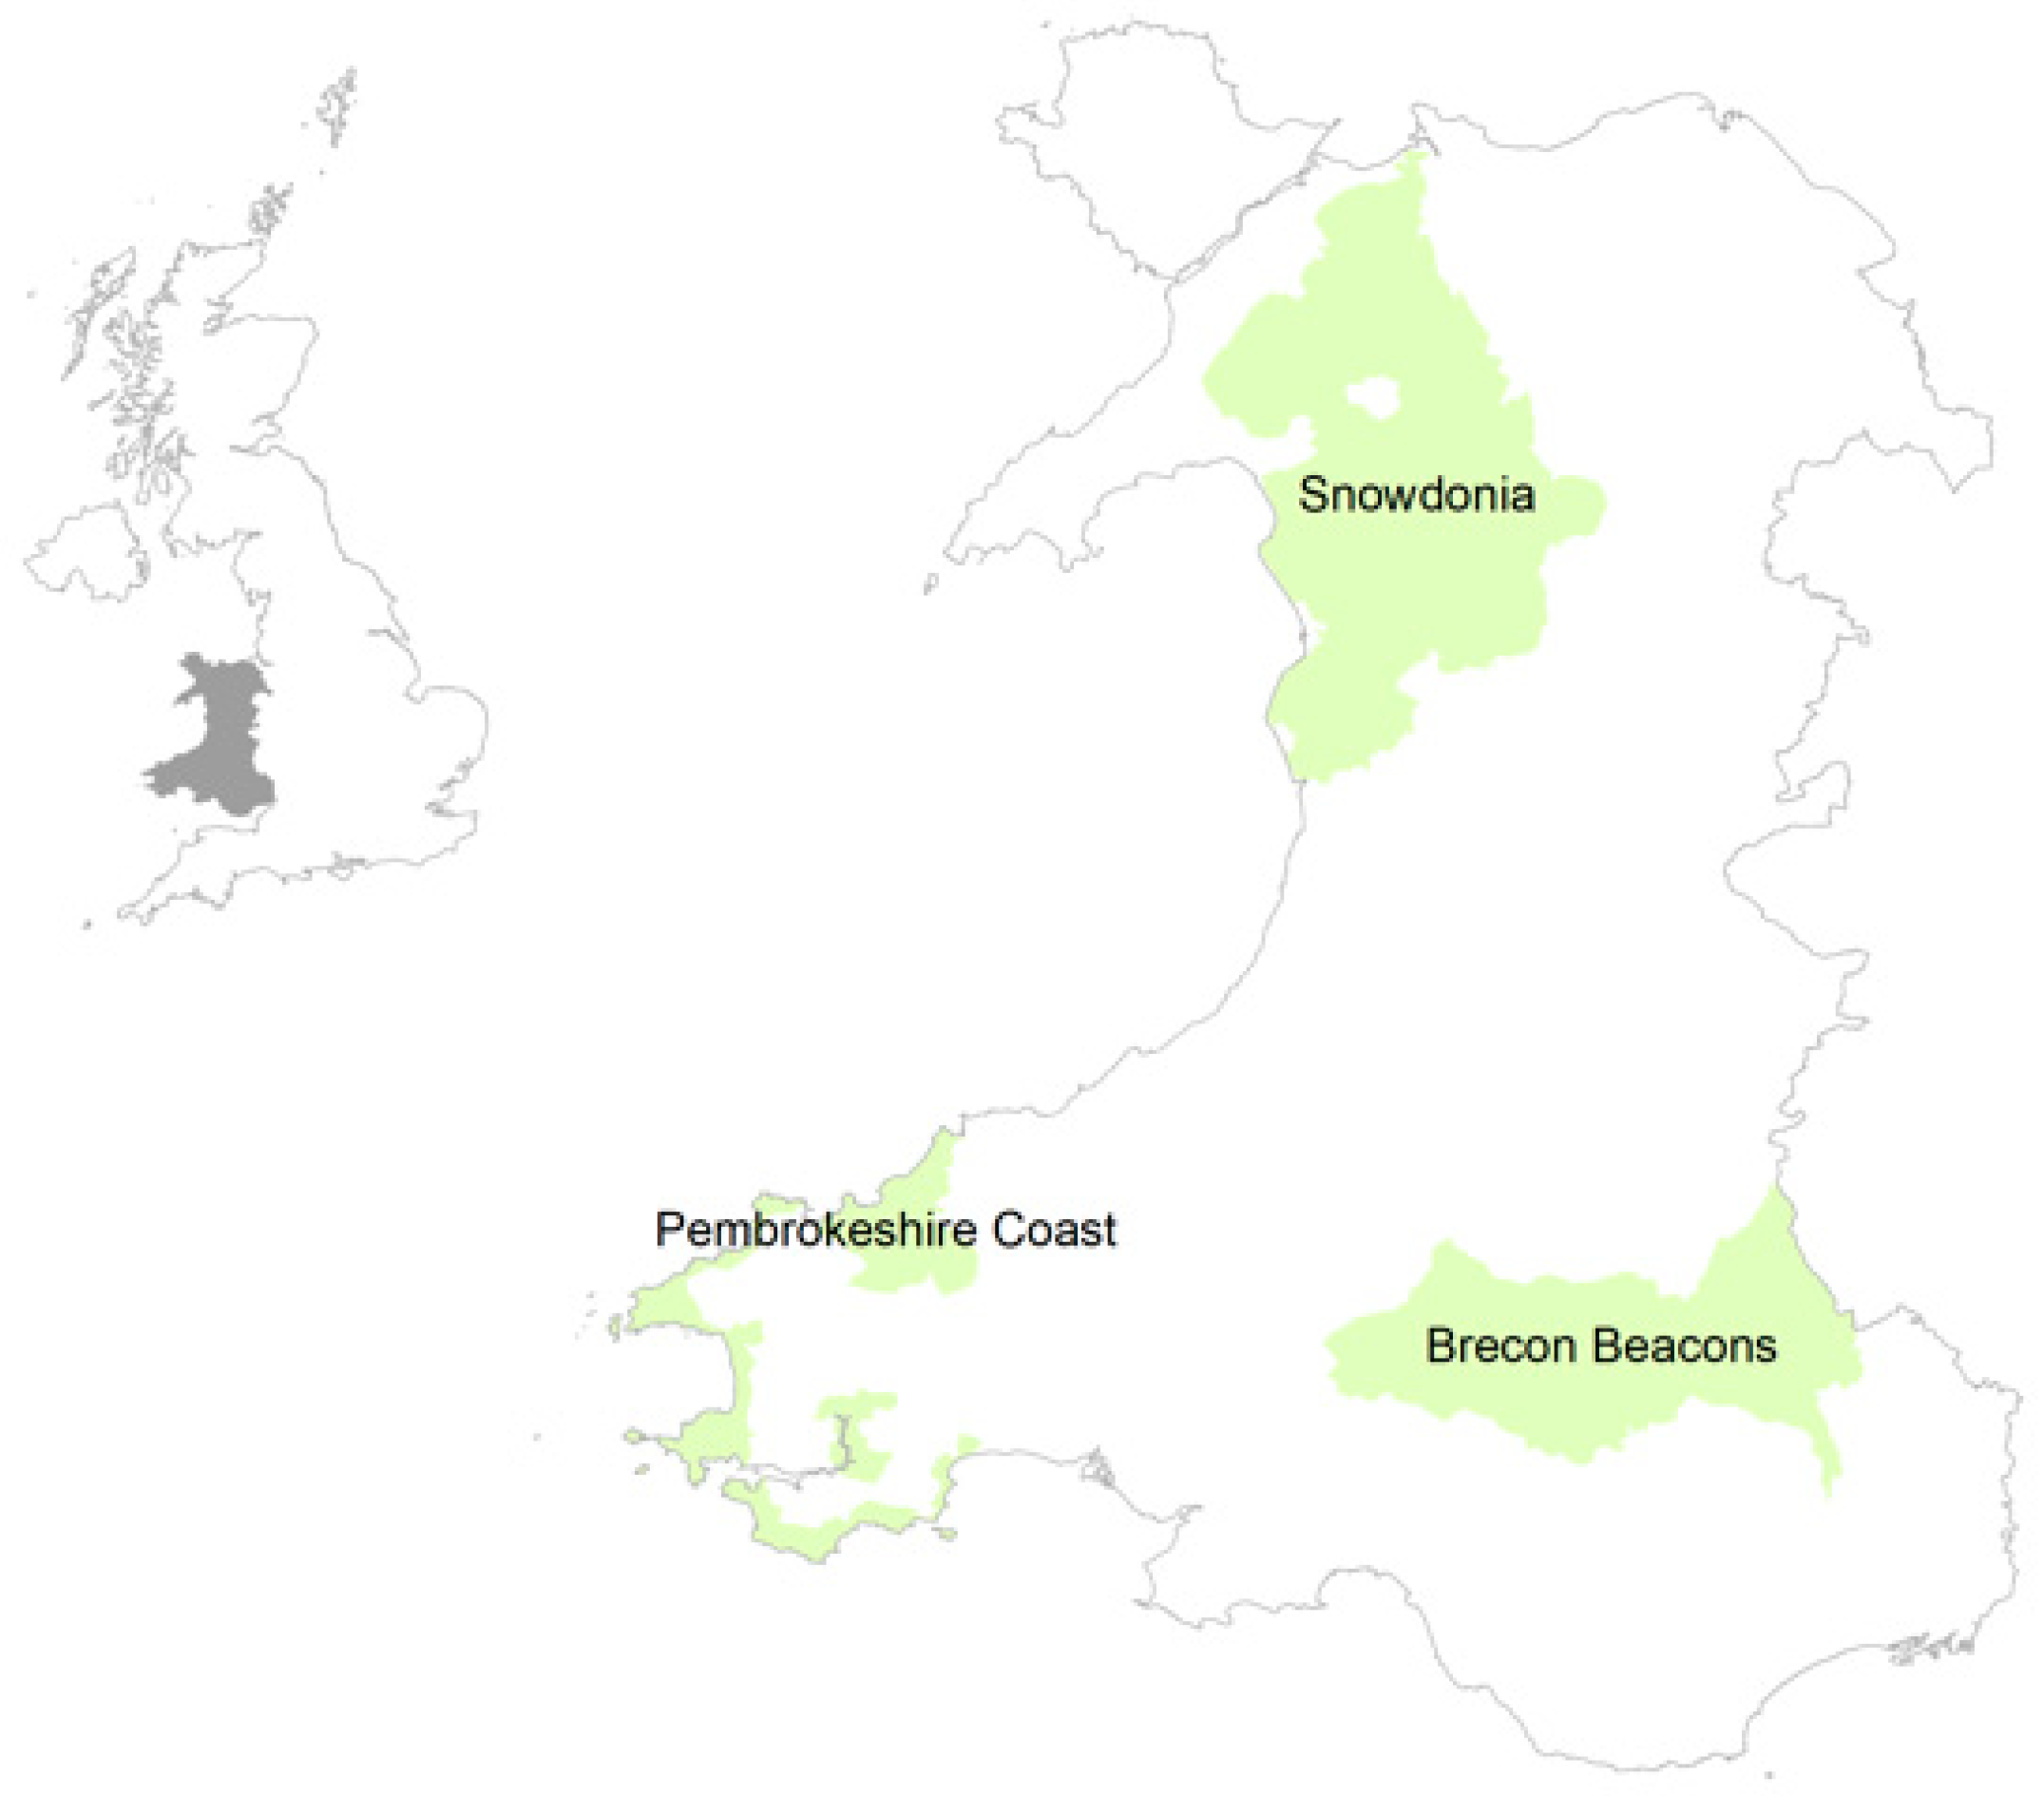
Wales is a relatively small country (approximately 21,000 ) in the United Kingdom, bordered by England to its east and surrounded by the Irish Sea and the Bristol Channel to its north, west and south. It is famed for the mountainous and coastal landscapes with three National Parks—Snowdonia, the Brecon Beacons and the Pembrokeshire Coast—bringing numerous economic value and benefits of tourism (see Figure 1). The main population areas are situated in South Wales, including cities such as Cardiff, Swansea, and Newport, with another significant population area in North East Wales.
2.2. Data
2.2.1. LANDMAP Visual and Sensory Aspect
In the early 1990s, the methodological deficiencies of conventional landscape character mapping in terms of the vagueness of the qualitatively evaluative criteria and the robustness of quality assurance were evident, hindering the justification of policy-making, e.g., designation of “quality” landscapes. Consequently, Wales commenced developing its national landscape assessment methodology (known as the Landscape Assessment Decision Making Process, LANDMAP), providing greater consistency and defensible information on landscape for policy- and decision-making.
The LANDMAP data serves as the Welsh landscape baseline, comprising five landscape aspects—geological landscape, landscape habitats, visual and sensory, historic landscape, and cultural landscape—each of which considers a different theme but collectively covers the scope of a landscape’s character. Each aspect has its own unique map layer and survey records carried out by the local authority and landscape architects which have been, in turn, joined as five nationwide themed datasets.
The visual and sensory aspects were used in this study where the landscape was classified into the distinct character areas as perceived through human senses. These areas were drawn upon the spatial overlays using the physical attributes of landform and land cover information accessed through the Geo-Portal for Wales (http://lle.gov.wales/catalogue/item/LandmapVisualSensory/ (accessed on 12 February 2021)). This dataset consists of 1,991 distinct character areas which were characterised in the form of discrete polygons and allocated on a hierarchy of four levels. The level 1 typology was defined in accordance with broad landform and land cover and was consecutively collated into levels 2 and 3 as landform and land cover, respectively (Table 1).
All these aspect areas were identified to the level 3 classes with at least a few specific areas (174 out of 1991) categorised into the level 4 typologies. More detailed definitions for the level 1–3 classification categories shown in Table 1 can be found in [31]. Each predetermined aspect area was then refined and attributed with descriptions of characteristics, management recommendations, criteria-based evaluations, and assessments through field survey. Four main criteria—scenic quality, integrity, character, and rarity—were evaluated on an ordinal scale of importance, underpinning the overall evaluation of landscape quality. Four levels of ordered categories—low, moderate, high, and outstanding—were attributed while assessing the importance of each evaluated criteria. Detailed definitions for the scale of importance are given in Table 2. The aspect of scenic quality was adopted to represent the outcome of expert-led assessment for the following analyses in this study.
2.2.2. Scenic-Or-Not
This website allows people to evaluate places in Britain by rating photos collected from the Geograph project (https://www.geograph.org.uk/ (accessed on 12 February 2021), which is the early volunteered geographic information (VGI) campaign in the UK. This project invites people to contribute geographically representative photographs and information for every square kilometre. The Scenic-Or-Not dataset contains 212,212 photos at distinct locations, each of which has been rated by at least three people on an integer scale of 1 to 10, with 10 being the most scenic and each square kilometre contains one photo. Following the homogenous assumption of scenic quality implicitly made by the landscape characterisation approach, all scenic ratings within each aspect area were aggregated to calculate the mean and entropy of scenic scores. A subset of the Scenic-Or-Not dataset covering the study area was employed to represent the public opinions on landscape aesthetics, containing a total number of 138,312 scenic scores associated 19,063 images. Hereafter, “scenicness” is used to simply refer to these scenic ratings.
2.3. Methods
2.3.1. Shannon Entropy
Given the Scenic-Or-Not images with different numbers of ratings but at least 3 votes on a discrete 1–10 scale, these integer scores allow the calculation of not only the central tendency of scenicness but also the variability or dispersion of collective opinions. The Shannon entropy metric was borrowed from the information field and used to quantify the dispersion of opinions regarding each specific landform [33]. This metric was originally developed to determine the average minimum number of bits required to fully encode a message in relation to the statistical distribution of possible messages. It has been widely employed in many disciplines (e.g., statistics, physics, and communication). The mathematical equation is as follows:
where represents the collective scenic scores for each image, and is the probability of occurrence of the discrete outcome ( herein).
2.3.2. Generalised Linear Model
The associations between the landscape typologies and scenic quality assigned by experts and non-experts were analysed using general linear models (GLMs) where the dummy coding was used with the same reference category for comparison. For the expert-based evaluation, each of the ordinal levels was dichotomised as a binary response variable to fit the binary logistic regression model as follows:
where indexes the observation, and denotes the four memberships of scenic quality; represents the dummy-coded categorical variable ( herein). The logit link function is employed as the left side of Equation (2) to model the log of the odds, resting on the assumption of a logistic distribution for the error term. However, it is not suited for modelling the continuous response such as average of scenicness herein. Thus, the normal GLM, employing the identity link function and assuming a normal distribution for , known as an ordinary linear regression model, was used with the form shown in Equation (3):
As mentioned, the difference in the equation is on the left side and the coefficients are commonly estimated by the ordinary least squares (OLS) rather than the maximum likelihood (ML) method, viewed as a special case of GLM thereof [34]. All statistics and analyses were implemented via a set of packages in the open-source RStudio Environment (v. 1.3).
3. Results
3.1. Exploratory Analysis
Table 3 shows the contingency table of the landscape typologies (11 level-2 classes) and the corresponding four ordinal levels of scenic quality rated by experts. From the marginal distribution, 19% of the 1,986 distinct aspect areas were categorised as “built land,” probably indicating the highly fragmented but clearly human-made patterns for map-based characterisation; the majority of these aspect areas were evaluated as the middle of scenic spectrum (moderate scenic quality: 38%, high scenic quality: 36%).
Given the aspect areas with low scenic quality, 56% of the corresponding landforms turns out to be the “built land” with a probability of 0.19 when considering the moderate scenic quality. At the opposite spectrum, the rate of the “coastal” typology (2.72%) was higher than other landforms. Despite the same marginal distributions (13%), the respective conditional distributions of the “exposed upland or plateau” and “hills, lower plateau, and scarp slopes” rated as high scenic quality were 13% and 19%. A chi-square test of independence showed that there was a significant association between landform and scenic quality, .
The point-based Scenic-Or-Not data were aggregated over the aspect areas of the formal landscape assessment to make these data comparable with the areal unit-based data. Following the implicit assumption of homogenous character adopted by the LCA approach regarding landscape perceptions, the equal weighting for each scenic vote, regardless of the corresponding image content, was considered to calculate the underlying central tendency and variability of public scenic perceptions for a given aspect area. There were 1716 aspect areas intersected by the locational Scenic-Or-Not data.
Figure 2 illustrates the distribution and density characteristics of the mean and Shannon entropy measures of collective scenic ratings for each landform typology. The former nearly follows a normal distribution, ranging from 1 to 9 with a mean of 4.41 and a median of 4.45, while the latter exhibits a negatively skewed distribution ranging from 0 to 3.25 with a mean of 2.6 and a median of 2.78. The boxplots for each landform type illustrate a difference in the collective scenic perceptions among these typologies in terms of their central tendency and variability. Thirty-nine percent of the total variation in average scenic score was accounted for by these classification typologies, confirmed by a Welch one-way ANOVA, .
3.2. Variability of Public Perceptions on Scenic Beauty
The entropy metric provides an insight into the underlying variability of the public opinions on landscape scenic beauty within a given landform. Several features are worthy of observation here. At first glance, all distributional patterns exhibited negative skewness in different degrees, indicating the deficiency in using these presumably homogeneous LDUs to delineate landscape perceptions. The typologies associated with upland turned out to exhibit sharply peaked distributions and concentration around a higher entropy of 3 bits. The “exposed upland or plateau” typology exemplified these highly sharp and compact unimodal distributions while the peak splitting was observed in the case of “upland valleys.” Likewise, those concerning lowland, except “coastal,” demonstrated similar unimodal shapes but with slightly gentle curves such as “rolling lowland” and “lowland valleys.” Noteworthy is that the “flat lowland or levels” and “coastal” typologies with fewer effects in topographic relief had a wider range in the entropy measures of scenic scores. Some characteristics possibly overlooked and subsumed within one typology were briefly reported in the discussion.
A few landforms concerning development and water typologies, such as “built land,” “developed unbuilt land,” and “inland water” had relatively low central values with wider dispersion, compared with those regarding upland and lowland. This suggests that the public opinions on the scenic quality of these landforms were generally less variable than the other typologies, but there were larger variations in the entropy metrics as well. A possible interpretation is that a consensus of scenic quality on these landforms exists; nevertheless, the consent could be context-specific and vary drastically from place to place.
Notably, the “inland water” falls into a bimodal distribution, reflecting two different groups of variability where the major group displays greater variation than the minor one. Although the presence of water has been empirically evidenced as a preferable landscape element in the previous landscape perception studies [7,35], radically diverging views on scenic beauty within water areas was also evidenced, which could be explored further by breaking this landform down into the level-3 typologies to investigate whether different types of water bodies such as lakes and rivers exert an influence over the observed distribution that is, nonetheless, beyond the scope of this study.
3.3. Summary of Expert Perspectives
The relationships between landscape typologies and scenic quality assigned by the experts and non-experts were further assessed by a set of generalised linear regressions and a simple linear regression. For ranking, the same dummy coding was used with the reference category of “built land,” which allows for the calculation of the odds ratio and confidence intervals associated with different landscape typologies compared to the identical baseline. Figure 3 illustrates the outcomes of each GLM on a log scale to visually compare the degree of uncertainty associated with the point estimate that was denoted by the error bar of 95% confidence interval and standard error. The point estimates at 5% significance levels were denoted by the colour blue. The associated exponentiated coefficients, indicating the odds ratios between the specific landform and the baseline one, are summarised in Table 4 for ease of interpretation.
In Figure 3, the model for the low scenic quality shows the best performance among the four logistic models, as indicated by the goodness-of-fit measures of and Akaike information criterion ( [36,37]. This appears to be plausible given that the abundant aspect areas of “developed unbuilt land” and “built land” were consistently associated with low scenic quality. By contrast, the model for moderate scenic quality exhibited the lowest performance () where only the odds ratios associated with four of the landforms (that is, “coastal water,” “coastal,” “flat lowland or levels,” and “rolling lowland”) were statistically significant, as denoted by the colour blue. Concerning high and outstanding scenic quality, all landform types were statistically significant at 5% significance levels. A glimpse of performances over the four models suggests that these landform typologies explain the probabilities for the middle scenic qualities less than those for both ends of the spectrum.
Considering the low scenic quality, the effects of all the landform types except “developed unbuilt land” were negative and statistically significant, suggesting a decreased likelihood of being rated as low when compared to the “built land.” In other words, “built land” is more likely linked to low quality than other typologies based on expert professional views (see Table 4,). This is prima facie evidence of the subjectivity in the characterisation process of the desk study despite the claimed objectivity. Among the significant typologies, the respective odds of being evaluated as moderate within the landforms of “rolling lowland” and “flat lowland or levels” were around 2.2 and 1.6 times greater than within areas of “built land,” respectively. In contrast, the relative odds within the “built land” were around 10.4 and 7.5 times greater than within the “coastal water” and “coastal” areas, respectively. The coastal landforms were not only the most likely to be evaluated as having high scenic quality, but also to have an increased likelihood of being rated with outstanding quality. Additionally, “hills, lower plateau, and scarp slopes” and “lowland valleys” were respectively 5.72 and 5.44 times more likely than “built land” to be evaluated as having high scenic quality. Notably, these two landforms were relatively easier to access compared to those most likely associated with outstanding beauty. The typologies associated with water bodies (i.e., “coastal waters,” “coastal,” and “inland water”) were consistently the most likely to be evaluated as having outstanding scenic quality, corresponding to the human preference for water presence found in previous studies [7,35]. The second most likely landforms to be assessed as outstanding were upland landforms. The odds of “exposed upland or plateau” and “upland valleys” being rated as outstanding were respectively 27 and 18 times greater than that of “built land.”
3.4. Summary of Non-Expert Perspectives
Since the average scenic scores aggregated over the aspect areas exhibit a normal distribution, this average scenicness is regressed on the dummy-coded covariate, using an OLS model. The result is summarised in Table 5, and the coefficient estimates yielded are statistically significant at the 0.001 level. This suggests there are significant discrepancies in collective scenic perceptions between different landforms that could be informed by the map-based characterisation procedure. The intercept corresponds to the average scenic scores for the reference category (“built land”) and the individual coefficient estimate of each landform class denotes the expected difference in the mean of scenic ratings compared to the baseline one. For example, the “upland valleys” and “lowland valleys” predict average scenicness around 1.7 and 1.4 greater than that of the baseline category, respectively.
3.5. Comparison of Perspectives between Experts and Non-Experts
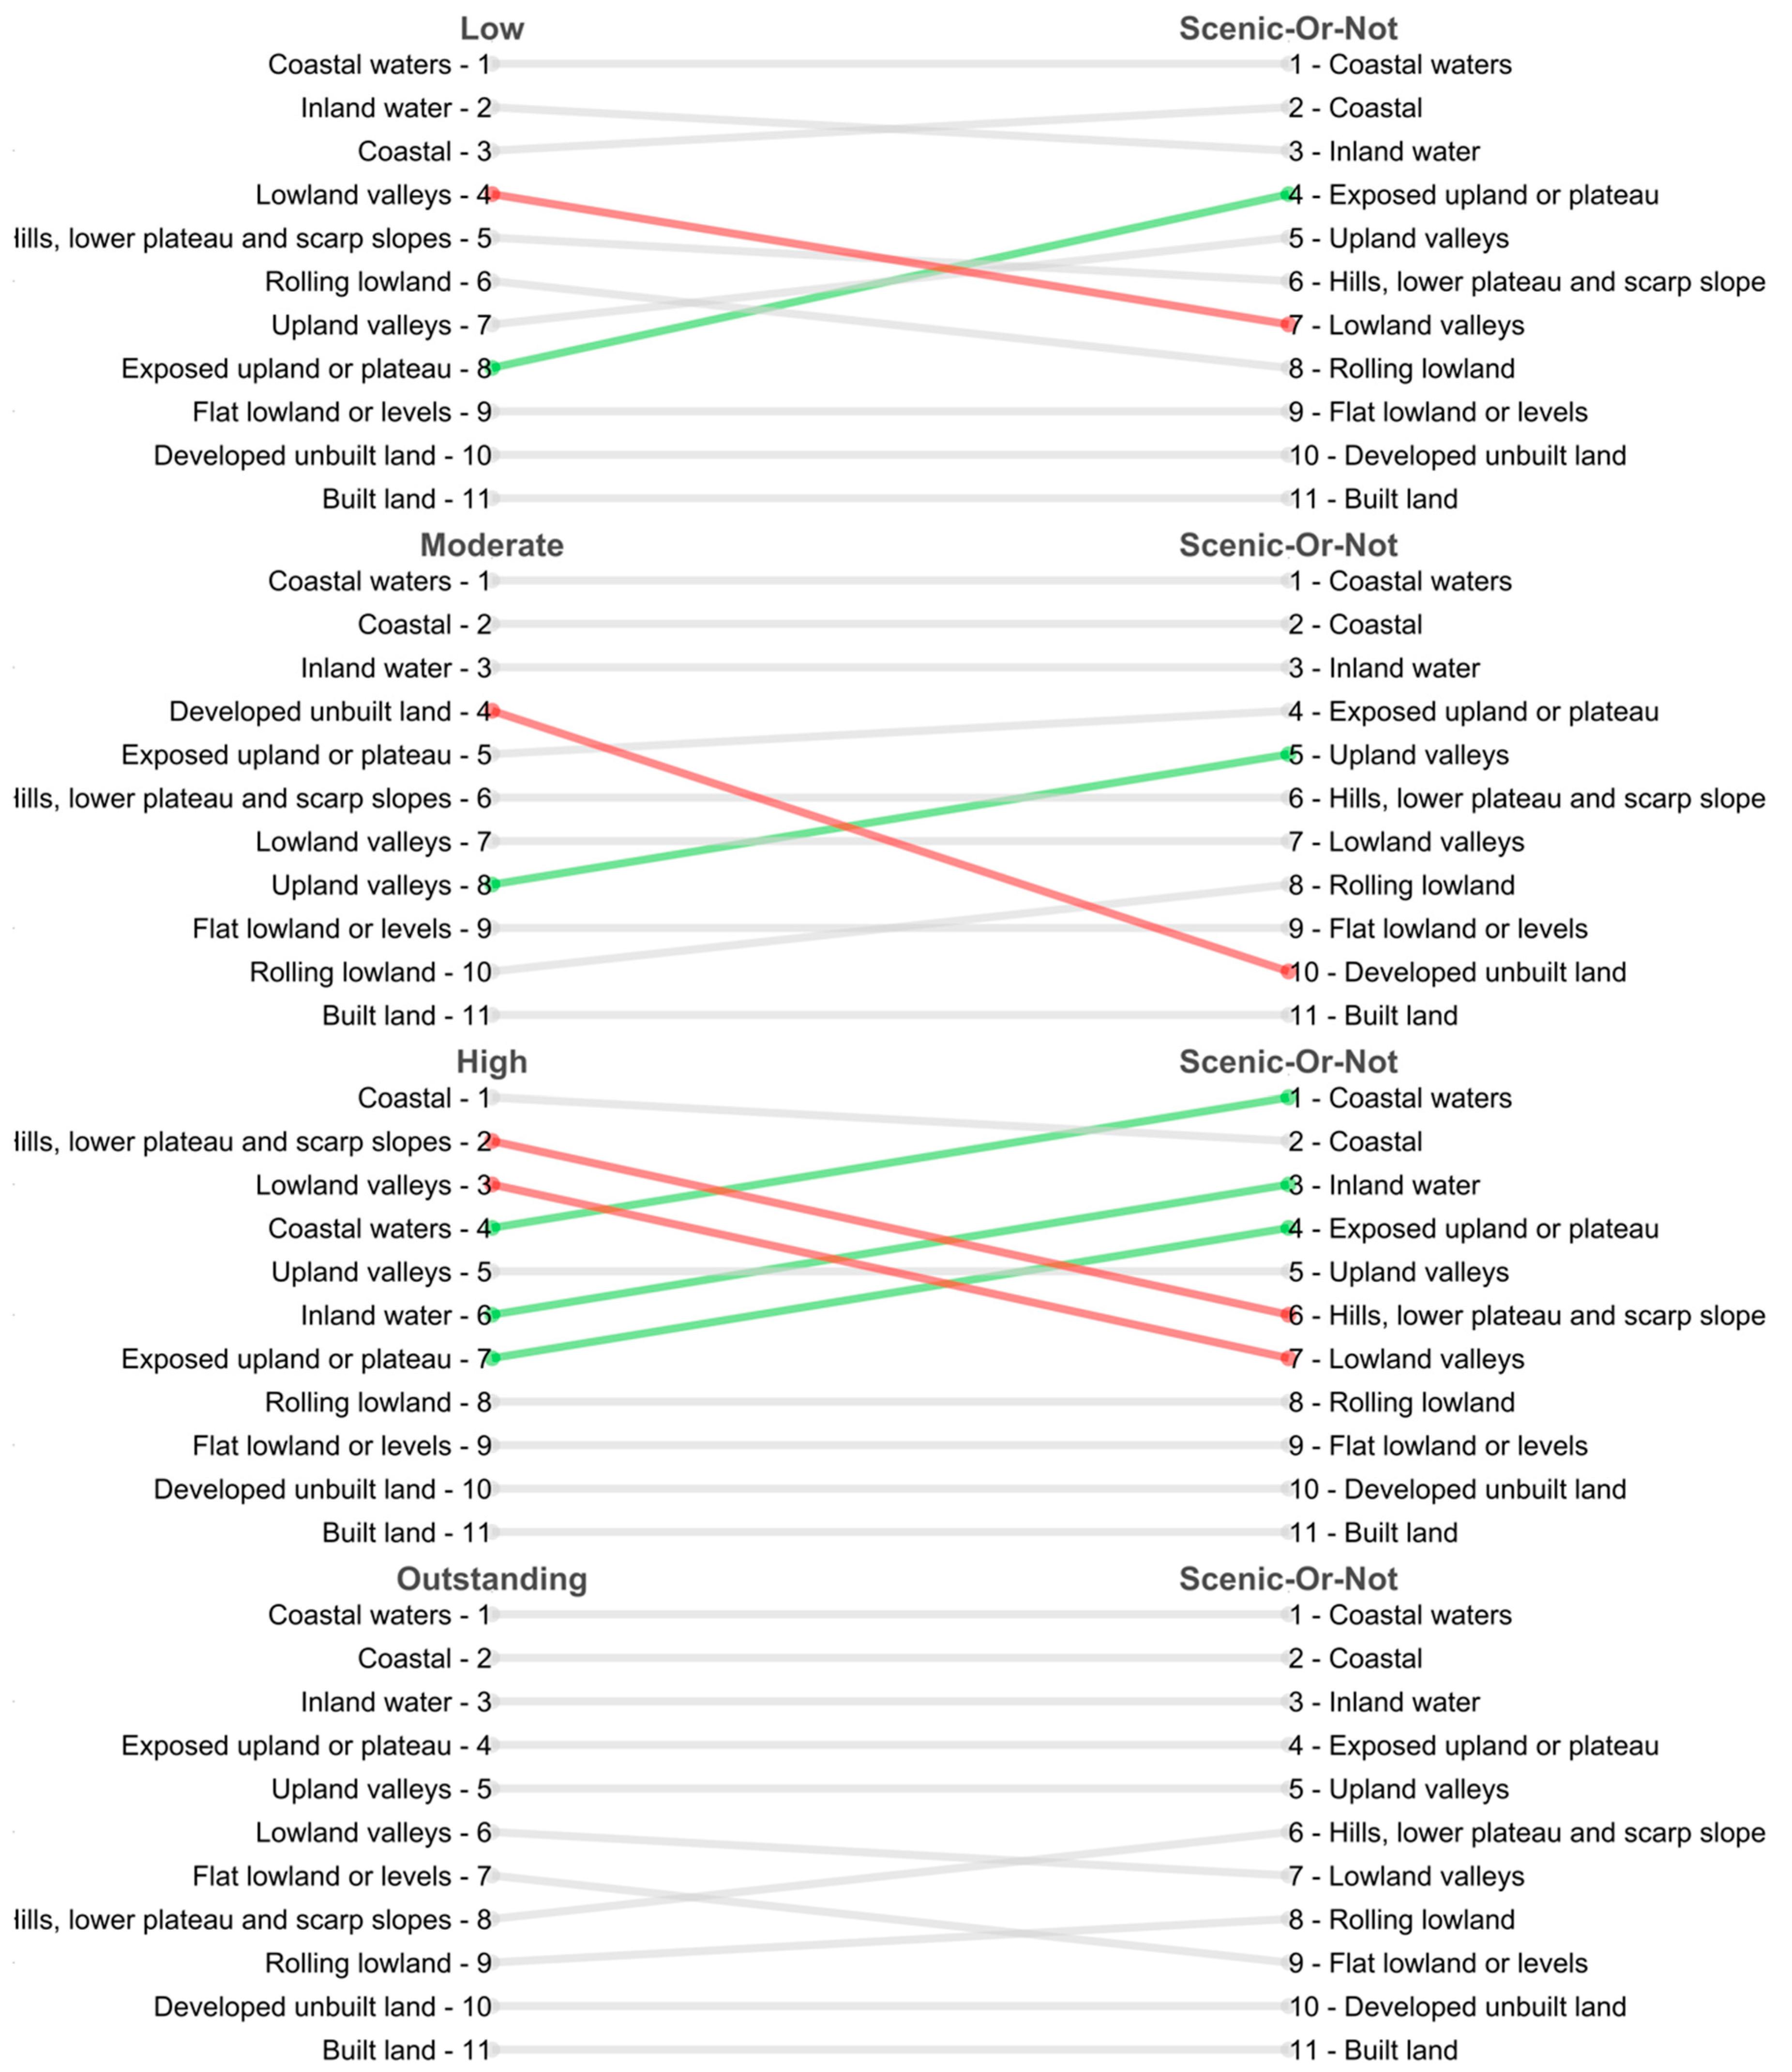
The marginal effects of the landform typologies on the public scenic ratings and the expert evaluations of scenic quality could be used to further produce different ranking orders. These relative rank positions enable the comparison of the orders from both perspectives. Figure 4 illustrates the changes in order between both sides across four levels of scenic quality. The larger rank-order differences (that is, change greater than or equal to 3 positions) are highlighted in green (≥3) and red (≤−3) and the rest are shaded in grey, showing which typology may be contesting from both perspectives. A relatively small amount of significant change in rankings is seen at the outstanding scenic quality, suggesting there exists mutual consent at the highest end of the spectrum. There is, however, a large amount of significant disparity in ranking at the level of high scenic quality. Moreover, the landform typologies associated with water bodies are generally ranked in the top three whilst those associated with man-made landscapes are bottom-ranked.
4. Discussion
4.1. Implications for LCA
The exploratory analysis provides some insights into the central tendency and variability in the public perceived scenicness underneath the presumably homogenous aspect areas characterised by the landscape architects according to the similarity of physical attributes. Broadly speaking, areas of water received the highest scores on average scenicness, followed by those of upland, lowland, and development, with a sole exception of “coastal” areas that recorded higher scenic values than the upland areas but are categorised as lowland. Concerning the underlying variability indicated by entropy metrics, upland areas were found to be highly variable, followed by lowland, water, and development areas.
It has been acknowledged in the field of landscape assessment that some landscape characteristics—terrain, water, ground cover, and human artefacts—are permanently recognised as contributing factors of scenic quality [38]. In line with the literature and irrespective of professional expertise, the water-related typologies were ranked in the top three among all the landforms, while those associated with human artefacts were on the opposite end [20,39]. Meanwhile, the underlying scenic ratings of the characterised units associated with water and human artefacts features tend to exhibit less variability, reflecting consensual values in scenic quality. Also, this observation may suggest the formal classification scheme and evaluation for these characters could effectively correspond to the perceptions on the ground, compared to other landforms. This is, nevertheless, not the case for the landforms with a complex interaction of terrain and ground cover, resulting in the diversity of physical landscape characteristics as well as the variability of landscape perceptions. The “exposed upland or plateau” typology particularly exemplifies this type of landform where there is a consistently high amount of variation in the scoring, depicting the extreme variability in opinions, given the high centre and narrow spread of entropy measures. A possible justification is that an increase in relief implies diversity and complexity involved therein, where the topographical and meteorological effects were probably magnified. This may lead to positive or negative influences on landscape perceptions (e.g., the grandeur of mountains or harsh weather conditions). However, these landscape intricacies could be overlooked and subsumed within one type by the simplicity of the current spatial framework.
The most plausible explanation of this finding might be that the classification scheme rests on the assumption that visual quality is an amalgamation of landform and land cover elements where a variable relationship presumably exists. As the landform characteristics increase in dimension, for instance, the increase of relative elevation in magnitude (e.g., from flatlands through hills to mountains), the land cover pattern becomes less important as an element of visual quality. In contrast, with the decrease in landform dimension, the importance of the variety of ground cover increases for the maintenance of high scenic value [40]. However, the complex interrelation of landforms and land covers on human perception, such as the visual screening effects caused by vegetation or adjacent hills may hardly be accounted for by the current practice. Hence, the classification method would remain an appropriate basis of appraisal for low-lying landscapes, but any interactive effects of the individual elements could be overlooked [19].
The comparison of aesthetic assessments between the experts and non-experts also has implications for the formal landscape assessment paradigm in the context of public participation. Regardless of professional expertise, water bodies (that is, “inland water” and “coastal waters”) were generally perceived to possess comparatively high scenic quality among all the landforms by the public, which was also the case in the expert evaluations. Likewise, landscapes dominated by human-imposed changes (that is, “developed unbuilt land” and “built land”) were more likely rated as having low scenic quality from both sides. Furthermore, the pairwise ranking comparisons of subjectivity in terms of the geomorphological effects on scenic quality reveals that mutual consent is located towards the upper end of the scenic spectrum. There was a relatively small amount of significant change in rankings at the highest end of the scale, and less consensus was found in the middle of the spectrum. It may be noteworthy that at the opposite end of the spectrum, the “exposed upland or plateau” typology tends to be more appreciated by the laymen, rising four places to fourth. In contrast, the ranking of the “lowland valleys” typology drops from fourth to seventh position. Given low scenic quality generally typified by slightly undulating topography and monotonous patterns of vegetation, this may suggest the scenic quality of these two landforms could be under- (or over-) estimated by specialists. The virtue of the hierarchical classification approach allows identification of the most likely contesting descendant by digging deeper into the finer classes (that is, level 3 typologies). The textual information associated with those scenic ratings can also be retrieved in the sourced repository that gives researchers insight into what landscape features might be ignored; however, that is beyond the scope of this study.
4.2. Limitations and Outlook
The critical issues in crowdsourced data are centred around their reliability and veracity [41]. The demography of the participants of Scenic-Or-Not is untold, and the reliability of scenic ratings may not be asserted due to the inherent biases concerning participant inequality [4]. For instance, without demographic characteristics of participants, the representativeness of the scenic ratings for the general public is questionable for meeting the research context [42]. Biases, introduced by a small group of prolific contributors [43], could not be filtered out in parallel as well. Albeit with these issues, researchers have continuously sought the best practice to harness the benefits of these increasingly growing sources, facilitating the understanding of dynamic landscape perceptions and preferences [4,42].
Furthermore, there is no guarantee for the geographical representation of photographs employed in the scenic rating campaign despite being sourced from Geograph.org where a quality control protocol regarding the image and location information of each contribution exists. Additionally, for the Scenic-Or-Not, every square kilometre contains only one photo where landscapes with diverse and complex characteristics may hardly be captured fully and nothing is known about its actual mechanism behind image selection [44]. Moreover, unlike site assessment where views from a given standpoint could be evaluated, the participants of Scenic-Or-Not only evaluated a particular vista framed in the given photo without knowing any local context information, which is very much at the mercy of image composition and has been recognised as the pitfall of photographic preference surveys [29]. Hence, this study was notably based on the untenable assumption that the crowdsourcing initiative adequately provides a discerning measure for public landscape perceptions.
It should be noted that the scenic ratings evenly distributed across the entire country were confined within the expert delineated boundaries as the statistical inferences were based on the units of the aspect areas. This parallels the compromise solution of handling public perceptions in the earlier work, conducted at the county level [45]. An interlinked challenge, therefore, remains for landscape planners and architects to test the validity of expert-led landscape characterisation as reflective of on-the-ground experiences. The empirical results of this national study may be reconciled with the existing evaluations to achieve a further improved practice of LANDMAP systematically.
Landscape quality evaluations of either areas or points as discussed herein fail to capture the quality of the scenery, experienced and perceived by a viewer from the point the viewer stands in all directions. Recent developments in GIS-based viewshed analyses (e.g., vertical voxel viewsheds), taking the viewer’s contexts (for example, viewpoints, distance-decay effects) into account to model visual landscape experiences on the ground, shed light on measuring people’s experiences of landscape characters through an automated process. These metrics could be integrated with landscape preference judgements and subsequently converted to landscape quality [46,47]. Recent studies further investigated the diverse contents of crowdsourced data, ranging from geographical to textual and imagery dimensions, to gain a variety of perceptual details and contextual information of landscapes [48,49]. They demonstrate potential ways to alleviate the challenges of current LCA, efficiently eliciting multiple perspectives—that are not expert-dominated —and involve other sensory features – that are not predominantly visual – of landscapes. In pursuance of more informed landscape policy- and decision-making, the incorporation of such supplementary information with respect to public perspectives into a practical landscape assessment should remain a major research avenue to explore.
5. Conclusions
Despite calls for the inclusion of public opinions into a formal paradigm of landscape assessments, an integrated solution of the two has not yet been achieved due to the methodological limitations and the deficiency of large-scale surveys. The crowdsourcing paradigm provides a viable solution for efficiently eliciting large-scale public perspectives on landscape aesthetics. The present study has been one of relatively few attempts to investigate a potential synergy of crowdsourced data to supplement a practical landscape assessment, albeit with the acknowledgement of inevitable biases embedded in these data. The authoritative data, delineating the bespoke landscape characters concerning overall perceptual quality, has not sufficiently addressed situations of topographical diversity, such as screening effects from adjacent hills. The results show some mutual consent in landforms perceived as scenic or unattractive by experts and non-experts which are consistent with the previous landscape perception studies and suggest some potentially contested landscape typologies from both sides. It is concluded that there are potential opportunities to develop landscape metrics for the assessment of visual landscape perception to better reflect the perceived landscape character on the ground by utilising the recently devised GIS viewshed approaches. These landscape metrics could be further combined with landscape preference information to contribute to a gradual improvement of the authoritative spatial framework in the evaluation of landscape scenic quality.
Author Contributions
Conceptualization, Y.-M.C.C., S.C. and A.C.; formal analysis, Y.-M.C.C.; funding acquisition, A.C.; investigation, Y.-M.C.C., S.C. and A.C.; project administration, S.C. and A.C.; resources, S.C.; supervision, S.C. and A.C.; visualization, Y.-M.C.C.; writing—original draft preparation, Y.-M.C.C.; writing—review and editing, A.C. and S.C. All authors have read and agreed to the published version of the manuscript.
Funding
The author(s) disclosed receipt of the following financial support for the research, authorship, and/or publication of this article: Comber was funded by UK Research and Innovation grant NE/S009124/1.
Data Availability Statement
All data presented in this study are available in this article.
Acknowledgments
Chang Chien is grateful for the Ph.D. sponsorship offered by Taiwan’s Ministry of National Defence. The authors would like to thank the editor and the anonymous reviewers for their valuable and constructive comments as well as all the developers, maintainers and contributors of Scenic-Or-Not and Geograph.
Conflicts of Interest
The authors declare no conflict of interest.
References
- Lothian, A. Landscape and the Philosophy of Aesthetics: Is Landscape Quality Inherent in the Landscape or in the Eye of the Beholder? Landsc. Urban Plan. 1999, 44, 177–198. [Google Scholar] [CrossRef]
- Daniel, T.C. Whither Scenic Beauty? Visual Landscape Quality Assessment in the 21st Century. Landsc. Urban Plan. 2001, 54, 267–281. [Google Scholar] [CrossRef]
- Antrop, M.; Van Eetvelde, V. Landscape Perspectives; Landscape Series; Springer: Dordrecht, The Netherlands, 2017; Volume 23. [Google Scholar] [CrossRef]
- Bubalo, M.; van Zanten, B.T.; Verburg, P.H. Crowdsourcing Geo-Information on Landscape Perceptions and Preferences: A Review. Landsc. Urban Plan. 2019, 184, 101–111. [Google Scholar] [CrossRef]
- Dunkel, A. Visualizing the Perceived Environment Using Crowdsourced Photo Geodata. Landsc. Urban Plan. 2015, 142, 173–186. [Google Scholar] [CrossRef]
- Zube, E.H.; Pitt, D.G. Cross-Cultural Perceptions of Scenic and Heritage Landscapes. Landsc. Plan. 1981, 8, 69–87. [Google Scholar] [CrossRef]
- Dramstad, W.E.; Tveit, M.S.; Fjellstad, W.J.; Fry, G.L.A. Relationships between Visual Landscape Preferences and Map-Based Indicators of Landscape Structure. Landsc. Urban Plan. 2006, 78, 465–474. [Google Scholar] [CrossRef]
- Simensen, T.; Halvorsen, R.; Erikstad, L. Methods for Landscape Characterisation and Mapping: A Systematic Review. Land Use Policy 2018, 75, 557–569. [Google Scholar] [CrossRef]
- Gosal, A.S.; Ziv, G. Landscape Aesthetics: Spatial Modelling and Mapping Using Social Media Images and Machine Learning. Ecol. Indic. 2020, 117, 106638. [Google Scholar] [CrossRef]
- Terkenli, T.S. Towards a Theory of the Landscape: The Aegean Landscape as a Cultural Image. Landsc. Urban Plan. 2001, 57, 197–208. [Google Scholar] [CrossRef]
- Council of Europe. The European Landscape Convention. ETS No. 176. Available online: https://www.coe.int/en/web/conventions/full-list/-/conventions/rms/0900001680080621 (accessed on 20 October 2020).
- Santé, I.; Tubío, J.M.; Miranda, D. Public Participation in Defining Landscape Planning Scenarios and Landscape Quality Objectives (LQO): Landscape Guidelines for Galicia (NW Spain) Case Study. Land Use Policy 2020, 94, 104559. [Google Scholar] [CrossRef]
- Jones, M. The European Landscape Convention and the Question of Public Participation. Landsc. Res. 2007, 32, 613–633. [Google Scholar] [CrossRef]
- Conrad, E.; Christie, M.; Fazey, I. Is Research Keeping up with Changes in Landscape Policy? A Review of the Literature. J. Environ. Manag. 2011, 92, 2097–2108. [Google Scholar] [CrossRef] [Green Version]
- Swanwick, C. Landscape Character Assessment: Guidance for England and Scotland; Countryside Agency and Scottish Natural Heritage: Cheltenham, UK; Edinburgh, UK, 2002. [Google Scholar]
- Butler, A. Dynamics of Integrating Landscape Values in Landscape Character Assessment: The Hidden Dominance of the Objective Outsider. Landsc. Res. 2016, 41, 239–252. [Google Scholar] [CrossRef] [Green Version]
- Conrad, E.; Cassar, L.F.; Jones, M.; Eiter, S.; Izaovičová, Z.; Barankova, Z.; Christie, M.; Fazey, I. Rhetoric and Reporting of Public Participation in Landscape Policy. J. Environ. Policy Plan. 2011, 13, 23–47. [Google Scholar] [CrossRef]
- Groom, G.; Wascher, D.M.; Potschin, M.; Haines-Young, R. Landscape Character Assessments and Fellow Travelers across Europe: A Review. In Landscape Ecology in the Mediterranean: Inside and Outside Approaches, 3rd ed.; IALE: Darwin, Australia, 2003; pp. 227–231. [Google Scholar]
- Crofts, R.S. The Landscape Component Approach to Landscape Evaluation. Trans. Inst. Br. Geogr. 1975, 124–129. [Google Scholar] [CrossRef]
- Arriaza, M.; Cañas-Ortega, J.F.; Cañas-Madueño, J.A.; Ruiz-Aviles, P. Assessing the Visual Quality of Rural Landscapes. Landsc. Urban Plan. 2004, 69, 115–125. [Google Scholar] [CrossRef]
- Tenerelli, P.; Demšar, U.; Luque, S. Crowdsourcing Indicators for Cultural Ecosystem Services: A Geographically Weighted Approach for Mountain Landscapes. Ecol. Indic. 2016, 64, 237–248. [Google Scholar] [CrossRef] [Green Version]
- van Zanten, B.T.; Van Berkel, D.B.; Meentemeyer, R.K.; Smith, J.W.; Tieskens, K.F.; Verburg, P.H. Continental-Scale Quantification of Landscape Values Using Social Media Data. Proc. Natl. Acad. Sci. USA 2016, 113, 12974–12979. [Google Scholar] [CrossRef] [Green Version]
- Goodchild, M.F. Citizens as Sensors: The World of Volunteered Geography. GeoJournal 2007, 69, 211–221. [Google Scholar] [CrossRef] [Green Version]
- Seresinhe, C.I.; Preis, T.; Moat, H.S. Quantifying the Impact of Scenic Environments on Health. Sci. Rep. 2015, 5, 16899. [Google Scholar] [CrossRef] [Green Version]
- Seresinhe, C.I.; Preis, T.; MacKerron, G.; Moat, H.S. Happiness Is Greater in More Scenic Locations. Sci. Rep. 2019, 9, 4498. [Google Scholar] [CrossRef] [PubMed] [Green Version]
- Seresinhe, C.I.; Preis, T.; Moat, H.S. Using Deep Learning to Quantify the Beauty of Outdoor Places. R. Soc. Open Sci. 2017, 4, 170170. [Google Scholar] [CrossRef] [PubMed] [Green Version]
- Seresinhe, C.I.; Moat, H.S.; Preis, T. Quantifying Scenic Areas Using Crowdsourced Data. Environ. Plan. B Urban Anal. City Sci. 2018, 45, 567–582. [Google Scholar] [CrossRef] [Green Version]
- Chesnokova, O.; Nowak, M.; Purves, R.S. A Crowdsourced Model of Landscape Preference. In Proceedings of the 13th International Conference on Spatial Information Theory (COSIT 2017), L’Aquila, Italy, 4–8 September 2017; pp. 1–13. [Google Scholar] [CrossRef]
- Unwin, K.I. The Relationship of Observer and Landscape in Landscape Evaluation. Trans. Inst. Br. Geogr. 2006, 130. [Google Scholar] [CrossRef]
- Gyllin, M.; Grahn, P. Semantic Assessments of Experienced Biodiversity from Photographs and On-Site Observations—A Comparison. Environ. Nat. Resour. Res. 2015, 5, 46. [Google Scholar] [CrossRef] [Green Version]
- Weledol, M.; Landmap, S. LANDMAP Methodology Visual and Sensory; Natural Resources Wales: Cardiff, UK, 2016.
- Natural Resources Wales. LANDMAP Guidance Note 1: LANDMAP and Special Landscape Areas; Natural Resources Wales: Cardiff, UK, 2017.
- Shannon, C.E. A Mathematical Theory of Communication. Bell Syst. Tech. J. 1948, 27, 379–423. [Google Scholar] [CrossRef] [Green Version]
- Myers, R.H.; Montgomery, D.C. A Tutorial on Generalized Linear Models. J. Qual. Tech. 1997, 29, 274–291. [Google Scholar] [CrossRef]
- Brown, G.; Brabyn, L. An Analysis of the Relationships between Multiple Values and Physical Landscapes at a Regional Scale Using Public Participation GIS and Landscape Character Classification. Landsc. Urban Plan. 2012, 107, 317–331. [Google Scholar] [CrossRef]
- Nagelkerke, N.J.D. A Note on a General Definition of the Coefficient of Determination. Biometrika 1991, 78, 691–692. [Google Scholar] [CrossRef]
- Akaike, H. Information Theory as an Extension of the Maximum Likelihood Principle. In Proceedings of the Second International Symposium on Information Theory, Budapest, Hungary, 2–8 September 1971; Petrov, B.N., Csaki, F., Eds.; Akademia Kiado: Budapest, Hungary, 1973; pp. 276–281. [Google Scholar]
- Wherrett, J.R. Visualization Techniques for Landscape Evaluation: Literature Review. Available online: https://macaulay.webarchive.hutton.ac.uk/visualisationlitrev/chapters.html (accessed on 16 February 2020).
- Real, E.; Arce, C.; Sabucedo, J.M. Classification of Landscapes Using Quantitative and Categorical Data, and Prediction of Their Scenic Beauty in North-Western Spain. J. Environ. Psychol. 2000, 20, 355–373. [Google Scholar] [CrossRef]
- Zube, E.H. Themes in Landscape Assessment Theory. Landsc. J. 1984, 3, 104–110. [Google Scholar] [CrossRef]
- Brunsdon, C.; Comber, A. Opening Practice: Supporting Reproducibility and Critical Spatial Data Science. J. Geogr. Syst. 2020. [Google Scholar] [CrossRef]
- Goodspeed, R. Research Note: An Evaluation of the Elo Algorithm for Pairwise Visual Assessment Surveys. Landsc. Urban Plan. 2017, 157, 131–137. [Google Scholar] [CrossRef]
- Koblet, O.; Purves, R.S. Extracting Perceived Landscape Properties from Text Sources; University of Zurich: Zurich, Switzerland, 2020. [Google Scholar] [CrossRef]
- Chang Chien, Y.M.; Carver, S.; Comber, A. Using Geographically Weighted Models to Explore How Crowdsourced Landscape Perceptions Relate to Landscape Physical Characteristics. Landsc. Urban Plan. 2020, 203, 103904. [Google Scholar] [CrossRef]
- Scott, A. Assessing Public Perception of Landscape: The LANDMAP Experience. Landsc. Res. 2002, 27, 271–295. [Google Scholar] [CrossRef]
- Brabyn, L. Modelling Landscape Experience Using “Experions”. Appl. Geogr. 2015, 62, 210–216. [Google Scholar] [CrossRef]
- Carver, S.; Washtell, J. Real-Time Visibility Analysis and Rapid Viewshed Calculation Using a Voxel-Based Modelling Approach. In Proceedings of the GISRUK 2012 Conference, Lancaster, UK, 11–13 April 2012; pp. 11–13. [Google Scholar]
- Koblet, O.; Purves, R.S. From Online Texts to Landscape Character Assessment: Collecting and Analysing First-Person Landscape Perception Computationally. Landsc. Urban Plan. 2020, 197, 103757. [Google Scholar] [CrossRef]
- Callau, A.À.; Albert, M.Y.P.; Rota, J.J.; Giné, D.S. Landscape Characterization Using Photographs from Crowdsourced Platforms: Content Analysis of Social Media Photographs. Open Geosci. 2019, 11, 558–571. [Google Scholar] [CrossRef]
Figure 1.
The study area.

Figure 2.
Boxplots of the mean (left) and Shannon entropy (right) measures of public scenic ratings for each level-2 landform typology show the underlying central tendency and variability of opinions based on the intersected 1716 aspect areas/observations. Shading reflects the root of the hierarchical classification scheme (that is, level-1 typology) and the width of the boxplot is proportional to the sample size.
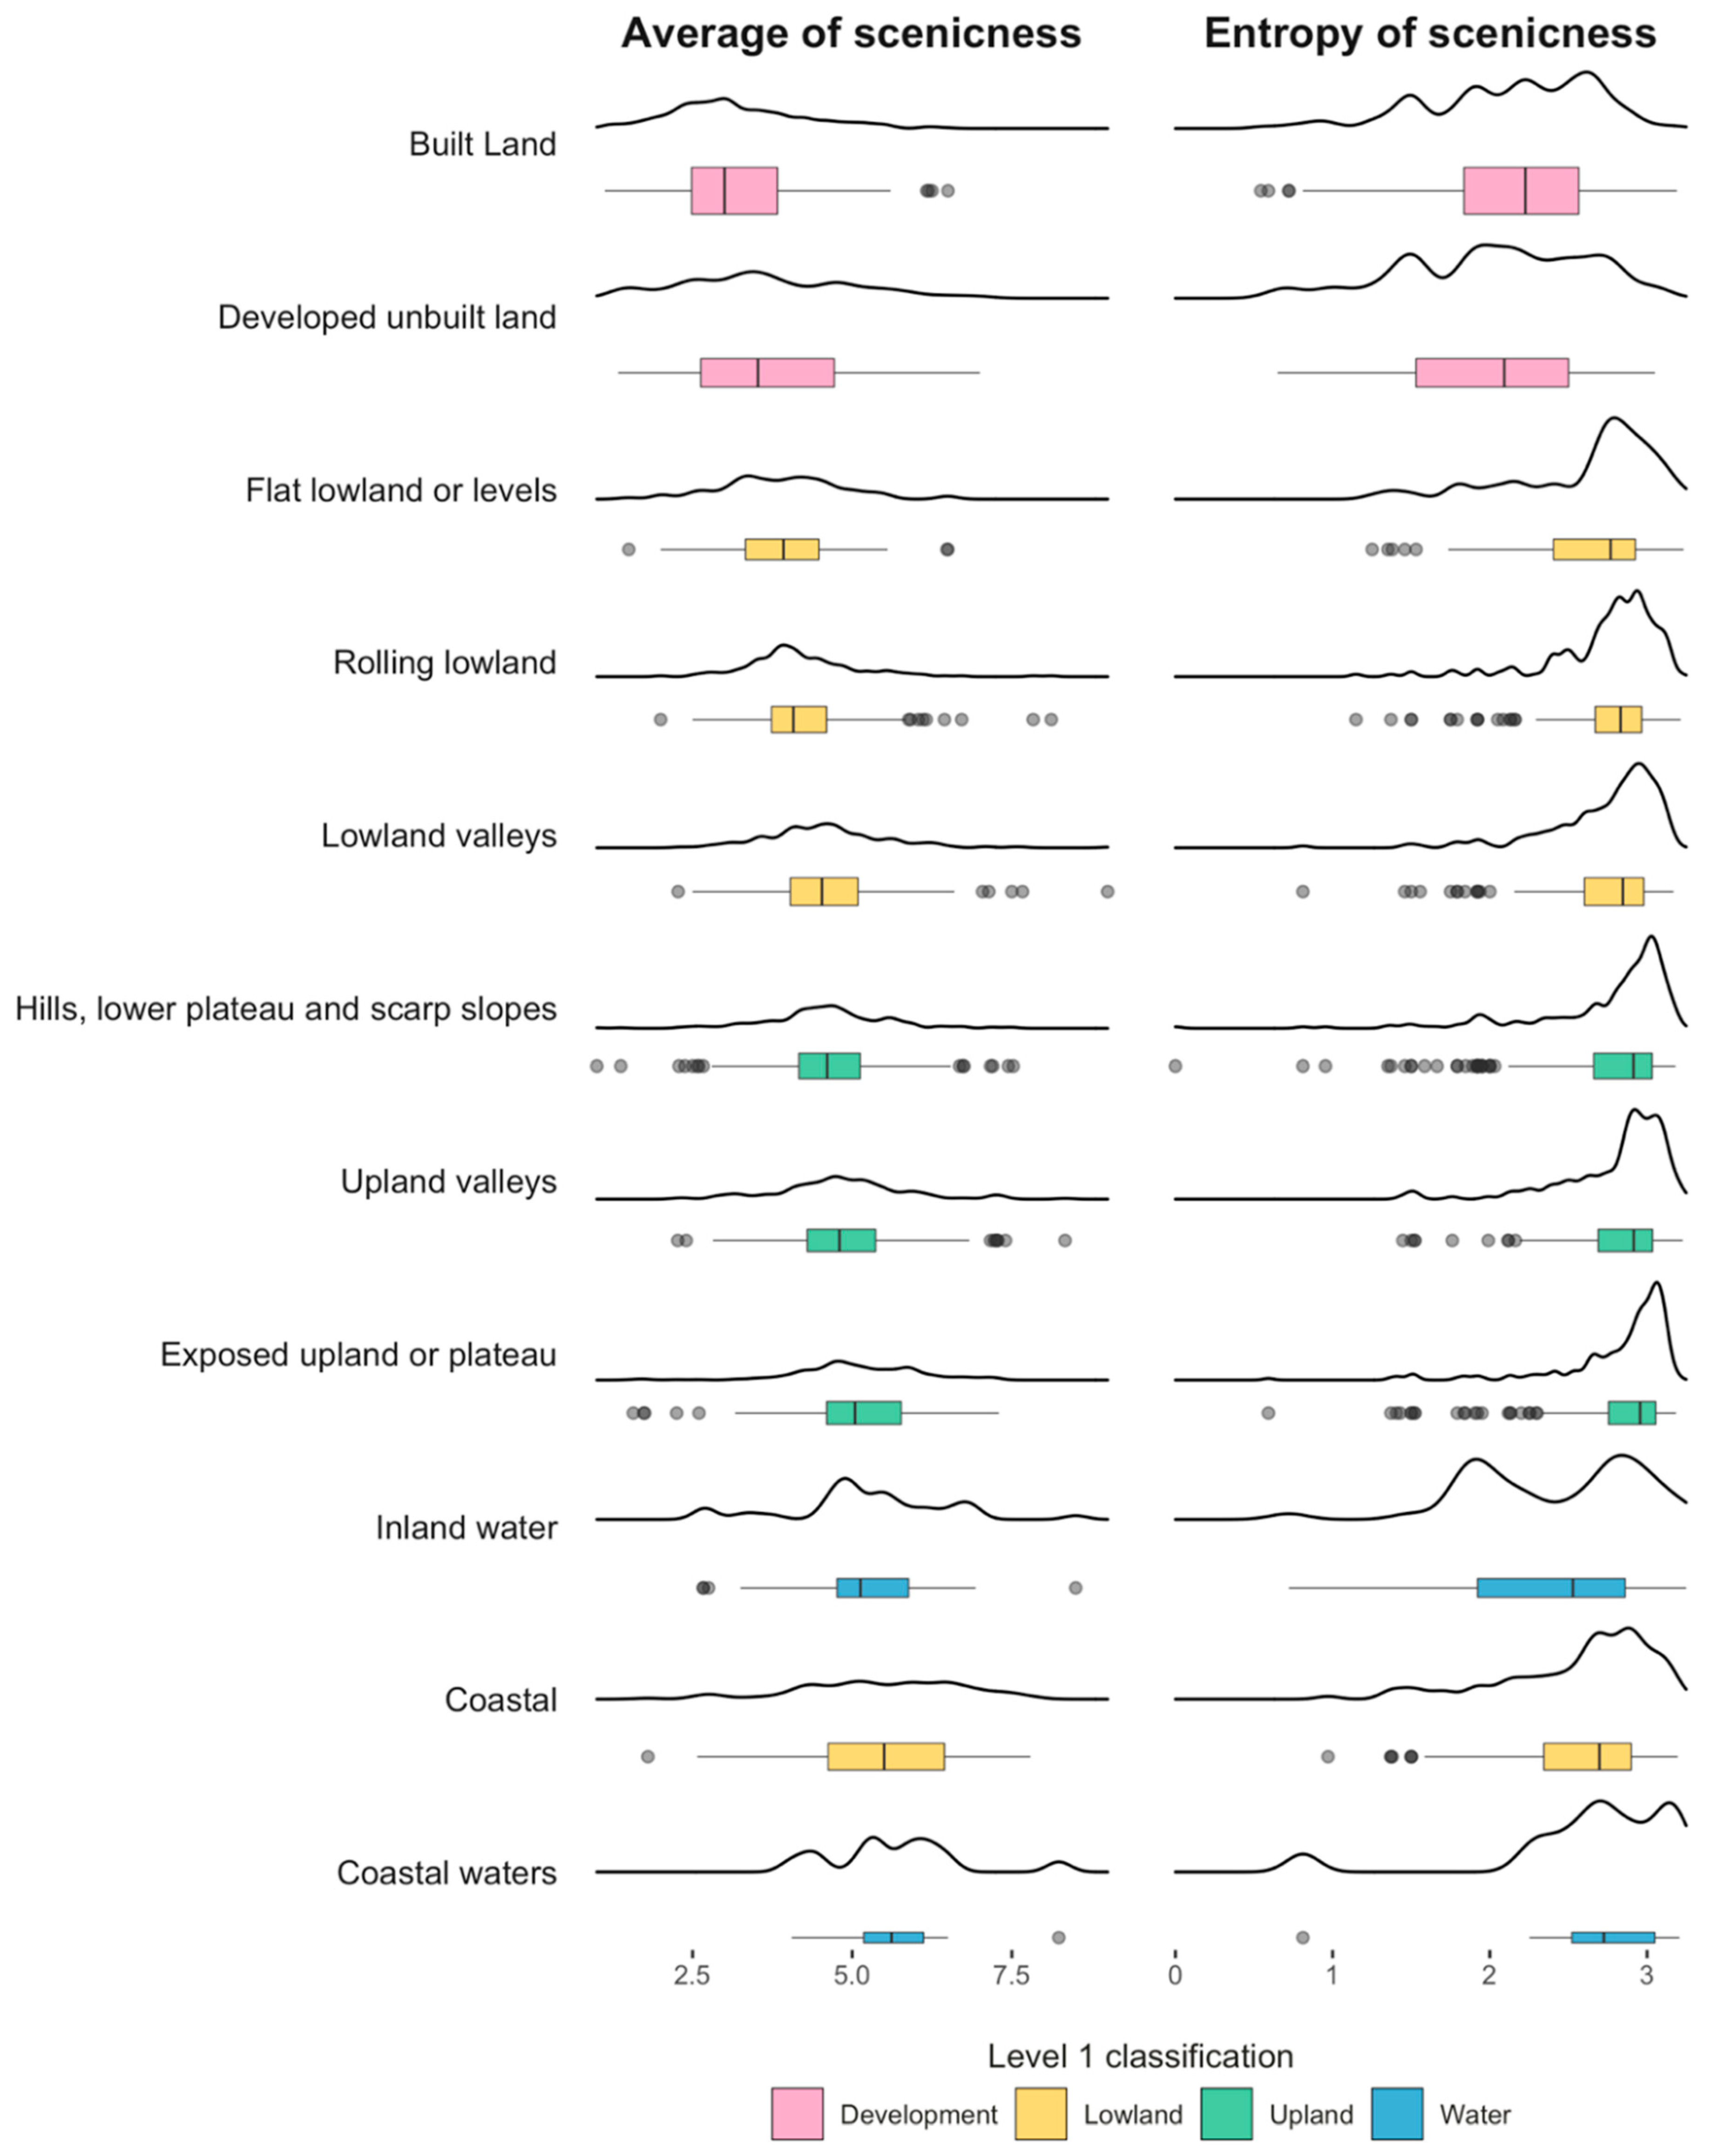
Figure 3.
The effect of various landforms on different levels of scenic quality were graphed on log scales, allowing a visual comparison of the magnitudes of confidence intervals and standard errors. Dots represent unstandardised point estimates (that is, log odds ratios) derived from the binary logistic linear regressions for the landform typologies concerning different levels of scenic quality evaluated by experts where the referent class was “built land.” The vertical dash line represents the line of null effect, denoting there is no difference from the baseline. The goodness-of-fit of the model is indicated by Nagelkerke’s R2 and AIC measures. The error bar denotes 95% confidence intervals, indicating the uncertainty of the estimate. While the confidence interval crosses the line of null effect, the point estimate is statistically significant, denoted by dot colour (blue: p < 0.05; red: p ≥ 0.05).
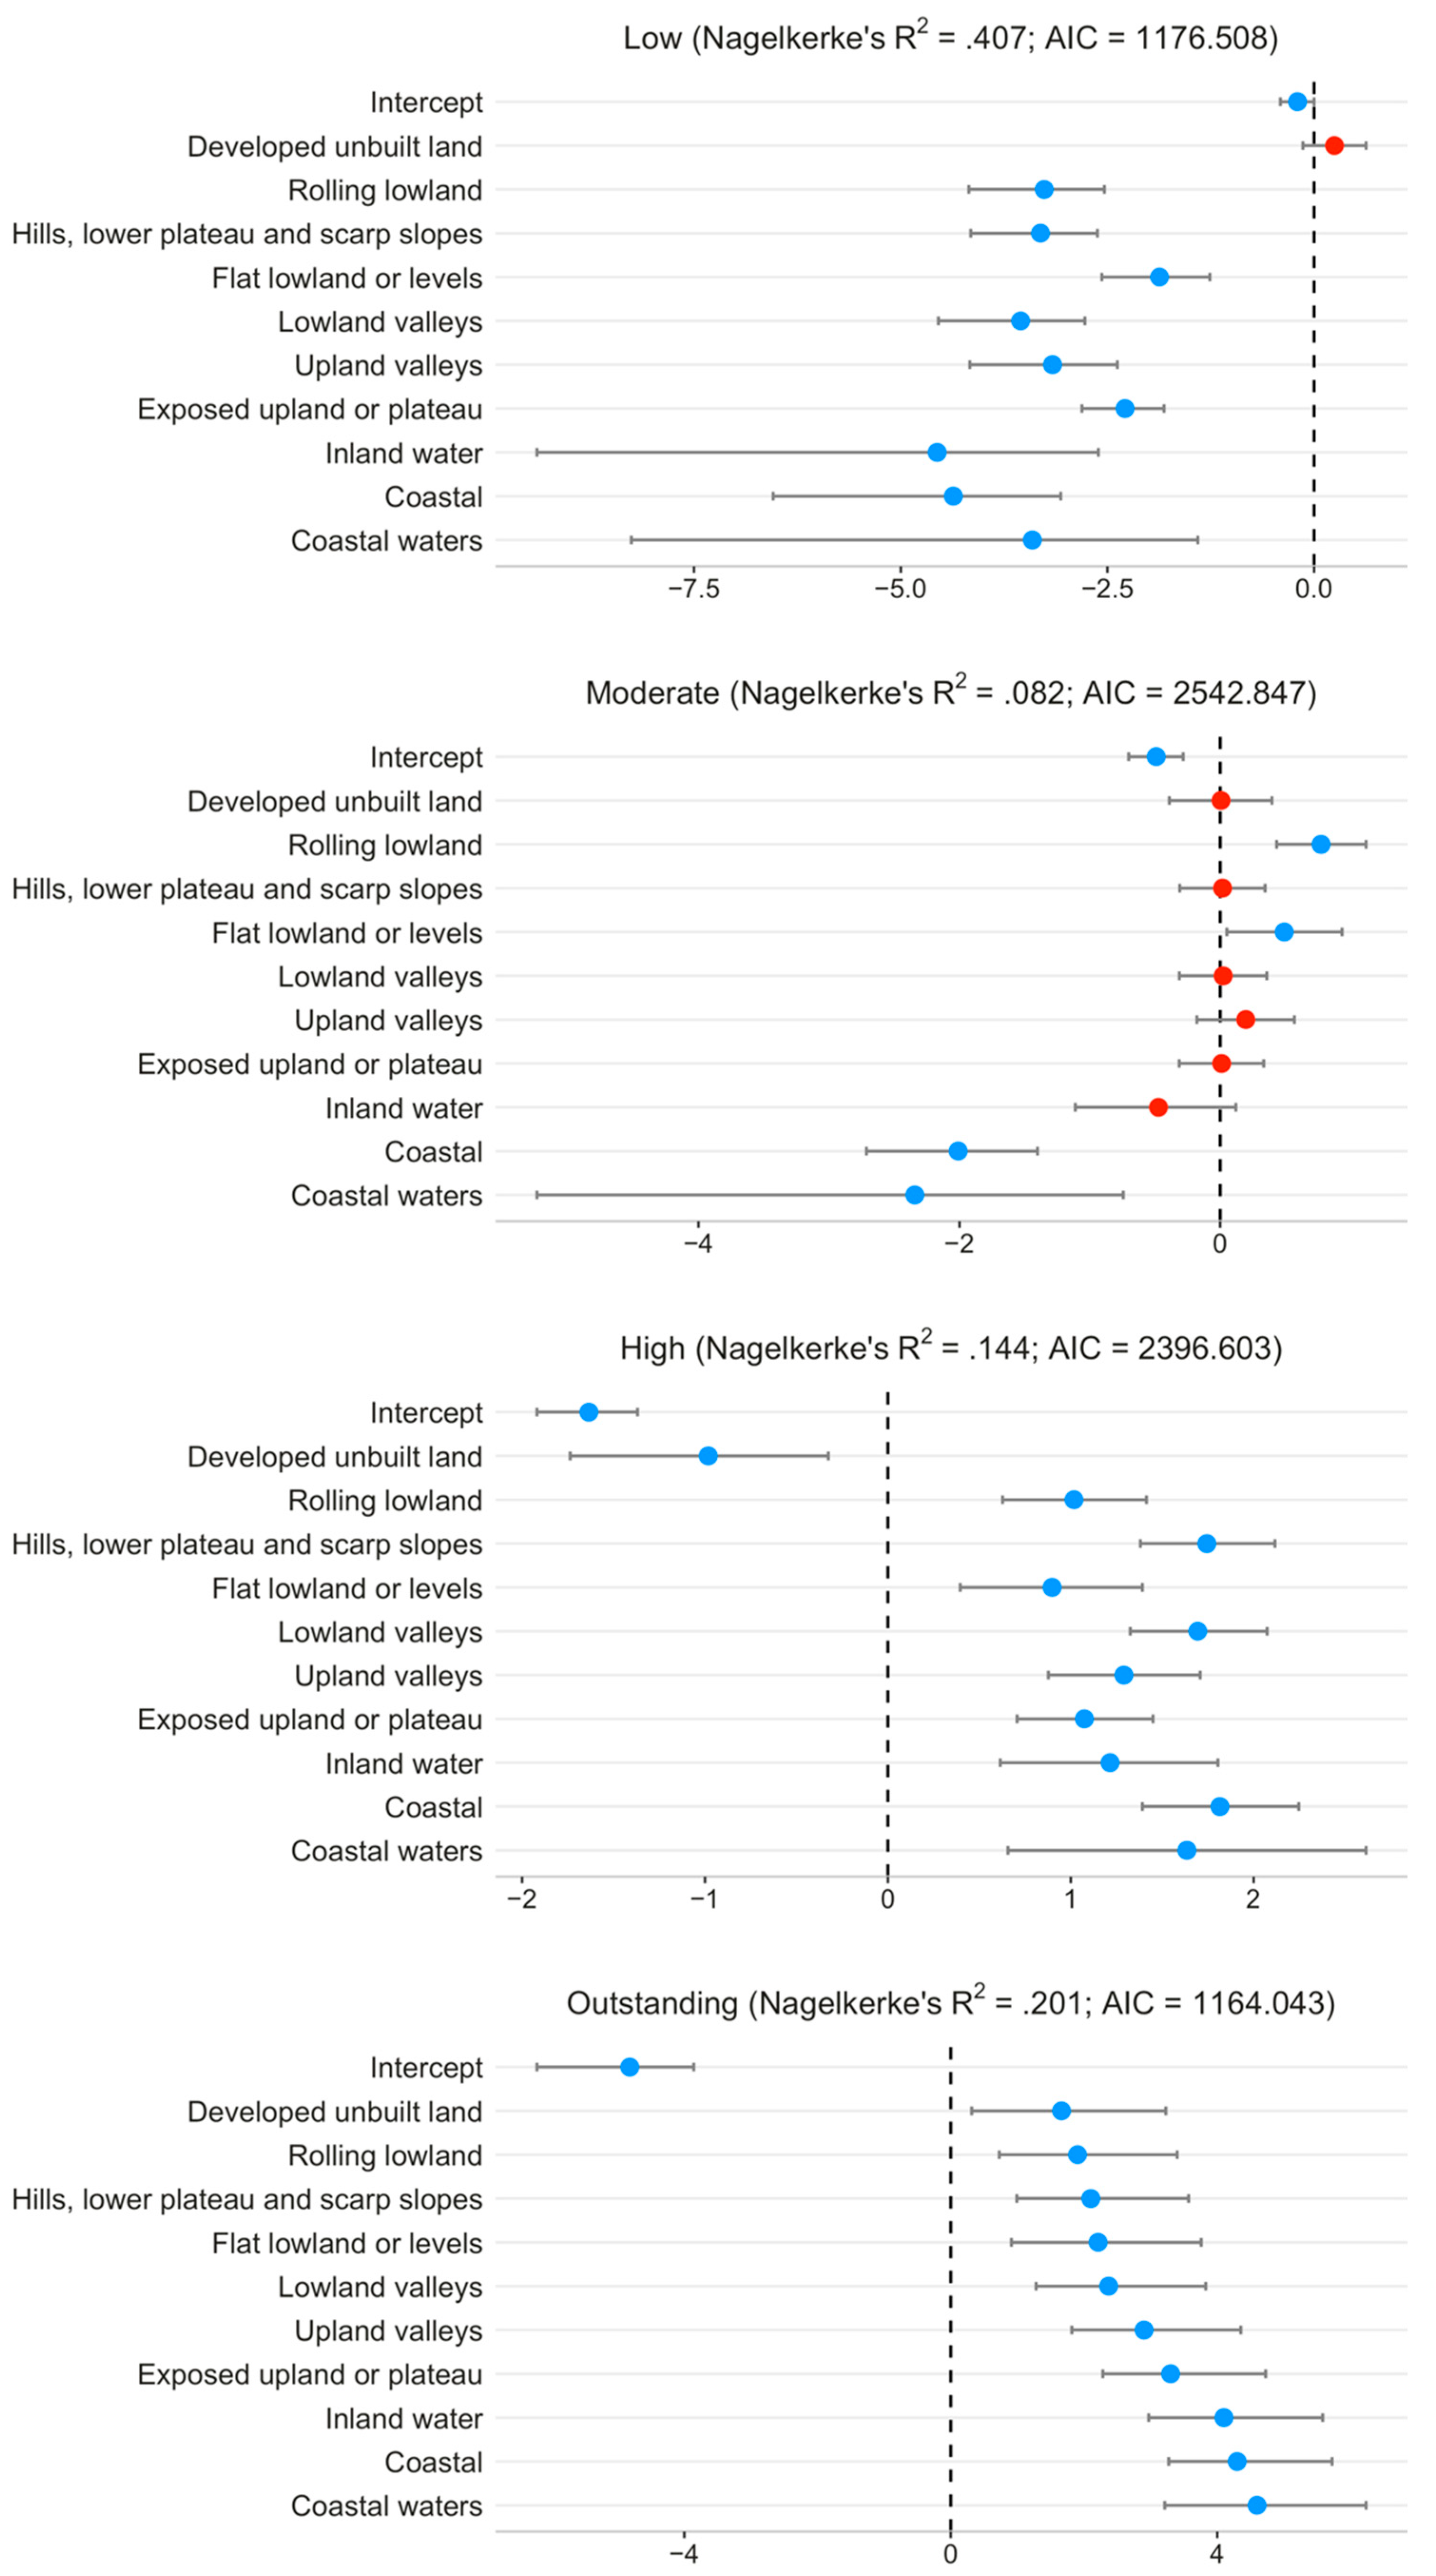
Figure 4.
Landform rankings of scenic quality were compared between experts and non-experts, based on the results of the four GLMs and the OLS. The larger rank differences are highlighted where changes of greater than 3 or less than 3 are coloured green and red, respectively, and the rest are shown in grey.

Table 1.
The level 1–3 classification categories used for characterising the visual and sensory aspect areas in the Landscape Assessment Decision Making Process (LANDMAP) approach, adapted from [31]. The grey background is used to easily distinguish the descendants of each level-2 typology.
Table 1.
The level 1–3 classification categories used for characterising the visual and sensory aspect areas in the Landscape Assessment Decision Making Process (LANDMAP) approach, adapted from [31]. The grey background is used to easily distinguish the descendants of each level-2 typology.
| Level 1 | Level 2 | Level 3 |
|---|---|---|
| Broad landform and land cover | Landform | Land cover |
| Upland | Exposed upland or plateau | Barren or rocky upland |
| Upland moorland | ||
| Upland grazing | ||
| Wooded upland and plateau | ||
| Mosaic upland and plateau | ||
| Upland valleys | Open upland valleys | |
| Open or wooded mosaic upland valleys | ||
| Wooded upland valleys | ||
| Hills, lower plateau, and scarp slopes | Hillside and scarp slopes moorland | |
| Hillside and scarp slopes grazing | ||
| Wooded hillside and scarp slopes | ||
| Hillside and scarp slopes mosaic | ||
| Open hillside and scarp slopes | ||
| Hill and lower plateau moorland | ||
| Hill and lower plateau grazing | ||
| Wooded hill and lower plateau | ||
| Hill and lower plateau mosaic | ||
| Open hill and lower plateau | ||
| Lowland | Lowland valleys | Open lowland valleys |
| Mosaic lowland valleys | ||
| Wooded lowland valleys | ||
| Rolling lowland | Open rolling lowland | |
| Mosaic rolling lowland | ||
| Wooded rolling lowland | ||
| Flat lowland or levels | Flat open lowland farmland | |
| Flat wooded lowland | ||
| Flat lowland mosaic | ||
| Lowland wetland | ||
| Coastal | Intertidal Dunes and dune slack | |
| Cliffs and cliff tops | ||
| Other coastal wildland | ||
| Small island | ||
| Development | Built land | Village |
| Dispersed settlement | ||
| Urban | ||
| Developed unbuilt land | Amenity land | |
| Informal open space | ||
| Excavation | ||
| Derelict or waste ground | ||
| Road corridor | ||
| Water | Coastal waters | Sea |
| Estuary | ||
| Inland water (including the associated edge) | River | |
| Lake | ||
| Ria |
Table 2.
The importance definitions of the LANDMAP evaluation [32].
Table 2.
The importance definitions of the LANDMAP evaluation [32].
| Evaluation Score | Definition of Importance |
|---|---|
| Outstanding | International or national |
| High | Regional and county |
| Moderate | Local |
| Low | Little or no importance |
Table 3.
Contingency (cross-tabulation) table of the level-2 landscape typologies and the expert-evaluated scenic quality. A total of 1991 aspect areas were classified with 5 unassessed areas.
Table 3.
Contingency (cross-tabulation) table of the level-2 landscape typologies and the expert-evaluated scenic quality. A total of 1991 aspect areas were classified with 5 unassessed areas.
| LANDMAP Level-2 Class | Low (%) | Moderate (%) | High (%) | Outstanding (%) | Total (%) | |||||
|---|---|---|---|---|---|---|---|---|---|---|
| Coastal waters | 0 | (0%) | 1 | (0.05%) | 9 | (0.45%) | 8 | (0.40%) | 18 | (1%) |
| Coastal | 1 | (0.05%) | 11 | (0.55%) | 79 | (3.98%) | 54 | (2.72%) | 145 | (7%) |
| Inland water | 0 | (0%) | 16 | (0.81%) | 23 | (1.16%) | 19 | (0.96%) | 58 | (3%) |
| Exposed upland or plateau | 20 | (1%) | 102 | (5.14%) | 97 | (4.88%) | 48 | (2.42%) | 267 | (13%) |
| Upland valleys | 5 | (0.25%) | 70 | (3.52%) | 68 | (3.42%) | 21 | (1.06%) | 164 | (8%) |
| Lowland valleys | 5 | (0.25%) | 92 | (4.63%) | 123 | (6.19%) | 19 | (0.96%) | 239 | (12%) |
| Flat lowland or levels | 11 | (0.55%) | 51 | (2.57%) | 33 | (1.66%) | 7 | (0.35%) | 102 | (5%) |
| Hills, lower plateau, and scarp slopes | 7 | (0.35%) | 99 | (4.98%) | 136 | (6.84%) | 16 | (0.81%) | 258 | (13%) |
| Rolling lowland | 6 | (0.30%) | 122 | (6.14%) | 75 | (3.77%) | 11 | (0.55%) | 214 | (11%) |
| Developed unbuilt land | 75 | (3.78%) | 56 | (2.82%) | 10 | (0.50%) | 6 | (0.30%) | 147 | (7%) |
| Built land | 168 | (8.46%) | 142 | (7.15%) | 61 | (3.07%) | 3 | (0.15%) | 374 | (19%) |
| Sum (%) | 298 | (15%) | 762 | (38%) | 714 | (36%) | 212 | (11%) | 1986 | |
Table 4.
Results of the logistic regressions for the four levels of scenic quality evaluated by experts to the level-2 classes which were dummy-coded and the “built land” class was used as the reference category (* p < 0.05, ** p < 0.01, *** p < 0.001).
Table 4.
Results of the logistic regressions for the four levels of scenic quality evaluated by experts to the level-2 classes which were dummy-coded and the “built land” class was used as the reference category (* p < 0.05, ** p < 0.01, *** p < 0.001).
| Categorical Variable (LANDMAP Level-2 Class) | Odds Ratio | |||
|---|---|---|---|---|
| Low | Moderate | High | Outstanding | |
| Intercept | 0.816 * | 0.612 *** | 0.195 *** | 0.008 *** |
| Coastal waters | 0.033 *** | 0.096 * | 5.131 ** | 98.933 *** |
| Coastal | 0.013 *** | 0.134 *** | 6.142 *** | 73.385 *** |
| Inland water | 0.010 *** | 0.622 | 3.372 *** | 60.248 *** |
| Exposed upland or plateau | 0.102 *** | 1.010 | 2.928 *** | 27.105 *** |
| Upland valleys | 0.042 *** | 1.217 | 3.635 *** | 18.161 *** |
| Lowland valleys | 0.029 *** | 1.023 | 5.441 *** | 10.680 *** |
| Flat lowland or levels | 0.154 *** | 1.634 * | 2.454 *** | 9.112 ** |
| Hills, lower plateau, and scarp slopes | 0.037 *** | 1.017 | 5.720 *** | 8.176 ** |
| Rolling lowland | 0.038 *** | 2.167 *** | 2.769 *** | 6.701 ** |
| Developed unbuilt land | 1.276 | 1.005 | 0.375 ** | 5.262 * |
| Built land (reference) | - | - | - | - |
Table 5.
Results of the simple linear regression, examining the relationship between the dummy-coded level-2 classes and the “built land” class is used as the reference category and the average scenic ratings that are aggregated over the units of the visual and sensory aspect areas (* p < 0.05, ** p < 0.01, *** p < 0.001).
| Categorical Variable (LANDMAP Level-2 Class) | Number | Coefficient Estimate | Standard Error | t-Value | p-Value |
|---|---|---|---|---|---|
| Intercept | - | 3.204 | 0.058 | 55.089 | 0.000 *** |
| Coastal waters | 14 | 2.443 | 0.278 | 8.800 | 0.000 *** |
| Coastal | 117 | 2.257 | 0.110 | 20.440 | 0.000 *** |
| Inland water | 40 | 2.020 | 0.171 | 11.827 | 0.000 *** |
| Exposed upland or plateau | 256 | 1.908 | 0.086 | 22.164 | 0.000 *** |
| Upland valleys | 157 | 1.652 | 0.100 | 16.558 | 0.000 *** |
| Lowland valleys | 216 | 1.400 | 0.090 | 15.499 | 0.000 *** |
| Flat lowland or levels | 91 | 0.690 | 0.121 | 5.684 | 0.000 *** |
| Hills, lower plateau, and scarp slopes | 241 | 1.408 | 0.088 | 16.088 | 0.000 *** |
| Rolling lowland | 201 | 1.015 | 0.092 | 11.001 | 0.000 *** |
| Developed unbuilt land | 78 | 0.455 | 0.129 | 3.528 | 0.000 *** |
| Built land (reference) | 305 | - | - | - | - |
| R2 = 0.331; AIC = 4935.927 |
Publisher’s Note: MDPI stays neutral with regard to jurisdictional claims in published maps and institutional affiliations. |
© 2021 by the authors. Licensee MDPI, Basel, Switzerland. This article is an open access article distributed under the terms and conditions of the Creative Commons Attribution (CC BY) license (http://creativecommons.org/licenses/by/4.0/).
Share and Cite
MDPI and ACS Style
Chang Chien, Y.-M.; Carver, S.; Comber, A. An Exploratory Analysis of Expert and Nonexpert-Based Land-Scape Aesthetics Evaluations: A Case Study from Wales. Land 2021, 10, 192. https://doi.org/10.3390/land10020192
AMA Style
Chang Chien Y-M, Carver S, Comber A. An Exploratory Analysis of Expert and Nonexpert-Based Land-Scape Aesthetics Evaluations: A Case Study from Wales. Land. 2021; 10(2):192. https://doi.org/10.3390/land10020192
Chicago/Turabian StyleChang Chien, Yi-Min, Steve Carver, and Alexis Comber. 2021. "An Exploratory Analysis of Expert and Nonexpert-Based Land-Scape Aesthetics Evaluations: A Case Study from Wales" Land 10, no. 2: 192. https://doi.org/10.3390/land10020192
Note that from the first issue of 2016, this journal uses article numbers instead of page numbers. See further details here.