Article

Biochar Enriched with Buffalo Slurry Improved Soil Nitrogen and Carbon Dynamics, Nutrient Uptake and Growth Attributes of Wheat by Reducing Leaching Losses of Nutrients

1
Department of Environmental Sciences, Vehari Campus, COMSATS University Islamabad, Vehari 61100, Pakistan
2
College of Life Sciences, Yan’an University, Yan’an 716000, China
3
Department of Plant Production, College of Food and Agriculture, King Saud University, Riyadh 11451, Saudi Arabia
4
Department of Agronomy, College of Agriculture, University of Sargodha, Sargodha 40100, Pakistan
5
Institute of Crop Science and Resource Conservation (INRES), Department of Crop Science, University Bonn, 53115 Bonn, Germany
6
School of Biological Sciences, The University of Western Australia, 35 Stirling Highway, Perth, WA 6009, Australia
7
Department of Environmental Sciences, Shaheed Benazir Bhutto University, Sheringal 18000, Pakistan
8
Department of Agronomy, Faculty of Agriculture, University of Kafrelsheikh, Kafr El-Sheikh 33516, Egypt
*
Author to whom correspondence should be addressed.
Land 2021, 10(12), 1392; https://doi.org/10.3390/land10121392
Submission received: 15 October 2021 / Revised: 26 November 2021 / Accepted: 2 December 2021 / Published: 16 December 2021

Abstract

:
The present investigation was conducted to understand the role of enriched biochar on soil nitrogen and carbon dynamics, leaching losses of nutrients, and growth attributes of wheat. Buffalo slurry (BS) was used to enrich the biochar for 24 h and 2% biochar (SB) or enriched biochar (SEB) was used. Enrichment of biochar with BS as SEB improved the C and N contents of biochar by 33–310% and 41–286% respectively. The application of biochar (SB) and enriched biochar (SEB) reduced the net nitrification by 81% and 94%, ammonification by 48% and 74%, and carbon dioxide by 50% and 92% respectively as compared to control. The leaching losses minerals i.e., C (by 30%), N (by 125%), P (by 50%), K (by 82%), Na (by 9%), Ca (by 24%), and Mg (by 12%) was decreased in SEB treatments compared to control. The soil enzyme activities, microbial biomass (MBC and MBN), wheat agronomy, soil bulk density and soil pore density, mineral uptake from the soil, and mineral contents in the plant body were improved in the SEB as compared to SB and control treatments. Our results revealed that the biochar enrichment process could improve the C and N storage in the soil reservoir and lower the environmental risks to soil and water.

1. Introduction

Animal manures (AM) can improve soil fertility and productivity to fulfill the future food requirements for the growing population [1]. Due to continuous soil cultivation, disturbance in the soil ecological functions has led to soil degradation and hence, a decrease in soil nutrient availability. Therefore, organic amendments might be the most feasible option to increase soil fertility and productivity [2]. Moreover, the release of humic compounds and organic anions from the organic materials lower the soil pH and increase the charges sites which hold more nutrients and water in their pore spaces [3]. So, the application of organic amendments is considered low-cost input for arid soil management [3]. However, the pH of the soils of Pakistan is usually >7.0 which is the major constraint for the sole application of organic amendments such as biochar to the soils.
It has been noted that low soil fertility can negatively affect seed germination and root growth and development. The addition of AM improves the concentration of nitrogen (N), phosphorus (P), potassium (K), calcium (Ca), and magnesium (Mg) in the plant body [4]. However, direct application of AM may lead to ammonia volatilization and nitrate runoff resulting in N loading of lakes [5]. Thus, AM should be passed through some process that can slow down or inhibit the loss of N in the form of NH3 or NO3 through leaching from soil [6].
The pyrolysis can decrease the mass of AM by 60% of its original state, which is easy to apply at a large scale [7]. However, the application of biochar alone to the soil increases the soil pH which is not feasible in Pakistani soils where soil pH is already high. While, the application of animal manure biochar (AMB) improves the availability of nutrients, water holding capacity and decreases the soil bulk density [8]. Past studies have found that application of AMB at 5–20 g kg−1 soil improved the soil organic carbon contents, electrical conductivity (EC), cation exchange capacity (CEC), nutrient sorption sites, C, N, P, and K dynamics, and soil physicochemical properties i.e., total carbon (TC), total nitrogen (TN), soil pore density (SPD) and soil pore volume (SPV) [9]. Above stated review of the literature indicated that application of N enriched-biochar to the soils may overcome the issue related to N and P volatilization and immobilization. Hence, scientists are focusing on the enrichment techniques of AMB before the application to soils.
Buffalo slurry (BS) (liquid portion i.e., slurry) consists of organic matter, ash, and moisture contents. It is considered a waste product and is not being used as fertilizer in Pakistan. Using BS to enrich biochar could be an integrative and innovative solution Although a lot of work about the biochar application to the soils has been done but very limited or no study has reported the preparation of enriched biochar with BS and its subsequent application into the soils for enhancing the biochar benefits in improving soil fertility and productivity and reducing the possible environmental risks.
Based on this discussion, the present study was designed to test the hypothesis that enriched biochar could reduce the N and C gaseous fluxes from soil and improve soil productivity. The objective of the current study was to determine the influence of enriched biochar on the emission of ammonia, nitrate, and carbon losses from the soil, enzymes activities, and the availability of micro-and macro-nutrients in soil.

2. Materials and Methods

2.1. Biochar Material Collection and Formation

In the present study, date palm (DP) residues including leaves, small twigs, and small branches were used as feedstock for biochar (BC) production. The DP residues were collected from the local nursery at Vehari-Punjab, Pakistan, and brought to the laboratory. The DP residues were washed with tap water and chopped to 2–3 cm pieces and dried in the open air under sunlight (temperature approx. 40 °C). The dried and chopped DP material was pyrolyzed for BC production by the slow pyrolysis at 300 °C for 4 h [1]. The date palm biochar (DPB) was prepared at the COMSATS University Islamabad (CUI), Vehari Campus in a locally manufactured system designed with an electrical heating system. Low-temperature pyrolysis was used because the resulting biochar has higher bioavailable carbon, greater N-mobilization, and ultimately, more microbial activity in the soil as compared to that observed with the application of biochar pyrolyzed at higher temperature [2]. Hence, this was the potential source for efficient utilization of excess mineral N by adsorption and immobilization from the manure effluents. Before and after pyrolysis, no chemical was added. In addition, no steam was provided externally, although some steam was produced during the process. The DPB material was pass through the 2 mm sieve after cooling at room temperature. The DPB samples were taken and analyze for pH, EC, CEC, total carbon contents (TC), and total nitrogen contents (TN) of biochar before application to soil by following the standard methods [3].

2.2. Manure Source and Biochar Enrichment

BS was collected from a local farm at District Vehari, Punjab-Pakistan. The slurry has been rarely used as fertilizer into the soil in Pakistan and is mostly considered as waste material. The BC enrichment was performed by following the method of Sarkhot et al. [4]. The manure was centrifuged at 10,000 rpm and filtered through the filter paper (0.45 µm). The 2% (w/w) DPB was added to filtered manure and shaken for 24 h. After the shaking, the mixture was centrifuged and filtered. Before using for the incubation experiment, the nutrients enriched biochar was placed in the hot air oven for drying. After this whole process, the nutrients enriched biochar is called enriched biochar (EB) as compared to non-enriched biochar. The EB were subjected to proximate analysis, TC, and TN.

2.3. Soil Source and Analysis

The soil samples (0–20 cm) were collected from the experimental site of COMSATS University Vehari campus and mixed thoroughly until a homogenous mixture was formed. The samples were brought to the laboratory, dried, and sieved (2 mm). Before filling the pots, the soil samples were subjected to different physicochemical analyses, i.e., pH, electrical conductivity (EC), cation exchange capacity (CEC), total organic carbon, CaCO3, mineral nitrogen, available phosphorous (P), available potassium (K), NH4, and NO3 (Table S1). The organic matter was measured by following the method of Nelson and Sommers [5] while pH and EC were measured by pH meter (EZDO 6011) and EC meter (LovibondSenso Direct Con110), respectively. The soil-water mixture was prepared by preparation of the suspension (1:2.5; soil:water) and then equilibrated for 30 min. at room temperature and this mixture is used for the determination of EC and pH. EC meter was standardized with KCl solution (0.01 N) at 25 °C [6]. The same soil filtrate was used to determine the soil Na and K using the Flame photometer [7]. The CaCO3 was measured by following the method of Loeppert and Suarez [8]. The soil carbon contents were determined by wet oxidation of soil samples using hydrogen peroxides, sulfuric acid, and chromic acid [9]. Soil N was determined by subtracting organic N contents from total N contents [10]. Total N concentrations from soil and plant were analyzed by the Kjeldahl digestion method [11]. Soil mineral NO3-N contents were calculated by subtracting NH4+-N from total N. NH4+-N in the soil was measured through extraction methods using 40 g soil with 200 mL KCl (2 M). The mixture was passed through steam distillation and then titration process. Available P and K from the soil were measured by following the process as stated by Houba et al. [12].

2.4. Incubation Experiment

The main objective of the incubation experiment was to determine the ammonium and nitrate contents in the soil. In the incubation study, only three treatments, i.e., soil (S), soil + 2% biochar (SB; non-enriched biochar), soil + 2% enriched biochar (SEB; soil + enriched biochar) were used (20 g oven-dried biochar either non-enriched or enriched biochar per kg oven-dry weight soil). The incubation experiment was designed by following the method of Hart et al. [13] with some minor modifications. All the treatments with or without biochar were prepared at field moisture level (~25%) and then passed through a 2-mm sieve. The soil with biochar and without biochar (20 g oven-dry weight) was added to small plastic jars (v. 120 mL) and incubated at room temperature for more than 8 weeks (60-d). The days of incubation were counted on the day of mixing of the biochar with soil which was counted as day 0. Soil samples were collected on a specific period as described i.e., days 1, 5, 10, 20, 28, 35, 42, 49, 60. In each sampling time, four replications were analyzed (4 × 9 = 36 samples per treatment). The concentration of NH4 and NO3 in soil was measured by following the KCl extraction techniques [13]. For this purpose, 10 g soil was shaken on an electric shaker with 50 mL KCl (2 mol L−1) in the volumetric flask (250 mL; closed with stopper) for 1 h. Then, the liquid material was filtered (Whatman filter paper No. 1; pre-leached) and then NO3 and NH4 contents were measured by using the standard methods [14]. The pre-leaching of filter paper was performed by 50 mL KCl (2 mol L−1; 4 times), followed by 50 mL deionized water (6 times), and then oven-dried at 50 °C. The soil sample was weighed after each weak. If the weight of the sample was less than 5%, then the moisture was maintained through the addition of the de-ionized water (using dropper) and then, shaked the sample well gently. Net NO3 and NH4 contents were recorded as the difference between NO3-N and NH4-N after 28 d and 0 d, respectively. The specific duration of 28 d was selected because it is a widely used duration to determine the N mineralization in the field and laboratory conditions [14,15,16] while the net mineralization was measured through the addition of the total inorganic N (NH4-N + NO3-N) on 28-d and the total inorganic N on 0-d [17].
Three days before each sampling time i.e., days 1, 5, 10, 20, 28, 35, 42, 49, 60, the corresponding cup was sealed with the butyl rubber septum. The air samples were collected using the two-way eclipse syringes and then used for the analysis of CO2 with help of a gas chromatograph [17]. Cumulative CO2 was calculated by plotting the values against times and then measuring the values from the curve of the graph.

2.5. Leaching Experiment

The setup of the leaching experiment was done as described by Neff and Hooper [18] with some modifications. For this purpose, locally manufactured Nalgene filter units (V. 250 mL) were used with Whatman glass filter papers (pore size 0.7-μm), and each compartment was separated with glass wool. Same treatments were used as described in experiment 1 i.e., three treatments i.e., soil (S), soil + 2% biochar (SB; non-enriched biochar), soil + 2% enriched biochar (SEB; soil + enriched biochar) were used. The upper compartment of the Nalgene filter units was filled with soil or soil biochar mixture or soil and enriched biochar (20 g over dry) and then covered with thin glass plastic film. As in the incubation experiment, the measurement of NO3-N and NH4-N was performed through destructive sampling (using KCl) of soils for each sampling time, while in the leaching experiment, the same sample was used throughout the study in each treatment.
The leachates were collected from the leaching experiment with the same interval (i.e., days 1, 5, 10, 20, 28, 35, 42, 49, 60) as was done in the incubation experiment. For the leaching experiment, deionized water (100 mL) was used after every 10 min interval with the help of a pipette (V. 10 mL). Before taking the leachate samples, the soil was allowed to drain. The leachates were collected and filtered (0.45 μm) and preserved at the laboratory for other various cations, anions, and TN and TC contents using the standard procedures. The cumulative concentration of different ions for the leaching experiment was noted by integrating the concentration under the curve over the 60-d study.

2.6. Wheat Experiment

To justify the results of the incubation experiment, a pot trial was carried out with the same treatments as used in the incubation experiment with positive and negative fertilizer control. The experiment was laid out in a completely randomized design (CRD) in a greenhouse under natural sunlight and replicated four times. The study was comprised of five treatments i.e., feedstock alone (FS), soil (S) + no fertilizer (unfertilized control; SUFC), S + fertilizer control (SFC; recommended fertilizer; RF) soil + non enriched biochar (2%; NEBC) + RF, soil + EBC (2%; SEB) + RF. The plant nutrients requirement was fulfilled from NEBC/EBC and then the remaining requirement was fulfilled by the application of synthetic fertilizers. The recommended dose of synthetic fertilizers NPK in the form of Urea (46% N), Diammonium phosphate (DAP; 18% N, 46% P2O5), and potassium (K2O; 50% K2O) at the rate of 41 mg kg−1 soil (Nitrogen; 230 kg N ha−1), 30 mg kg−1 soil (P2O5; 120 kg P ha−1) and 21 mg kg−1 soil (K; 60 kg K ha−1), respectively were added. The mixture of soil and FS/DPB was spread on 590 g soil (sieved to 2 mm) and formed a homogeneous mixture. The total volume of soil and FS or DPB was 6 kg and poured into 7 kg earthen pot (pots (top of pot diameter × base of pot diameter × pot height = 280 mm × 155 mm × 200 mm). The FC treatments received the fertilizers (230 kg N ha−1, 120 kg P ha−1 and 60 kg K ha−1) while the UFC received no fertilizers or DPB. Approved and certified wheat seed was taken from the local grain market of District Vehari, Punjab, Pakistan. The seeds (10 seeds in each pot) of Wheat (Triticum aestivum L. cultivar Shafaq-2006) were sown manually after treating with fungicide (Benlate; 2.5 g kg−1 of seed) at the depth of 3 cm in each pot. The seed treatment process was completed by shaking of seed in a plastic drum. The nutrient uptake (mg pot−1) by wheat plants was calculated from the elemental analysis and the weight of dry matter.
The soil moisture was maintained to 80% field capacity with the help of a speedy moisture meter on daily basis during the whole period of study. The pots were placed in wirehouse sunlight (D/N 10/14), temperature (22–27 °C), and humidity (70–75%). After seedling emergence, three healthy seedlings were maintained in each pot for the remaining period of the experiment. The position of pots was changed after two weeks to reduce the effects of microclimate on the wheat seedlings. The wheat crop was sown on 15 November 2019, and harvested on 2 May 2020.

2.6.1. Microbial Biomass C and N

The fumigation extraction method is used to determine the microbial biomass carbon (MBC) and nitrogen (MBN) after the 60-d soil incubation [19,20]. The soil sample (10 g) was taken and divided into two halves (5 g each). Soil sample (5 g) was placed into a petri plate and put into a vacuum desiccator. Ethanol-free CHCl3 (25 mL) was added to the soil to fumigate the soil for 24 h (25 °C). After the fumigation process, the soil sample was placed into a hot water bath (80 °C) to remove the fumes and then added the K2SO4 (20 mL; 0.5 M) to extract the C and N contents from the fumigated and non-fumigated soil samples. The extracted mixtures were shaken on an electric reciprocal shaker (GFL 3018-Germany) for 30 min and then filtered through Whatman filter paper (No 42). The filtrate was analyzed by using the TOC analyzer (Shimadzu, Japan) and Kjeldahl digestion to determine the total carbon (TC) and total nitrogen (TN). MBC and MBN was calculated by using the following equation;
MBC   or   MBN = TCfu   or   TNfu TCnfu   or   TNnfu KEC   or   KEN
where TCfu and TCnfu exhibited that total carbon (TC) in the fumigated and non-fumigated soils while TNfu and TNnfu total nitrogen (TN) in the fumigated and non-fumigates oils respectively. KEC is the coefficient (0.45) used for MBC calculation [21] and KEN is the coefficient (0.54) used for MBN calculation [22].

2.6.2. Growth and Biomass Attributes

Various growth attributes of wheat plants, i.e., plant height (PH), leaf area index (LAI), fresh (BY), and dry (DY) biomass per pot were measured. Leaf area was measured by using IMAJ J software [23]. Ten independent measurements from ten different wheat plants were made and an average was taken.
After 60-d of wheat emergence, PH of ten plants was taken using the meter tape from the ten different plants and then averaged. Biomass (BY and DY) was recorded by harvesting and weighing above ground all wheat plant parts from each pot after drying in a hot air oven at 70 °C until a constant weight was achieved.

2.6.3. Nutrients Analysis

The aboveground wheat plant biomass was cut and weighed and placed into a hot air oven at 60 °C. The dry matter was receded as the constant weight was achieved. The dry wheat biomass was ground and wet digestion (HClO3 and HNO3, 2:1 rations) materials for the determination of macro and micronutrients analysis.

2.6.4. Phosphorus Use Efficiency

Phosphorus use efficiency (PUE) was, then, calculated using the following formula described by Fageria et al. [24];
PUE   ( % ) = P   Uptake   unfertilized   plot   ( g   kg 1 ) P   uptake   in   control   plant   ( kg   ha 1 ) Total   P   applied   ( kg   ha 1 )

2.6.5. Apparent Nitrogen Recovery

Wheat nitrogen (N) uptake in enriched biochar pots was recorded by multiplying the wheat N contents at harvest (both in vegetative and reproductive portions) with its dry biomass. Apparent nitrogen recovery (ANR) was measured by using the following formula
ANR   ( % ) = ( Nm × DMm ) ( Nc × DMc ) TN × 100
where Nm indicates the N contents (g N 100 g−1 DM) present in wheat dry matter in enriched biochar pots, DMm shows wheat dry biomass (kg ha−1) in enriched biochar pots, Nc exhibits the N contents (g N 100 g−1 DM) present in wheat dry matter in nonenriched biochar pots, DMc signifies wheat dry biomass (kg ha−1) in non-enriched biochar pots and TN is the total N applied (kg ha−1).

2.6.6. Soil Enzymes Determination

The soil enzymes were determined after the wheat plant harvesting and analyzed within a week to avoid any change in the enzyme activities. The soil samples were stored at 4 °C. The soil enzymes activities, i.e., β-glucosidase [25], acid phosphate [25], catalase [26], dehydrogenase [27], and phosphomonoestrase [28], and urease [29], while the other parameters like bulk density, total porosity [30], and soil organic carbon [9] were measured.
To determine the urease activity, the soil sample (1 g) was incubated into the flask containing the urease solution (0.5 mL) and borate buffer (4 mL; pH 10.0) for 2 h at 37 °C. Then added the KCl (6 mL; 1 M) into the flask and unattended for 30 min to complete the reaction named as A solution. The NH4+ contents were measured from the mixture (A solution + NaOH + sodium dichloroisocyanurate) at 690 nm. Acid phosphate (ACP) and β-glucosidase (βGS) were measured using 1 g soil into p-nitrophenyl-β-D-glucopyranoside and nitrophenyl phosphate (pH 4.0) respectively. The catalase (CAT) activities were determined after the incubation of soil (5 g) into H2O2 (25 mL; 3%) for 30 min. at 4 °C. After the incubation of the soil mixture, H2SO4 (25 mL; 1 M) was mixed and filtered the solution. Moreover, some more amount of H2SO4 (20 mL; 0.5 M) was added into a 5 mL solution and then titrated against KMnO4 (5 mM) to measure the unreacted H2O2.

2.7. Statistical Analysis

Statistical analysis was performed using statistics software (V. 8.1; Analytical Software, Tallahassee, FL, USA) package. The values of the results were the average of four replication and the number after the ± was the standard error. One-way analysis of variance (ANOVA) was used in the analysis of experiment 1 and experiment data where soil and plant characteristics were analyzed. Two-way analysis of variance (ANOVA) was used to analyze the data from experiment 2 where DBCs treatments, duration of incubation, and their interactive effects on the water retention were analyzed. Treatments means of data of all three experiments were considered significantly different at α = 0.05 by using Duncan’s Multiple Range test [31].

3. Results

3.1. Treatments Analysis

Proximate analysis of the applied treatments indicated that moisture contents, volatile matter, ash, and fixed carbon contents of the biochar were 3.78 ± 0.78%, 22.79 ± 2.56%, 19.11 ± 0.36%, and 58.69 ± 5.36%, respectively (Table S1). The total carbon (TC) and total nitrogen (TN) of the treatments were given in Table 1. Moreover, the enrichment of biochar with filtered buffalo’s manure for 24 h was increased TC and TN by 11 and 21%, respectively. Moreover, the application of 2% biochar to the soil increased the TC from 1.81 to 11.69 in the biochar and 11.69 mg g−1 in the enriched biochar treatments. The TN was increased from 0.21 to 0.61 in the biochar and 0.81 mg g−1 (Table 1).

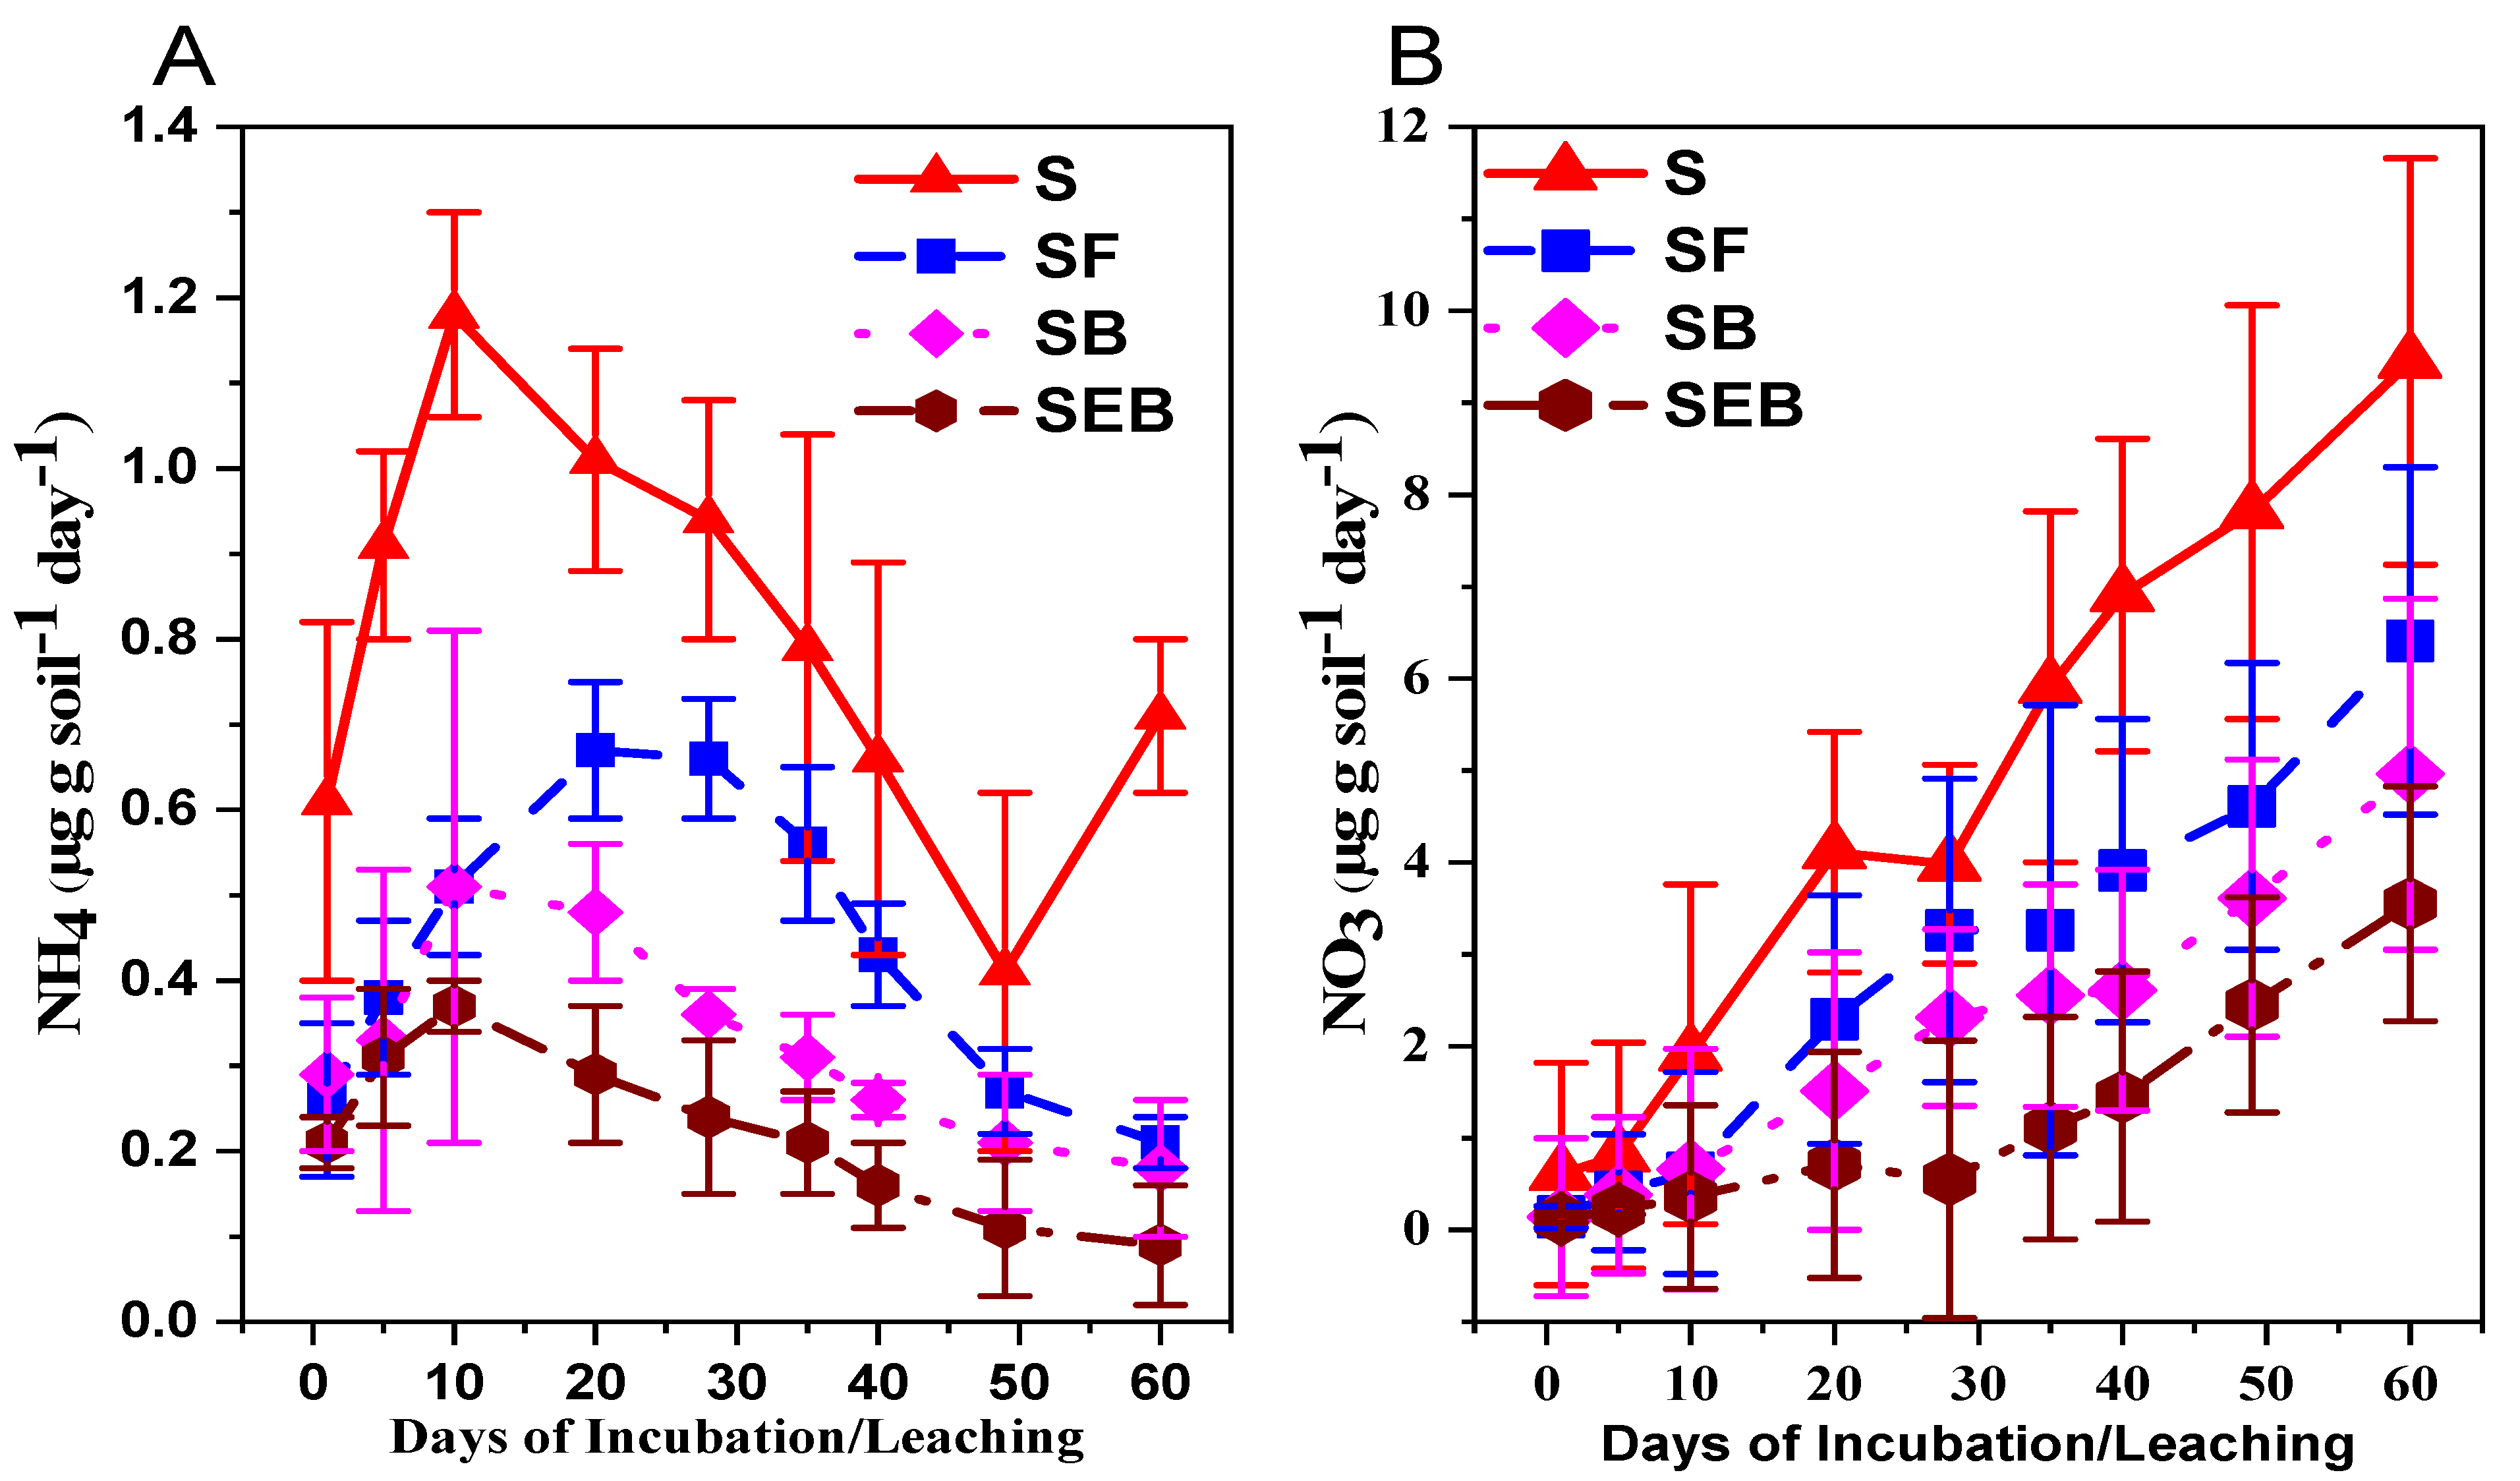
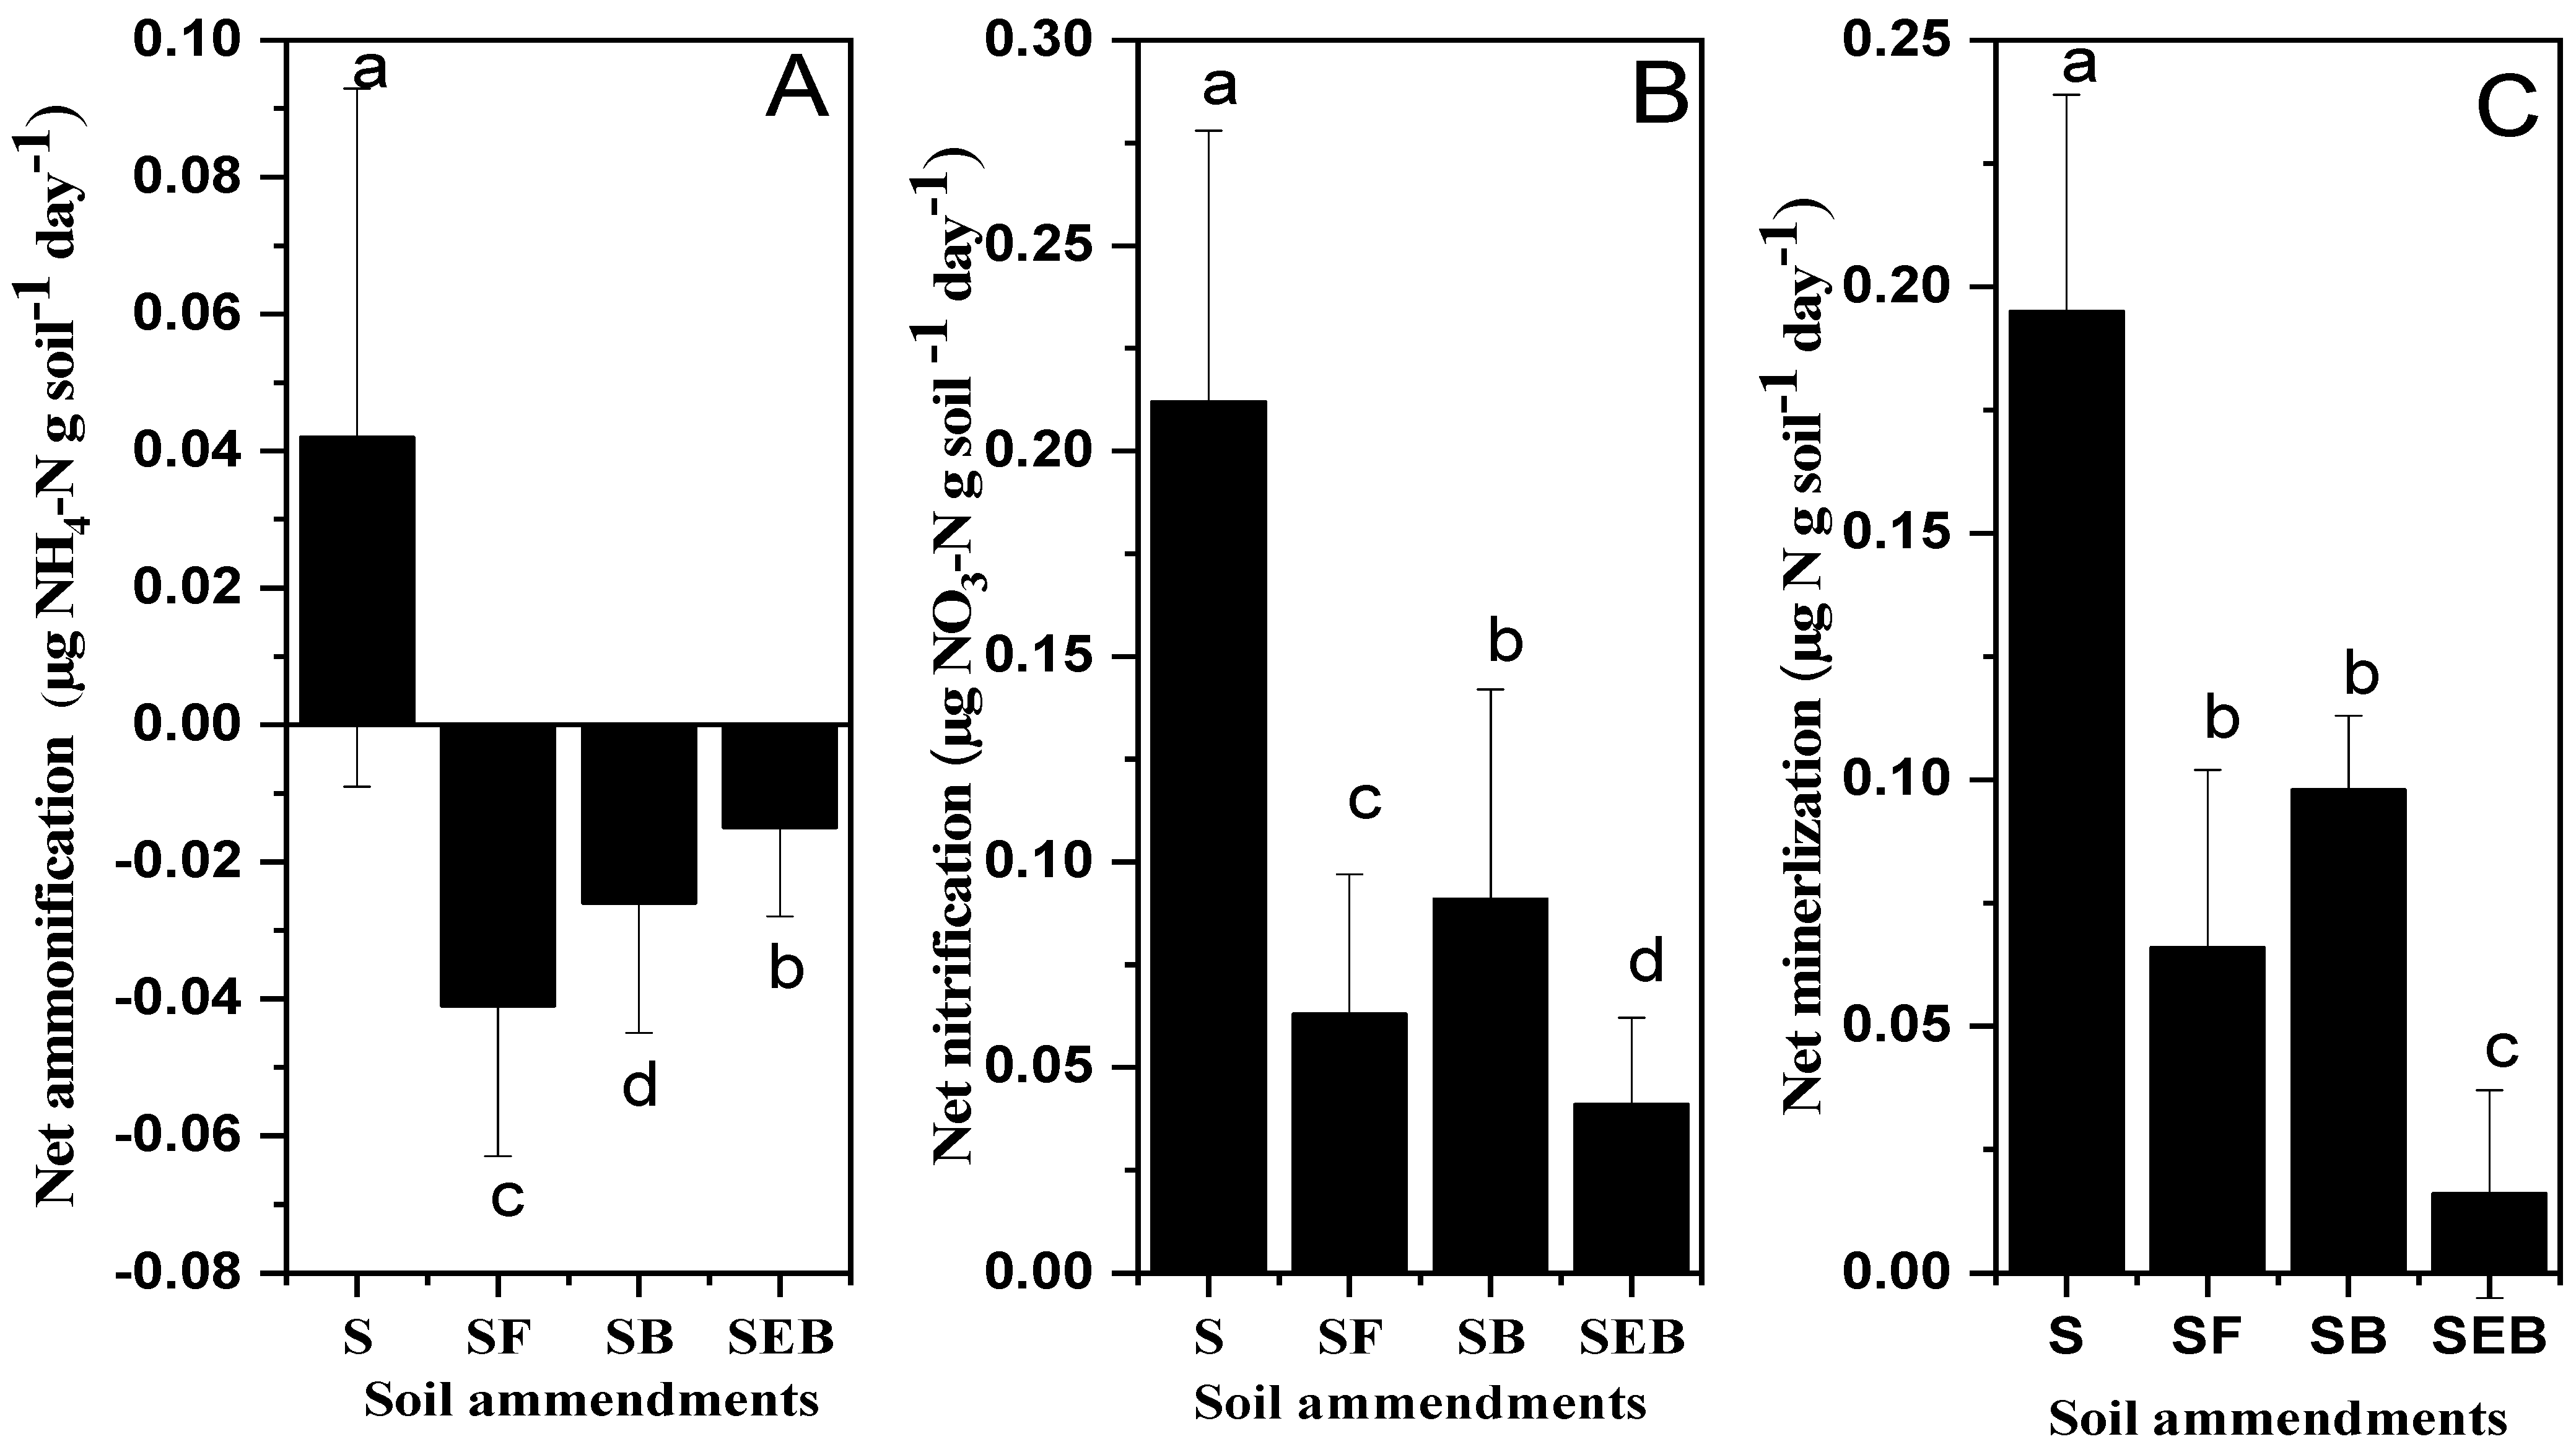
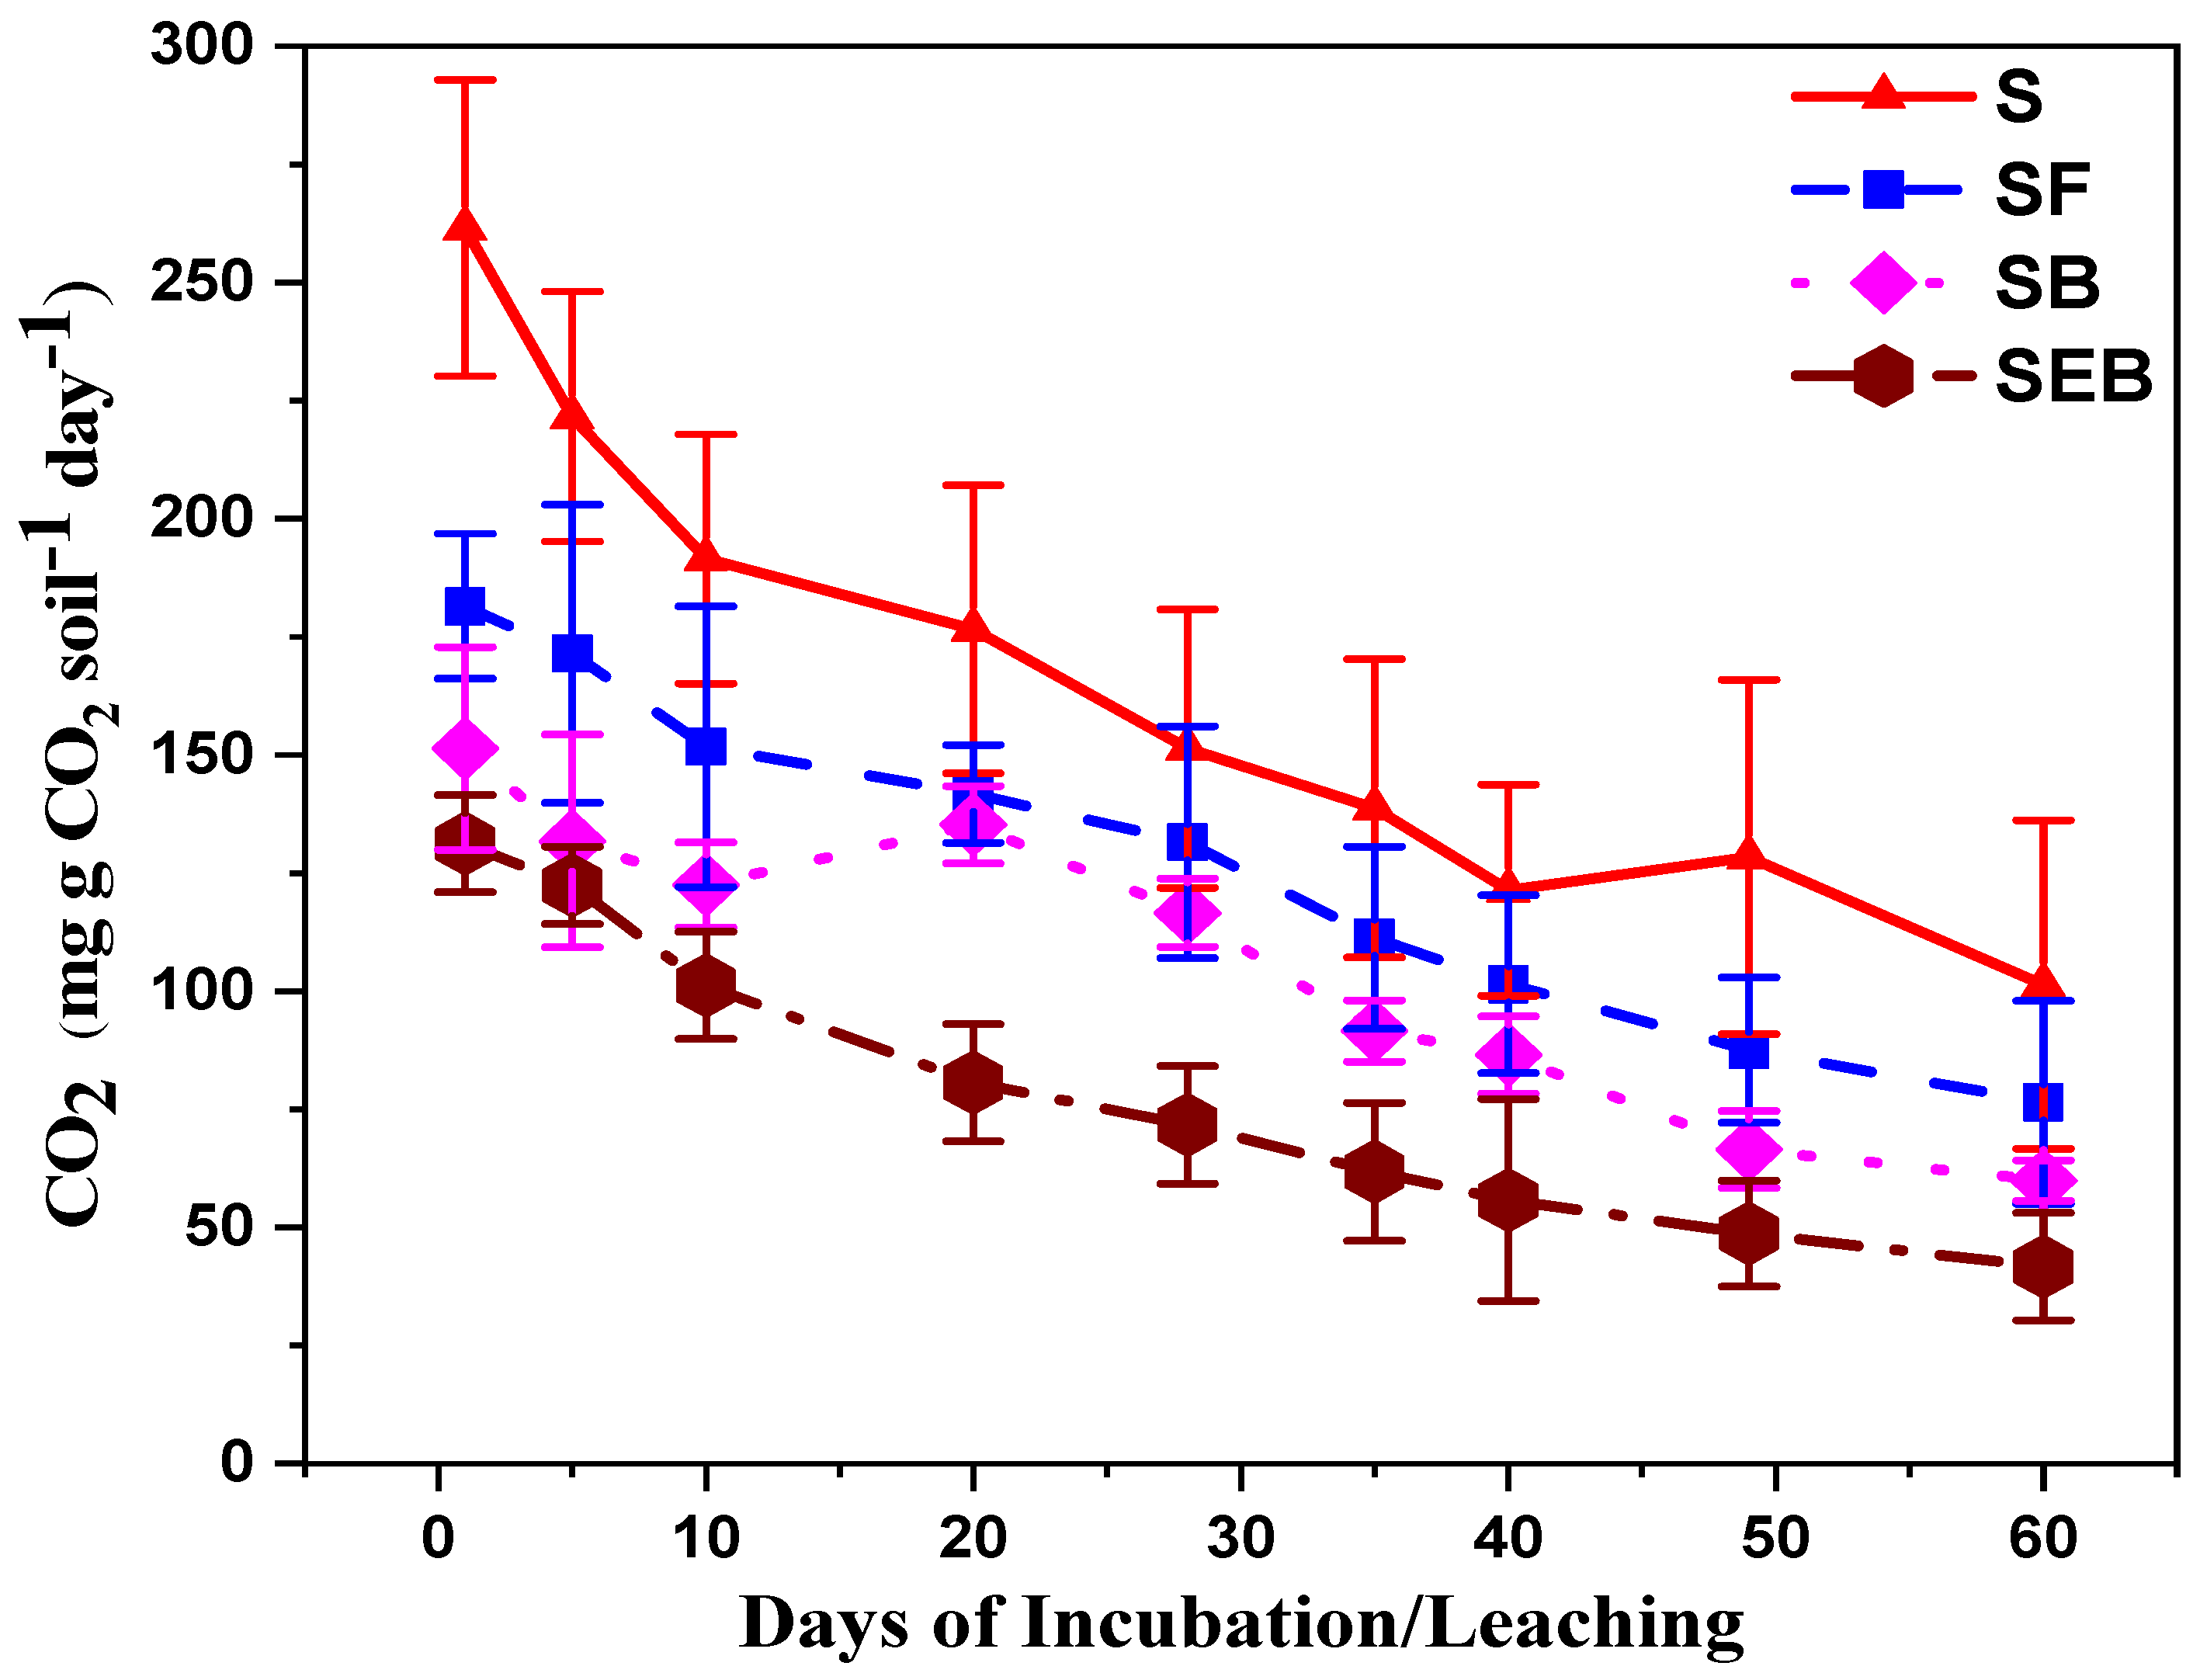
3.2. Experiment I: An Incubation Experiment

The soil inorganic N (NH4-N and NO3-N) was significantly reduced in the SEB and SB treatments as compared to alone soil treatments (Figure 1A,B). Moreover, the decrease in KCl extractable NH4 and NO3 was more prominent within the treatment especially in NH4 (Figure 1A,B). The net ammonification was reduced to 1.50 times in SF (soil + feedstock) treatments and this reduction was increased by 15% in the SB (soil + biochar) treatments but the maximum reduction was noted in the SEB treatments and it was 2.82 times more as compared to alone soil treatments (Figure 2A). Almost similar results were noted in the case of net NO3 but the variability within the treatment was reduced in SB (by 86% as compared to SF) and SEB (by 2.15 times as compared to SB) by 4.83 times as compared to S treatments. The negative net ammonification for SEB, SB, and SF exhibited that the rate of NO3 was higher than the rate of N mineralization to NH4 (Figure 2A–C).
The addition of biochar (SB) and enriched biochar (SEB) to soil was resulted in a significant reduction of carbon dioxide fluxes as compared to alone soil treatments (S; Figure 3; (mg CO2 g−1 C d−1)) during the specific duration (days 1, 5, 10, 20, 28, 35, 42, 49, 60). The CO2 emission was significantly reduced in SF, SB, and SEB treatments by 61, 74, and 95% respectively over to alone S treatments.

3.3. Leaching Experiment

The losses of cation bases during the leaching experiment in the S, SB, and SEB treatments were recorded in Table 2. The addition of SEB to soil decreased the cation losses in the leachates as compared to SB and control (S) treatments. Moreover, it was noted that a higher concentration of some minerals was found in the leachates during initial sampling periods i.e., N, P, and Na on day 1, Ca and Mg on day 5, and the K on day 28. However, at the end of the experiment, we found no significant difference in the cumulative leaching losses because of the short duration of the experiment. During the study, it was recorded that the effect of SEB on the leaching losses was more compared to SB or alone S treatments. Furthermore, the C/N ratio was lower in SB (39.9) and alone in S treatment (by 33.5) but higher for SEB treatments (by 42.4). Additionally, it was indicated that lower loss of water-soluble C or higher loss of N from the SEB treatments.

3.4. Wheat Experiment

Enriched biochar (EB) improved the wheat plant growth, nutrients uptake, relative water (RW), and organic matter (OM) contents as compared to control and other treatments (Table 3; p < 0.05). EB enhanced the physiological characteristics of wheat as PH (by 46%), LAI (by 35%), FBY (by 40%), and WDM (by 54%) over the control (Table 3). Likewise, the maximum macro-nutrients [N (by 80%), P (by 88%), K (by 86%), Ca (by 90%)] uptake was recorded with the EB treatments as compared to control. Moreover, EB treatments increased the availability of micronutrients i.e., Mg (by 69%) and Zn (by 85%) which are appeared in the form of higher uptake than all UFC (control). However, the application of organic amendments improved the RW (by 91%) and OM (0.73%) while it lowered the pH of the soil (6.81) significantly. Higher pH (8.32) is one of the big problems in the soils of Pakistan (Table 3).
The increase in enzymes activities was noted in the SEB, SB, and SF treatments but the maximum was achieved in the enriched biochar treatments (SEB; Table 4). The soil enzymes activities i.e., β-glucosidase (βGS), acid phosphate (APH), catalase (CL), dehydrogenase (DHG), phosphomonoestrase (PHE), and urease (UE) in the enriched biochar treatments was significantly increased ranging from 48.69 to 74.94%, 46.10 to 66.39% 60.71 to 86.42%, 14.29 to 68.19%, 11.76 to 92.65% and 24.06 to 65.29% respectively in contrary to control (SUFC; p < 0.05). Although the significant improvement of soil enzymes activities was recorded in the SB alone treatments. So, the alone SB treatments proved effective to increase βGS (by 67%), APH (by63%), CL (by 83%), DHG (by 69%), PHE (by 27%), and UE (by 51%), and over the SUFC (control) as noted in our study.
The soil chemical (total carbon, TC; total nitrogen, TN), microbial biomasses (MBC and MBN), and soil physical properties (SBD and SPD) was increased upon the application of enriched biochar as compared to SBC, SF, SFC, and SUFC (Table 5; p < 0.05). During our study, the SEB was found the most effective in improving different soil characteristics from 0.51 to 1.41% (TC), 0.11 to 0.45% (TN), 141 to 286 µg g−1 (MBC), 31 to 131 µg g−1 (MBN), 1.14 to 142 mg m−3 (SBD) and 47.23 to 38.33% (SPD). Moreover, a significant difference with the decrease of 11% (TC), 20% (TN), 13% (MBC), 23% (MBN), 15% (SBD), 9% (SPD) was observed between the BC alone and enriched BC.
The minimum values of soil chemical, soil microbial biomasses, and soil physical properties were recorded in the SUFC (control). The concentration of macro-nutrients (N, P, K, Mg, and Ca; mg kg−1) ranged from 2.01 to 12.18, 0.91 to 5.14, 0.81 to 4.11, 1.01 to 2.96, and 1.00 to 2.34, respectively while that of the micronutrients such as Fe, Mn, Cu, and Zn ranged from 6.48 to 21.78, 2.01 to 5.11, 1.01 to 2.08 and 11.59 to 26.78, respectively (Table 6). Surprisingly, the macro and micro-nutrients concentrations were improved with the application of SEB or SB, or SF as compared to SUFC. Moreover, the increment in data numbers was variable in different soil amendment treatments. However, the application of SEB increased the concentration of macronutrients such as N, P, K, Mg and Ca by 11, 24, 27, 28, and 14%, respectively in wheat plant biomass compared to SB alone treatment (Table 6).
The data in Figure 4 indicated that phosphorus use efficiency (PUE; %) was improved over the application of soil amendments than no amendment pots. Furthermore, the promising increase in PUE was recorded in SEB than all other amendments or non-amendment treatments (p ≤ 0.05). The apparent nitrogen recovery (ANR; %) was enhanced with the application of soil amendments and the maximum was measured in the SEB than all other soil amendments or non-soil amendments. The maximum ANR was calculated in SEB treatments (by 55%), followed by SB alone treatments (by 44%) and SF treatments (by 42%). The statistically minimum ANR was noted in the SUFC treatments (by 20%).

4. Discussion

In the present study, date palm biochar (DPB) was enriched with buffalo slurry. The soil amendments were added to the soil at the rate of 2% and significantly reduced the gaseous flux of nitrogen (N) and carbon (C) from the soil during the time duration of 60 days. Additionally, we noted that biochar and feedstock were not statistically different in terms of N and C emission from each other. This was might be due to less available soil inorganic N and hence low denigration rate in the soil. However, the process of emission of carbon and nitrogen was greatly controlled by the presence of soil inorganic N and soil organic C [32] through enrichment with N source in the present study. Dissolved organic C into soil provided the electron donor to denitrification process along with loss of oxygen during this process and produced the CO2 [33]. The acceleration in the denitrification process in the SEB treatments might be due to higher water-filled pore spaces (WPS) and organic carbon present in the soils (Figure 2 and Figure 3). This increase in WPS in the SEB treatments provided anaerobic environment among the soil pores which enhanced the denitrification process and decreased microbial respiration. Moreover, literature exhibited that denitrification is very much sensitive to WPS environment in the soil. Jahangir et al. [34] support our findings that the WPS (60–80%) increased the N2O emission by 30-fold as compared to control. Moreover, higher mineralization of N into NH4+ during the present study increased inorganic N concentration after the application of enriched biochar (Figure 1, Figure 2 and Figure 3). Remarkably, less production of gaseous flux in the SF treatment was recorded in the early days, however, the vigorous increase was noted after 25 days which was statistically non-significant from SB treatments (Figure 2 and Figure 3).
The concentration of net ammonification and net nitrification from the soil in SEB treatment was lower than the control treatment during the 60 days of study. It might be due to the application of enriched biochar to soil which resulted in a decrease of 50 and 66% in NH4-N and NO3-N, respectively than that of non-enriched biochar treatments (Figure 1). The adding of carbon biomass increased the NO3 depletion by increasing the denitrification [34] which was very worthwhile in the tropical environment of Pakistan where high soil temperature and less C reservoir accelerated the C loss from the soil [35].
Soil enriched biochar application increased the soil adsorption capacity to retain the nutrients [36,37], higher at the beginning of the experiment and much slower at the end of the experiment, over to SB and SUFC treatments during the study periods of 60-d (Table 1). The lower soil pH of the SEB treatments (6.91) improved nutrient retention [38,39]. These results are in close agreement with those of Kizito et al. [40], Whitman, et al. [41] who stated that pH ranged from 6.5–7.00 improved the availability and retention of the nutrients. Our outcomes are in line with other studies which found that biochar application to the soil at 2% significantly affected the volume of the leachates than low or no biochar application column [35,42]. Additionally, biochar improved soil aggregation and soil structure.
Enriched biochar enhanced wheat agronomy, soil microbial mass, soil enzyme activities, and soil mineral contents during the study. Nutrient fixation and low availability of nutrients are some of the extreme restraints to world food security especially in zones of arid to semi-arid areas [43]. SEB treatments expressively improve mineral concentrations of plants. Additionally, it reduced the shock of nutrients in the soil. The soil pH and EC were increased with the application of SB treatments. SUFC decreased PH, LAI, fresh biomass pot−1 and wheat dry matter yield by 13%, 21%, 54%, 73% and 79%. The maximum pH and EC in soil were observed in control, followed by SUFC and SB. The application of enriched biochar (SEB) caused the maximum improvement in plant mineral contents and growth attributes [44]. Higher plant mineral contents were due to improvemen in the soil organic matter contets (SOM). The (SOM) increased from 0.50 to 0.70% with the application of soil amendments as compared to control. Additionally, the plant minerals concentration was also significantly affected under different biochar treatments e.g., concentration of P in the plant biomass was significantly increased after the application of biochar.
Enzymes activities in the soil had a key role in degrading the organic compounds including the plant biomass and animal manures. In our study, a positive correlation between biochar and enzyme activities was seen [45,46]. The concentration of enzymes regulated the activities of soil microbes [47]. Higher β-glucosidase, APH, CL, PHE, and UE activities in the SEB treatments were strongly correlated to organic compound cycling [48,49]. The higher volatile compounds in the biochar treatments may enhance the activities of the enzymes in the soil [50,51]. Moreover, it was noted that SEB treatments were improved the concentration of phosphatase catalase which involved in the hydrolysis of anhydrides and esters in the soil. The UE activities that were increased in biochar treatment could be associated with an increase in specific enzymes availability and related to N utilization in soil. These results are in line with those of Bhaduri et al. [52] and Huang et al. [46]. Moreover, biochar increased the N transformation which was might be due to UE activities [53,54].
In summary, the results of the current study indicated that enriched biochar application to soil may lower the gaseous emission of N and C from soil and therefore, the reduction in carbon footprints associated with agricultural practice especially fertilizer pollution. The results of this study would help the farming community of South East Asia where considerable farming community involved in animal farming and further the application of its manure to their agricultural lands

5. Conclusions

Enriched biochar was proved a more stable organic product which reduced the gaseous fluxes of C and N and further its mineralization in the soil. Generally, the soil enzymes activities and microbial biomass were increased in the biochar treatments as compared to UFC and control treatments. Incubation of SEB improved its feature and increased the plant growth and nutrients uptake, soil enzymes activities, soil microbial biomasses, plant mineral concentrations that showed the sustainable availability of nutrients in the soil. Enriched biochar should be applied on large scale at the field level under different climatic conditions and soil types to understand its behavior under different regimes before its final recommendation.

Supplementary Materials

The following are available online at https://www.mdpi.com/article/10.3390/land10121392/s1, Table S1: Physiochemical properties of both soils before the start of the experiment.

Author Contributions

Conceptualization, H.M.R.J., I.A. and M.A.; methodology, H.M.R.J., M.A. and I.A.; software, H.M.R.J., M.A., I.A.-A. and R.Q.; validation, H.M.R.J., X.W. and A.E.S.; formal analysis, H.M.R.J., M.A., M.H.-U.-R., I.A.-A. and M.A.; investigation, H.M.R.J., I.A. and M.A.; resources, I.A. and R.Q.; data curation, H.M.R.J., I.A.-A., A.E.S. and X.W.; writing—original draft preparation, H.M.R.J., I.A., R.Q. and M.A.; writing—review and editing, I.A.-A., A.I., X.W., M.H.-U.-R., A.D. and A.E.S.; and supervision, H.M.R.J. and A.E.S. funding acquisition, X.W., I.A.-A. and H.M.R.J. All authors have read and agreed to the published version of the manuscript.

Funding

This Research was funded by the Researchers Supporting Project number (RSP-2021/298), King Saud University, Riyadh, Saudi Arabia.

Institutional Review Board Statement

Not applicable.

Informed Consent Statement

Not applicable.

Data Availability Statement

Not applicable.

Acknowledgments

The authors extend their appreciation to the Researchers Supporting Project number (RSP-2021/298), King Saud University, Riyadh, Saudi Arabia.

Conflicts of Interest

All authors declare that there is no conflict of interest.

References

  1. Gangil, S.; Wakudkar, H.M. Generation of biochar from crop residues. Int. J. Emerg. Technol. Adv. 2013, 3, 566–570. [Google Scholar]
  2. Deenik, J.L.; McClellan, A.; Uehara, G. Biochar volatile matter content effects on plant growth and nitrogen transformations in a tropical soil. In Proceedings of the Western Nutrient Management Conference, Salt Lake City, UT, USA, 4–5 March 2009; pp. 26–31. [Google Scholar]
  3. Javeed, H.M.R.; Ali, M.; Qamar, R.; Shehzad, M.; Haseebur, R.; Nawaz, F.; Jamil, M.; Ahmad, A.; Farooq, A.; Masood, N.; et al. Effect of Date Biochar Pyrolyzed at Different Temperature on Physiochemical Properties of Sandy Soil and Wheat Crop Response. Commun. Soil Sci. Plant Anal. 2021, 52, 2110–2124. [Google Scholar] [CrossRef]
  4. Sarkhot, D.V.; Berhe, A.A.; Ghezzehei, T.A. Impact of biochar enriched with dairy manure effluent on carbon and nitrogen dynamics. J. Environ. Qual. 2012, 41, 1107–1114. [Google Scholar] [CrossRef] [Green Version]
  5. Nelson, D.W.; Sommers, L.E. Total carbon, organic carbon, and organic matter. In Methods of Soil Analysis. Part 3: Chemical Methods; Sparks, D.L., Page, A.L., Helmke, P.A., Loeppert, R.H., Eds.; SSSA Book Series; John Wiley and Sons: Hoboken, NJ, USA, 1996. [Google Scholar]
  6. Page, A.L.; Miller, R.H.; Keeney, D.R. Methods of Soil Analysis. Part 2. Chemical and Microbiological Properties; American Society of Agronomy: Madison, WI, USA, 1982. [Google Scholar]
  7. Estefan, G.; Sommer, R.; Ryan, J. Methods of Soil, Plant, and Water Analysis: A Manual for the West Asia and North Africa Region; International Center for Agricultural Research in the Dry Areas: Beirut, Lebanon, 2013; Volume 3. [Google Scholar]
  8. Loeppert, R.H.; Suarez, D.L. Carbonate and gypsum. In Methods of Soil Analysis. Part 3: Chemical Methods; Bigham, J.M., Ed.; SSSA. Book Series No 5; American Society of Agronomy: Madison, WI, USA, 1996. [Google Scholar]
  9. Walkley, A.; Black, I.A. An examination of the Degtjareff method for determining soil organic matter, and a proposed modification of the chromic acid titration method. Soil Sci. 1934, 37, 29–38. [Google Scholar] [CrossRef]
  10. Abbasi, M.K.; Khaliq, A. Nitrogen mineralization of a loam soil supplemented with organic-inorganic amendments under laboratory incubation. Front. Plant Sci. 2016, 7, 1038. [Google Scholar] [CrossRef] [Green Version]
  11. Ministry of Agriculture, Fisheries and Food. The Analysis of Agricultural Materials: A Manual of the Analytical Methods Used by the Agricultural Development and Advisory Service; MAFF Technical Bulletin No. 27; Ministry of Agriculture, Fisheries and Food: London, UK, 1973.
  12. Houba, V.; van der Lee, J.; Novozamsky, I.; Walinga, I.; van Vark, W.; Temminghoff, E. Soil and Plant Analysis; Wagenigen Uviversity: Wagenigen, The Netherlands, 1986. [Google Scholar]
  13. Hart, S.C.; Nason, G.E.; Myrold, D.D.; Perry, D.A. Dynamics of gross nitrogen transformations in an old-growth forest: The carbon connection. Ecology 1994, 75, 880–891. [Google Scholar] [CrossRef]
  14. Water Environmental Federation; APH Association. Standard Methods for the Examination of Water and Wastewater; American Public Health Association (APHA): Washington, DC, USA, 2005. [Google Scholar]
  15. Meason, D.F.; Markewitz, D.; Will, R.E. Annual fertilization and interspecific competition control: Effects on in situ forest floor nitrogen fluxes of different-aged Pinus taeda stands in southeast Georgia, USA. Can. J. For. Res. 2004, 34, 1802–1818. [Google Scholar] [CrossRef]
  16. DeLuca, T.H.; Sala, A.J.E. Frequent fire alters nitrogen transformations in ponderosa pine stands of the inland northwest. Ecology 2006, 87, 2511–2522. [Google Scholar] [CrossRef]
  17. Robertson, G.P.; Coleman, D.C.; Sollins, P.; Bledsoe, C.S. Standard Soil Methods for Long-Term Ecological Research; Oxford University Press: Oxford, UK, 1999; Volume 2. [Google Scholar]
  18. Neff, J.C.; Hooper, D.U. Vegetation and climate controls on potential CO2, DOC and DON production in northern latitude soils. Glob. Chang. Biol. 2002, 8, 872–884. [Google Scholar] [CrossRef]
  19. Brookes, P.; Landman, A.; Pruden, G.; Jenkinson, D. Chloroform fumigation and the release of soil nitrogen: A rapid direct extraction method to measure microbial biomass nitrogen in soil. Soil Biol. Biochem. 1985, 17, 837–842. [Google Scholar] [CrossRef]
  20. Vance, E.D.; Brookes, P.C.; Jenkinson, D.S. An extraction method for measuring soil microbial biomass C. Soil Biol. Biochem. 1987, 19, 703–707. [Google Scholar] [CrossRef]
  21. Jenkinson, D.S.; Brookes, P.C.; Powlson, D.S. Measuring soil microbial biomass. Soil Biol. Biochem. 2004, 1, 5–7. [Google Scholar] [CrossRef]
  22. Joergensen, R.G.; Mueller, T. The fumigation-extraction method to estimate soil microbial biomass: Calibration of the kEN value. Soil Biol. Biochem. 1996, 28, 33–37. [Google Scholar] [CrossRef]
  23. Rasband, W.S. ImageJ; US National Institute of Health: Bethesda, MA, USA, 2011.
  24. Fageria, N.K.; Baliger, V.C.; Jones, C.A. Growth and Mineral Nutrition of Field Crops, 2nd ed.; Marcel Dekker, Inc.: New York, NY, USA, 1997. [Google Scholar]
  25. Tabatabai, M.; Bremner, J. Use of p-nitrophenyl phosphate for assay of soil phosphatase activity. Soil Biol. Biochem. 1969, 1, 301–307. [Google Scholar] [CrossRef]
  26. Xu, G.; Zheng, H. Analysis Method Handbook of Soil Microorganisms; Agriculture Press: Beijing, China, 1986; pp. 287–289. [Google Scholar]
  27. Casida, L.E., Jr. Microbial metabolic activity in soil as measured by dehydrogenase determinations. Appl. Environ. Microbiol. 1977, 34, 630–636. [Google Scholar] [CrossRef] [Green Version]
  28. Naveed, M.; Tanvir, B.; Xiukang, W.; Brtnicky, M.; Ditta, A.; Kucerik, J.; Subhani, Z.; Nazir, M.Z.; Radziemska, M.; Saeed, Q.; et al. Co-composted biochar enhances growth, physiological and phytostabilization efficiency of Brassica napus and reduces associated health risks under Cr stress. Front. Plant Sci. 2021, 12, 775785. [Google Scholar] [CrossRef]
  29. Kandeler, E.; Gerber, H. Short-term assay of soil urease activity using colorimetric determination of ammonium. Biol. Fertil. Soils 1988, 6, 68–72. [Google Scholar] [CrossRef]
  30. Pikovskaya, R. Mobilization of phosphorus in soil in connection with vital activity of some microbial species. Mikrobiologiya 1948, 17, 362–370. [Google Scholar]
  31. Steel, R.G.; Torrie, J.H.; Dickey, D.A. Principles and Procedures of Statistics: A Biological Approach; McGraw Hill: New York, NY, USA, 1997. [Google Scholar]
  32. Troy, S.M.; Lawlor, P.G.; O’ Flynn, C.J.; Healy, M.G. Impact of biochar addition to soil on greenhouse gas emissions following pig manure application. Soil Biol. Biochem. 2013, 60, 173–181. [Google Scholar] [CrossRef] [Green Version]
  33. Rivett, M.O.; Buss, S.R.; Morgan, P.; Smith, J.W.; Bemment, C.D. Nitrate attenuation in groundwater: A review of biogeochemical controlling processes. Water Res. 2008, 42, 4215–4232. [Google Scholar] [CrossRef]
  34. Jahangir, M.M.; Khalil, M.I.; Johnston, P.; Cardenas, L.; Hatch, D.; Butler, M.; Barrett, M.; O’flaherty, V.; Richards, K.G. Denitrification potential in subsoils: A mechanism to reduce nitrate leaching to groundwater. Agric. Ecosyst. Environ. 2012, 147, 13–23. [Google Scholar] [CrossRef] [Green Version]
  35. Sorrenti, G.; Toselli, M. Soil leaching as affected by the amendment with biochar and compost. Ecosyst. Environ. 2016, 226, 56–64. [Google Scholar] [CrossRef]
  36. Gronwald, M.; Don, A.; Tiemeyer, B.; Helfrich, M. Effects of fresh and aged chars from pyrolysis and hydrothermal carbonization on nutrient sorption in agricultural soils. Soil 2015, 1, 475. [Google Scholar] [CrossRef] [Green Version]
  37. Teutscherova, N.; Houška, J.; Navas, M.; Masaguer, A.; Benito, M.; Vazquez, E. Leaching of ammonium and nitrate from Acrisol and Calcisol amended with holm oak biochar: A column study. Geoderma 2018, 323, 136–145. [Google Scholar] [CrossRef]
  38. León, P.; Espejo, R.; Gómez-Paccard, C.; Hontoria, C.; Mariscal, I.; Renella, G.; Benito, M. No tillage and sugar beet foam amendment enhanced microbial activity of degraded acidic soils in southwest Spain. Appl. Soil Ecol. 2017, 109, 69–74. [Google Scholar] [CrossRef]
  39. Vazquez, E.; Teutscherova, N.; Almorox, J.; Navas, M.; Espejo, R.; Benito, M. Seasonal variation of microbial activity as affected by tillage practice and sugar beet foam amendment under Mediterranean climate. Appl. Soil Ecol. 2017, 117, 70–80. [Google Scholar] [CrossRef]
  40. Kizito, S.; Wu, S.; Kirui, W.K.; Lei, M.; Lu, Q.; Bah, H.; Dong, R. Evaluation of slow pyrolyzed wood and rice husks biochar for adsorption of ammonium nitrogen from piggery manure anaerobic digestate slurry. Sci. Total Environ. 2015, 505, 102–112. [Google Scholar] [CrossRef]
  41. Whitman, T.; Singh, B.P.; Zimmerman, A.R. Priming effects in biochar-amended soils: Implications of biochar-soil organic matter interactions for carbon storage. In Biochar for Environmental Management; Routledge: London, UK, 2015; pp. 487–520. [Google Scholar]
  42. Xu, N.; Tan, G.; Wang, H.; Gai, X. Effect of biochar additions to soil on nitrogen leaching, microbial biomass and bacterial community structure. Eur. J. Soil Biol. 2016, 74, 1–8. [Google Scholar] [CrossRef]
  43. Samuel, A.L.; Ebenezer, A.O. Mineralization rates of soil forms of nitrogen, phosphorus, and potassium as affected by organomineral fertilizer in sandy loam. Adv. Agric. 2014, 2014, 149209. [Google Scholar] [CrossRef] [Green Version]
  44. Pandit, N.R.; Mulder, J.; Hale, S.E.; Martinsen, V.; Schmidt, H.P.; Cornelissen, G. Biochar improves maize growth by alleviation of nutrient stress in a moderately acidic low-input Nepalese soil. Sci. Total Environ. 2018, 625, 1380–1389. [Google Scholar] [CrossRef]
  45. Murtaza, G.; Ahmed, Z.; Usman, M.; Tariq, W.; Ullah, Z.; Shareef, M.; Iqbal, H.; Waqas, M.; Tariq, A.; Wu, Y.; et al. Biochar induced modifications in soil properties and its impacts on crop growth and production. J. Plant Nutrit. 2021, 44, 1677–1691. [Google Scholar] [CrossRef]
  46. Huang, D.; Xu, J.; Zeng, G.; Lai, C.; Yuan, X.; Luo, X.; Wang, C.; Xu, P.; Huang, C. Influence of exogenous lead pollution on enzyme activities and organic matter degradation in the surface of river sediment. Environ. Sci. Pollut. Res. 2015, 22, 11422–11435. [Google Scholar] [CrossRef]
  47. Sarfraz, R.; Hussain, A.; Sabir, A.; Fekih, I.B.; Ditta, A.; Xing, S. Role of biochar and plant growth-promoting rhizobacteria to enhance soil carbon sequestration—A review. Environ. Monitor. Assess. 2019, 191, 251. [Google Scholar] [CrossRef]
  48. Gascó, G.; Paz-Ferreiro, J.; Cely, P.; Plaza, C.; Méndez, A. Influence of pig manure and its biochar on soil CO2 emissions and soil enzymes. Ecol. Eng. 2016, 95, 19–24. [Google Scholar] [CrossRef]
  49. Paz-Ferreiro, J.; Fu, S.; Méndez, A.; Gascó, G. Interactive effects of biochar and the earthworm Pontoscolex corethrurus on plant productivity and soil enzyme activities. J. Soils Sediments 2014, 14, 483–494. [Google Scholar] [CrossRef]
  50. Ameloot, N.; Sleutel, S.; Case, S.D.; Alberti, G.; McNamara, N.P.; Zavalloni, C.; Vervisch, B.; delle Vedove, G.; De Neve, S. C mineralization and microbial activity in four biochar field experiments several years after incorporation. Soil Biol. Biochem. 2014, 78, 195–203. [Google Scholar] [CrossRef]
  51. Khan, Z.; Rahman, M.H.u.; Haider, G.; Amir, R.; Ikram, R.M.; Ahmad, S.; Schofield, H.K.; Riaz, B.; Iqbal, R.; Fahad, S.; et al. Chemical and Biological Enhancement Effects of Biochar on Wheat Growth and Yield under Arid Field Conditions. Sustainability 2021, 13, 5890. [Google Scholar] [CrossRef]
  52. Bhaduri, D.; Saha, A.; Desai, D.; Meena, H.N. Restoration of carbon and microbial activity in salt-induced soil by application of peanut shell biochar during short-term incubation study. Chemosphere 2016, 148, 86–98. [Google Scholar] [CrossRef] [PubMed]
  53. Wang, X.; Fan, J.; Xing, Y.; Xu, G.; Wang, H.; Deng, J.; Wang, Y.; Zhang, F.; Li, P.; Li, Z. The effects of mulch and nitrogen fertilizer on the soil environment of crop plants. Adv. Agron. 2019, 153, 121–173. [Google Scholar]
  54. Zaheer, M.S.; Ali, H.H.; Soufan, W.; Iqbal, R.; Habib-ur-Rahman, M.; Iqbal, J.; Israr, M.; El Sabagh, A. Potential Effects of Biochar Application for Improving Wheat (Triticum aestivum L.) Growth and Soil Biochemical Properties under Drought Stress Conditions. Land 2021, 10, 1125. [Google Scholar] [CrossRef]
Figure 1. Influence of biochar amendments on soil ammonium and nitrate (KCl extractable). The measurement of NH4 and NO3 was done on days 1, 5, 10, 20, 28, 35, 42, 49, 60, and was statistically different at a 5% probability level. The abbreviations of treatment are S, soil; SF, soil + feedstock; SB, soil + 2% biochar; SEB, soil + 2% enriched biochar (n = 4).
Land 10 01392 g001
Figure 2. The influence of biochar amendments on net ammonification (NH4-N), net nitrification (NO3-N), and net mineralization was measured by following the method of Robertson et al. [17]. The different letters on the bars are indicated the significant difference among the treatments at 5% probability levels. The abbreviations of treatment are S, soil; SF, soil + feedstock; SB, soil + 2% biochar; SEB, soil + 2% enriched biochar (n = 4).
Land 10 01392 g002
Figure 3. Influence of biochar amendments on CO2 flux. The measurement of NH4 and NO3 was done on days 1, 5, 10, 20, 28, 35, 42, 49, 60, and was statistically different at a 5% probability level. The abbreviations of treatment are S, soil; SF, soil + feedstock; SB, soil + 2% biochar; SEB, soil + 2% enriched biochar (n = 4).
Land 10 01392 g003
Figure 4. Influence of biochar amendments on apparent nitrogen recovery (ANR; %) and phosphorus use efficiency (PU; %). Values shows mean ± SD (n = 4). Bars sharing the same letters are statistically at par with each other at the significance level of 5% (p ≤ 0.05). The abbreviations of treatment are S, soil; SF, soil + feedstock; SB, soil + 2% biochar; SEB, soil + 2% enriched biochar (n = 4).
Land 10 01392 g004
Table 1. Total carbon (TC) and total nitrogen (TN) contents of the treatments.
TreatmentsTC (mg g−1)TN (mg g−1)
Soil1.81 ± 0.13 f0.21 ± 0.002 d
Feedstock681.12 ± 4.23 c2.93 ± 0.11 b
Biochar729.35 ± 8.46 b3.28 ± 0.31 b
Enriched biochar751.64 ± 4.29 a3.96 ± 0.16 a
Soil + biochar11.69 ± 1.36 e0.64 ± 0.002 d
Soil + enriched biochar18.57 ± 2.79 d0.81 ± 0.002 c
CV (%)1.650.02
The values are the means (n = 4) and values after the sign ± are the standard errors (SE). The different letters along the right side of SE show the significance at a 5% probability level (p < 0.05).
Table 2. Influence of biochar amendments on the cumulative leaching losses of mineral contents during 60-days of the experiment.
S (mg g−1)SB (mg g−1)SEB (mg g−1)
C2.41 ± 0.7112.11 ± 1.1211.86 ± 0.816
N0.09 ± 0.0020.07 ± 0.0020.04 ± 0.001
P0.06 ± 0.0050.06 ± 0.0040.04 ± 0.003
K0.20 ± 0.0040.15 ± 0.0060.11 ± 0.002
Na2.01 ± 0.6012.21 ± 0.4141.86 ± 0.216
Ca0.51 ± 0.8120.59 ± 0.050.41 ± 0.614
Mg0.18 ± 0.0010.21 ± 0.0010.16 ± 0.002
CV (%)0.820.660.31
The values are the means (n = 4) and values after the sign ± are the standard errors (SE). Abbreviation; S, soil; SB, soil + biochar; SEB, soil + enriched biochar.
Table 3. Effects of soil amendments on growth and yield, soil properties, and nutrient uptake in wheat plants.
SFSSUFCSFCSBSEBCV (%)
pH7.41 ± 0.61 d8.12 ± 0.88 a7.98 ± 0.91 c7.68 ± 0.69 bc6.91 ± 0.94 e1.21
Organic matter (%)0.53 ± 0.06 c0.43 ± 0.06 d0.55 ± 0.10 c0.62 ± 0.05 b0.73 ± 0.07 a1.48
Plant height (cm)95.11 ± 3.18 c67.67 ± 3.54 d96.91 ± 2.24 c101.34 ± 3.06 b126.34 ± 2.52 a8.79
Leaf area index 4.08 ± 0.22 c3.07 ± 0.26 d4.01 ± 0.14 c4.31 ± 0.11 b4.72 ± 0.16 a8.46
Fresh biomass yield (g pot−1)194.48 ± 5.02 c144.45 ± 9.17 d202.05 ± 5.74 bc210.67 ± 7.47 b240.14 ± 6.36 a12.39
Dry matter yield (g pot −1)50.38 ± 3.78 c31.24± 4.36 d54.89 ± 4.69 c60.10 ± 5.37 b68.06 ± 2.48 a10.38
Relative water contents (%)70.45 ± 4.15 c62.25± 7.69 d76.74± 4.21 c82.56± 7.39 b90.69± 10.10 a12.36
N (mg pot−1)366.03 ± 3.81 c161.15 ± 28.91 e302.61 ± 23.81 d212.14 ± 32.61 b412.78 ± 65.31 a14.56
P (mg pot−1)23.74 ± 3.45 bc3.45 ± 0.14 e16.69 ± 1.15 d21.48 ± 0.96 c28.69 ± 1.23 a10.36
K (mg pot−1)155.69 ± 16.79 bc31.69 ± 2.45 d131.94 ± 9.47 c186.21 ± 11.69 b231.56 ± 16.89 a9.11
Ca (mg pot−1)81.69 ± 2.48 b11.59 ± 2.71 d51.48 ± 3.49 c91.78 ± 2.57 b111.23 ± 3.48 a10.01
Mg (mg pot−1)26.96 ± 2.58 d6.49 ± 0.99 e33.14 ± 1.68 cd41.69 ± 3.14 b61.79 ± 2.41 a12.46
Zn (mg pot−1)61.05 ± 4.56 bc11.69 ± 1.79 d58.79 ± 2.48 c55.37 ± 1.89 c78.36 ± 3.48 a8.67
The values are the means of four replications (n = 4). The different letters along the right side of SE show the significance at a 5% probability level (p < 0.05). Where SFS = soil + feedstock, SUFC = soil + unfertilized control, SFC = soil+ fertilizer control, SB = soil+ biochar, and SEB = soil + enriched biochar.
Table 4. Effects of soil amendments on soil enzyme activities after the crop harvesting.
TreatmentsβGSAPHCLDHGPHEUE
SF1.91 ± 0.28 c21.69 ± 2.01 d0.28 ± 0.02 c0.21 ± 0.01 d1.19 ± 0.14 b1.33 ± 0.31 c
SUFC0.98 ± 0.01 d11.69 ± 1.55 e0.11 ± 0.03 d0.18 ± 0.02 d1.05 ± 0.22 c1.01 ± 0.11 d
SF2.41 ± 0.61 c28.79 ± 1.89 c0.37 ± 0.01 c0.44 ± 0.01 c1.24 ± 0.24 b1.58 ± 0.03 c
SB3.01 ± 0.34 b31.58 ± 3.14 b0.66 ± 0.02 b0.58 ± 0.01 b1.44 ± 0.11 a2.06 ± 0.02 b
SEB3.91 ± 0.11 a34.78 ± 4.26 a0.81 ± 0.02 a0.66 ± 0.01 a1.68 ± 0.41 a2.91 ± 0.01 a
CV(%)0.762.610.110.090.130.37
The different letters along the right side of SE show the significance at a 5% probability level (p < 0.05). Where SFS = soil + feedstock, SUFC = soil + unfertilized control, SFC = soil + fertilizer control, SB = soil + biochar, and SEB = soil + enriched biochar. βGS, β-glucosidase (mol PNF g−1 h−1); APH, acid phosphate (µg p-NP g−1 24 h−1); CL, catalase (Vol. of KMNO4 g−1 soil); DHG, dehydrogenase (µg TFP g−1 h−1); UE, Urease (µgN-NH4 kg−1 h−1).
Table 5. Effects of soil amendments on soil chemical, soil microbial biomass, and soil physical properties.
TC (%)TN (%)MBC (µg g−1)MBN (µg g−1)SBD (mg m−3)SPD (%)
SF0.88 ± 0.35 c0.21 ± 0.03 d191 ± 8.91 d68 ± 1.05 c1.30 ± 0.15 c40.67 ± 4.51 c
SUFC0.51 ± 0.03 d0.11 ± 0.11 e141 ± 6.48 e31 ± 3.47 d1.42 ± 0.05 a47.23 ± 6.11 a
SFC1.01 ± 0.13 c0.28 ± 0.09 c221 ± 4.56 c92 ± 1.26 b1.36 ± 0.05 b43.31 ± 4.04 b
SB1.26 ± 0.05 b0.36 ± 0.11 b251 ± 3.11 b101 ± 4.11 b1.31 ± 0.10 c39.67 ± 4.51 c
SEB1.41 ± 0.08 a0.45 ± 0.31 a286 ± 6.78 a131 ± 5.32 a1.14 ± 0.07 d38.33 ± 3.06 d
CV (%)0.060.0813.4511.890.039.78
Mean values within each column sharing the same letters are not significantly different from each other (p = 0.05). The values are the means of four replications. The abbreviations are TC, total carbon; TN, total nitrogen; MBC, microbial biomass carbon; MBN, microbial biomass nitrogen; SBD, soil bulk density and SPD, soil porosity (%). Where SFS = soil + feedstock, SUFC = soil + unfertilized control, SFC = soil + fertilizer control, SB = soil + biochar, and SEB = soil + enriched biochar.
Table 6. Effects of soil amendments on the nutritional status of the wheat plant.
Macronutrients (mg kg−1 DW)Micronutrients (mg kg−1 DW)
NPKMgCaFeMnCuZn
SF6.21 ± 0.91 d2.01± 0.61 c1.71 ± 0.63 d1.41 ± 0.14 c1.91 ± 0.79 d11.89 ± 1.45 c2.89 ± 0.63 d1.21 ± 0.3116.78 ± 2.36 c
SUFC2.01 ± 0.22 e0.91 ± 0.12 d0.81 ± 0.41 e1.01 ± 0.48 d1.0 ± 0.326 e6.48 ± 0.88 d2.01 ± 0.33 e1.01 ± 0.49 d11.59 ± 1.02 d
SFC8.12 ± 0.11 c3.41 ± 0.64 b2.66 ± 0.65 c1.81 ± 0.36 b1.97 ± 0.46 c16.39 ± 1.23 b3.46 ± 0.15 cd1.53 ± 0.11 b22.78 ± 0.88 b
SB10.88 ± 1.23 b3.89 ± 0.33 b3.02 ± 0.74 bc2.01 ± 0.49 b2.01 ± 0.11 bc19.36 ± 0.91 a4.01 ± 0.45 b1.73 ± 0.13 b25.01 ± 0.36 a
SEB12.18 ± 1.05 a5.14 ± 0.18 a4.11 ± 0.18 a2.96 ± 0.51 a2.34 ± 0.13 a21.78 ± 2.13 a5.11 ± 0.11 a2.08 ± 0.31 a26.78 ± 1.36 a
CV (%)1.210.910.660.230.162.480.310.162.63
Mean values within each column sharing the same letters are not significantly differed from each other (p = 0.05). The values are the means of four replications. Where SFS = soil + feedstock, SUFC = soil + unfertilized control, SFC = soil + fertilizer control, SB = soil + biochar, and SEB = soil + enriched biochar.
Publisher’s Note: MDPI stays neutral with regard to jurisdictional claims in published maps and institutional affiliations.

