
Topographic Variation in Forest Expansion Processes across a Mosaic Landscape in Western Canada


Abstract
:1. Introduction
2. Methods
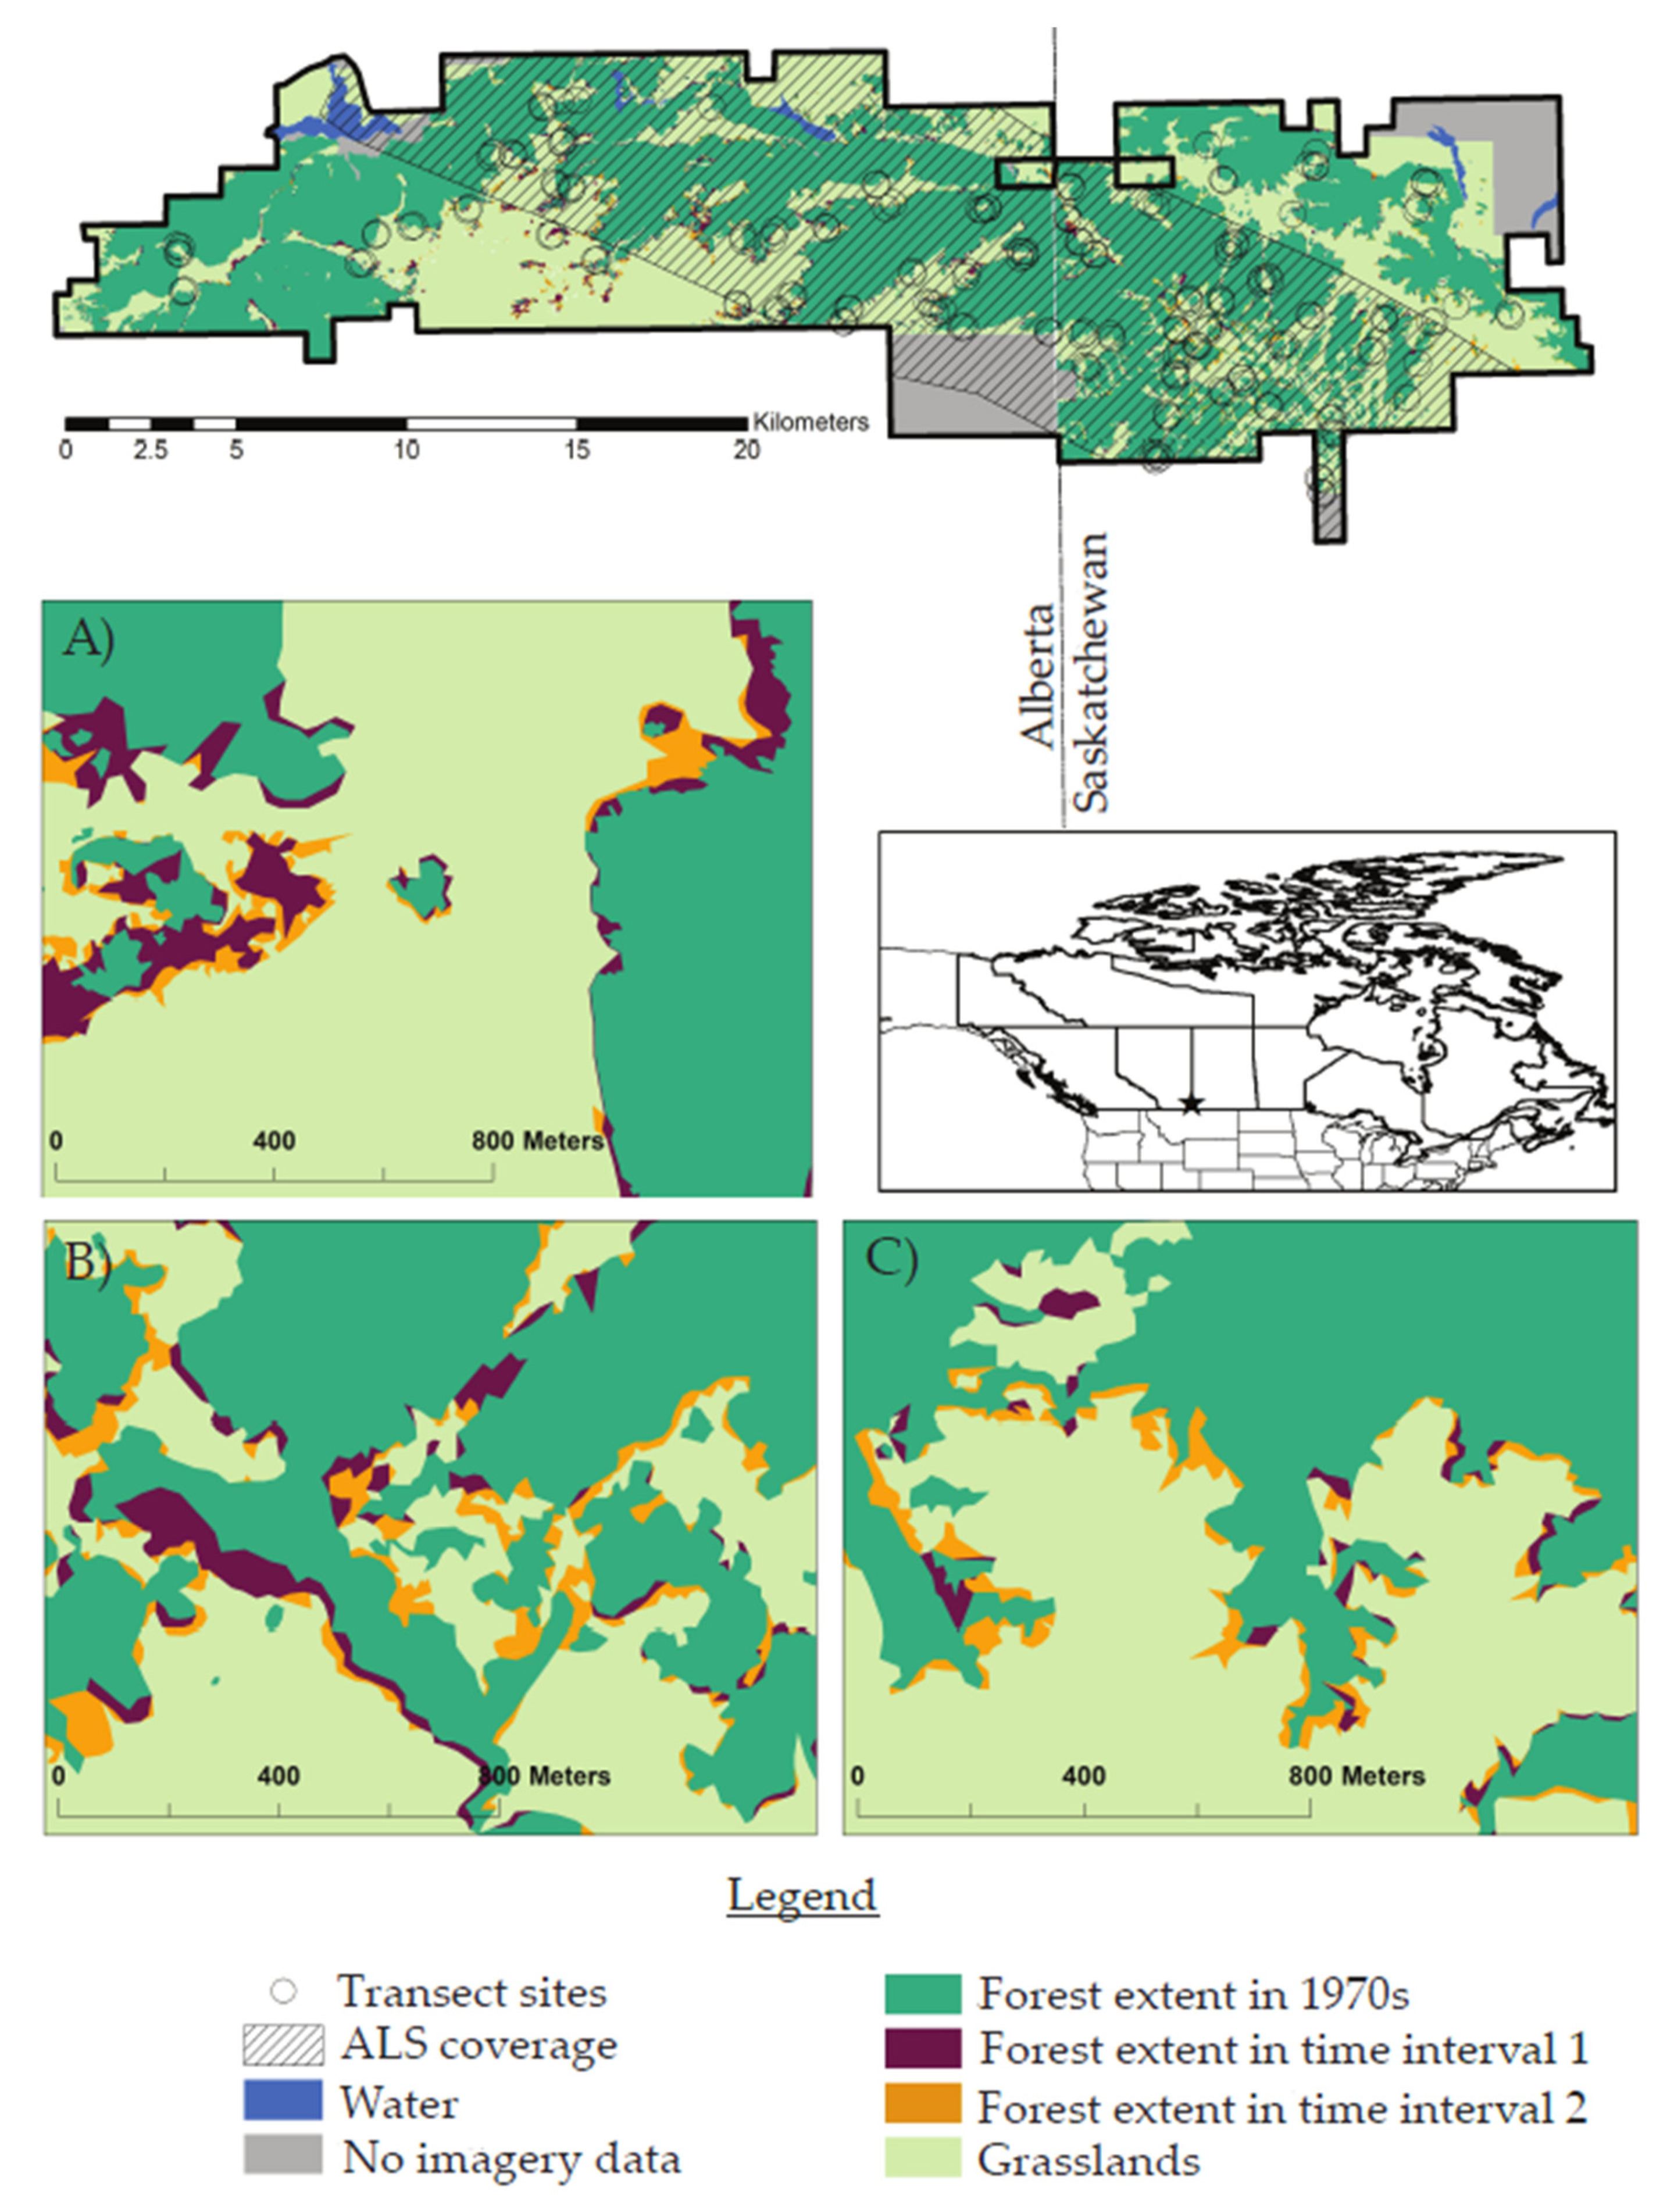
2.1. Study Area
2.2. Data Collection and Processing
2.2.1. Aerial Photographs
2.2.2. Airborne Laser Scanning
2.2.3. Regeneration and Scat Transects
2.3. Statistical Analysis
3. Results
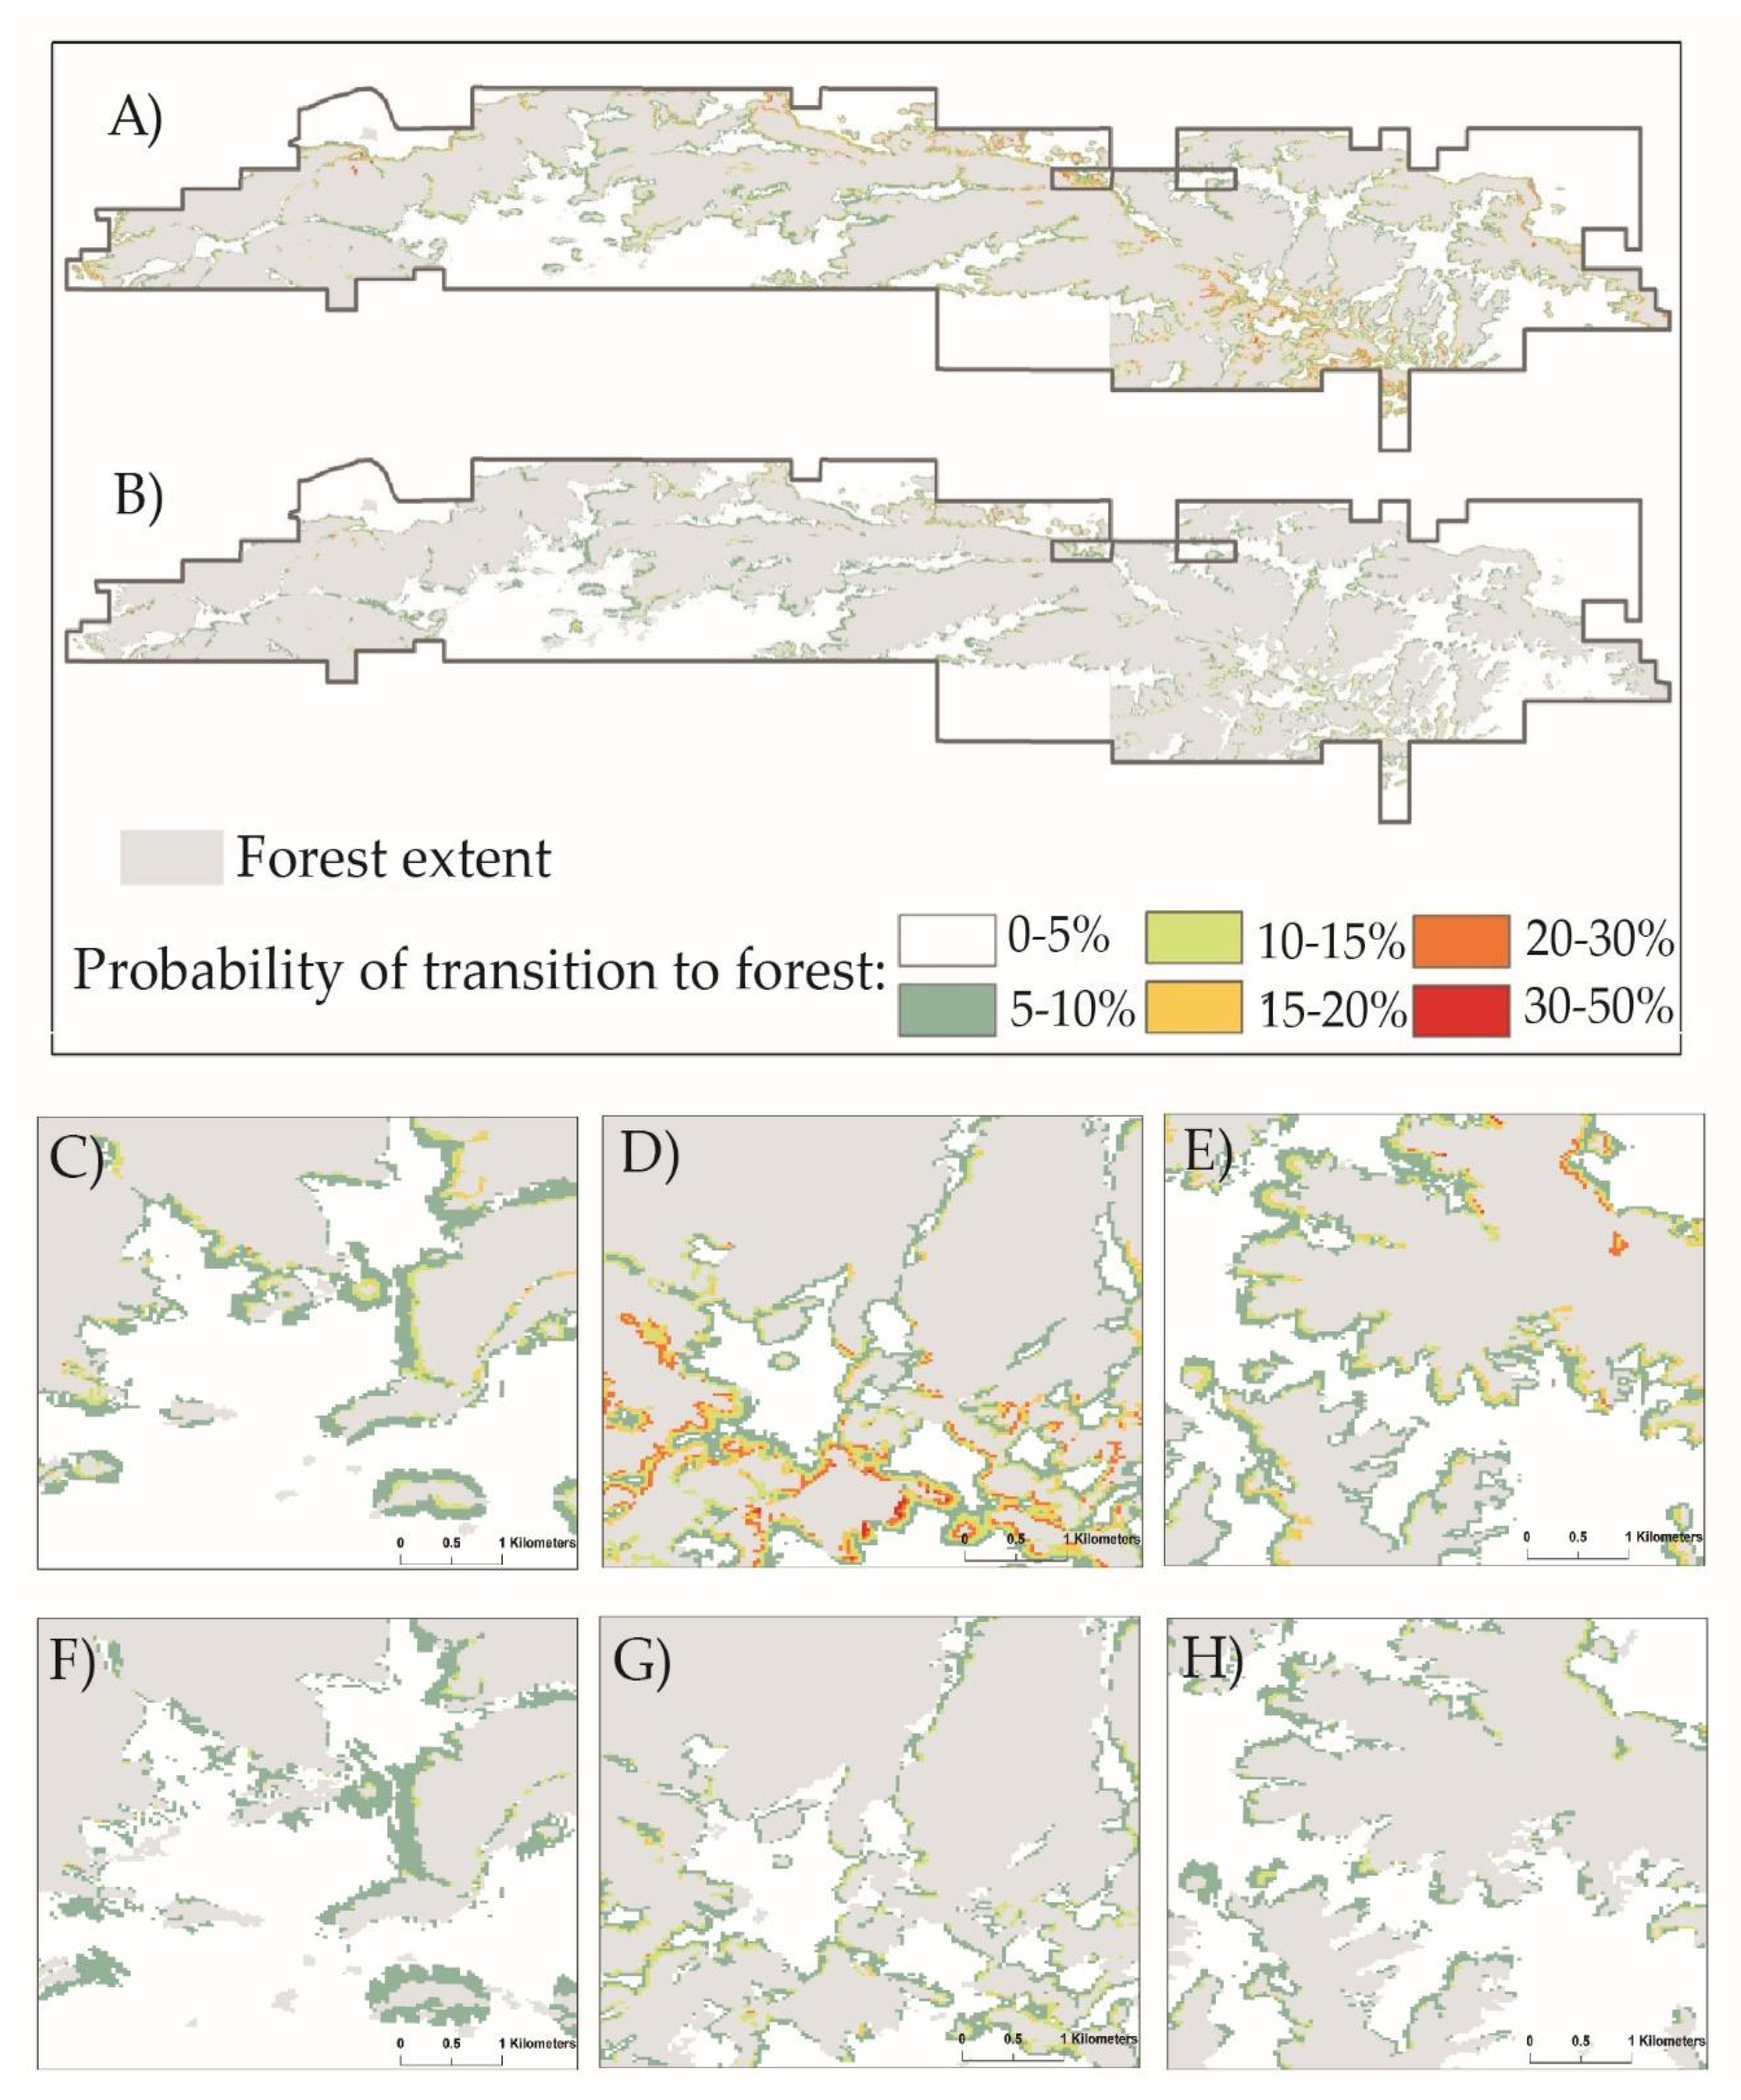
3.1. Land Cover Change
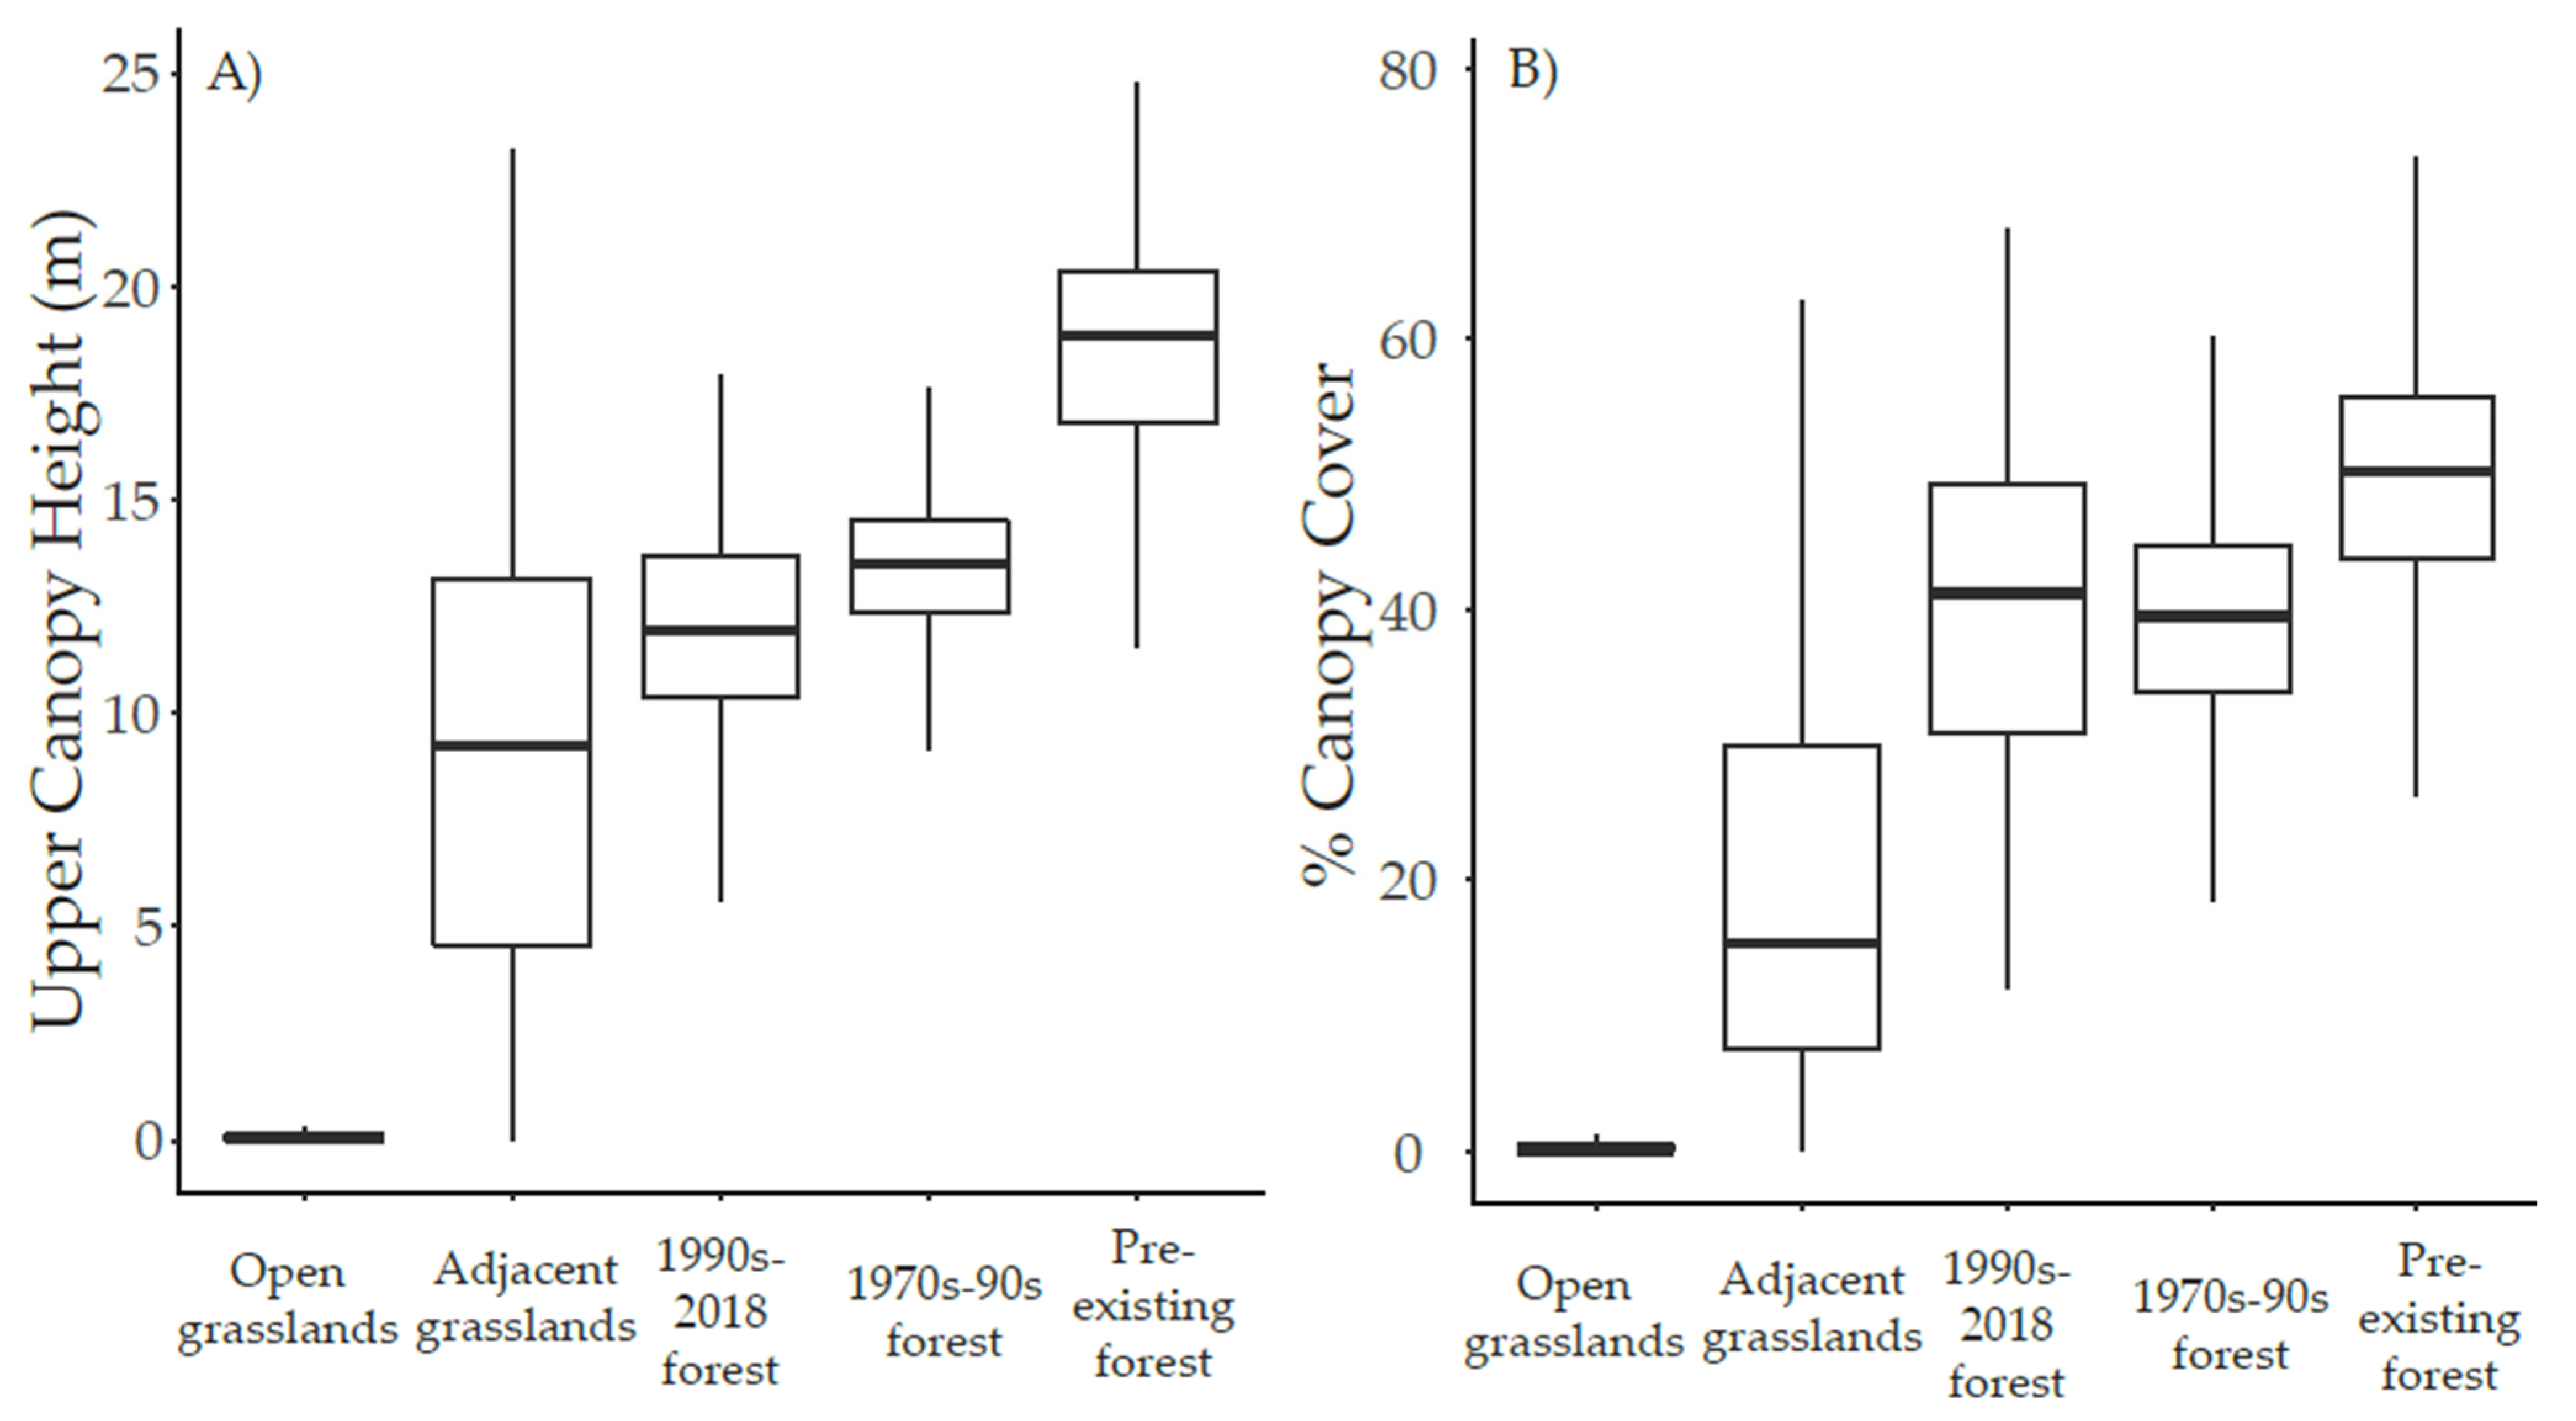
3.2. Canopy Height and Cover
3.3. Regeneration Establishment
4. Discussion
4.1. Forest Expansion and Growth
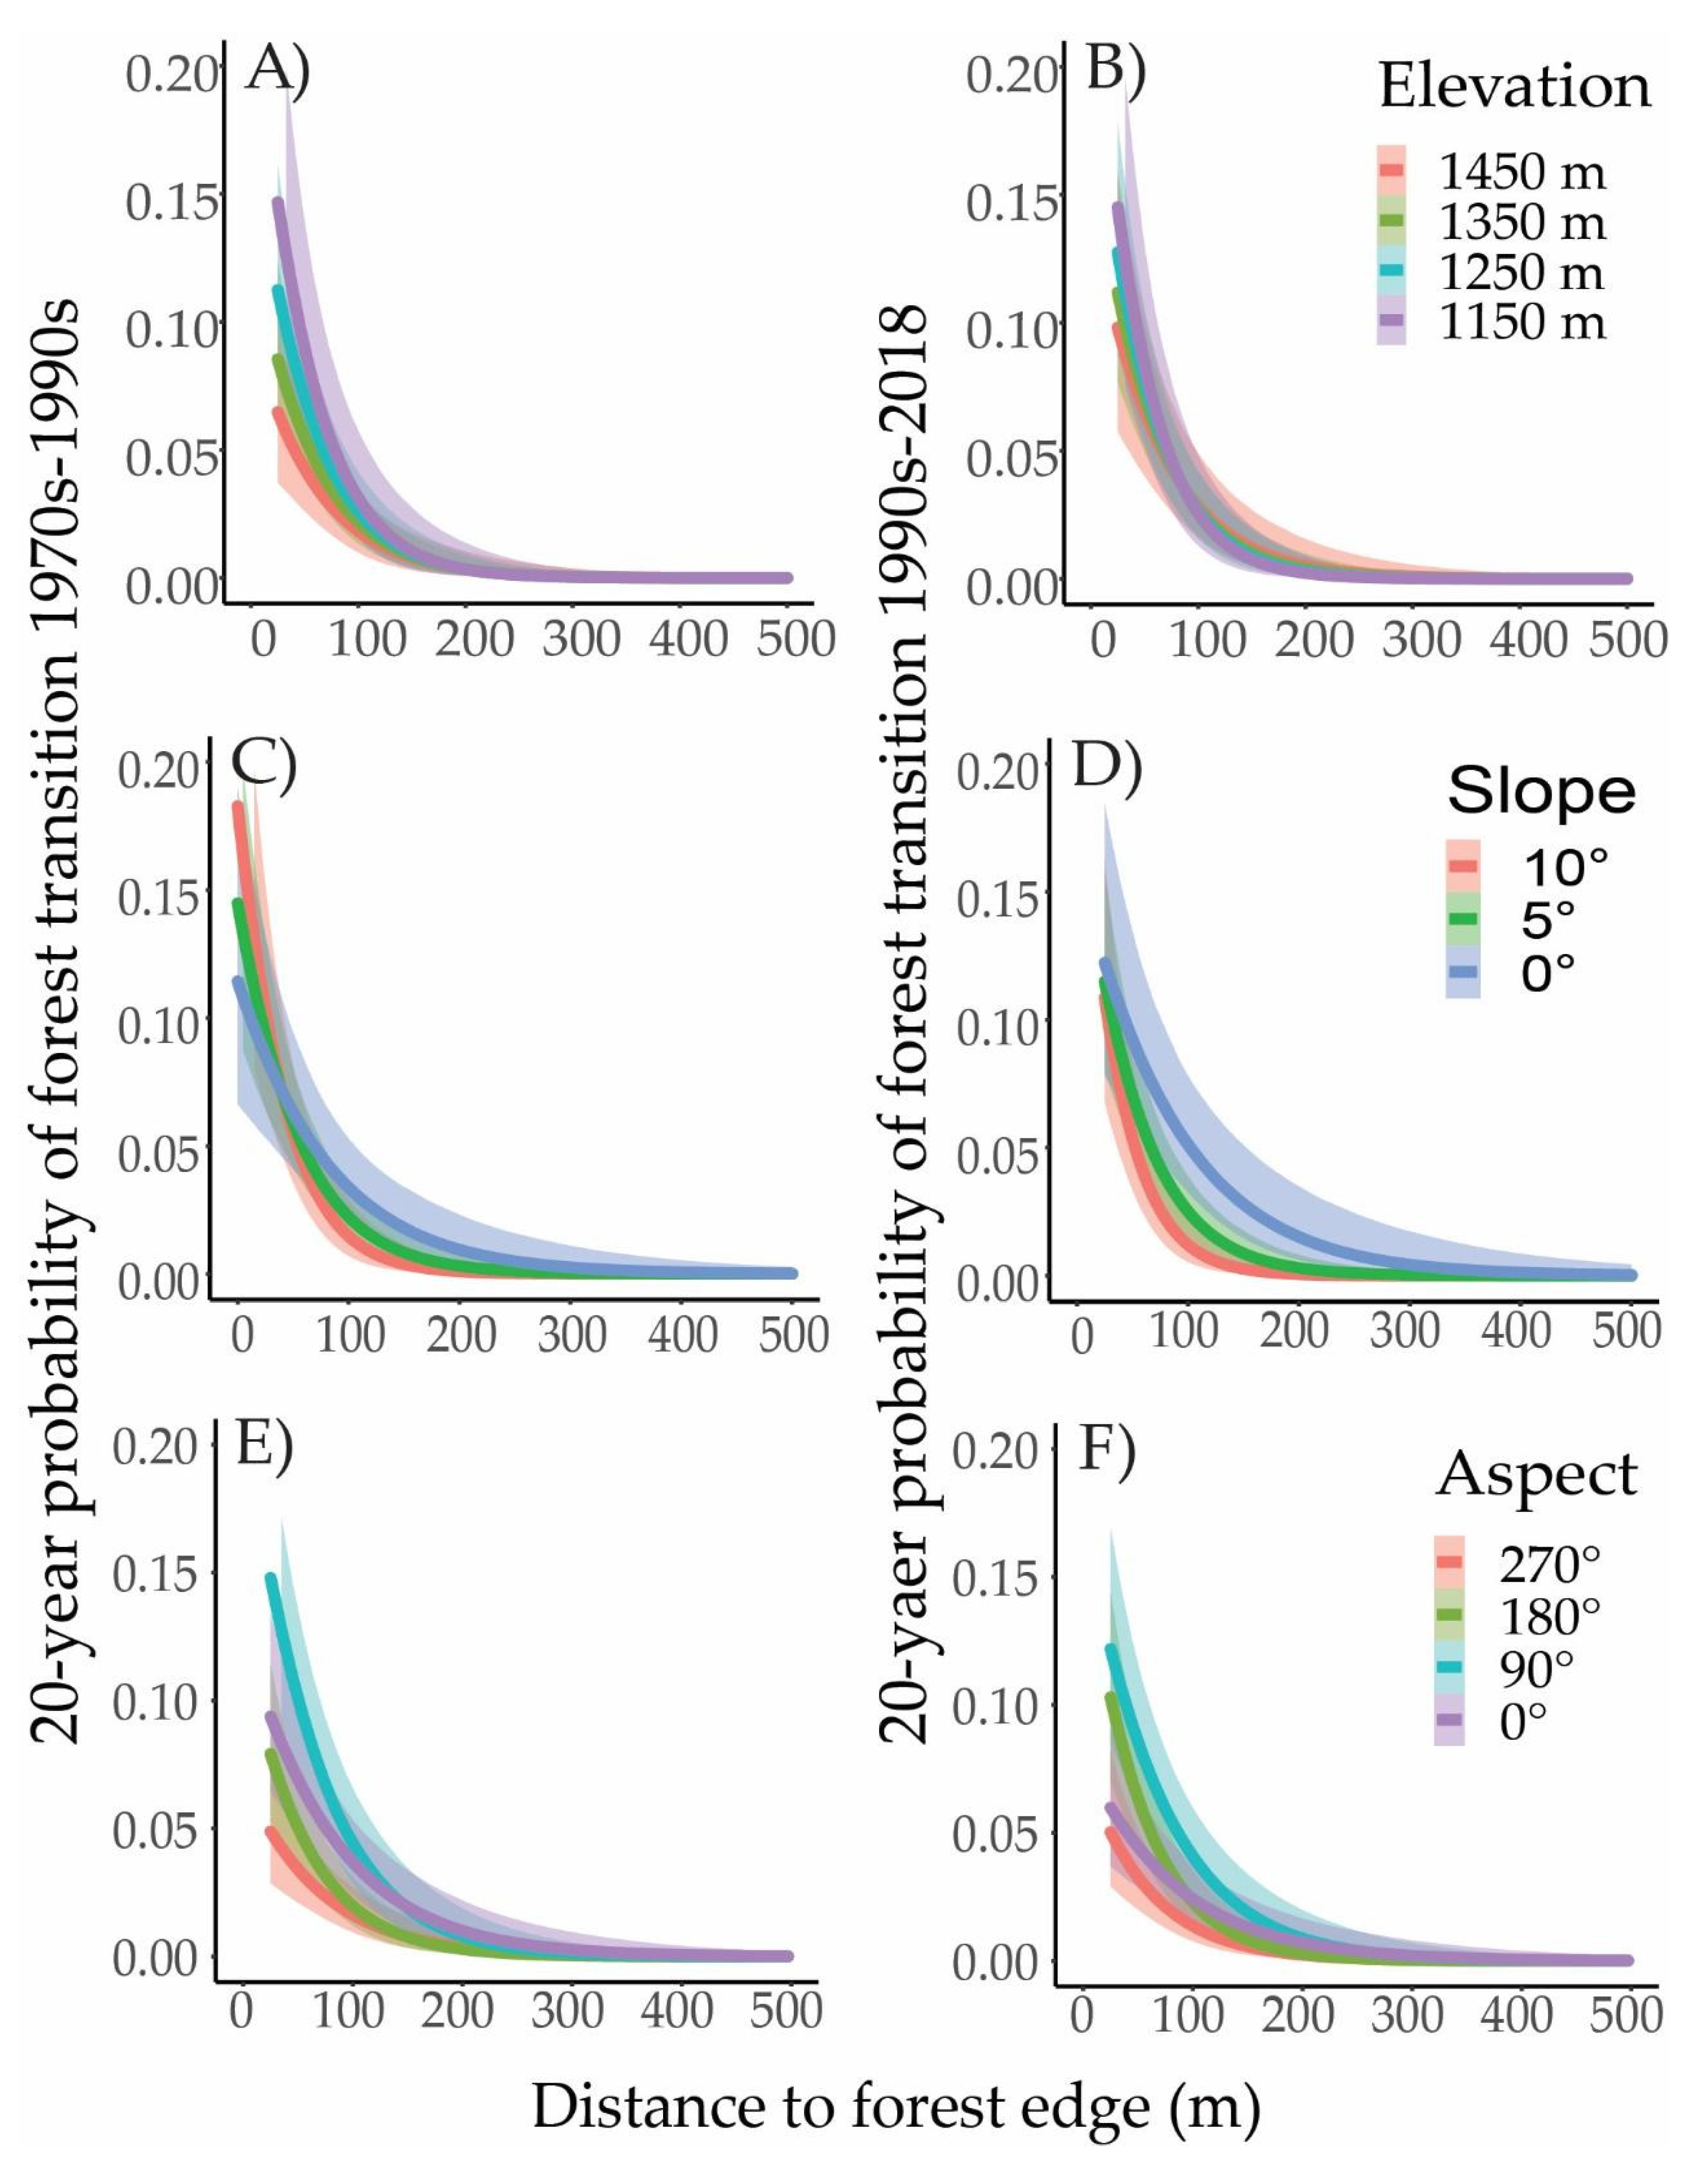
4.2. Spatial Patterns and Topographic Variation
4.3. Grazing
5. Conclusions
Supplementary Materials
Author Contributions
Funding
Institutional Review Board Statement
Informed Consent Statement
Data Availability Statement
Acknowledgments
Conflicts of Interest
References
- Améztegui, A.; Brotons, L.; Coll, L. Land-Use Changes as Major Drivers of Mountain Pine (Pinus Uncinata Ram.) Expansion in the Pyrenees. Glob. Ecol. Biogeogr. 2010, 19, 632–641. [Google Scholar] [CrossRef] [Green Version]
- Coop, J.D.; Givnish, T.J. Spatial and Temporal Patterns of Recent Forest Encroachment in Montane Grasslands of the Valles Caldera, New Mexico, USA. J. Biogeogr. 2007, 34, 914–927. [Google Scholar] [CrossRef]
- Kadmon, R.; Harari-Kremer, R. Studying Long-Term Vegetation Dynamics Using Digital Processing of Historical Aerial Photographs. Remote Sens. Environ. 1999, 68, 164–176. [Google Scholar] [CrossRef]
- Stevens, N.; Lehmann, C.E.R.; Murphy, B.P.; Durigan, G. Savanna Woody Encroachment Is Widespread across Three Continents. Glob. Chang. Biol. 2017, 23, 235–244. [Google Scholar] [CrossRef] [PubMed] [Green Version]
- Barger, N.N.; Archer, S.R.; Campbell, J.L.; Huang, C.; Morton, J.A.; Knapp, A.K. Woody Plant Proliferation in North American Drylands: A Synthesis of Impacts on Ecosystem Carbon Balance. J. Geophys. Res. Biogeosci. 2011, 116, G00K07. [Google Scholar] [CrossRef]
- Eldridge, D.J.; Bowker, M.A.; Maestre, F.T.; Roger, E.; Reynolds, J.F.; Whitford, W.G. Impacts of Shrub Encroachment on Ecosystem Structure and Functioning: Towards a Global Synthesis. Ecol. Lett. 2011, 14, 709–722. [Google Scholar] [CrossRef]
- Hoekstra, J.M.; Boucher, T.M.; Ricketts, T.H.; Roberts, C. Confronting a Biome Crisis: Global Disparities of Habitat Loss and Protection. Ecol. Lett. 2005, 8, 23–29. [Google Scholar] [CrossRef]
- King, A.W.; Dilling, L.; Zimmerman, G.P.; Fairman, D.M.; Houghton, R.A.; Marland, G.; Rose, A.Z.; Wilbanks, T.J. The First State of the Carbon Cycle Report (SOCCR): The North American Carbon Budget and Implications for the Global Carbon Cycle; U.S. Climate Change Science Program: Washington, DC, USA, 2007. [Google Scholar]
- Archer, S.R.; Andersen, E.M.; Predick, K.I.; Schwinning, S.; Steidl, R.J.; Woods, S.R. Woody Plant Encroachment: Causes and Consequences. In Rangeland Systems: Processes, Management and Challenges; Briske, D.D., Ed.; Springer Series on Environmental Management; Springer International Publishing: Cham, Switzerland, 2017; pp. 25–84. [Google Scholar]
- Sankaran, M.; Hanan, N.P.; Scholes, R.J.; Ratnam, J.; Augustine, D.J.; Cade, B.S.; Gignoux, J.; Higgins, S.I.; Le Roux, X.; Ludwig, F.; et al. Determinants of Woody Cover in African Savannas. Nature 2005, 438, 846–849. [Google Scholar] [CrossRef]
- Chhin, S.; Wang, G.G. Spatial and Temporal Pattern of White Spruce Regeneration within Mixed-Grass Prairie in the Spruce Woods Provincial Park of Manitoba. J. Biogeogr. 2002, 29, 903–912. [Google Scholar] [CrossRef]
- Chhin, S.; Wang, G.G. Growth of White Spruce, Picea Glauca, Seedlings in Relation to Microenvironmental Conditions in a Forest-Prairie Ecotone of Southwestern Manitoba. Can. Field-Nat. 2007, 121, 191–200. [Google Scholar] [CrossRef] [Green Version]
- Hogg, E.H.; Brandt, J.P.; Kochtubajda, B. Factors Affecting Interannual Variation in Growth of Western Canadian Aspen Forests during 1951–2000. Can. J. For. Res. 2005, 35, 610–622. [Google Scholar] [CrossRef]
- Fensham, R.J.; Fairfax, R.J.; Archer, S.R. Rainfall, Land Use and Woody Vegetation Cover Change in Semi-Arid Australian Savanna. J. Ecol. 2005, 93, 596–606. [Google Scholar] [CrossRef]
- Joshi, A.A.; Ratnam, J.; Sankaran, M. Frost Maintains Forests and Grasslands as Alternate States in a Montane Tropical Forest–Grassland Mosaic; but Alien Tree Invasion and Warming Can Disrupt This Balance. J. Ecol. 2020, 108, 122–132. [Google Scholar] [CrossRef]
- Kennedy, P.G.; Sousa, W.P. Forest Encroachment into a Californian Grassland: Examining the Simultaneous Effects of Facilitation and Competition on Tree Seedling Recruitment. Oecologia 2006, 148, 464–474. [Google Scholar] [CrossRef]
- Mast, J.N.; Veblen, T.T.; Hodgson, M.E. Tree Invasion within a Pine/Grassland Ecotone: An Approach with Historic Aerial Photography and GIS Modeling. For. Ecol. Manag. 1997, 93, 181–194. [Google Scholar] [CrossRef]
- Naito, A.T.; Cairns, D.M. Relationships between Arctic Shrub Dynamics and Topographically Derived Hydrologic Characteristics. Environ. Res. Lett. 2011, 6, 045506. [Google Scholar] [CrossRef]
- Wu, X.B.; Archer, S.R. Scale-Dependent Influence of Topography-Based Hydrologic Features on Patterns of Woody Plant Encroachment in Savanna Landscapes. Landsc. Ecol. 2005, 20, 733–742. [Google Scholar] [CrossRef]
- Belsky, A.J.; Amundson, R.G.; Duxbury, J.M.; Riha, S.J.; Ali, A.R.; Mwonga, S.M. The Effects of Trees on Their Physical, Chemical and Biological Environments in a Semi-Arid Savanna in Kenya. J. Appl. Ecol. 1989, 26, 1005–1024. [Google Scholar] [CrossRef]
- Coop, J.D.; Givnish, T.J. Constraints on Tree Seedling Establishment in Montane Grasslands of the Valles Caldera, New Mexico. Ecology 2008, 89, 1101–1111. [Google Scholar] [CrossRef] [PubMed] [Green Version]
- Griffiths, R.; Madritch, M.; Swanson, A. Conifer Invasion of Forest Meadows Transforms Soil Characteristics in the Pacific Northwest. For. Ecol. Manag. 2005, 208, 347–358. [Google Scholar] [CrossRef]
- Haugo, R.D.; Halpern, C.B. Tree Age and Tree Species Shape Positive and Negative Interactions in a Montane Meadow. Botany 2010, 88, 488–499. [Google Scholar] [CrossRef] [Green Version]
- Mast, J.N.; Veblen, T.T.; Linhart, Y.B. Disturbance and Climatic Influences on Age Structure of Ponderosa Pine at the Pine/Grassland Ecotone, Colorado Front Range. J. Biogeogr. 1998, 25, 743–755. [Google Scholar] [CrossRef]
- Bai, Y.; Broersma, K.; Thompson, D.; Ross, T.J. Landscape-Level Dynamics of Grassland-Forest Transitions in British Columbia. Rangel. Ecol. Manag. 2004, 57, 66–75. [Google Scholar] [CrossRef]
- Dunwiddie, P.W. Recent Tree Invasion of Subalpine Meadows in the Wind River Mountains, Wyoming. Arct. Alp. Res. 1977, 9, 393–399. [Google Scholar] [CrossRef]
- Ducherer, K.; Bai, Y.; Thompson, D.; Broersma, K. Dynamic Responses of a British Columbian Forest-Grassland Interface to Prescribed Burning. West. N. Am. Nat. 2009, 69, 75–87. [Google Scholar] [CrossRef]
- Hogg. Climate and the Southern Limit of the Western Canadian Boreal Forest. Can. J. For. Res. 1994, 24, 1835–1845. [Google Scholar] [CrossRef]
- Hogg, E.H.; Schwarz, A.G. Regeneration of Planted Conifers across Climatic Moisture Gradients on the Canadian Prairies: Implications for Distribution and Climate Change. J. Biogeogr. 1997, 24, 527–534. [Google Scholar] [CrossRef]
- Williams-Linera, G. Vegetation Structure and Environmental Conditions of Forest Edges in Panama. J. Ecol. 1990, 78, 356–373. [Google Scholar] [CrossRef]
- Chen, J.; Franklin, J.F.; Spies, T.A. Growing-Season Microclimatic Gradients from Clearcut Edges into Old-Growth Douglas-Fir Forests. Ecol. Appl. 1995, 5, 74–86. [Google Scholar] [CrossRef]
- Bergès, L.; Dupouey, J.-L. Historical Ecology and Ancient Forests: Progress, Conservation Issues and Scientific Prospects, with Some Examples from the French Case. J. Veg. Sci. 2021, 32, e12846. [Google Scholar] [CrossRef]
- Frenne, P.D.; Baeten, L.; Graae, B.J.; Brunet, J.; Wulf, M.; Orczewska, A.; Kolb, A.; Jansen, I.; Jamoneau, A.; Jacquemyn, H.; et al. Interregional Variation in the Floristic Recovery of Post-Agricultural Forests. J. Ecol. 2011, 99, 600–609. [Google Scholar] [CrossRef]
- Bekker, M.F. Positive Feedback between Tree Establishment and Patterns of Subalpine Forest Advancement, Glacier National Park, Montana, U.S.A. Arct. Antarct. Alp. Res. 2005, 37, 97–107. [Google Scholar] [CrossRef] [Green Version]
- Duarte, L.D.S.; Dos-Santos, M.M.G.; Hartz, S.M.; Pillar, V.D. Role of Nurse Plants in Araucaria Forest Expansion over Grassland in South Brazil. Austral Ecol. 2006, 31, 520–528. [Google Scholar] [CrossRef]
- Gartzia, M.; Alados, C.L.; Pérez-Cabello, F. Assessment of the Effects of Biophysical and Anthropogenic Factors on Woody Plant Encroachment in Dense and Sparse Mountain Grasslands Based on Remote Sensing Data. Prog. Phys. Geogr. Earth Environ. 2014, 38, 201–217. [Google Scholar] [CrossRef]
- Cienciala, E.; Mellander, P.-E.; Kučera, J.; Oplutilová, M.; Ottosson-Löfvenius, M.; Bishop, K. The Effect of a North-Facing Forest Edge on Tree Water Use in a Boreal Scots Pine Stand. Can. J. For. Res. 2002, 32, 693–702. [Google Scholar] [CrossRef]
- Fairweather, M.L.; Geils, B.W.; Manthei, M. Aspen Decline on the Coconino National Forest. In McWilliams Michael Palacios Patsy Comps. Proceedings of the 55th Annual Western International Forest Disease Work Conference, Sedona, AZ, USA, 15–19 October 2007; Oregon Department of Forestry: Salem, OR, USA, 2008; pp. 53–62. [Google Scholar]
- Stockdale, C.A.; Macdonald, S.E.; Higgs, E. Forest Closure and Encroachment at the Grassland Interface: A Century-Scale Analysis Using Oblique Repeat Photography. Ecosphere 2019, 10, e02774. [Google Scholar] [CrossRef]
- Fuhlendorf, S.D.; Engle, D.M. Application of the Fire–Grazing Interaction to Restore a Shifting Mosaic on Tallgrass Prairie. J. Appl. Ecol. 2004, 41, 604–614. [Google Scholar] [CrossRef]
- Wilcox, B.P.; Birt, A.; Fuhlendorf, S.D.; Archer, S.R. Emerging Frameworks for Understanding and Mitigating Woody Plant Encroachment in Grassy Biomes. Curr. Opin. Environ. Sustain. 2018, 32, 46–52. [Google Scholar] [CrossRef]
- Bird, R.D. Ecology of the Aspen Parkland of Western Canada in Relation to Land Use. Public Dep. Agric. Can. 1961, 1066, 5–155. [Google Scholar]
- Campbell, C.; Campbell, I.D.; Blyth, C.B.; McAndrews, J.H. Bison Extirpation May Have Caused Aspen Expansion in Western Canada. Ecography 1994, 17, 360–362. [Google Scholar] [CrossRef]
- Briggs, J.M.; Hoch, G.A.; Johnson, L.C. Assessing the Rate, Mechanisms, and Consequences of the Conversion of Tallgrass Prairie to Juniperus Virginiana Forest. Ecosystems 2002, 5, 578–586. [Google Scholar] [CrossRef]
- Soulé, P.T.; Knapp, P.A.; Grissino-Mayer, H.D. Comparative Rates of Western Juniper Afforestation in South-Central Oregon and the Role of Anthropogenic Disturbance. Prof. Geogr. 2003, 55, 43–55. [Google Scholar]
- Sankey, T.T.; Montagne, C.; Graumlich, L.; Lawrence, R.; Nielsen, J. Twentieth Century Forest–Grassland Ecotone Shift in Montana under Differing Livestock Grazing Pressure. For. Ecol. Manag. 2006, 234, 282–292. [Google Scholar] [CrossRef] [Green Version]
- Browning, D.M.; Archer, S.R. Protection from Livestock Fails to Deter Shrub Proliferation in a Desert Landscape with a History of Heavy Grazing. Ecol. Appl. 2011, 21, 1629–1642. [Google Scholar] [CrossRef]
- Environment and Climate Change Canada. Canadian Climate Normals 1981–2010 Station Data—Climate—Environment and Climate Change Canada. Available online: https://climate.weather.gc.ca/climate_normals/results_1981_2010_e.html?searchType=stnName&txtStationName=cypress+hills&searchMethod=contains&txtCentralLatMin=0&txtCentralLatSec=0&txtCentralLongMin=0&txtCentralLongSec=0&stnID=3085&dispBack=1 (accessed on 9 May 2021).
- Government of Alberta. Cypress Hills Interprovincial Park Managment Plan. Available online: https://www.albertaparks.ca/media/6493245/cypress-hills-pp-mp_june-2011.pdf (accessed on 8 September 2021).
- Sauchyn, D.J. A Reconstruction of Holocene Geomorphology and Climate, Western Cypress Hills, Alberta and Saskatchewan. Can. J. Earth Sci. 1990, 27, 1504–1510. [Google Scholar] [CrossRef]
- Natural Resources Canada; Treasury Board of Canada Secretariat. Canadian Digital Elevation Model, 1945–2011—Open Government Portal. Available online: https://open.canada.ca/data/en/dataset/7f245e4d-76c2-4caa-951a-45d1d2051333 (accessed on 9 September 2021).
- Roussel, J.-R.; Auty, D.; Coops, N.C.; Tompalski, P.; Goodbody, T.R.H.; Meador, A.S.; Bourdon, J.F.; de Boissieu, F.; Achim, A. lidR_ An R Package for Analysis of Airborne Laser Scanning (ALS) Data | Elsevier Enhanced Reader. Available online: https://reader.elsevier.com/reader/sd/pii/S0034425720304314?token=C6FB4713088DE5874DB6DDC24746B202791F87F89F4C1E4A501D0F73E817ADBC529B815D0BDE5200C77B7F16BF2E698E&originRegion=us-east-1&originCreation=20210909031859 (accessed on 8 September 2021).
- Widenmaier, K.J.; Strong, W. Tree and Forest Encroachment into Fescue Grasslands on the Cypress Hills Plateau, Southeast Alberta, Canada. For. Ecol. Manag. 2010, 259, 1870–1879. [Google Scholar] [CrossRef]
- Browning, D.M.; Archer, S.R.; Asner, G.P.; McClaran, M.P.; Wessman, C.A. Woody Plants in Grasslands: Post-Encroachment Stand Dynamics. Ecol. Appl. 2008, 18, 928–944. [Google Scholar] [CrossRef]
- McClaran, M.P. A Century of Vegetation Change on the Santa Rita Experimental Range; Rocky Mountain Research Station: Ogden, UT, USA, 2003. [Google Scholar]
- Bond, W.J.; Midgley, G.F. A Proposed CO2-Controlled Mechanism of Woody Plant Invasion in Grasslands and Savannas. Glob. Chang. Biol. 2000, 6, 865–869. [Google Scholar] [CrossRef]
- Buitenwerf, R.; Bond, W.J.; Stevens, N.; Trollope, W.S.W. Increased Tree Densities in South African Savannas: >50 Years of Data Suggests CO2 as a Driver. Glob. Chang. Biol. 2012, 18, 675–684. [Google Scholar] [CrossRef]
- Greene, D.F.; Zasada, J.C.; Sirois, L.; Kneeshaw, D.; Morin, H.; Charron, I.; Simard, M.J. A Review of the Regeneration Dynamics of North American Boreal Forest Tree Species. Can. J. For. Res. 1999, 29, 824–839. [Google Scholar] [CrossRef]
- Gutsell, S.L.; Johnson, E.A. Accurately Ageing Trees and Examining Their Height-Growth Rates: Implications for Interpreting Forest Dynamics. J. Ecol. 2002, 90, 153–166. [Google Scholar] [CrossRef] [Green Version]
- D’Odorico, P.; Fuentes, J.D.; Pockman, W.T.; Collins, S.L.; He, Y.; Medeiros, J.S.; DeWekker, S.; Litvak, M.E. Positive Feedback between Microclimate and Shrub Encroachment in the Northern Chihuahuan Desert. Ecosphere 2010, 1, art17. [Google Scholar] [CrossRef]
- Carlson, D. Microclimate of Clear-Cut, Forest Interior, and Small Openings in Trembling Aspen Forest. Agric. For. Meteorol. 1997, 87, 313–329. [Google Scholar] [CrossRef]
- Man, R.; Lieffers, V.J. Seasonal Photosynthetic Responses to Light and Temperature in White Spruce (Picea Glauca) Seedlings Planted under an Aspen (Populus Tremuloides) Canopy and in the Open. Tree Physiol. 1997, 17, 437–444. [Google Scholar] [CrossRef]
- Chhin, S.; Wang, G.G. Climatic Sensitivity of a Mixed Forest Association of White Spruce and Trembling Aspen at Their Southern Range Limit. Forests 2016, 7, 235. [Google Scholar] [CrossRef] [Green Version]
- Plumb, G.E.; Dodd, J.L. Foraging Ecology of Bison and Cattle on a Mixed Prairie: Implications for Natural Area Management. Ecol. Appl. 1993, 3, 631–643. [Google Scholar] [CrossRef]
- Bork, E.W.; Carlyle, C.N.; Cahill, J.F.; Haddow, R.E.; Hudson, R.J. Disentangling Herbivore Impacts on Populus Tremuloides: A Comparison of Native Ungulates and Cattle in Canada’s Aspen Parkland. Oecologia 2013, 173, 895–904. [Google Scholar] [CrossRef]
- Madany, M.H.; West, N.E. Livestock Grazing-Fire Regime Interactions within Montane Forests of Zion National Park, Utah. Ecology 1983, 64, 661–667. [Google Scholar] [CrossRef]

| Acquisition Year | Province | Number of Photos or Tiles | Scale * | Color | Resolution (m) | Georeferencing Error ** | Source *** |
|---|---|---|---|---|---|---|---|
| 1976 | Alberta | 77 | 1:12,000 | Monochromatic | 0.27 | 2.55 | AAPRS |
| 1998 | Alberta | 20 | 1:30,000 | Monochromatic | 0.66 | 3.28 | AAPRS |
| 2018 | Alberta | 12 | N/A | Red, green, blue | 0.25 | 0.00 | TRS |
| 1979 | Saskatchewan | 4 | 1:20,000 | Monochromatic | 1.70 | 6.1 | SMPCS |
| 1991 | Saskatchewan | 42 | 1:21,000 | Monochromatic | 0.87 | 3.83 | SMPCS |
| 2018 | Saskatchewan | 6 | N/A | Red, green, blue | 0.3 | 0.00 | SMPCS |
| Aerial Photographs | Airborne Laser Scanning | Transects | |
|---|---|---|---|
| Response variables |
|
|
|
| Base model predictors | Distance to closest forest edge | Intercept only | Distance to forest edge (second-order polynomial) |
| Additional predictors | Elevation, slope, aspect | Elevation, slope, aspect | Elevation, slope, aspect, grazing |
| Random effects | None | None | Site-level intercept and distance effect |
| Response distribution | Bernoulli | Gaussian | Negative Binomial |
| Link function | Logit, with adjustment for time interval length 1 | Identity | Log |
| Sample size | 1. 2919; 2. 2686 | 1.4: 353; 2.5: 179; 3.6: 1242 | 1800 |
| Land Cover Change Models for Time Interval 1 | Land Cover Change Models for Time Interval 2 | ||||
|---|---|---|---|---|---|
| Model | ΔLOO | SE | Model | ΔLOO | SE |
| 6) Base model × (1 + E + EA + NA) | 0 | 0 | 9) Base model × (1 + E + S + EA + NA) | 0 | 0 |
| 9) Base model × (1 + E + S + EA + NA) | −0.7 | 2.0 | 7) Base model × (1 + S + EA + NA) | −0.5 | 1.5 |
| 10) Base model × (1 + E + S × EA + S × NA) | −1.0 | 2.6 | 10) Base model × (1 + E + S × EA + S × NA) | −1.6 | 0.6 |
| 7) Base model × (1 + S + EA + NA) | −1.3 | 3.0 | 8) Base model × (1 + S × EA + S × NA) | −1.8 | 1.5 |
| 8) Base model × (1 + S × EA + S × NA) | −2.0 | 3.4 | 6) Base model × (1 + E + EA + NA) | −3.8 | 2.3 |
| Forests Established in Time Interval 1 (1970s–1990s) | |||||||
| Height | Cover | ||||||
| Model * | ΔLOO | SE | Bayesian R2 | Model | ΔLOO | SE | Bayesian R2 |
| 3) Base model × (1 + S) | 0.0 | 0.0 | 0.47 | 3) Base model × (1 + S) | 0.0 | 0.0 | 0.27 |
| 5) Base model × (1 + E + S) | −1.4 | 0.3 | 0.49 | 7) Base model × (1 + S + EA + NA) | −0.2 | 1.8 | 0.41 |
| 8) Base model × (1 + S × EA + S × NA) | −1.7 | 2.0 | 0.68 | 5) Base model × (1 + E + S) | −1.0 | 0.8 | 0.31 |
| 7) Base model × (1 + S + EA + NA) | −1.7 | 0.5 | 0.53 | 9) Base model × (1 + E + S + EA + NA) | −1.1 | 2.2 | 0.46 |
| 9) Base model × (1 + E + S + EA + NA) | −3.2 | 0.7 | 0.55 | 8) Base model × (1 + S × EA + S × NA) | −1.9 | 2.1 | 0.49 |
| Forests established in time interval 2 (1990s–2018) | |||||||
| Height | Cover | ||||||
| Model | ΔLOO | SE | Bayesian R2 | Model | ΔLOO | SE | Bayesian R2 |
| 2) Base model × (1 + E) | 0.0 | 0.0 | 0.13 | 6) Base model × (1 + E + EA + NA) | 0.0 | 0.0 | 0.20 |
| 5) Base model × (1 + E + S) | −1.0 | 0.3 | 0.13 | 9) Base model × (1 + E + S + EA + NA) | −0.8 | 0.3 | 0.21 |
| 6) Base model × (1 + E + EA + NA) | −1.7 | 0.9 | 0.14 | 10) Base model × (1 + E + S × EA + S × NA) | −0.9 | 1.9 | 0.23 |
| 9) Base model × (1 + E + S + EA + NA) | −2.8 | 0.9 | 0.14 | 2) Base model × (1 + E) | −1.5 | 2.6 | 0.17 |
| 10) Base model × (1 + E + S × EA + S × NA) | −3.4 | 1.8 | 0.16 | 5) Base model × (1 + E + S) | −2.4 | 2.6 | 0.17 |
| Grasslands within 50 m of the forest edge | |||||||
| Height | Cover | ||||||
| Model | ΔLOO | SE | Bayesian R2 | Model | ΔLOO | SE | Bayesian R2 |
| 8) Base model × (1 + S × EA + S × NA) | 0.0 | 0.0 | 0.03 | 10) Base model × (1 + E + S × EA + S × NA) | 0.0 | 0.0 | 0.04 |
| 10) Base model × (1 + E + S × EA + S × NA) | −0.8 | 0.3 | 0.03 | 8) Base model × (1 + S × EA + S × NA) | −0.6 | 1.8 | 0.03 |
| 7) Base model × (1 + S + EA + NA) | −1.1 | 2.5 | 0.02 | 9) Base model × (1 + E + S + EA + NA) | −3.6 | 3.1 | 0.03 |
| 9) Base model × (1 + E + S + EA + NA) | −2.0 | 2.5 | 0.02 | 7) Base model × (1 + S + EA + NA) | −4.5 | 3.6 | 0.02 |
| 3) Base model × (1 + S) | −3.9 | 4.2 | 0.01 | 5) Base model × (1 + E + S) | −6.9 | 4.8 | 0.02 |
| White Spruce | Trembling Aspen | Lodgepole Pine | ||||||
|---|---|---|---|---|---|---|---|---|
| Model | ΔLOO | SE | Model | ΔLOO | SE | Model | ΔLOO | SE |
| 10) Base model × (1 + E + S × EA + S × NA) | 0.0 | 0.0 | 9) Base model × (1 + E + S + EA + NA) | 0.0 | 0.0 | 16) Base model × (1 + E + EA + NA) + G | 0.0 | 0.0 |
| 18) Base model × (1 + E + S + EA + NA) + G | 0.0 | 1.5 | 10) Base model × (1 + E + S × EA + S × NA) | −0.1 | 1.0 | 18) Base model × (1 + E + S + EA + NA) + G | 0.0 | 0.9 |
| 9) Base model × (1 + E + S + EA + NA) | −0.3 | 1.4 | 15) Base model × (1 + E + S) + G | −0.6 | 1.0 | 6) Base model × (1 + E + EA + NA) | −0.3 | 1.3 |
| 20) Base model × (1 + E + S × EA + S × NA) + G | −0.4 | 0.9 | 16) Base model × (1 + E + EA + NA) + G | −0.6 | 1.5 | 9) Base model × (1 + E + S + EA + NA) | −1.0 | 1.6 |
| 8) Base model × (1 + S × EA + S × NA) | −1.6 | 1.9 | 20) Base model × (1 + E + S × EA + S × NA) + G | −0.7 | 1.3 | 15) Base model × (1 + E + S) + G | −1.0 | 2.8 |
Publisher’s Note: MDPI stays neutral with regard to jurisdictional claims in published maps and institutional affiliations. |
© 2021 by the authors. Licensee MDPI, Basel, Switzerland. This article is an open access article distributed under the terms and conditions of the Creative Commons Attribution (CC BY) license (https://creativecommons.org/licenses/by/4.0/).
Share and Cite
Robinov, L.; Hopkinson, C.; Vanderwel, M.C. Topographic Variation in Forest Expansion Processes across a Mosaic Landscape in Western Canada. Land 2021, 10, 1355. https://doi.org/10.3390/land10121355
Robinov L, Hopkinson C, Vanderwel MC. Topographic Variation in Forest Expansion Processes across a Mosaic Landscape in Western Canada. Land. 2021; 10(12):1355. https://doi.org/10.3390/land10121355
Chicago/Turabian StyleRobinov, Larissa, Chris Hopkinson, and Mark C. Vanderwel. 2021. "Topographic Variation in Forest Expansion Processes across a Mosaic Landscape in Western Canada" Land 10, no. 12: 1355. https://doi.org/10.3390/land10121355
APA StyleRobinov, L., Hopkinson, C., & Vanderwel, M. C. (2021). Topographic Variation in Forest Expansion Processes across a Mosaic Landscape in Western Canada. Land, 10(12), 1355. https://doi.org/10.3390/land10121355