Article

Integrating Climate Change Adaptation and Mitigation into Land Use Optimization: A Case Study in Huailai County, China

1
School of Civil Engineering, Shandong Jiaotong University, Jinan 250023, China
2
College of Geography and Environment, Shandong Normal University, Jinan 250014, China
*
Author to whom correspondence should be addressed.
Land 2021, 10(12), 1297; https://doi.org/10.3390/land10121297
Submission received: 29 September 2021 / Revised: 13 November 2021 / Accepted: 23 November 2021 / Published: 25 November 2021
(This article belongs to the Special Issue Land Use Optimisation)

Abstract

:
Land use plays a crucial role in climate change adaptation and mitigation, as the reasonable design of land use distribution can positively impact these things. Therefore, research interest in climate change adaptation and mitigation strategies in land use and management has been growing. However, the adaptation and mitigation strategies have been handled separately at different dimensions and spatial levels. In this study, we presented a modeling framework for land use optimization that integrates climate change adaptation and mitigation, developed the model, and then applied it to Huailai County, wherein environmental and socioeconomic conditions are sensitive to climate change. The regional land use optimization model was combined with a linear programming model and a modified cellular automata model. Subsequently, the climate change adaptation and mitigation constraints, including ecological water demand, spatial suitability, and carbon sequestration, were incorporated into the model. The results indicate that most regions in the study area could adapt to and mitigate climate change with a constant land use pattern, and the land use conversion region under different climate change scenarios was primarily located in the topography transition region. The optimization results also reveal trade-offs between climate change adaptation and mitigation that were manifested with an increase in carbon sequestration and ecological water demand accompanied by decreases in the net income of agricultural production. Thus, it is necessary to simultaneously incorporate climate change adaptation and mitigation into land use optimization and management, and the proposed model provides a feasible method to incorporate them and balance their trade-offs in land use pattern optimization at a regional scale.

1. Introduction

Climate change is widely considered one of the greatest challenges to modern human civilization that has profound socio-economic and environmental impacts [1,2,3]. The general solution to minimize the negative impacts of climate change on humans and ecosystems can be categorized as climate change adaptation and mitigation [4]. Adaptation involves reducing costs by changing conditions and exploiting opportunities, mitigation involves reducing greenhouse gas (GHG) emission and mitigating future climate change [5,6].
Reasonable land use/cover management can play a positive role in climate change adaptation and mitigation [7]. Climate change adaptation and mitigation strategies for land use constitute key scientific foci for climate change sciences and land use sciences [8,9]. For adaptation, effective land use/cover management strategies can enhance the adaptive capacity and reduce vulnerability to the negative effects due to climate change (e.g., drought stress and water scarcity) [10,11]. For mitigation, land use and land cover change (LUCC) can be treated as a major source of GHG emissions [12,13]. Therefore, enhancing the function of land-based carbon sinks would be an effective climate change mitigation strategy.
Integrated climate change mitigation and adaptation studies which handle the topics of regional land use/cover management are scarce, because the corresponding measures, such as objectives, scope, time dimension, and collaboration levels are different [6]. Moreover, complex trade-off or synergy relationships are observed between climate change adaptation and mitigation in some ecosystem sectors, which often focus on agricultural and forestry ecosystems [4,14,15,16,17,18]. These complex and uncertain relationships indicate that it is necessary to integrate climate change adaptation and mitigation into sustainable land use/cover management [19]. On the other hand, previous studies are primarily based on theoretical argument or qualitative evaluation [20,21,22], and only a few quantitative analyses are focused on an experiment plot or simple ecosystem or landscape [18,23]. Thus, conducting an empirical study on climate change adaptation and mitigation strategies in land use/cover management is necessary.
A typical rural mountain–basin watershed located in the agro-pastoral transitional zone (APTZ) of North China has been selected as the study area. First, transitional zone biomes and ecosystems are particularly sensitive to changing climatic conditions [24]. The APTZ of North China is one of the world’s largest ecotones. Previous studies have revealed that the rate of increase in annual mean temperature in the study area exceeds the national average level, and climate change significantly affects the reservoir and grain yield in the study area [25,26]. Second, the rural areas are most directly linked to ecosystems, and the mountain rural areas often have a large proportion of agricultural, forest and other ecosystems, which are sensitive to climate change [9,24,25]. The study area of this research is Huailai County, which is a typical rural mountain–basin watershed located in the APTZ of North China. The cultivated land, garden land, woodland and shrub/grassland account for 89% of the total land area, and 70.10% of the total population represent an agricultural population. The environmental and socioeconomic conditions are sensitive to climate change. Thus, it is necessary to conduct an empirical study on climate change adaptation and mitigation strategies in land use and management in this region.
This study proposes a new model framework to integrate climate change adaptation and mitigation into future land use optimization. The major objectives are as follows: (1) establishing a regional land use optimization model that integrates climate change adaptation and mitigation in the study area; (2) analyzing the efficiency of the model to cope with climate change and proposing suggestions on land use in response to climate change; (3) discussing the general climate change adaptation and mitigation strategies for future land use/cover management.

2. Materials and Methods

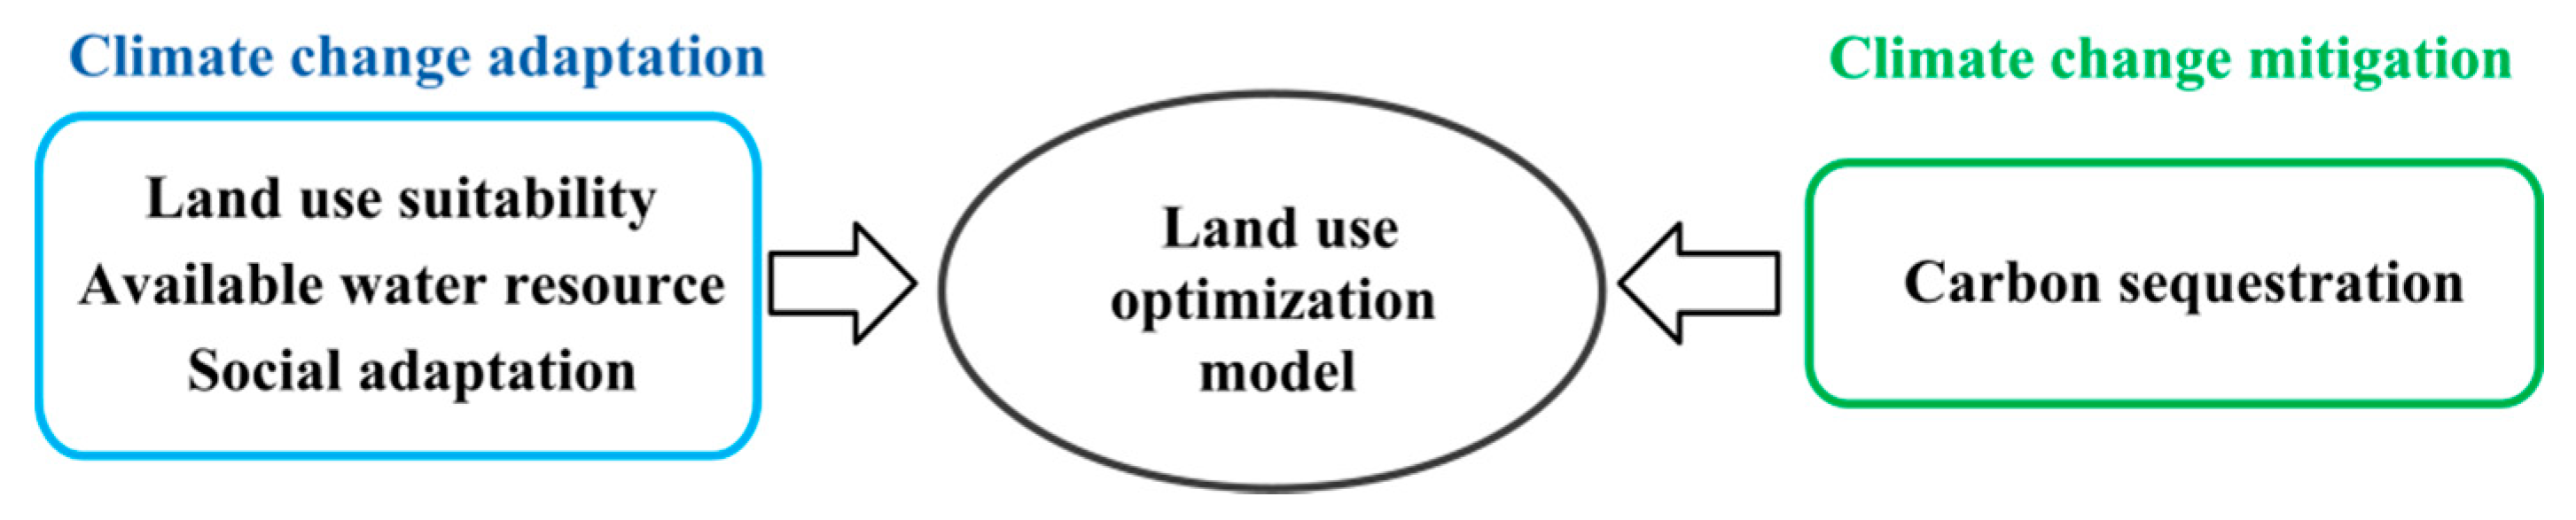
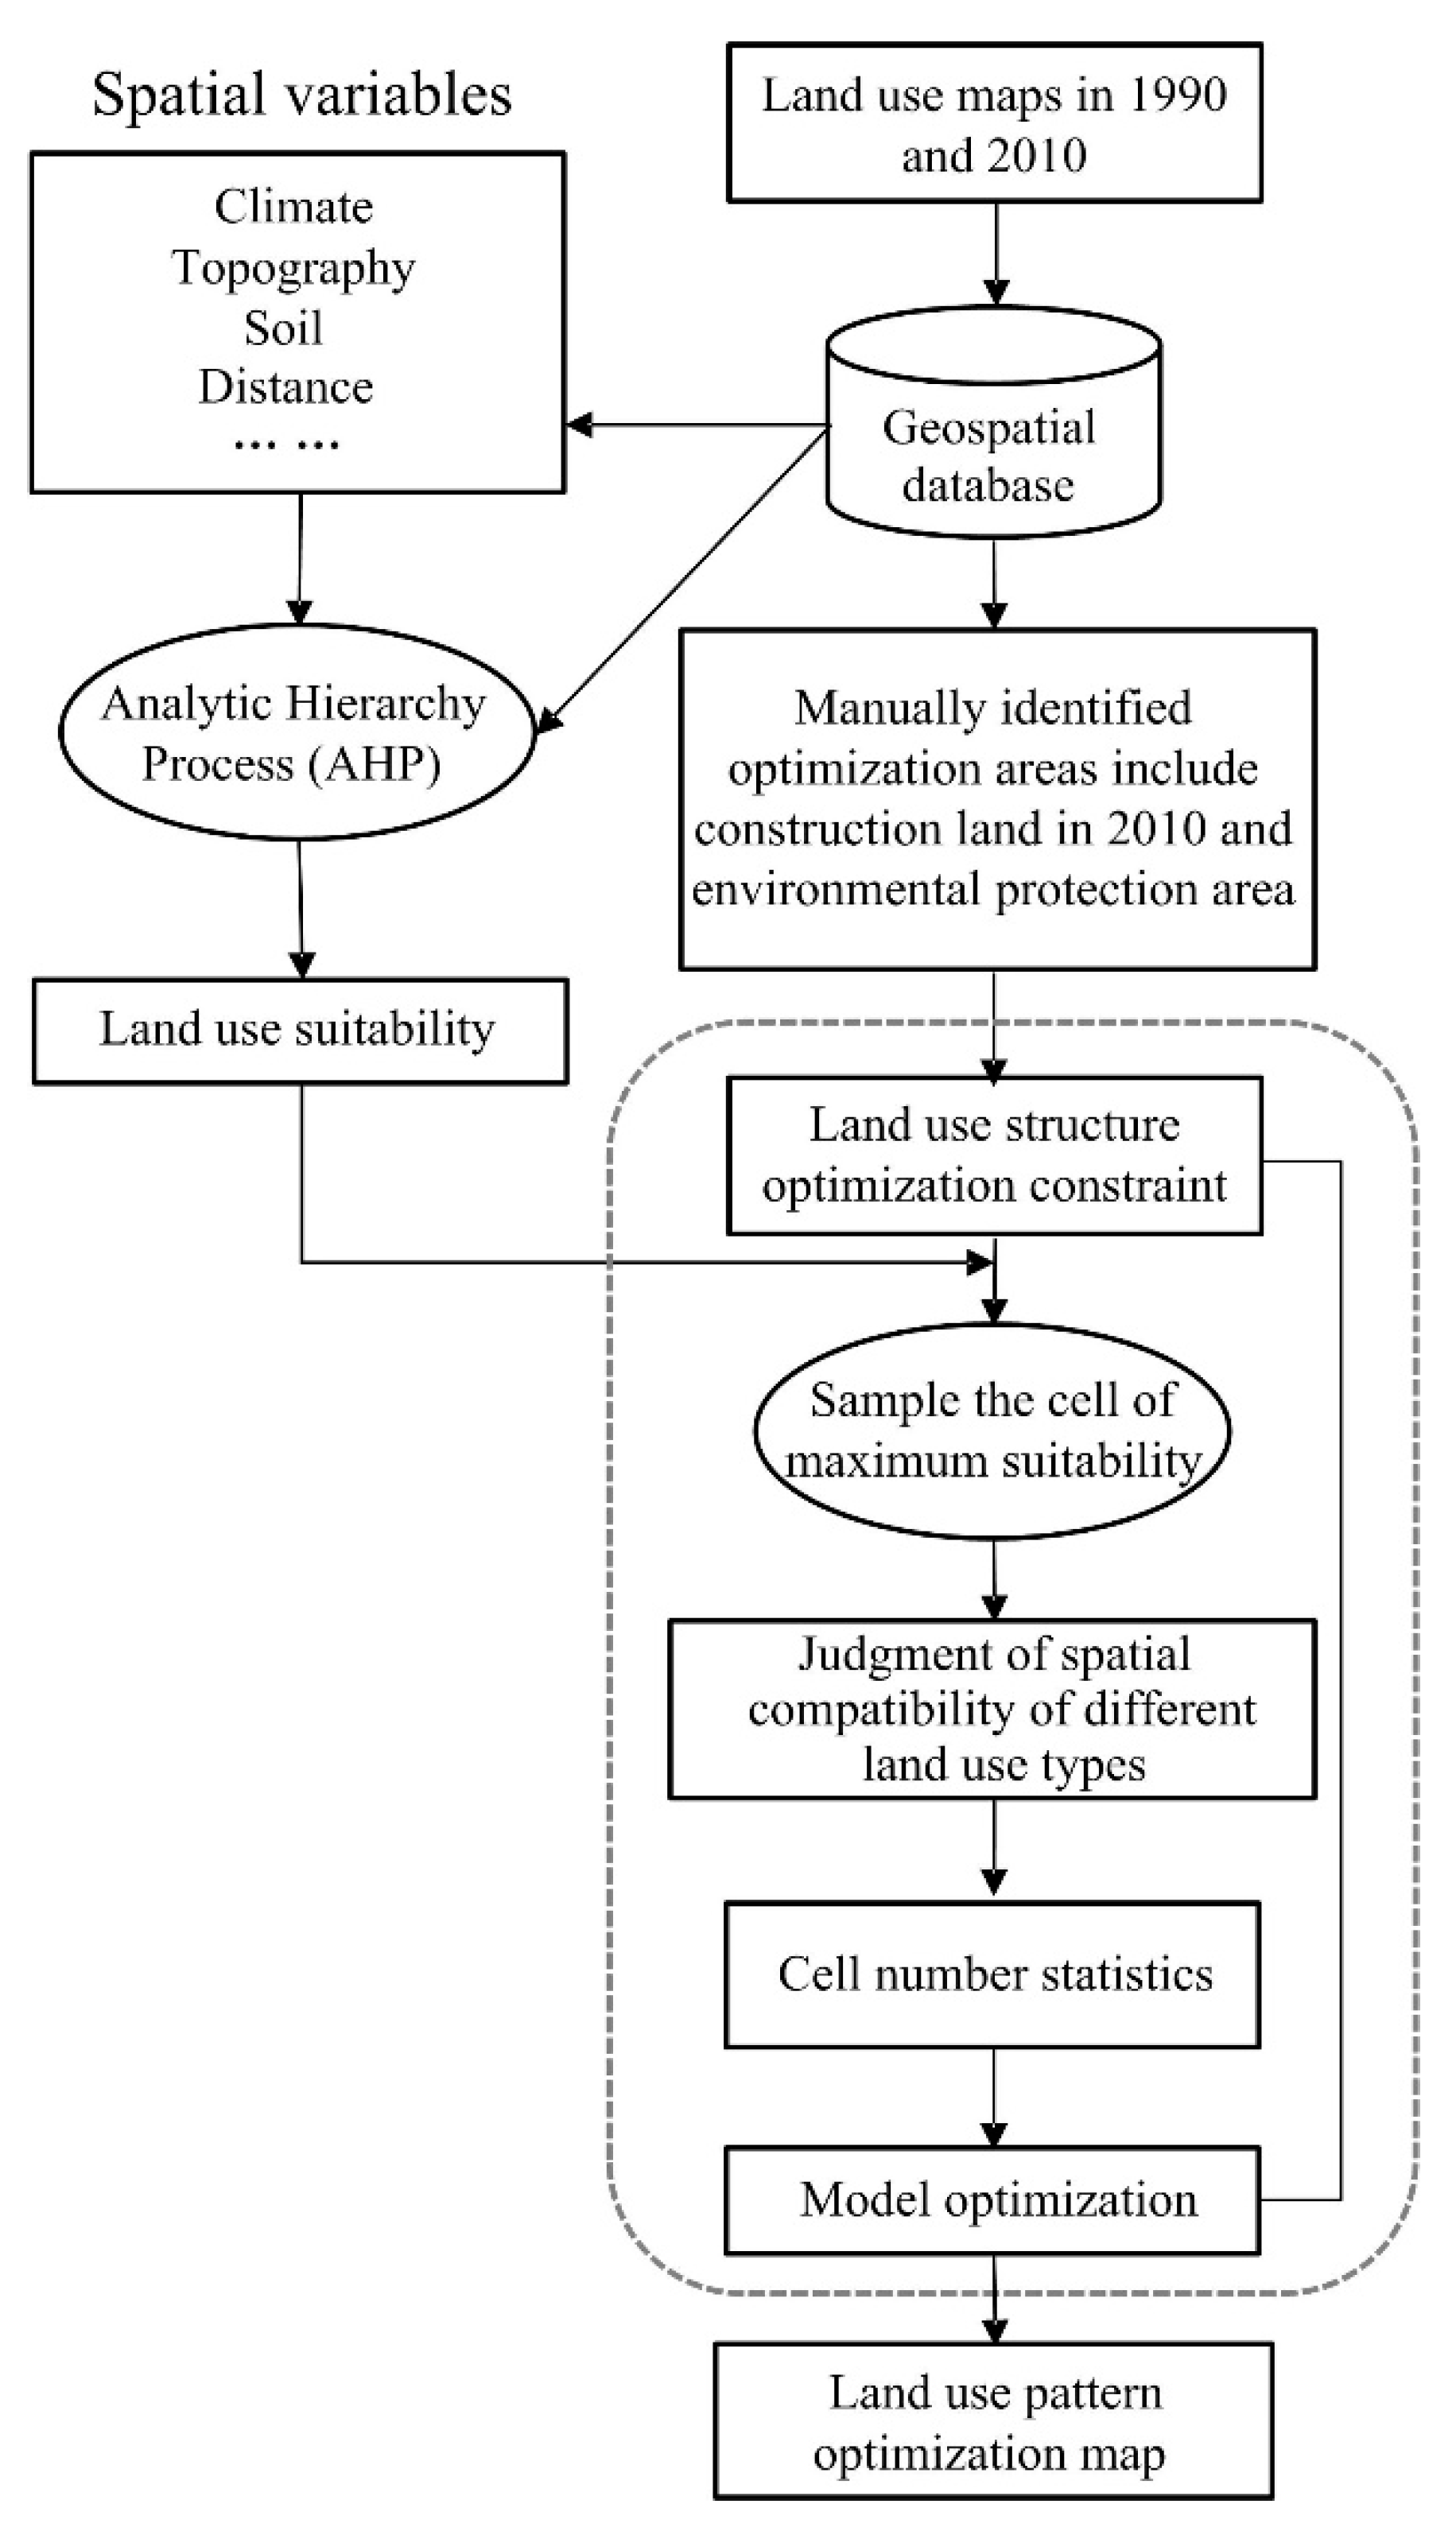
2.1. Modelling Framework
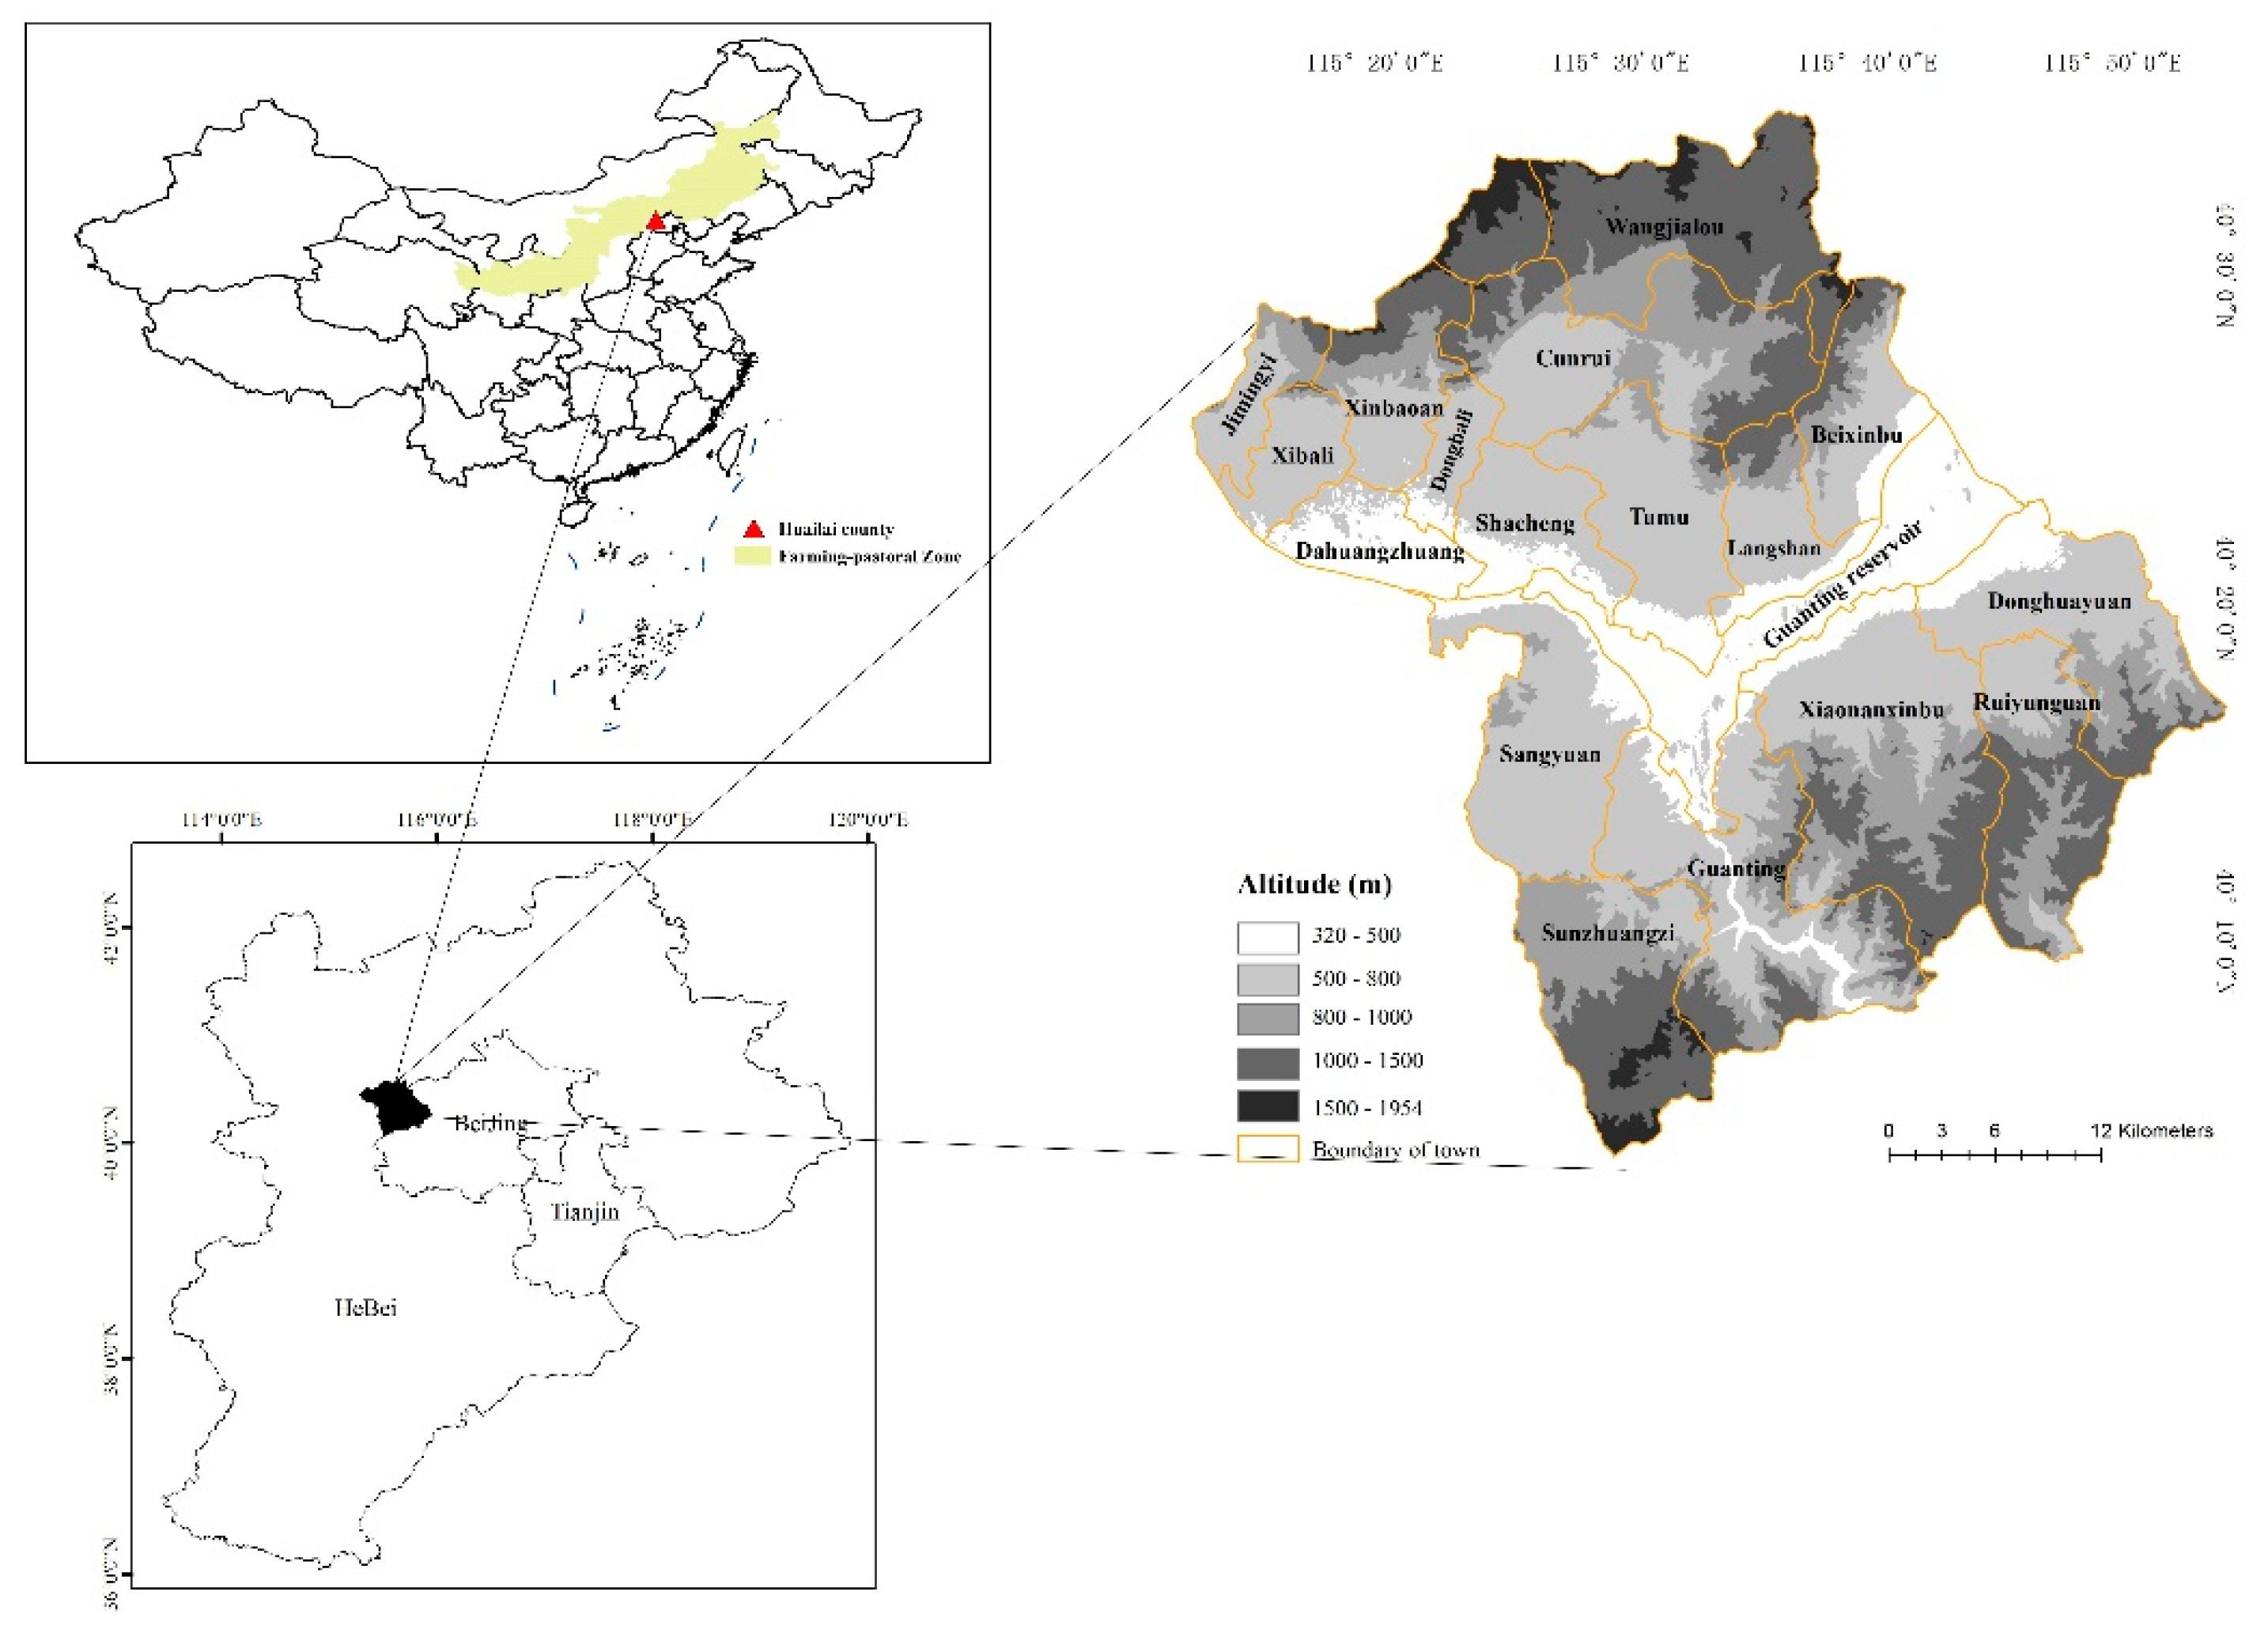
In this study, we proposed a regional land use optimization model that could represent the optimized land use structure and spatial pattern required to adapt and mitigate different climate change scenarios. This model incorporated two types of constraint factors, that is, the climate change adaptation and mitigation constraints (Figure 1). We adopted the linear programming (LP) and modified cellular automata (CA) algorithm for the optimization of land use. The LP algorithm was used to optimize the quantitative structure of different land use types, and the modified CA algorithm was applied to rearrange the spatial locations (pattern) of land use patches in the study area. In the model, the constraints for climate change adaptation primarily involved the suitability of land use, available water resources and social adaptation; the mitigation constraints specifically included the carbon sequestration of regional land use.

2.2. Study Area

The study area (Huailai County) is located in the southeast of APTZ of Northern China (115°16′–115°58′ E, 40°04′–40°35′ N) and covers an area of 178,701 ha (Figure 2). It is dominated by a temperate semi-arid continental monsoonal climate, with an average annual precipitation of 409.61 mm in growth season (April to October) and mean annual temperature of 19.43 °C. The study area includes cultivated land, garden land, woodland, shrub/grassland, water, and construction land. Huailai County has recently been experiencing drastic LUCC, which along with climate change, has seriously affected the local ecosystem services of this area, such as grain yield and reservoir capacity [18]. Therefore, conducting this study in this region is important.

2.3. Climate Change Scenarios

According to the emission scenarios proposed by IPCC, our study designed three different climate change scenarios (A2, A1B, and B1) for land use optimization (Table 1). The 2050 climate change prediction results for different emission scenarios were obtained from the Climate Wizard Webtool (http://www.climatewizard.org/, accessed on 25 February 2021). Scenario A2 represented an extreme hot and drought climate condition, with an average temperature of 23.06 °C, and total precipitation of 373.57 mm in the growing season; scenario A1B represented moderate high temperature and drought climate condition, with an average temperature of 22.94 °C, and total precipitation of 390.0 mm in the growing season; scenario B1 represented a warm and humid climate condition, with an average temperature of 20.94 °C. and total precipitation of 458.33 mm in the growing season.

2.4. Data Collection

The data used in the study includes the land use map and meteorological data of 1990 and 2010, vegetation index and net primary productivity (NPP) dataset, digital elevation model (DEM), soil types, and properties map.
The land use maps of Huailai County in 1990 and 2010 were obtained from the Landsat images (30 m spatial resolution). The MODIS-NDVI and NPP datasets in 1990 and 2010 were obtained to identify ecological function hot areas. Additional details about remote sensing image data are listed in Table 2.
The meteorological datasets in 1990 and 2010 were obtained for seven weather stations located in and around Huailai County, from the China Meteorological Data Sharing Service System (http://www.geodata.cn/, accessed on 20 May 2021). The datasets included the observation data of temperature, precipitation, and solar radiation. Then, the kriging interpolation method was used to generate the spatial data of these meteorological data.
The DEM data (30 m spatial resolution) were obtained from the Geospatial Data Website (http://www.gscloud.cn/, accessed on 20 May 2021). Spatial soil data were derived from the second General Soil Survey of Huailai County, and it comprised soil information, such as soil type, texture, nitrogen content, and organic matter content. All the spatial data were resampled to 30 m × 30 m resolution.
In addition, socio-economic statistical data, such as population, agricultural product yield and price, were primarily obtained from Huailai Statistics Yearbook of Social and Economics.

2.5. Modeling Parameterizations of Climate Change Adaptation and Mitigation

2.5.1. Carbon Sequestration

Land use and management change represent a major source of GHG emissions as reported by the United Nations Intergovernmental Panel on Climate Change [12]. Golub et al. have estimated that one third of anthropogenic carbon emissions since 1850 are attributable to land use change [13], and the IPCC pointed out that enhancing the land carbon sinks through adjusting land use patterns and management seems to be an effective plan [28]. Therefore, we used the regional carbon storage of land use as a proxy for carbon sequestration and climate change mitigation. It is the product of carbon density and area of different land use types. The carbon sequestration due to land use is contributed by vegetation carbon density and soil carbon density. The vegetation carbon density was estimated from the net primary productivity (NPP) by the Carnegie Ames Stanford Approach (CASA) model [29]. The soil carbon density of different land use types was surveyed and determined based on the soil organic carbon (SOC) content of surface soil (40 cm) [30,31]. The calculated vegetation and soil carbon density of different land use in the study area are listed in Table 3.
The regional carbon sequestration constraint was calculated using the following equation:
m a x 1 = 19.84 X 1 + 27.53 X 2 + 51.29 X 3 + 42.41 X 4
where max1 is the maximum value of regional total carbon storage of land use, X1, X2, X3 and X4 are the area (ha) of cultivated land, garden land, woodland, and shrub/grassland, respectively; 19.84, 27.53, 51.29, and 42.41 denote the carbon density (sum of vegetation and soil carbon density) of each type of land use (t/ha).

2.5.2. Social Adaptation

The important aspect of social adaptation to climate change involves improving farmers’ incomes and livelihoods to reduce social vulnerability [9]. Thus, we established a net income target function as the regional social adaptation function:
m a x 2 = 11,403.47 X 1 + 29,177.68 X 2 + 906.74 X 3 + 4201.00 X 4
where max2 is maximum value of the net income of regional cultivated land, garden land, woodland, and shrub/grassland; and X1, X2, X3, and X4 are the same as in Formula (1). The constant represents the per unit area economic benefit of different land use types which were obtained from social and economic statistical data.

2.5.3. Available Water Resources

To minimize the negative impacts of limited water resources, and to adapt to drought, we calculated the ecological water demand of cultivated land, garden land, woodland, and shrub/grassland using the ecological modeling approach. The available water resources constraints are as follows:
A 2 :   ( 0.24 X 1 + 0.26 X 2 + 0.42 X 3 + 0.28 X 4 ) × 10 4 4.64 × 10 8 A 1 B :   ( 0.24 X 1 + 0.26 X 2 + 0.42 X 3 + 0.28 X 4 ) × 10 4 4.84 × 10 8 B 1 :   ( 0.24 X 1 + 0.26 X 2 + 0.42 X 3 + 0.28 X 4 ) × 10 4 5.53 × 10 8
where X1, X2, X3, and X4 are the same as those in Formula (1); the constant represents the water demand per unit area of four land use types (mm/ha). The quantitative results correspond to mean water demand statistical results of different land use types in 1990 and 2010. According to the results of Zhao [32] Huang, Yu [33], and Allen, Walter [34] the available ecological water of the study area under A2, A1B, and B1 scenarios were set as 4.64 × 10⁸ m3, 4.84 × 10⁸ m3, and 5.53 × 10⁸ m3, respectively.

2.5.4. Land Use Suitability

In this study, the land use suitability evaluation was conducted to identify the areas that were suitable for specific land use in future climate change scenarios. The suitability of cultivated land, garden land, woodland, and shrub/grassland was evaluated based on climate, topography, soil, and social factors (Table 4). Construction land was evaluated based on topography and distance factors (Table 5).
To determine the climatic factor suitability score of agricultural land, the study established the grain and fruit yield estimation equation to assign cultivated land and garden land score and examined the relationship between vegetation NPP and climate index (ombrothermic) for woodland and grassland. Based on the collected meteorological and yield statistical data, the grain and fruit yield were fitted via the least square method, the estimation equation was ygrain = 1.316 + e0.011x and yfruit = 0.002x2 − 0.478x + 28.351, where x denotes the ombrothermic index from June to September (calculation equation shown in Table 4), and R2 values of the equations correspond to 0.49 and 0.62, respectively. We then predicted the grain and fruit yield of different climate change scenarios in 2050 based on the yield established suitability score, and the results are presented in Table 4. Based on the corresponding relationship between NPP and ombrothermic index, we determined the climate factor suitability score of woodland and grassland. The zones with an ombrothermic index in the range of 220–240 exhibited the highest NPP and corresponded to the most suitable zone for forests and grass growth, and the suitability score was 3. The zones with an ombrothermic index less than 210 exhibited the lowest NPP and were marginally suitable for woodland and grassland, and the suitability score was 1. The other zone was generally suitable for woodland and grassland, and the suitability score was 2.
The suitability scores of all factors were determined by consulting with a team of experts. In the evaluation process, each evaluation factor was divided into different classes, and a scale from 0 to 3 (0 = not suitable, 1 = marginally suitable, 2 = moderately suitable, and 3 = highly suitable) was used to assess the suitability of different classes (Table 4 and Table 5). The weights of four agricultural land evaluation factors were determined via the analytic hierarchy process (AHP) [35,36]. The weight results of all factors are listed in Table 6.
The land use suitability evaluation results of cultivated land, garden land, woodland, and shrub/grassland are shown in Figure 3. The suitability results suggested that from scenarios A2 to A1B and B1 with the climate becoming wetter, the cultivated land gradually occupied the plain and expanded to the hills, the garden land extended to the low altitude plain, and the woodland and shrub/grassland suitability region expanded to the hills.

2.6. Modeling for Land Use Optimization

2.6.1. Land Use Structure Optimization

The land use structure optimization formula comprised the target function and constraint conditions. The target function was formed by maximum carbon sequestration (Formula (1)) and social adaptation (Formula (2)). We normalized the coefficients of each formula and established diverse weights for the two formulas in different scenarios. In A2 and A1B scenarios (extreme and moderate high temperature and drought scenarios), the weight of the normalized carbon sequestration formula was 0.6, and the social adaptation formula was 0.4. In scenario B1 (the warm and humid scenario), these normalized formulas were given equal weight.
The constraint conditions primarily depended on three aspects: available water resources (Formula (3)), land use constraints which are consistent with CO2 emission background (Table 1), and land use optimization suggestions. The study established constraint conditions for six variables as follows:
The first constraint condition was established as follows:
X 1 + X 2 + X 3 + X 4 + X 5 + X 6 = 178,701
where X1, X2, X3, and X4 are the same as in Formula (1), and X5 denotes area of water, and X6 denotes the area of construction land.
Subsequently, the following constraint conditions were established based on the development background of different emission and climate change scenarios (Table 1).
(1)
We established the constraint condition of cultivated land based on the population and food demand. In the A2 and A1B scenarios (high population growth), population was predicted as 427,574 in 2050; in the B1 scenario (slower growth rate), the population was predicted as 397,400 in 2050. Then we used the nutritional index reference (400 kg per capital every year as proposed by Food and Agriculture Organization of the United Nations) to calculate the minimum food demand of different scenarios. Finally, based on the cultivated land yield we obtained the minimum demand of cultivated land as follows:
A 2 :   X 1 35,124 A 1 B :   X 1 35,124 B 1 :   X 1 32,645
(2)
Based on the development description of different scenarios (Table 1), we proposed that the increase rate of construction land for A2, A1B, and B1 scenarios were 2%, 1.5%, and 1.0%, respectively. The constraint conditions are then established as follows:
A 2 :   X 6 = 20,272 A 1 B :   X 6 = 16,654 B 1 :   X 6 = 13,669
(3)
The environmental protection policies were different between the three scenarios; B1 scenarios increasingly focused on environmental protection although A2 and A1B scenarios ignored these. Based on the above environmental protection background, we established the woodland, shrub/grassland, and water constraint conditions.
We extracted woodland (29,764.05 ha) and shrub/grassland (12,509.7 ha) preserved under A2 and A1B scenarios that are located in the high ecosystem function sub–basins; woodland (37,718.86 ha) and shrub/grassland (29,903.71 ha) preserved under B1 scenarios were located in the high and medium ecosystem function sub-basins. Hence, the constraint conditions can be established as follows:
A 2 :   X 3 29,764.05     X 4 12,509.7 A 1 B :   X 3 29,764.05     X 4 12,509.7 B 1 :   X 3 37,718.86     X 4 29,903.71
Subsequently, we proposed the water protection constraint conditions as follows: A2 and A1B scenarios preserved the water area in 2010 (8539 ha), and B1 scenario recovered to the range observed in 1990 (13,346 ha). The constraint conditions can be expressed as follows:
A 2 :   X 5 = 8539 A 1 B :   X 5 = 8539 B 1 :   X 5 = 13,346
Finally, the following two constraint conditions were constructed considering the land use optimization and management suggestions of study area.
(1)
Based on numerous agroecological parameters, Zhang and Tang developed landscape pattern optimization research in the study area and proposed that cultivated land, garden land, and shrub/grassland should be located at the valley plain and low hilly areas [41]. Statistical results indicated that the total area of the region is 132,843 ha. Considering that construction land and water area were also primarily distributed in this region, we deducted these areas and obtained the area of cultivated land, garden land, and shrub/grassland located at the valley plain and low hilly areas. The constraint conditions can be expressed as follows:
A 2 :   X 1 + X 2 + X 4 104,032 A 1 B :   X 1 + X 2 + X 4 107,650 B 1 :   X 1 + X 2 + X 4 105,828
(2)
Zhong proposed that the garden land of the study area should not exceed 43,335 ha based on the water consumption analysis [42], and thus, the constraint condition can be established as follows:
X 2 4335
The optimized land use structure was determined using LINGO 10.0 software.

2.6.2. Land Use Pattern Optimization

To integrate with adaptation and mitigation strategies in climate change, the general land use pattern optimization procedure was determined and shown in Figure 4. The land use pattern optimization processes considered three basic criteria: (i) the constraint of land use area; (ii) land use suitability of different climate scenarios; (iii) judgment of neighborhood conditions. The land use area constraint was obtained from the land use structure optimization result (Section 2.6.1), and the land use suitability was from the land use suitability evaluation (Section 2.5.4). These data were used as input data to implement land use area judgment and the highest land use suitability cell selection in optimization processes. The land use optimization procedures were executed in terms of the land use in the order of woodland, construction land, cultivated land, garden land and shrub/grassland. The optimization procedure of the next one begins when the area of former land use exceeds the land use structure optimization result. The awaited optimized cell was selected based on the land use suitability result of different scenarios, with highest land use suitability.
In this study, the land use pattern optimization method is based on a modified CA algorithm, and it is also semi-automatic, which allows users to manually identify some optimization areas [43]. The CA algorithm is defined as a discrete spatial-temporal dynamic systems based on local rules and often includes four elements [44]. The elements of the modified CA algorithm are as follows: (i) the extent or grid data of land use/cover, (ii) a 5 × 5 kernel for neighborhood analysis, (iii) the manually identified optimization areas include construction land in 2010 and the spatial data of environmental protection areas (woodland, shrub/grassland and water environmental protection area in Section 2.6.1) as the initial states and input data, and (iv) neighborhood condition judgment rules.
The land use allocation should consider the neighborhood conditions which represent the interrelationship among surrounding land use types. We used compatibility matrix and cell statistics to express the neighborhood conditions.
(1)
Compatibility matrix. The value of spatial compatibility corresponds to 0 or 1 where 1 denotes the compatibility between the neighboring two land use types (generally adjacent to each other), and 0 denotes no compatibility (generally isolated from each other).
(2)
Cell number statistics. The rule of surrounding land use requires that the number of the cell belonging to optimized land use should exceed that of the other land use types.
When the cell met the requirements of neighborhood conditions, the cell value 0 was changed into explicit land use types.

3. Results

3.1. Land Use Structure Optimization Result

Table 7 presents the land use structure of 2010 and optimization result of future scenarios. The land use structure optimization results show that woodland and garden land constituted the major land use types under future scenarios; the area of the two land use types corresponded to 91,244.5 ha under A2 scenario, 98,592.07 ha under A1B scenario, and 89,137.29 ha under B1 scenario, and this accounted for 51.1, 55.2, and 49.9% of the study area, respectively.
Then, we compared the land use structure optimization results with those of 2010 and observed general land use optimization as follows: the area of shrub/grassland decreased while the cultivated land, construction land, garden land and woodland increased. Woodland is an important carbon sink land use type, and afforestation is beneficial to mitigate future climate change. The garden land exhibited higher profit, and the increased cultivation area aided in increasing the social adaptation capacity of the study area. In addition, under the warm and humid scenario (B1), shrub/grassland decreased the least, the extreme, drier and hotter scenarios (A2) exhibited a medium decrease, and the medium drier and hotter scenario (A1B) exhibited a high decrease.
Table 7 also presents the optimization efficiency of the proposed model in future scenarios. The results indicate that the adaptation and mitigation efficiency of optimized land use significantly changed. The net income of land use optimization results increased by approximately 0.15 × 10⁵ million compared with 2010. The carbon sequestration and ecological water demand of the optimization result decreased when compared with 2010. Furthermore, we compared the optimization results of future scenarios and observed only a low difference in adaptation and mitigation efficiency between the different climate change scenarios. This also demonstrated that rational adjustment of land use structure and its spatial pattern effectively decrease the effects of future climate change and maximize the climate change adaptation and mitigation efficiency of the land system.

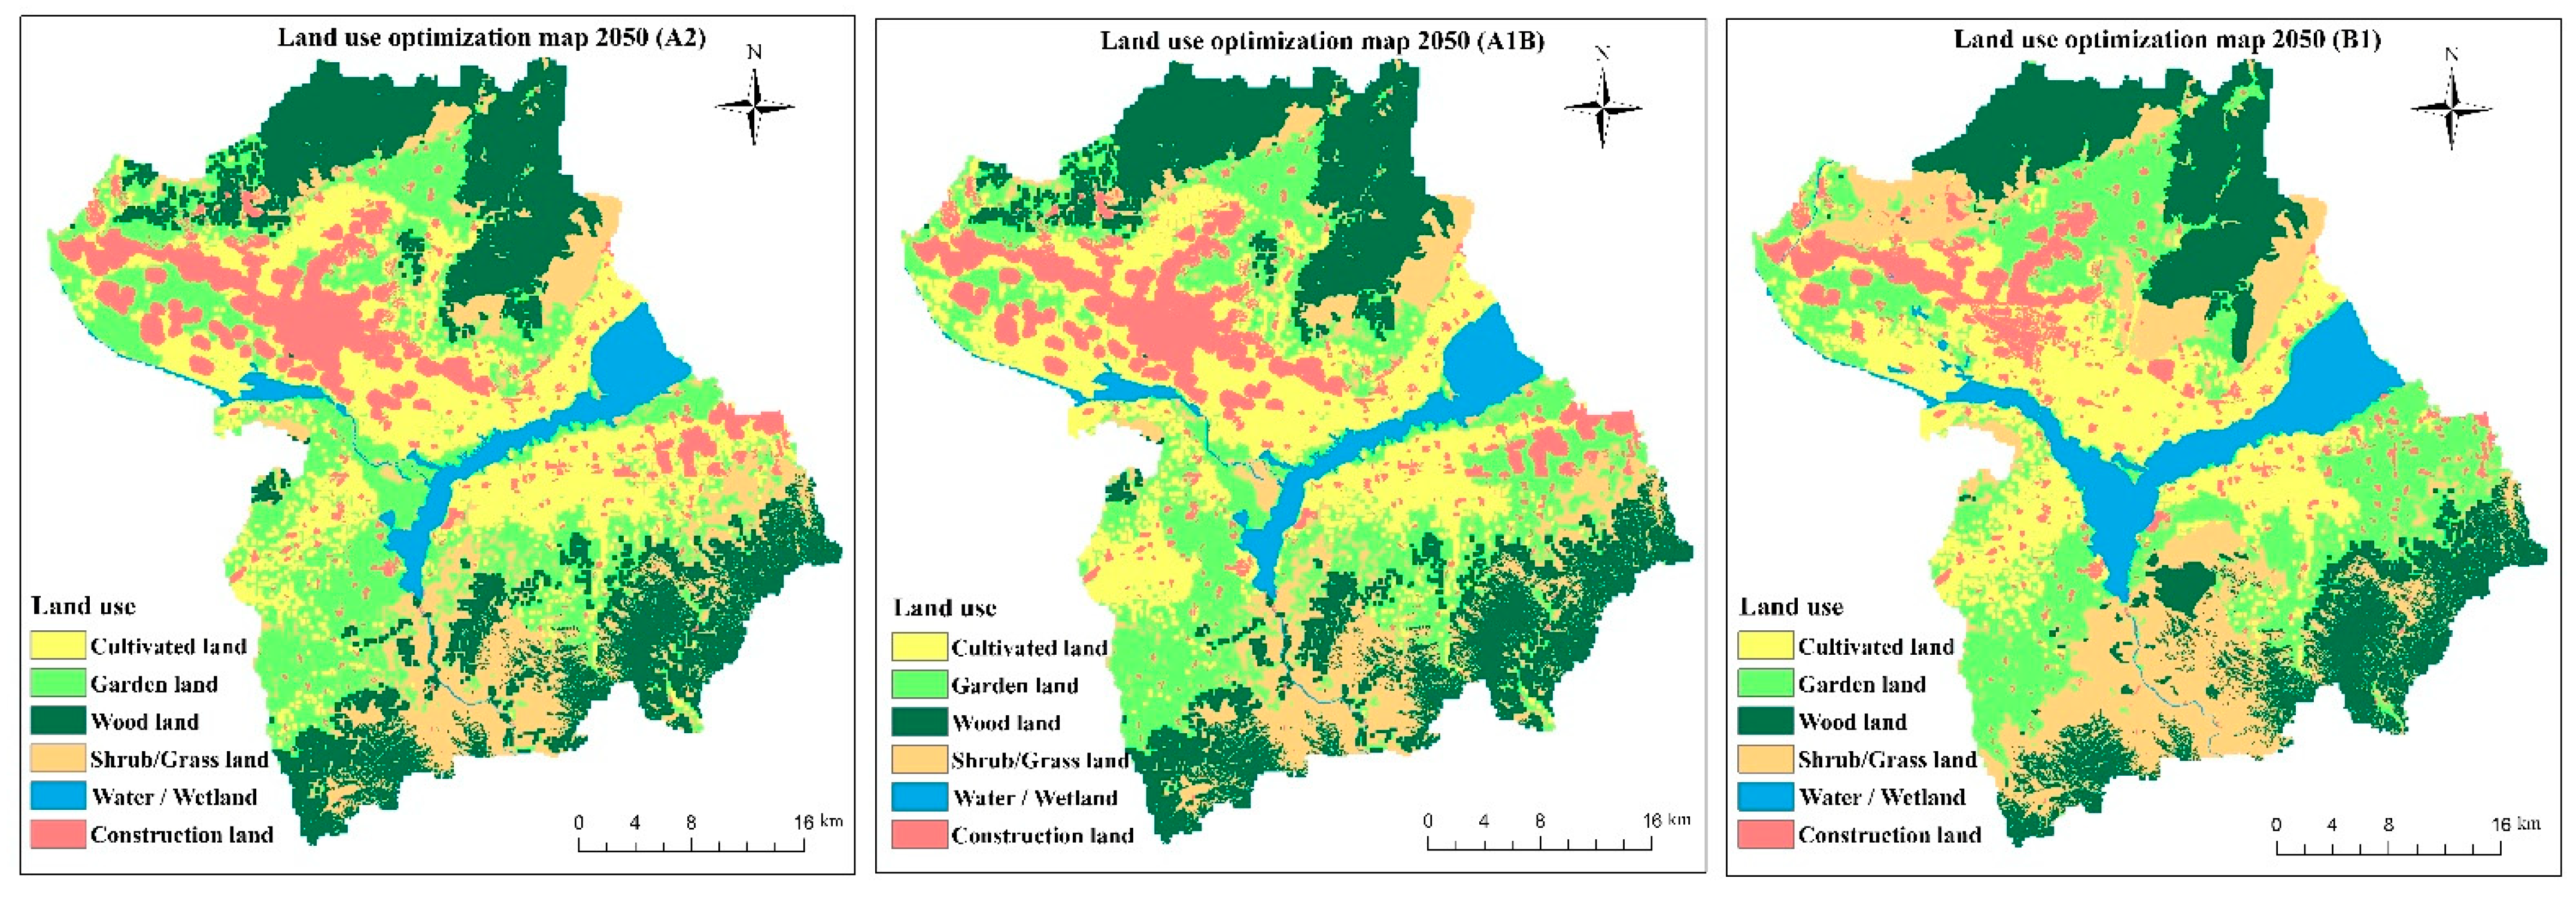
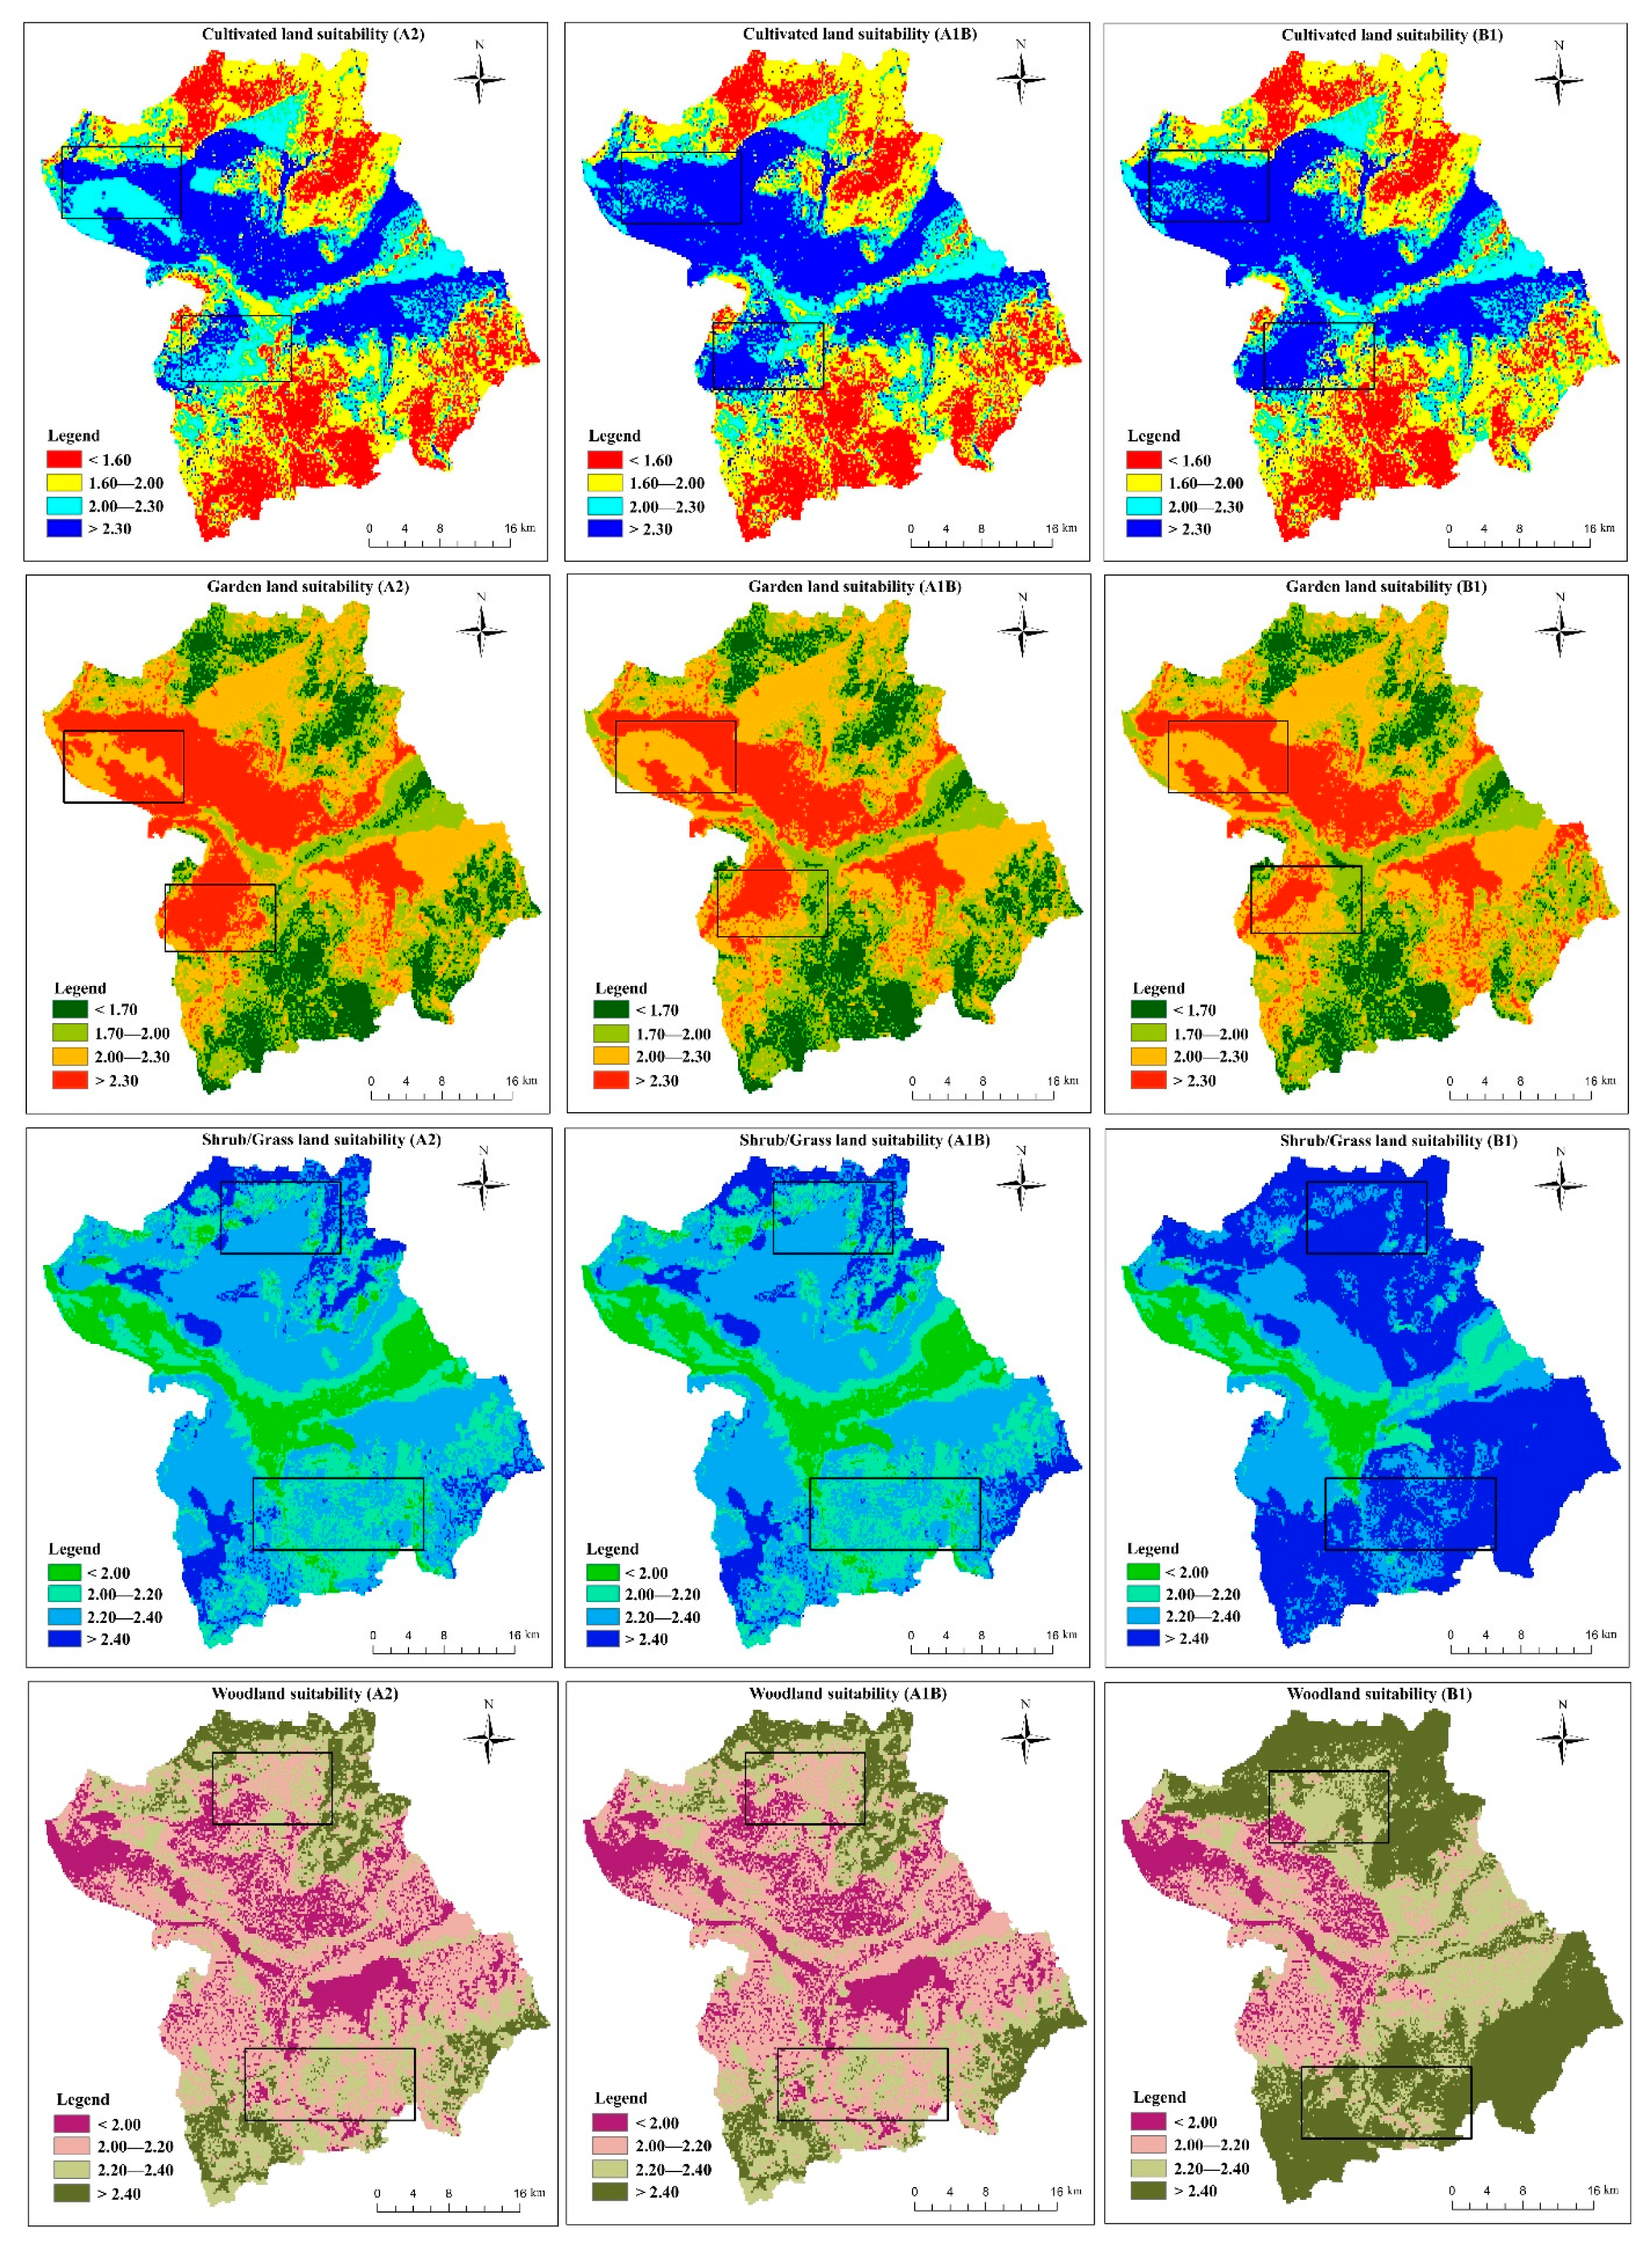
3.2. Land Use Pattern Optimization Results

The land use pattern optimization maps under different climate change scenarios are shown in Figure 5. Evidently, future climate change scenarios exhibited the general land use pattern optimization contributions as follows: cultivated land, construction land and most of garden land located in the plain of the study area, a small part of the garden plots and most of the shrub/grassland located in the hills, and the woodland primarily located in the mountains of the study area. This was because the factors that affect the land use pattern included climatic factors, topography, and soil factors. Specifically, in the mountain–basin system (similar to the study area), the topography factors (altitude and slope) become increasingly important to identify land use suitability and spatial pattern.
Furthermore, we compared the optimization results between each two scenarios and observed that the land use of most regions in the study area was unchanged (Figure 6). The unaltered region between scenarios A2 and A1B corresponded to 84.1% of that study area, that between scenarios A1B and B1 corresponded to 74.2%, and that between scenarios A2 and B1 corresponded to 73.7%. The overlay results indicated that the changed land use regions among the different scenarios were primarily located in the transition region of the three topography regions, and the major land use types corresponded to shrub/grassland, garden land, and woodland. The results also imply that most regions in the study area could adapt to climate change with a constant land use pattern.

4. Discussion

4.1. Incorporating Climate Change Adaptation and Mitigation into Land Use Planning

The results indicate that land use optimization improved the climate change adaptation and mitigation efficiency at a regional scale. Furthermore, in the study area, most regions with a constant land use pattern adapted to and mitigated climate change through rational land use planning. Therefore, decision makers should consider the role of land use planning when formulating climate change adaptation and mitigation strategies.
Additionally, the results indicate that the increase in ecological land use water demands was followed by an increase in climate carbon sequestration. Being the important land use type for carbon sequestration, the water demand for woodland was higher than the others. In the growing season, the water demands for shrub/grassland, garden plots, and cultivated land per unit area (1 ha) corresponded to 0.28 mm, 0.26 mm, and 0.24 mm, respectively, whereas that of the woodland corresponded to 0.42 mm (this was approximately 1.5 times that of others). The efficiency of land use optimization results indicates that trade-offs and synergies existed between climate change adaptation and mitigation [45,46]. For example, woodland created more residual vegetation and exhibited increased carbon sequestration while demanding relatively higher ecological water, thereby leading to lower economic profits for farmers. Unlimited expansion of the carbon sequestration vegetation for climate change mitigation in water-limited and rural areas could induce potential conflict with demands for water and the improvement of human livelihoods [6]. Therefore, trade-offs exist between climate change mitigation and adaptation, and similar results were also found in other previous studies [11,47,48]. Wu, Wang suggested that water provision and water sustainability are among climate change adaptation policies and correspond to crucial issues of future land use management under the background of climate change, that is, a hot and dry climate [47]. In addition, the rural human livelihoods are dependent on environmental resources, and the success of mitigation measures typically depends on how well the community adapt to climate changes (e.g., drought and erratic rainfall) [26]. Thus, the efforts that can adapt to the climate changes in the areas and integrate natural resource management can only enhance or address livelihood issues and thus increase resilience in response to climate change in a sustainable manner [49].
The complex relationships also indicate that land use managers focus on one aspect of climate change adaptation or mitigation, which would be unsustainable land use and regional development states. Thus, strategies to minimize the trade-offs between them are equally necessary, and climate change adaptation and mitigation should be simultaneously considered to improve land use planning and decision making. The modeling methodology emphasized an integrated approach to optimally achieve the simultaneous multiple benefits of climate change adaptation and mitigation. Furthermore, by minimizing trade-offs between adaptation and mitigation, maximum efficiency results can be achieved. Moreover, a comprehensive analysis of climate change adaptation and mitigation in the land use pattern or land use management research can effectively resolve trade-offs between them and can promote sustainable development.
These are some analysis methods, such as the Pareto-optimal solutions, which could help decision makers to reveal the complicated relationship between the climate change adaptation and mitigation strategies, such as the [50,51], the objective function can be solved over a range of relative weight.

4.2. Modeling Study of Land Use Optimization Integrated Climate Change Adaptation and Mitigation in the Future

The proposed methodology optimized the land use pattern by integrating climate change adaptation and mitigation strategies on a multiscale. We developed a regional scale model using land use structure optimization results that integrated regional climate change optimization and mitigation constraints as the pattern optimization condition. The neighborhood condition and land use suitability map under different scenarios were used at a pixel scale. In addition, the land use optimization model proposed a simple model structure and exhibited user-defined organizational characteristics, such that researchers or decision makers could add any other adaptation and mitigation constraints and strategies.
There are a few limitations in this study that can be considered in further model research. First, the climate change adaptation and mitigation strategies or constraints incorporated into the model are limited, and a broader scope of adaptation and mitigation should be investigated. For example, the model considered limited adaptation strategies, and more constraints should be integrated into the model such as improved water use, adapted crop varieties and practices, soil and water conservation practices, and public awareness of climate change and variability [49]. Furthermore, the model did not consider the GHG emissions of land use while calculating climate change mitigation. Studies have emphasized that the shrub/grassland used for livestock is an important contributor to GHG emissions despite constituting the livelihoods of certain communities [14]. Second, the land use types modelled in the study area were approximate due to the limitation of source data and model complexity. To improve this, the vegetation or crop distribution data and the distribution model that can value the spatial suitability of species can be applied to concretize model results. The general species model is the maximum entropy (Maxent) model that is widely used for modeling species distributions and can obtain a suitability map of specific crops [11]. Finally, climate feedback from adaptation and mitigation efforts was not integrated into the model. The system dynamics (SD) model can be used to expand and model the feedback of a land use system, and it is used to solve economic, social, environment, and other system problems, such as nonlinear, multivariable, higher order, and multiple feedback [52]. The advantages of the SD model can be applied without sufficient data to analyze the features of the system, and effectively track and model the real system.
Finally, the spatial model established in this study ignored some key features of land use change, such as previous land use patterns and the spatiotemporal autocorrelation in land use patterns [53]. To further optimize the model proposed, we should also focus on the complex relationship between the socioeconomic system and land use system [54].

4.3. Climate Change Adaptation and Mitigation Strategies in Land Use Management

The modelling results indicate that the land use pattern change regions among different climate change scenarios are primarily located in the topography transition regions between plain, hills, and mountain. There were studies indicating that transitional zones among biomes or ecosystems are particularly sensitive to changing climatic conditions [10]. Specifically, some studies on montane regions exhibit a general movement of species upward with elevation. Luckman and Kavanagh [55] observed the upward movement of tree lines in Siberia and in the Canadian Rocky Mountains where the temperature had increased by 1.5 °C. A study across 26 mountains in Switzerland documented that alpine flora had expanded toward the summits since the 1940s [56]. All the studies indicated that an elevation shift in biomes or ecosystems occurs in the mountain area. Furthermore, considering the terrain constraints and climatic conditions, the spatial distribution of species changes with increasing elevation, such that the boundaries of biomes or ecosystems are always located in the topography transition region. The study area in this study was a typical mountain–basin system exhibiting significant differences in topography conditions, and the topography transition region of the study area corresponded to the key area for developing land use optimization and management to adapt to future climate change.
The climate change analysis of the study area indicated that the annual mean temperature has gradually increased at a rate of 0.37 °C/10a over the past 60 years, which exceeds the national average. The annual precipitation gradually decreased, and the warm and dry tendency of summer was more evident than other seasons [25]. Furthermore, to reveal the effect of dryness on land use optimization results, we proposed the continuous drought hypothesis (the available water resources are drier than the A2 scenario). The land use structure optimization result indicated that the area percentage of cultivated land increased to 44%, garden plots decreased to 8%, woodland decreased to 26%, and shrub/grassland decreased to 7%. The results also illustrated that the agricultural structure of the study area tended to be simple to adapt to a dry climate and continued to decrease the regional available water resources. Similar results were also observed in previous studies [47]. Many species suffered a reduced habitable area due to recent climate changes. With respect to species that are already prone to extinction at their equatorial or lower range boundaries, some have either failed to expand poleward or could not to expand due to geographic barriers [10]. These species suffered absolute reductions in range size, thereby increasing the risk of extinction in the future. In the Great Basin of the Western United States, 7 out of 25 re-censused populations of the pika were extinct since they were recorded in the 1930s [57]. Observations and experiments indicated that the adult pika stopped foraging in the midday heat in August and were killed within a half hour at more than 31 °C [58].
Additionally, climate change adaptation and mitigation strategies also include land use management policies. The decision makers can obtain useful references from successful land use management strategies of extant studies on drier and hotter climates [49]. Climate change adaptation strategies include the following: (1) improved water use through sinking shallow wells, water harvesting, increased efficient water use and surface cover; (2) use of adapted crop varieties and practices, such as drought-resistant crops, planting locally adapted species; (3) adopting soil and water conservation practices including soil fertility improvement, crop rotation, farming strategies (mulching, early maturing varieties), and organic manure to enhance soil water-holding capacity. Climate change mitigation strategies also involve reducing atmospheric CO2 concentrations through methods such as tillage practices. For example, a combination of inorganic fertilizer and organic manure and crop rotation systems are effective in increasing SOC [8]. Finally, public awareness/information dissemination on climate change has also been proven effective in adapting and mitigating climate change.

5. Conclusions

In this study, we established a methodology and provided an empirical land use optimization method that incorporates climate change adaptation and mitigation. We obtained the following findings:
(1)
The results indicated that rational adjustments of land use structure and pattern can be an effective strategy to adapt and mitigate climate change at a regional scale in the face of the changing climate. In addition, the present findings revealed that trade-offs exist between climate change adaptation and mitigation. Ultimately, land use planning and policy should jointly consider adaptation and mitigation to cope with climate change and to achieve sustainability. Furthermore, it is necessary to develop methodology to minimize trade-offs between adaptation and mitigation and then achieve maximum efficiency results.
(2)
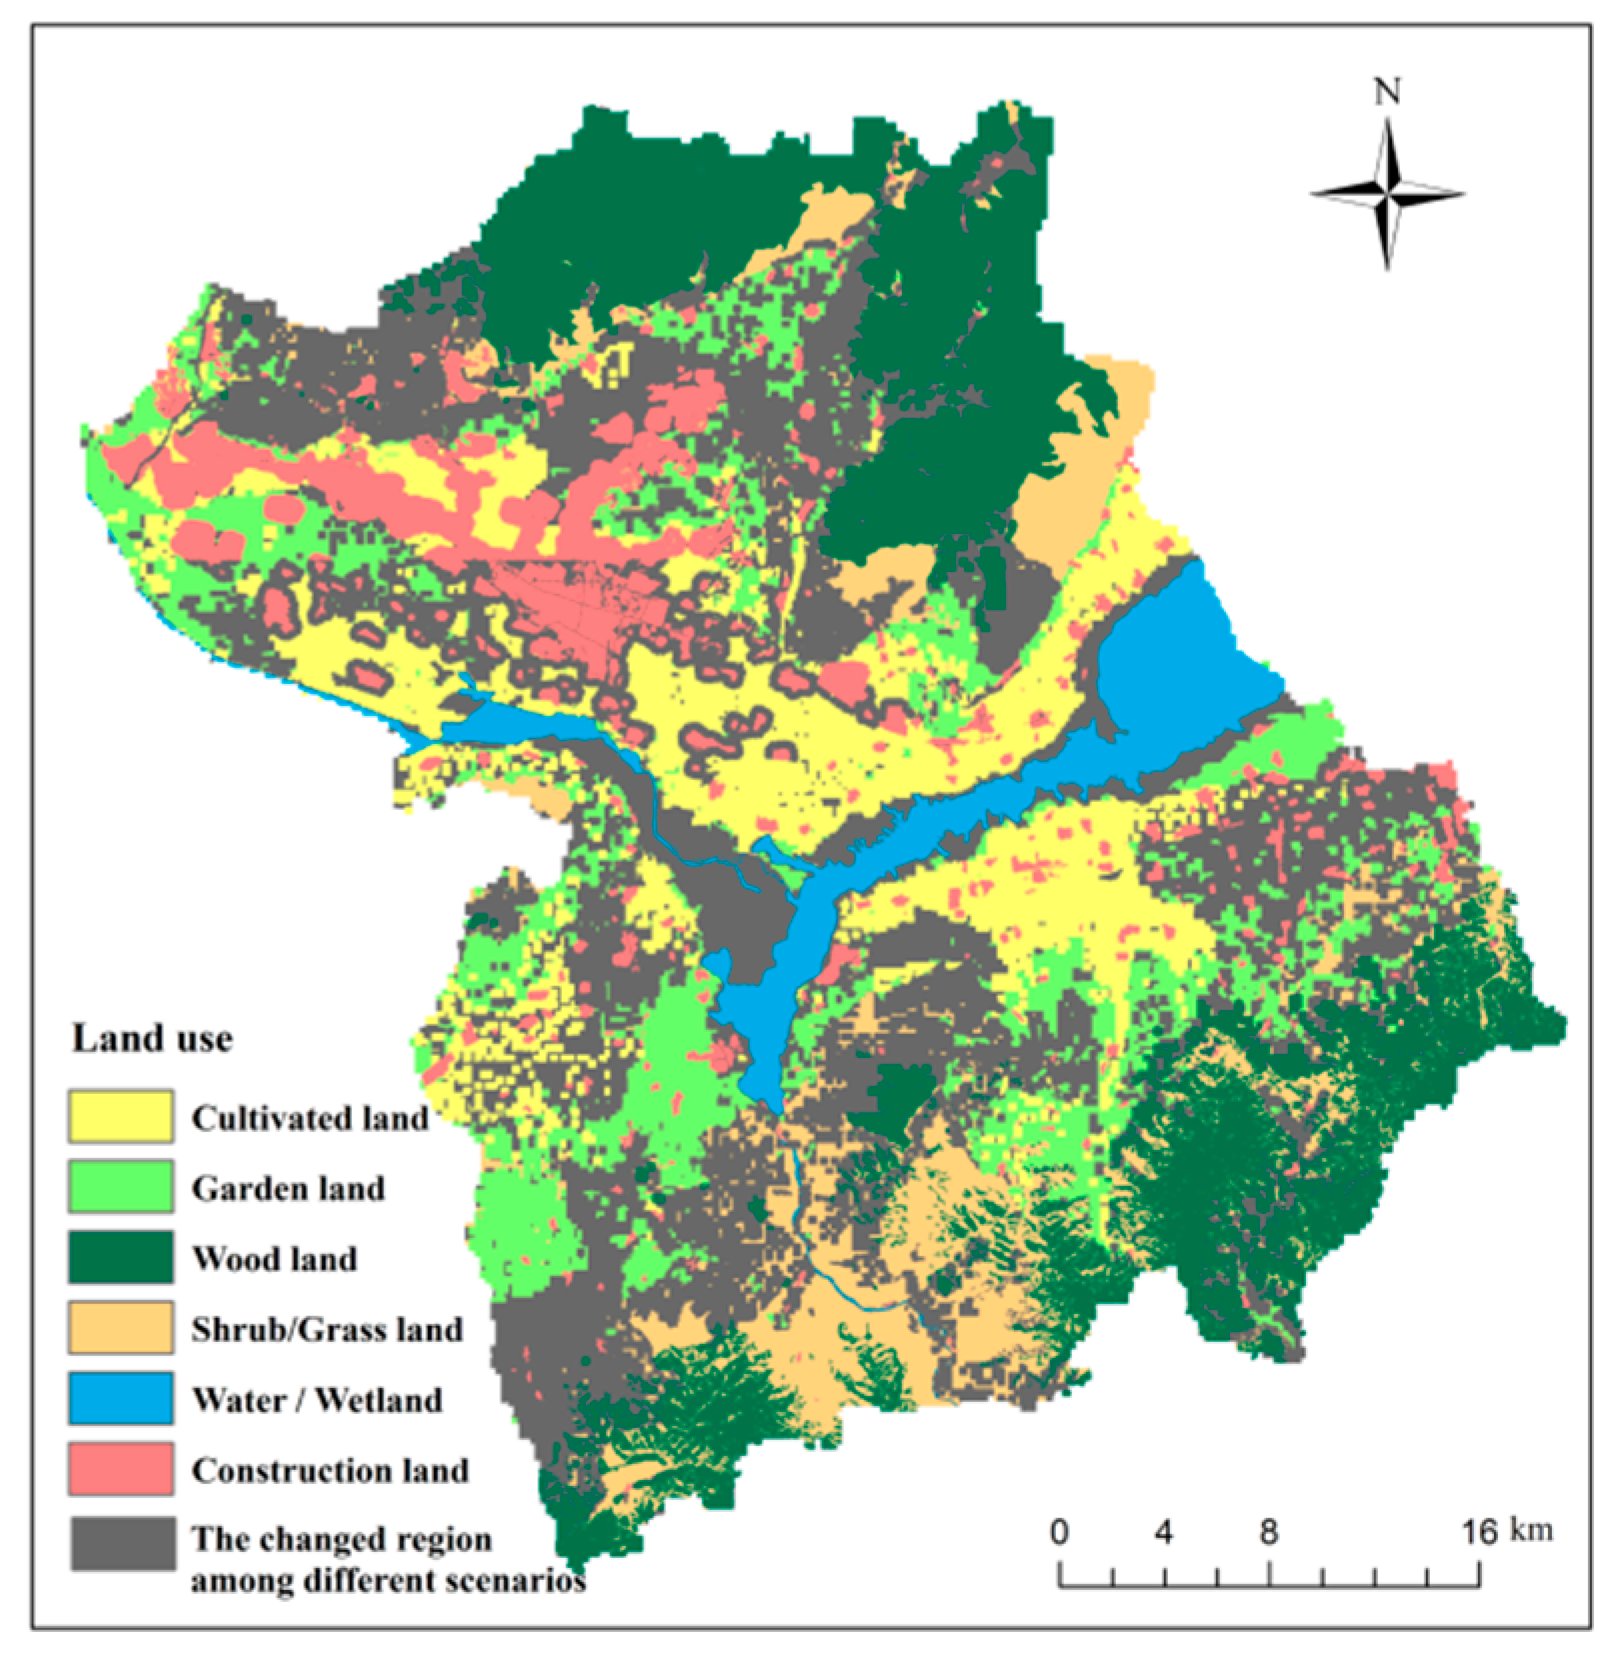
The study area corresponded to a typical mountain–basin system wherein the optimized land use pattern characteristics including the following: cultivated land, construction land and most of garden land located in the plain of the study area, a small part of garden land and most of shrub/grassland located in the hills, and the woodland primarily located in the mountainous area. In addition, the changed land use region with different climate change scenarios was primarily located in the transition region of three topography regions (plain, hills, and mountain). In the region, the major changed land use types included shrub/grassland, garden land, and woodland. Considering the topographical characteristics of the study area, it is important to extend the methodology to other regions.
Furthermore, the model limitations should be considered in further research. Future modeling efforts can incorporate a broader scope of adaptation and mitigation into the model framework. In addition, future research can integrate the distribution model and SD model to potentially improve the scientific value of the optimization results.

Author Contributions

Conceptualization, Y.X. and L.Y.; methodology, Y.X.; software, Y.X.; validation, L.Y.; formal analysis, Y.X.; investigation, Y.X.; resources, Y.X.; data curation, Y.X.; writing—original draft preparation, Y.X.; writing—review and editing, L.Y.; visualization, Y.X.; supervision, L.Y.; funding acquisition, Y.X. and L.Y. All authors have read and agreed to the published version of the manuscript.

Funding

This study was supported by the Humanities and Social Science Project of the Ministry of Education of China [20YJCZH198]; Natural Science Foundation of Shandong Province [ZR2021QD093, ZR2021MD095]; Humanities and Social Science Project of Shandong Province [2021-JCGL-03]; Natural Science Foundation of China [42171049; 41701206].

Data Availability Statement

The data presented in this study are available on request from the corresponding author. The data are not publicly available due to the privacy agreement among co-authors.

Acknowledgments

The authors would like to thank the anonymous reviewers for their meaningful and perceptive comments and suggestions on previous versions of this article.

Conflicts of Interest

The authors declare no conflict of interest.

References

  1. Demirkesen, A.C.; Evrendilek, F. Compositing climate change vulnerability of a Mediterranean region using spatiotemporally dynamic proxies for ecological and socioeconomic impacts and stabilities. Environ. Monit. Assess. 2016, 189, 29. [Google Scholar] [CrossRef]
  2. Allan, R.P.; Soden, B. Atmospheric Warming and the Amplification of Precipitation Extremes. Science 2008, 321, 1481–1484. [Google Scholar] [CrossRef] [Green Version]
  3. Diffenbaugh, N.S.; Scherer, M.; Trapp, R.J. Robust increases in severe thunderstorm environments in response to greenhouse forcing. Proc. Natl. Acad. Sci. USA 2013, 110, 16361–16366. [Google Scholar] [CrossRef] [PubMed] [Green Version]
  4. Mu, J.E.; Wein, A.M.; McCarl, B.A. Land use and management change under climate change adaptation and mitigation strategies: A U.S. case study. Mitig. Adapt. Strat. Glob. Chang. 2015, 20, 1041–1054. [Google Scholar] [CrossRef]
  5. Wilbanks, T.J.; Kane, S.M.; Leiby, P.N.; Perlack, R.D.; Settle, C.; Shogren, J.F.; Smith, J.B. Possible Responses to Global Climate Change: Integrating Mitigation and Adaptation. Environ. Sci. Policy Sustain. Dev. 2003, 45, 28–38. [Google Scholar] [CrossRef]
  6. Duguma, L.A.; Minang, P.A.; van Noordwijk, M. Climate change mitigation and adaptation in the land use sector: From com-plementarity to synergy. Environ. Manag. 2014, 54, 420–432. [Google Scholar] [CrossRef] [Green Version]
  7. UN/ISDR. Global Assessment Report on Disaster Risk Reduction: Revealing Risk, Redefining Development; United Nations Publication: London, UK, 2011. [Google Scholar]
  8. Chuai, X.; Huang, X.; Lai, L.; Wang, W.; Peng, J.; Zhao, R. Land use structure optimization based on carbon storage in several regional terrestrial ecosystems across China. Environ. Sci. Policy 2013, 25, 50–61. [Google Scholar] [CrossRef]
  9. Lei, Y.; Wang, J.; Yue, Y.; Yin, Y.; Sheng, Z. How adjustments in land use patterns contribute to drought risk adaptation in a changing climate—A case study in China. Land Use Policy 2014, 36, 577–584. [Google Scholar] [CrossRef]
  10. Parmesan, C. Ecological and Evolutionary Responses to Recent Climate Change. Annu. Rev. Ecol. Evol. Syst. 2006, 37, 637–669. [Google Scholar] [CrossRef] [Green Version]
  11. Correia, R.A.; Bugalho, M.N.; Franco, A.M.A.; Palmeirim, J.M. Contribution of spatially explicit models to climate change adaptation and mitigation plans for a priority forest habitat. Mitig. Adapt. Strat. Glob. Chang. 2018, 23, 371–386. [Google Scholar] [CrossRef] [Green Version]
  12. Metz, B.; Davidson, O.; Bosch, P.; Dave, R.; Meyer, L. Climate Change 2007: Mitigation of Climate Change; Cambridge University Press: New York, NY, USA, 2007. [Google Scholar]
  13. Golub, A.; Hertel, T.; Lee, H.-L.; Rose, S.; Sohngen, B. The opportunity cost of land use and the global potential for greenhouse gas mitigation in agriculture and forestry. Resour. Energy Econ. 2009, 31, 299–319. [Google Scholar] [CrossRef] [Green Version]
  14. Herrero, M.; Thornton, P.K.; Gerber, P.; Reid, R.S. Livestock, livelihoods and the environment: Understanding the trade-offs. Curr. Opin. Environ. Sustain. 2009, 1, 111–120. [Google Scholar] [CrossRef]
  15. Bailis, R.; McCARTHY, H. Carbon impacts of direct land use change in semiarid woodlands converted to biofuel plantations in India and Brazil. GCB Bioenergy 2011, 3, 449–460. [Google Scholar] [CrossRef]
  16. Rojas-Downing, M.M.; Nejadhashemi, A.P.; Harrigan, T.; Woznicki, S. Climate change and livestock: Impacts, adaptation, and mitigation. Clim. Risk Manag. 2017, 16, 145–163. [Google Scholar] [CrossRef]
  17. Montanaro, G.; Nuzzo, V.; Xiloyannis, C.; Dichio, B. Climate change mitigation and adaptation in agriculture: The case of the olive. J. Water Clim. Chang. 2018, 9, 633–642. [Google Scholar] [CrossRef]
  18. Niles, M.T.; Brown, M.; Dynes, R. Farmer’s intended and actual adoption of climate change mitigation and adaptation strategies. Clim. Chang. 2015, 135, 277–295. [Google Scholar] [CrossRef] [Green Version]
  19. Gregório, V.; Simoes, S.; Seixas, J. Trade-Offs between Climate Change Adaptation and Mitigation Options for Resilient Cities: Thermal Comfort in Households. In Innovation in Climate Change Adaptation; Leal Filho, W., Ed.; Springer International Publishing: Cham, Switzerland, 2016; pp. 113–129. [Google Scholar]
  20. Pietrapertosa, F.; Salvia, M.; De Gregorio Hurtado, S.; D’Alonzo, V.; Church, J.M.; Geneletti, D.; Musco, F.; Reckien, D. Urban climate change mitigation and adaptation planning: Are Italian cities ready? Cities 2019, 91, 93–105. [Google Scholar] [CrossRef]
  21. Parker-Flynn, J.E. Linking Mitigation and Adaptation to Climate Change. Am. J. Public Health 2018, 108, S58–S59. [Google Scholar] [CrossRef]
  22. Landauer, M.; Juhola, S.; Klein, J. The role of scale in integrating climate change adaptation and mitigation in cities. J. Environ. Plan. Manag. 2018, 62, 741–765. [Google Scholar] [CrossRef] [Green Version]
  23. Lungarska, A.; Chakir, R. Climate-induced Land Use Change in France: Impacts of Agricultural Adaptation and Climate Change Mitigation. Ecol. Econ. 2018, 147, 134–154. [Google Scholar] [CrossRef] [Green Version]
  24. Cao, Q.; Yu, D.; Georgescu, M.; Han, Z.; Wu, J. Impacts of land use and land cover change on regional climate: A case study in the agro-pastoral transitional zone of China. Environ. Res. Lett. 2015, 10, 124025. [Google Scholar] [CrossRef]
  25. Xu, Y.; Tang, H. Characteristics and impacts of climate change in Huailai Basin during the past 60 years. J. Beijing Norm. Univ. Nat. Sci. 2015, 51, 293–298. [Google Scholar]
  26. Wang, B.; Tang, H.; Xu, Y. Integrating ecosystem services and human well-being into management practices: Insights from a mountain-basin area, China. Ecosyst. Serv. 2017, 27, 58–69. [Google Scholar] [CrossRef]
  27. Nakicenovic, N.; Swart, R. Special Report on Emissions Scenarios; Cambridge University Press: Cambridge, UK, 2000. [Google Scholar]
  28. Intergovernmental Panel on Climate Change (IPCC). Carbon Dioxide Capture and Storage; Cambridge University Press: Cambridge, UK, 2005; p. 582. [Google Scholar]
  29. Zhu, W.Q.; Pan, Y.; Zhang, J. Estimation of net primary producticity of Chinese terrestrial vegetation based on remote sensing. Chin. J. Plant Ecol. 2007, 31, 413–424. [Google Scholar]
  30. Xu, M.; Xu, M.; Wang, Z.; Zhang, J.; Liu, G. Response of soil carbon sequestration to the “Grain for Green Project” in the hilly Loess Plateau region. Acta Ecol. Sin. 2012, 32, 5405–5415. [Google Scholar]
  31. Zhang, X.; Xu, M.; Shi, C.; Qiu, Y. Soil organic carbon sequestration rate and its influencing factors in farmlands of semi-arid regions—A case study in Zhuanglang contry, Gansu Province. Plant Nutr. Fertil. Sci. 2012, 18, 1086–1095. [Google Scholar]
  32. Zhao, Y. Study of Optimized Eco-Productive Paradigm in the Farming-Pastoral Zone of Northern China—A Case of Huailai County; Beijing Normal University: Beijing, China, 2004. [Google Scholar]
  33. Huang, T.; Yu, D.; Cao, Q.; Qiao, J. Impacts of meteorological factors and land use pattern on hydrological elements in a semi-arid basin. Sci. Total Environ. 2019, 690, 932–943. [Google Scholar] [CrossRef] [PubMed]
  34. Walter, I.A.; Allen, R.G.; Elliott, R.L.; Jensen, M.E.; Itenfisu, D.; Mecham, B.; Howell, T.A.; Snyder, H.R.; Brown, P.; Echings, S.; et al. The ASCE Standardized Reference Evapotranspiration Equation; Task Committee on Standardization of Reference Evapotranspiration American Society of Civil Engineers: Reston, VA, USA, 2005. [Google Scholar]
  35. Saaty, T.L. A scaling method for priorities in hierarchical structures. J. Math. Psychol. 1977, 15, 234–281. [Google Scholar] [CrossRef]
  36. Saaty, T.L. Fundamentals of Decision Making and Priority Theory with the AHP; RWS Publications: Pittsburgh, PA, USA, 1994. [Google Scholar]
  37. Bureau, H.S. Huailai Statistics Yearbook of Social and Economic; Huailai Statistic Bureau: Huailai, China, 2011. [Google Scholar]
  38. Gopar-Merino, F.L.; Velazquez, A.; Gimenez, D.A.J. Bioclimatic mapping as a new method to assess effects of climatic change. Ecosphere 2015, 6, 1–12. [Google Scholar] [CrossRef]
  39. Men, M.X.; Zhao, T.K.; Peng, Z.P.; Yu, Z.R. Study on the soil erodibiility based on the soil particle-size distribution in Hebei province. Sci. Agric. Sin. 2004, 37, 1647–1653. [Google Scholar]
  40. Gupta, S.C.; Larson, W.E. Estimating soil water retention characteristics from particle size distribution, organic matter percent, and bulk density. Water Resour. Res. 1979, 15, 1633–1635. [Google Scholar] [CrossRef]
  41. Zhang, X.S.; Tang, H.P. Establishment of Optimized Eco-Productive Paradigm in the Farming-Pastoral Zone of Northern China; Science Press: Beijing, China, 2008. [Google Scholar]
  42. Zhong, H. Study of Land Use Optimization Based on Ecological Carrying Capacity—A Case of Huailai County, in Beijing Forestry University; Beijing Forestry University: Beijing, China, 2014. [Google Scholar]
  43. Lin, J.; Li, X. Large-scale ecological red line planning in urban agglomerations using a semi-automatic intelligent zoning method. Sustain. Cities Soc. 2019, 46, 101410. [Google Scholar] [CrossRef]
  44. Clarke, K.C. Cellular Automata and Agent-Based Models Handbook of Regional Science; Springer: Berlin/Heidelberg, Germany, 2014. [Google Scholar]
  45. Harvey, C.A.; Chacón, M.; Donatti, C.I.; Garen, E.; Hannah, L.; Andrade, A.; Bede, L.; Brown, D.; Calle, A.; Chará, J.; et al. Climate-Smart Landscapes: Opportunities and Challenges for Integrating Adaptation and Mitigation in Tropical Agriculture. Conserv. Lett. 2014, 7, 77–90. [Google Scholar] [CrossRef]
  46. Locatelli, B.; Pavageau, C.; Pramova, E.; Di Gregorio, M. Integrating climate change mitigation and adaptation in agriculture and forestry: Opportunities and trade-offs. Wiley Interdiscip. Rev. Clim. Chang. 2015, 6, 585–598. [Google Scholar] [CrossRef]
  47. Wu, X.; Wang, S.; Fu, B.; Liu, Y.; Zhu, Y. Land use optimization based on ecosystem service assessment: A case study in the Yanhe watershed. Land Use Policy 2018, 72, 303–312. [Google Scholar] [CrossRef]
  48. Mekuriaw, S.; Mengistu, A.; Tegegne, F. Livestock Technologies and Grazing Land Management Options for Climate Change Adaption and Mitigation as a Contribution for Food Security in Ethiopia: A Brief Overview. In Climate Change-Resilient Agriculture and Agroforestry: Ecosystem Services and Sustainability; Castro, P., Ed.; Springer International Publishing: Cham, Switzerland, 2019; pp. 383–396. [Google Scholar]
  49. Adimo, A.O.; Njoroge, J.B.; Claessens, L.; Wamocho, L.S. Land use and climate change adaptation strategies in Kenya. Mitig. Adapt. Strat. Glob. Chang. 2011, 17, 153–171. [Google Scholar] [CrossRef]
  50. Heck, V.; Hoff, H.; Wirsenius, S.; Meyer, C.; Kreft, H. Land use options for staying within the Planetary Boundaries—Synergies and trade-offs between global and local sus-tainability goals. Glob. Environ. Chang. 2018, 49, 73–84. [Google Scholar] [CrossRef]
  51. Strassburg, B.B.N.; Iribarrem, A.; Beyer, H.L.; Cordeiro, C.L.; Crouzeilles, R.; Jakovac, C.C.; Junqueira, A.B.; Lacerda, E.; Latawiec, A.E.; Balmford, A.; et al. Global priority areas for ecosystem restoration. Nature 2020, 586, 724–729. [Google Scholar] [CrossRef] [PubMed]
  52. Jin, G.; Deng, X.; Chu, X.; Li, Z.; Wang, Y. Optimization of land-use management for ecosystem service improvement: A review. Phys. Chem. Earth 2017, 101, 70–77. [Google Scholar] [CrossRef]
  53. Meiyappan, P.; Dalton, M.; O’Neill, B.C.; Jain, A.K. Spatial modeling of agricultural land use change at global scale. Ecol. Model. 2014, 291, 152–174. [Google Scholar] [CrossRef] [Green Version]
  54. Ren, X.; Weitzel, M.; O’Neill, B.C.; Lawrence, P.; Meiyappan, P.; Levis, S.; Balistreri, E.; Dalton, M. Avoided economic impacts of climate change on agriculture: Integrating a land surface model (CLM) with a global economic model (iPETS). Clim. Chang. 2018, 146, 517–531. [Google Scholar] [CrossRef] [Green Version]
  55. Luckman, B.; Kavanagh, T. Impact of climate fluctuations on mountain environments in the Canadian Rockies. AMBIO A J. Hum. Environ. 2000, 29, 371–380. [Google Scholar] [CrossRef]
  56. Pauli, H.; Gottfried, M.; Grabherr, G. Effects of climate change on mountain ecosystems—Upward shifting of alpine plants. World Resour. Rev. 1996, 8, 382–390. [Google Scholar]
  57. Beever, E.A.; Brussard, P.F.; Berger, J. Patterns of apparent extirpation among isolated populatioons of pikas (ochotona princeps) in the great basin. J. Mammal. 2003, 84, 37–54. [Google Scholar] [CrossRef] [Green Version]
  58. Smith, A.T. The Distribution and Dispersal of Pikas: Influences of Behavior and Climate. Ecology 1974, 55, 1368–1376. [Google Scholar] [CrossRef]
Figure 1. Land use optimization modelling framework for integrated climate change adaptation and mitigation.
Land 10 01297 g001
Figure 2. Geographical location and altitude of Huailai County.
Land 10 01297 g002
Figure 3. Land use suitability evaluation result.
Land 10 01297 g003
Figure 4. Technological flowchart of the land use pattern optimization integrated climate change adaptation and mitigation.
Land 10 01297 g004
Figure 5. Land use optimization map of Huailai County under future climate change scenarios.
Land 10 01297 g005
Figure 6. Changed land use region of Huailai County under different climate change scenarios.
Land 10 01297 g006
Table 1. Description and climate prediction results of future climate change scenarios.
ScenariosDescription [27]CO2 Emission
Density
Climate Prediction Result in
Growing Season
Mean Temperature (°C)Precipitation (mm)
A2A very heterogeneous world; high population growth; economic development growth and technological change are more fragmented and slower than the others.High23.06 (↑ 3.6)373.57 (↓ 36)
A1BWorld exhibits very rapid economic growth, lower population growth, major under lying themes are converging among regions, large energy consumption and rapid technological change. Medium22.94 (↑ 3.5)390.01 (↓ 19.6)
B1A convergent world with slow population growth, emphasis on economic, social, and environmental sustainability. Low20.94 (↑ 1.5)458.33 (↑ 48.8)
Table 2. Remote sensing images used for land use interpretation.
Satellite
(Sensor)
Observation Date
(y/m/d)
Path/RowResolution
(m)
Cloud Cover (%)Sources
Landsat (TM)1989/10/8124/32300.13Geospatial Data Cloud Website
(http://www.gscloud.cn/, accessed on 20 May 2021)
1990/10/11124/323016.55
2010/08/15124/32307.15
Aqua (MODIS)2019/4–2019/1026/04250U.S. Geological survey
(http://www.usgs.gov, accessed on 20 May 2021)
2019/4–2019/1026/04250
Table 3. Vegetation and soil carbon density of different land uses in Huailai County.
Land Use TypesNPPmean (t/ha)SOC (g/kg) 10–40 cm SOCD (t/ha)
10203040SOCmean
Cultivated land2.549.227.387.237.057.7217.30
Garden land3.128.407.986.775.387.1324.41
Woodland4.3537.0717.1814.2910.9819.8846.94
Shrub/grassland2.9524.6616.1718.9112.5618.0839.46
Table 4. Suitability evaluation factors and scores of four agricultural lands in the study.
FactorsIndexUnitData SourceClassSuitability Score
Cultivated LandGarden
Land
GrasslandWoodland
ClimateGrain yieldt/haHuailai Statistics Yearbook of Social and Economics [37]<3.5
3.5–4
4–5
>5
1
2
2
3
Fruit yieldt/haHuailai Statistics Yearbook of Social and Economics [37]<6.5
6.5–7.5
7.5–8.5
≥8.5
1
2
2
3
Ombrothermic index i n d e x = ( p / t ) · 10
where p is precipitation in growing season, t is mean temperature in growing season [38]
<210
210–220
>240
220–240
1
2
2
3
1
2
2
3
SoilSoil organic matter%Map of soil organic matter (Soil Survey Office of Hebei Province)<1
1–1.75
1.75–3
>3
1
1
2
3
2
2
3
3
2
2
3
3
2
2
3
3
Soil nitrogenppmMap of soil nitrogen (Soil Survey Office of Hebei Province)<0.05
0.05–0.1
0.1–0.2
>0.2
1
1
2
3
2
2
3
3
2
2
3
3
2
2
3
3
Soil erodibility Proposed by Men, Zhao [39]>0.3
0.3–0.25
<0.25
1
2
3
1
2
3
2
2
3
2
2
3
Maximum moisture capacitycm3/cm3Estimated by soil water content estimation equation [40]<0.3
0.3–0.35
0.35–0.39
>0.39
1
2
3
3
1
2
3
3
2
2
3
3
2
2
3
3
TopographyAltitudemGeospatial Data Cloud Website, (http://www.gscloud.cn/, accessed on 20 May 2021)<500
500–800
>800
3
2
1
3
3
2
2
3
3
3
2
3
Slope°Geospatial Data Cloud Website, (http://www.gscloud.cn/, accessed on 20 May 2021)0–5
5–15
15–25
>25
3
1
0
0
3
2
1
0
3
3
2
1
3
3
2
1
Aspect Geospatial Data Cloud Website, (http://www.gscloud.cn/, accessed on 20 May 2021)Plateau-sunny slope
Half-sunny slope
Half-shady slope
Shady slope
3
2
2
1
3
2
2
1
3
3
3
3
2
3
3
3
SocialPopulation densityNumber of
people km−2
Huailai Statistics Yearbook of Social and Economics [37]<200
200–350
350–600
>600
1
2
3
3
1
2
3
3
3
3
2
1
3
3
2
1
Distance to townmLand use data of the study area.<1000
1000–2000
2000–3000
>3000
3
3
2
1
3
3
2
1
1
1
2
3
1
1
2
3
Table 5. Suitability evaluation factors and scores of construction land in the study.
FactorsIndexUnitSourceClassSuitability Score
TopographySlope°Geospatial Data Cloud Website, (http://www.gscloud.cn/, accessed on 20 May 2021)0–5
5–15
15–25
>25
3
2
1
0
Aspect Geospatial Data Cloud Website, (http://www.gscloud.cn/, accessed on 20 May 2021)<500
500–800
>800
3
2
1
DistanceDistance to townmLand use data of study area<300
300–600
600–1000
>1000
3
2
1
0
Distance to rivermLand use data of study area<150
150–300
300–450
>450
0
1
2
3
Distance to wetlandmLand use data of study area<1000
1000–2000
2000–3000
>3000
0
1
2
3
Distance to ecosystem function hotspot regionmLand use data of study area<1000
1000–2000
2000–3000
>3000
0
1
2
3
Table 6. Weight of land use suitability evaluation factors based on the analytic hierarchy process.
FactorsCultivated LandGarden LandWoodlandGrassland
Ombrothermic index0.16210.18160.24330.2512
Soil organic matter0.02460.04140.04560.0482
Soil nitrogen0.02460.04140.11760.0482
Soil erodibility0.10270.11180.05580.1269
Maximum moisture capacity0.06190.08770.16700.1944
Altitude0.09710.03470.16700.1563
Slope0.20920.16160.05490.0774
Aspect0.03730.02370.09830.0505
Population density0.14040.15810.02530.0235
Distance to town0.14040.15810.02530.0235
Table 7. Land use structure and climate change adaptation and mitigation efficiency in 2010 and future scenarios of Huailai County.
2010A2A1BB1
Land use structure (ha)
Cultivated land 30,589.3335,124.0035,124.0032,645.00
Garden land36,134.9943,335.0043,335.0043,279.29
Woodland 42,095.2147,909.5055,257.0745,858.00
Shrub/grassland50,214.2023,521.5019,791.9329,903.71
Water 8539.008539.008539.0013,346.00
Construction land 11,128.4820,272.0016,654.0013,669.00
Adaptation and mitigation efficiency
Social adaptation
(105 million)
1.651.811.791.80
Carbon sequestration
(106 t)
5.895.345.605.46
Ecological water demand
(108 m3)
4.854.644.844.67
Publisher’s Note: MDPI stays neutral with regard to jurisdictional claims in published maps and institutional affiliations.

