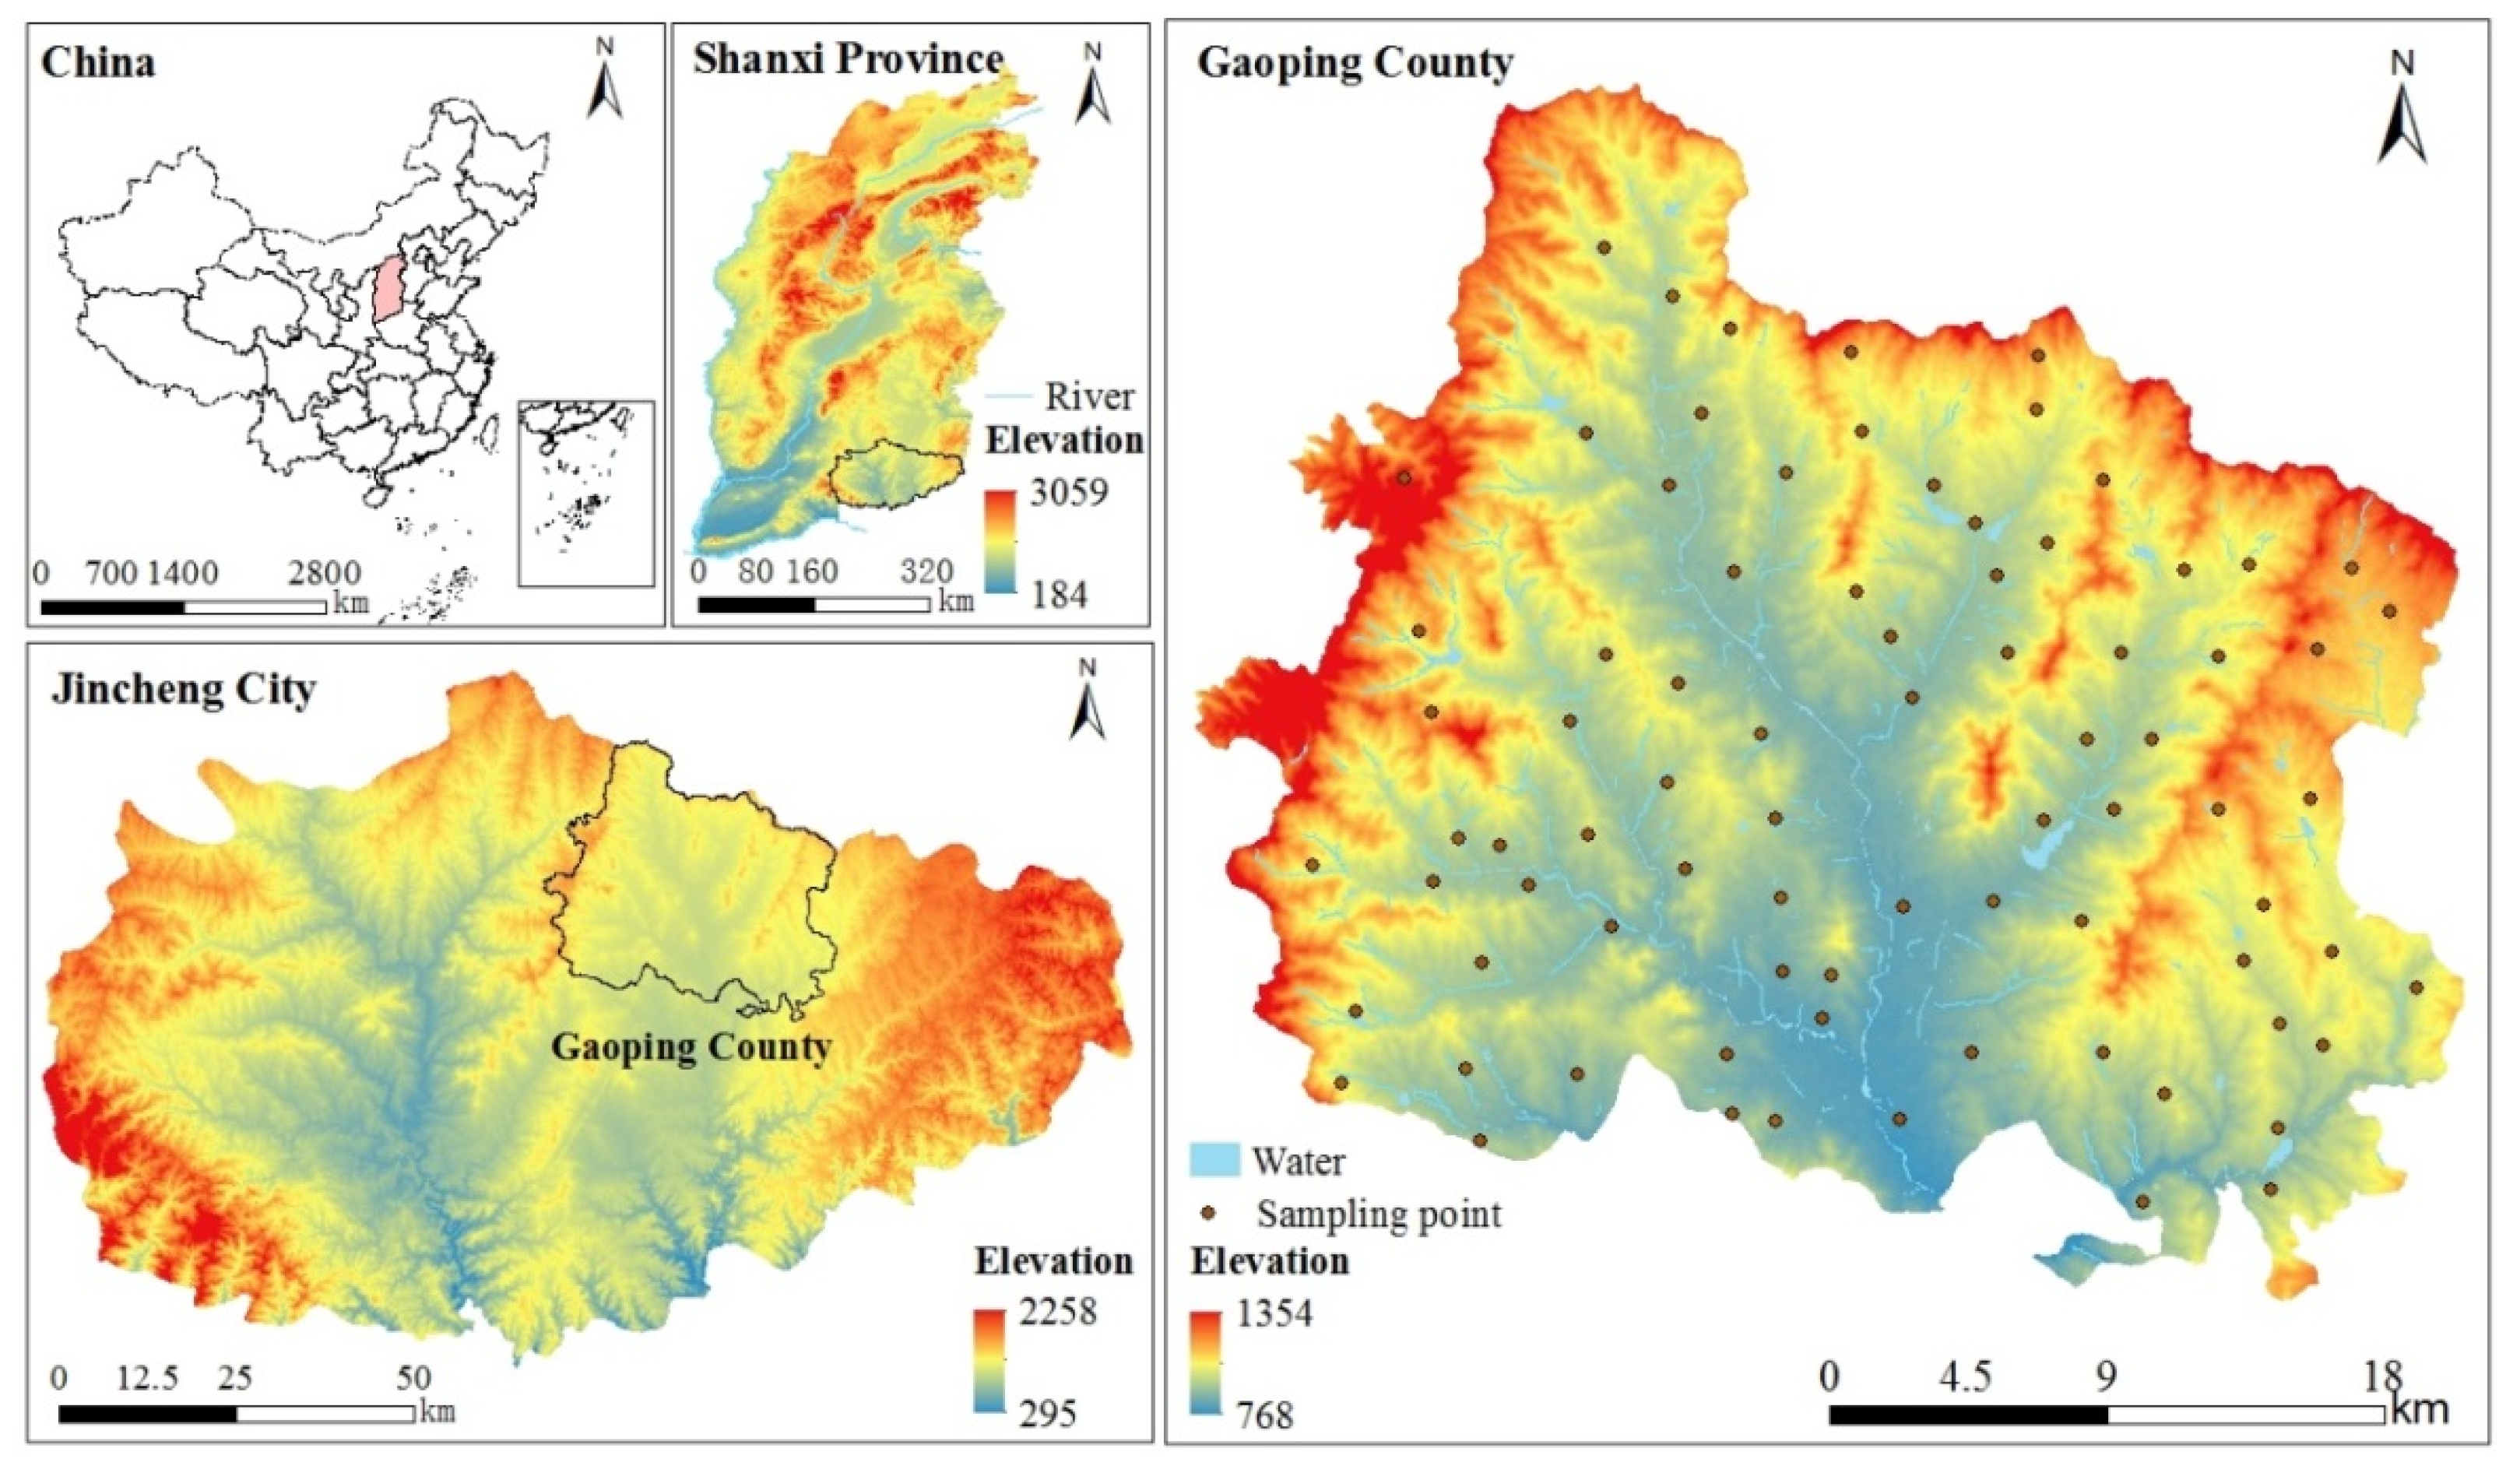
Article

Spatial Analysis of Cultivated Land Productivity and Health Condition: A Case Study of Gaoping City, China

1
School of Land Science and Technology, China University of Geosciences, Beijing 100083, China
2
Key Laboratory of Land Consolidation and Rehabilitation, Ministry of Nature Resources, Beijing 100035, China
*
Author to whom correspondence should be addressed.
Land 2021, 10(12), 1296; https://doi.org/10.3390/land10121296
Submission received: 10 October 2021 / Revised: 8 November 2021 / Accepted: 23 November 2021 / Published: 25 November 2021
(This article belongs to the Section Land, Biodiversity, and Human Wellbeing)

Abstract

:
Cultivated land production capacity (PC) is the basis for national food security. Health condition (HC) is an important parameter to indicate the ecological safety of arable land. The policy of “the trinity protection of quantity, quality, and ecology of cultivated land” is one of the important protection directions currently being implemented in China. However, the existing evaluation systems are diverse and overlapping, which mainly focus on the quality and production potential of cultivated land, with less attention paid to the health status and the relationship between them in China. In this study, a comprehensive PC evaluation system including factors such as climate, landform, soil, and utilization was constructed, and an HC evaluation system including internal and external factors was established to support the requirements of the trinity pattern protection policy. These new evaluation systems were applied in Gaoping city, China. The results showed that the average PC index was 1617.35 and ranged between 98.40 and 4321.53, with the largest area of the higher-grade accounting for 36.37% of the total cultivated land. The spatial distribution of PC showed a gradual decrease from the southwest to northeast regions. The average score of the HC of arable land in Gaoping was 79.86 and showed an increasing trend of low in the middle areas and high in the edge regions, which revealed the opposed spatial characteristics between human activity and health status. Approximately 2637.86 ha of the cultivated land was at the imbalance stage, indicating that this is where managers needed to focus. In general, the study offered a reference and a scientific basis for evaluating PC and HC and provided support information for sustainable cultivated land management.

1. Introduction

Cultivated land is the most valuable agricultural resources and production components [1]. Accurate assessment of arable land production capacity (PC) is fundamental to guarantee national food security [2,3]. The health condition (HC) of cultivated land can describe the state of cropland ecosystems and is closely related to the sustainable use of cropland [4,5,6]. As a traditional agricultural country, China’s food security is not only related to domestic food and clothing, and social order, but also affects the international food production environment [7,8]. China produces ~21% of the world’s food on 8% of the world’s agricultural land. The fertilization intensity is 2- to 3-fold higher than the global level [9,10]. Under long-term high load operation, cultivated land has reached the ecological threshold. More than 40% of arable land has been degraded, and a significant portion of the arable land has been contaminated [11,12]. Unsustainable land use practices have seriously threatened the food security and ecological security in China [13]. Therefore, it is necessary to establish a system that can evaluate the PC and HC of cultivated land and to analyze their relationship to obtain key information for the sustainable development of cultivated land.
The methods to evaluate the PC of cultivated land can be divided into four categories: comprehensive index method, limiting factor method, combination of limited and non-limited factor synthesis method, and model method [2,14]. Among these methods, an increasing number of studies has confirmed that the limiting factor method can more accurately reflect the actual production [15,16]. Liu et al. conducted a practical study in China using the limiting factor method, which confirmed the feasibility and suggested this method could solve the problems of uniform evaluation results and inadequate spatial description experienced by the comprehensive index method [14]. The traditional limiting factor method primarily considers the most limiting factors from the soil properties [15,17]; however, the productivity of cultivated land is affected by various factors (climate, topography, soil, and utilization factors) [5,18]. Therefore, in this study, we established a new framework to evaluate the PC, based on various factor types and using the limiting factor method.
With the increase of agricultural intensification, ecological problems such as soil erosion, pollution, and biodiversity loss are prominent. Agricultural activities have become the main cause of global environmental degradation [19,20], and protecting the HC of cultivated land is urgent. Cultivated land health evaluation systems can be divided into two categories [14]: (1) Cornell Soil Health Evaluation System of the United States [21], and (2) European Union Environmental Assessment of Soil for Monitoring Project [22]. The Cornell system focuses on the internal environmental characteristics of the soil, and the EU’s system focuses on the external threats to cultivated land caused by human activities. However, the HC of cultivated land is not only related to internal ecological conditions such as soil properties and soil pollution but also to other ecosystems and the external environment [23,24]. Therefore, based on the principles of systemicity and integrity, the HC should comprehensively consider the condition both inside and outside the ecosystem.
The coupling coordination relationship represents the degree of harmony between the two systems in the development process and can reveal the succession rule between them [25,26]. In the process of exploring the relationship between human beings and nature, the coupling coordination model has been widely used [27,28]. However, there are few studies on the coupling relationship between PC and HC. For the sustainable development of cultivated land, considering the dynamic changes and spatial distributions of PC and HC separately is insufficient; the coupling and coordination relationship between the two systems is fundamental in revealing the status of cultivated land.
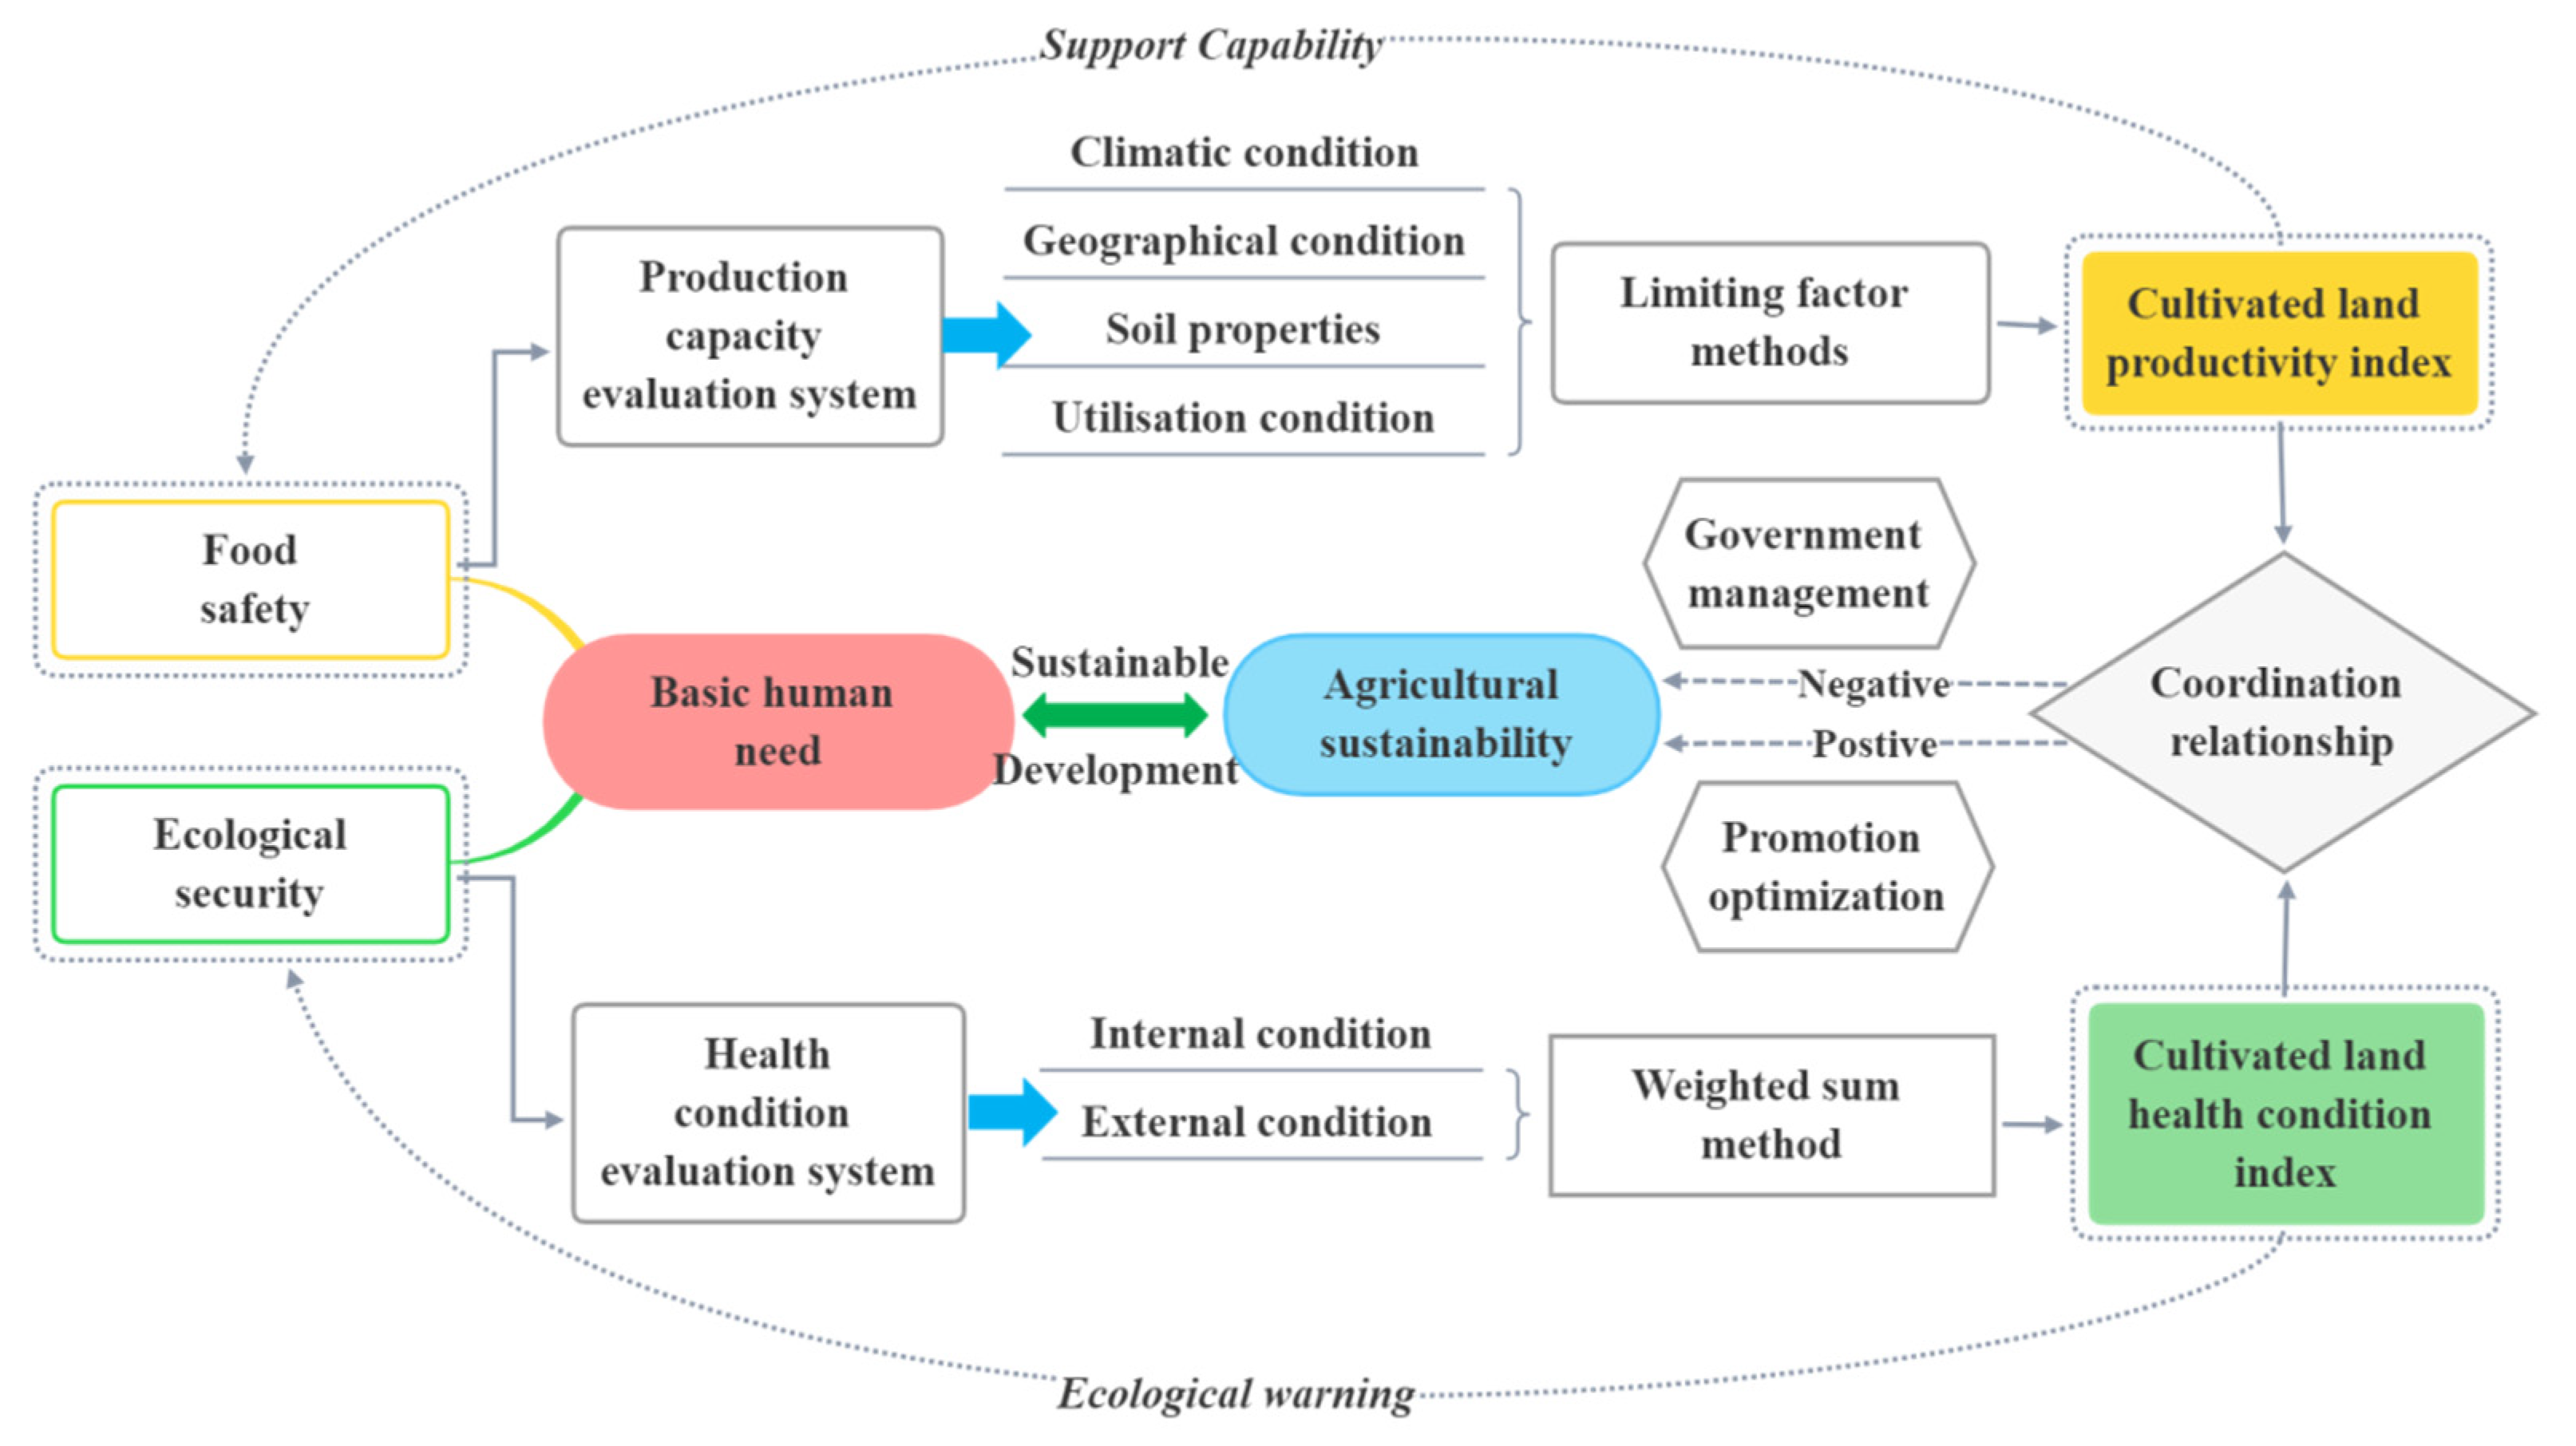
Therefore, we attempted to establish two systems: one to evaluate the PC by combining the limiting factor method and another to evaluate the HC based on internal and external health factors. The coupling coordination relationship between the production capacity index (PCI) and health condition index (HCI) was explored to provide a reference for the effective management of cultivated land.

2. Materials and Methods

2.1. Research Framework

Cultivated land is a composite system formed by the synergy and antagonism of the natural ecosystem and the socio-economic system [29]. In natural ecosystems, factors such as water, soil, and air conduct a variety of physical, chemical, and biological processes that establish the basic environment for crops. In the socio-economic system, humans invest agricultural capital and technology in arable land to get more benefits, which may improve the crop growth environment and the productivity of arable land but may also deteriorate the ecological environment and reduce productivity.
As a special natural resource, multiple land management departments have successively issued a number of national standards to evaluate the PC and HC to better utilize and manage the cultivated land in China, among which the most important departments include the Ministry of Natural Resources, Ministry of Agriculture and Rural Affairs, and Ministry of Ecology and Environment (Table 1). The differences in roles and objectives between departments have led to differences of opinion on the content and methods of the various evaluation systems. The aim of the “Gradation Regulations for Agricultural Land Quality” (GB/T 28407-2012) is to evaluate the natural production potential and utilization potential of arable land based on climatic conditions, soil properties, and utilization status; the “Cultivated Land Quality Classification” visualizes the physical geography and ecological conditions of cultivated land; “Cultivated Land Quality Gradation” (GB/T 33469-2016) evaluates the soil properties, infrastructure, and biodiversity of arable land from soil fertility perspective; the compilation of “Soil Environmental Quality ‘Risk Control Standard for Soil Contamination of Agricultural land’” (GB 15618-2018)is led by the Ministry of Ecology and Environment, which focuses on the pollution of agricultural land soil and primarily aims to evaluate the contents of 8 heavy metals and 3 organic pollutants; and the “Technical Criterion for Eco-System Status Evaluation” (HJ 192-2015) primarily illustrates the condition of the ecological environment. The assessment of the PC and HC of arable land varies between different departments, which limits the implementation of the trinity pattern protection policy [5].
Therefore, in the context of the unified management of natural resources, it is necessary to integrate the existing arable land evaluation system and establish a scientific, comprehensive, and unified arable land protection evaluation system. Based on the integration of the existing evaluation systems and the proposed innovative pathways, we established a new evaluation framework (Figure 1), which consists of two independent evaluation systems based on human needs: PC and HC. The PC evaluation system focuses on the grain yield to support food safety. The HC evaluation system focuses on ecological security to realize ecological protection. Finally, the relationships between the two systems are analyzed.

2.2. Evaluation System of Cultivated Land PC and HC

Based on the principle of absorbing existing achievements, highlighting priorities, and avoiding overlap, we have established a system of indicators for PC and HC, respectively.

2.2.1. PC Evaluation System

Climate, soil, topography, and utilization conditions are the principal factors affecting the capacity of arable land [5]. Climatic conditions play a controlling role in the production of crops and determine the primary productivity of arable land. The solar and temperature or climatic potential productivity and yield ratio in the “Regulation for Gradation on Agriculture Land Quality” (GB/T 28407-2012) can quantify the highest production capacity of cultivated land. Therefore, these two indicators are used to evaluate climate conditions. Geomorphic conditions change the direction of energy flow and determine the redistribution of hydrothermal conditions. Geographical conditions are used in the “Cultivated Land Quality Grade” (GB/T 33469-2016), so the land surface slope and topographic position are used for assessing local geographical conditions. The soil conditions reflect the basic soil fertility determined by the physical and chemical properties of the soil, which are the main aspect of the “Cultivated Land Quality Grade” (GB/T 33469-2016). In the “Regulation for Gradation on Agriculture Land Quality” (GB/T 28407-2012), soil indicators are also used. Therefore, two standard complementary sets are taken, and 6 factors such as organic matter, pH, soil texture, available soil depth, etc., are selected to represent soil properties. Utilization conditions reflect the utilization efficiency of cultivated land and affect the degree of realization of cultivated land production potential [30], so 4 indicators in “Regulation for Gradation on Agriculture Land Quality” (GB/T 28407-2012) are adopted to represent the utilization level, including the guaranteed rate of irrigation water, land parcel conditions, farmland accessibility, and road accessibility.
Climatic factors determine the basis of productivity, are largely stable in small areas, and are not easily altered by humans. Geomorphology, soils, and utilization conditions are the dominant factors that determine the variation of cultivated land productivity in a small area and are also easily influenced by human activities [31,32]. Therefore, we classified geomorphology, soils, and utilization conditions as the limiting factors and climatic factors as the non-limiting factors (Table 2).

2.2.2. HC Evaluation System

The cultivated land HC refers to healthy cultivated soils and sustainable and stable farmland resource utilization ecosystems, which have comprehensive and systematic characteristics [33]. Healthy cultivated land not only maintains its own system functions, it also cannot be polluted during the use process, and the discharged substances do not cause harm to other ecosystems [34]. Therefore, the HC was quantitatively analyzed from the internal and external perspectives of the cultivated land (Table 3).
The internal HC mainly reflects the soil health, with soil heavy metals and earthworm factors selected for characterization. Compared with other ecological factors, soil heavy metal pollution can not only cause soil degradation and reduce biodiversity but can also harm human health through the food chain. Only healthy cultivated land can guarantee healthy food. Therefore, 8 heavy metals in “Soil Environmental Quality ‘Risk Control Standard for Soil Contamination of Agricultural land’” (GB 15618-2018) are adopted to represent the cleanliness of the soil. Soil biodiversity plays a key role in driving ecosystem processes and functions, which are important indicators of soil health [35,36]. Biodiversity is one of the factors used to evaluate the soil health in the “Cultivated Land Quality Grade” (GB/T 33469-2016). However, due to the complexity of the environment, this indicator is only a qualitative description and lacks a quantitative and precise assessment. As “ecological engineers” in terrestrial ecosystems, earthworms’ sensitivity to the environment gives them an advantage as indicator organisms of soil health, and this has been applied to practical research by Zhao [5] and Cooper et al. [37].
The external HC mainly reflects the impact of land use on the ecosystem and is characterized by habitat quality and vegetation cover. Habitat quality determines the biodiversity condition in a region and is an important indicator of ecosystem health [38,39]. Vegetation cover is an important indicator reflecting the growth status of surface vegetation communities and describing ecosystem changes. Analyzing the vegetation cover of arable land is important to evaluate the environmental quality and ecological processes of arable land ecosystems. Therefore, the “Technical Criterion for Eco-System Status Evaluation” (HJ 192-2015) is taken as the reference for the elements of external HC when selecting habitat quality and vegetation cover indicators.

2.3. Study Area

Gaoping City is (112°40′–113°10′ E and 35°40′–36°0′ N) located in the southeast part of Shanxi Province (Figure 2). It is surrounded by mountains on three sides, with elevations ranging from 768 m in the center to 1354 m on the side. Influenced by geotectonic activity, different types of natural landforms have formed, and the region can be divided into river valley flat, loess hilly, and low–moderate elevation mountainous areas. The study area has a warm temperate zone continental monsoon climate with an annual average temperature of 9.2–10.8 °C and annual average precipitation of 305–1115 mm, which is suitable for corn, wheat, and other food crops. The cultivated land area of the region is 53,389.73 ha, accounting for 54.44% of the total area. In 2015, the grain production in Gaoping was 270,642 tons, making it the main crop production county in Shanxi Province. In recent years, the increase in urbanization, high intensity use, and coal mining activities have caused serious threat to arable land and the surrounding ecological environment (e.g., ground subsidence, soil erosion, and pollution). Therefore, the PC and HC of cultivated land resources should be analyzed rationally to formulate protection schemes for improving the contradiction between food security and ecology.

2.4. Methods

2.4.1. PC Evaluation Methods

The limiting factor method was used to calculate the arable land capacity. First, the regional cropping system was identified based on the “Regulation for Gradation on Agriculture Land Quality” (GB/T 28407-2012) and the actual situation in Gaoping. The farming system was designed based on the principle of “maximizing the production potential of arable land without damaging the sustainability of the use of arable land”, including one or multi-harvests in a year, three harvest in two years, etc. Based on the cropping system, the solar and temperature or climatic potential productivity and yield ratio coefficients are calculated as the basis for PC (Table S1). Then, the minimum values of the measurable parameters in the other factors of each patch were screened to form a limiting factor dataset. Subsequently, the PCI was calculated using the limiting factor dataset corrected for climatic conditions, as follows:
L l i m i t = i = 1 n A i 100   ( n = 1 ,   2 ,   3 )
where Llimit is the correction index of the limiting factor dataset, Ai is the score of the most limiting factor, and n is the number of limiting factors.
PCI = { ( α h × β h ) × L l i m i t                               ( O n e   o r M u l t i h a r v e s t   i n   a   y e a r ) ( α h × β h ) 2 × L l i m i t                                                   ( T h r e e   h a r v e s t   i n   t w o   y e a r s )    
where α is the solar-temperature or climatic productivity, β is the yield ratio coefficient, and h is the appointment crop.
The land parcel condition has a great influence on agricultural mechanization and farmland management, which can be calculated by the shape index.
S = P i 4 a i  
where S is shape index, ai is the area of the ith land parcel (m2), and Pi is the perimeter of the ith land parcel (m).
The farmland accessibility and road accessibility represent the convenience to accommodate the transport of agricultural materials, farming, and other agricultural production activities. The index was calculated by near toolbox in ArcGIS 10.3.

2.4.2. HC Evaluation Methods

In the HC evaluation process, the comprehensive index method was used to calculate the internal and external HCI (IHCI and EHCI, respectively) of the cultivated land. Subsequently, the linear weighting method was used to calculate the HCI as follows:
H C I = E 1 δ 1 + E 2 δ 2  
E i = i j n B i j λ i j
where Ei = 1,2 represents the IHCI and EHCI of cultivated land, respectively, and Bij and λij represent the scores and weights of health measurable parameter, respectively. δ1 and δ2 are the weights of internal HC and external HC, respectively.
In the internal health conditions, the soil heavy metals were evaluated by the Nemero pollution index. Screening of 8 soil heavy metals cadmium, mercury, arsenic, lead, chromium, copper, nickel, and zinc was used to comprehensively evaluate the risk of regional soil heavy metal pollution.
P = ( 1 n P i ) 2 + P i m a x 2 2  
P i = C s i C n i    
where P is the Nemero pollution index and Pimax is the maximum values of the single factor pollution index for heavy metals. Pi is the single factor pollution index of soil heavy metal I, C s i is the measured content of soil heavy metal I, and C n i is the standard value for soil heavy metal i. In this paper, the risk-screening values specified in “Soil Environmental Quality ‘Risk Control Standard for Soil Contamination of Agricultural land’” (GB 15618-2018) was used as the evaluation criterion. The risk-screening values are the threshold valuea currently set in China, which provide an objective indication of whether soil heavy metal contamination threatens the growth of plants and animals, the safety of agricultural products, the soil ecosystem, and human health.
Earthworm populations can provide a useful indicator of overall soil biological health [37]. The maximum entropy model (MaxEnt), a machine learning program based on maximum entropy that can predict the distribution of species based on environmental variables [40], was used to simulate the spatial distribution probability of earthworms. This model is based on known species distribution and related environmental variables to infer the ecological needs of species, and then the potential distribution of species can be predicted [41,42]. We input the earthworm sample and relevant environmental variables (cation exchange capacity, pH value, silt content, soil organic carbon storage, altitude, slope, distance from residential areas and roads, and soil family) into the MaxEnt model to obtain the distribution of earthworms in study area.
For the external health conditions, the improved dimidiate pixel model was used to invert the vegetation coverage [43].
F V C = N D V I N D V I m i n N D V I m a x N D V I m i n  
where FVC is the vegetation coverage; NDVI is the normalized vegetation index; and NDVImin and NDVImax are the values of bare soil or no vegetation cover area and high vegetation cover area, respectively. Based on the research methods and results of Li [43], and Zhao et al. [44], we adopted 5% and 95% confidence levels for NDVImin and NDVImax, respectively.
The habitat quality characterizes the ability of an ecosystem to support individuals and populations for sustainable survival and development. The InVEST 3.9 model developed by Stanford University is an important way to quantify the regional ecological status, which has been widely used in the field of ecology. In this study, the InVEST Habitat Quality module was used to calculate the habitat quality of cultivated land. The sensitivity of habitat type, maximum distance and weight of the threat factors can be found in Tables S2 and S3.

2.4.3. Coupling and Coordination Relationship between PC and HC

The coupling coordination function model is an effective method to measure the coordination degree between two or more interactive systems, which can reflect the degree of dependence and restriction between systems [45,46]. The coupling coordination degree function model between the PC and HC was constructed as follows [47]:
C = [ f ( y ) × g ( x ) ( ( f ( y ) + g ( x ) ) / 2 ) 2 ] 1 2
T = f ( y ) × γ 1 + g ( x ) × γ 2
D = C × T
where f(y) and g(x) are the systems of PC and HC, respectively; C is the coupling degree; T is the total comprehensive development score; γ1 and γ2 represent the importance of the two systems (as we believe that PC is as important as HC; γ1 and γ2 were both 0.5; and D is the degree of coupling and coordination between the two systems, ranging from 0 (worst) to 1 (best)). Based on the studies of [25], we divided the coupling coordination index into ten basic types according to the differences in the PC and HC system (Table 4).

2.5. Data Sources

The basic data required for this study included geospatial data and field sampling data (Table 5). Field survey sampling was carried out from 27 April to 3 May 2018. In the early stage, a total of 80 field survey sample points were set. The number of earthworms was investigated by digging square sample pits (l × w × d: 0.5 × 0.5 × 0.3 m). During the sampling process, the coordinates, weather, crop type, and soil conditions were recorded, which facilitated the inversion of soil earthworm indicators.

2.6. Scoring and Weight for the PC and HC Index System

To convert data of different scales into a uniform standard, scoring rule tables (Table S4) for geomorphology, soil, and utilization status evaluation factors were established based on “Cultivated Land Quality Grade” (GB/T 33469-2016), “Regulation for Gradation on Agriculture Land Quality” (GB/T 28407-2012), and previous studies [14,33].
Because a unified classification standard for the health indicators does not exist, the natural breakpoint method was used to divide the score (except for heavy metals) into five grades (Table S5).
As for the HC indicator weights, the internal and external HCs combined to determine the overall form of arable land health; in other words, they were equally important in maintaining the health system, so we gave the same weight to the IHCI and EHCI. In terms of internal HC, soil heavy metals pose a stronger threat to ecological security, and arable land that exceeds the risk control value of soil pollution is required to prohibit the cultivation of edible agricultural products. Therefore, soil heavy metals were given more importance in the analytic hierarchy process compared to earthworms. In external HC, vegetation coverage describes the growth and changes of crops in the cultivated land ecosystem. Habitat quality focuses on the disturbance of other ecosystems to cultivated land ecosystems. The two indicators had their own emphasis, so they were given equal importance in the analytic hierarchy process. The weights of all indicators were considered as the final result (Table 6) after the consistency of three land management experts.

3. Results

3.1. Cultivated Land Productivity

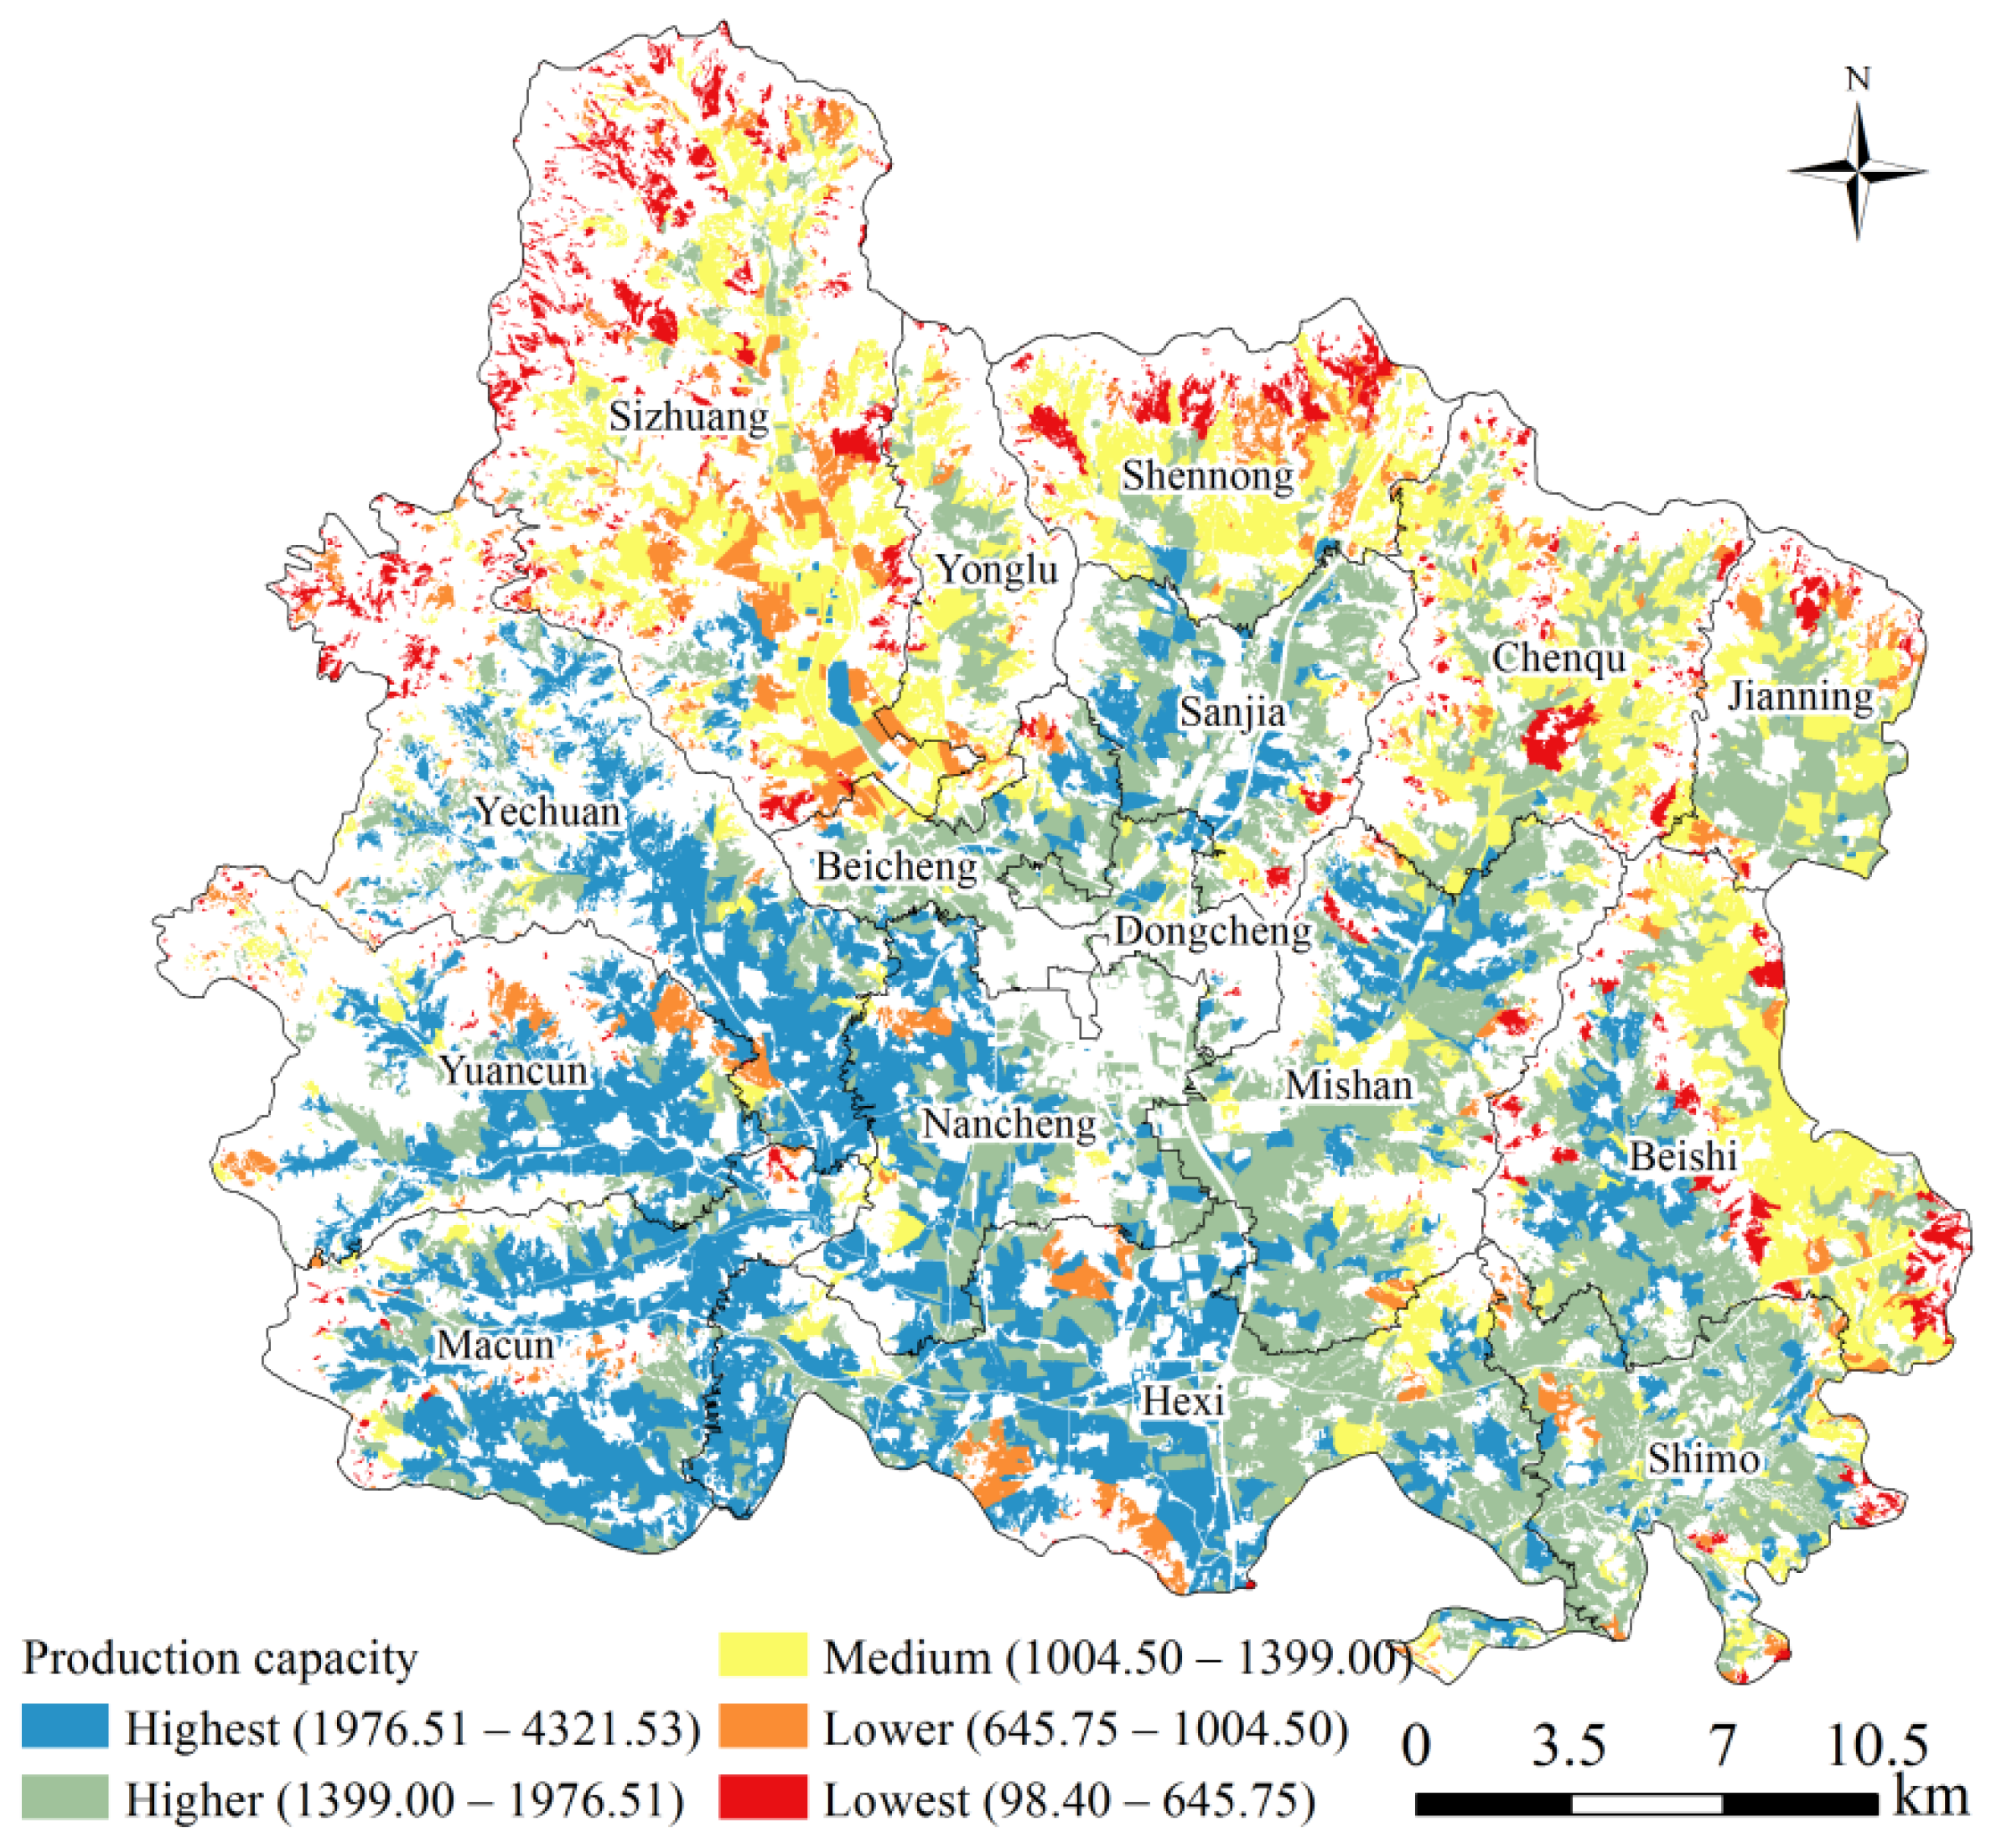
The comprehensive value of PC in Gaoping was 98.40–4321.53, and the average of the entire county was 1617.35, calculated using the area weighted average method. The natural breakpoint method was used to classify the PC into five levels (highest, higher, medium, lower, and lowest), and the spatial distribution condition was visualized using ArcGIS 10.3 (Figure 3). Among the five levels, the higher-grade regions dominated, and the area was 19,419.78 ha, accounting for 36.37% of the total cultivated land. The highest and medium grade followed, which accounted for 29.14% and 22.00% of the total area of cultivated land, respectively. The lowest grade area was last with only 2826.31 ha, which accounted for 5.29% of the total cultivated land.
The spatial distribution of PC showed a gradual decrease from the southwest to northeast regions. The highest-grade areas were mainly distributed in the irrigated area in the western and south-central plains region (e.g., Hexi and Yuancun town). The higher-grade areas were mainly concentrated in the south plain area, including Hexi, Mishan, and Shimo. These regions had excellent environmental conditions for crop growth, such as abundant precipitation, suitable climate, and flat terrain. The arable land of medium grade was mainly distributed in the eastern and northern areas, including the townships of Yonglu, Beishi, and Chenqu. The lower-grade areas were mainly scattered in the northern region. Finally, the lowest grade arable land was mainly distributed in the northern edge area, where the terrain is high and mostly terraced, which is not suitable for crops. In general, the landforms change regional climatic and topographic conditions. The productivity of arable land is high in the plains, followed by the river valleys, and lowest in the mountainous northwest region. Meanwhile, factors such as soil texture, organic matter, and utilization conditions have a large impact on PC in local areas.

3.2. Cultivated Land Health Condition

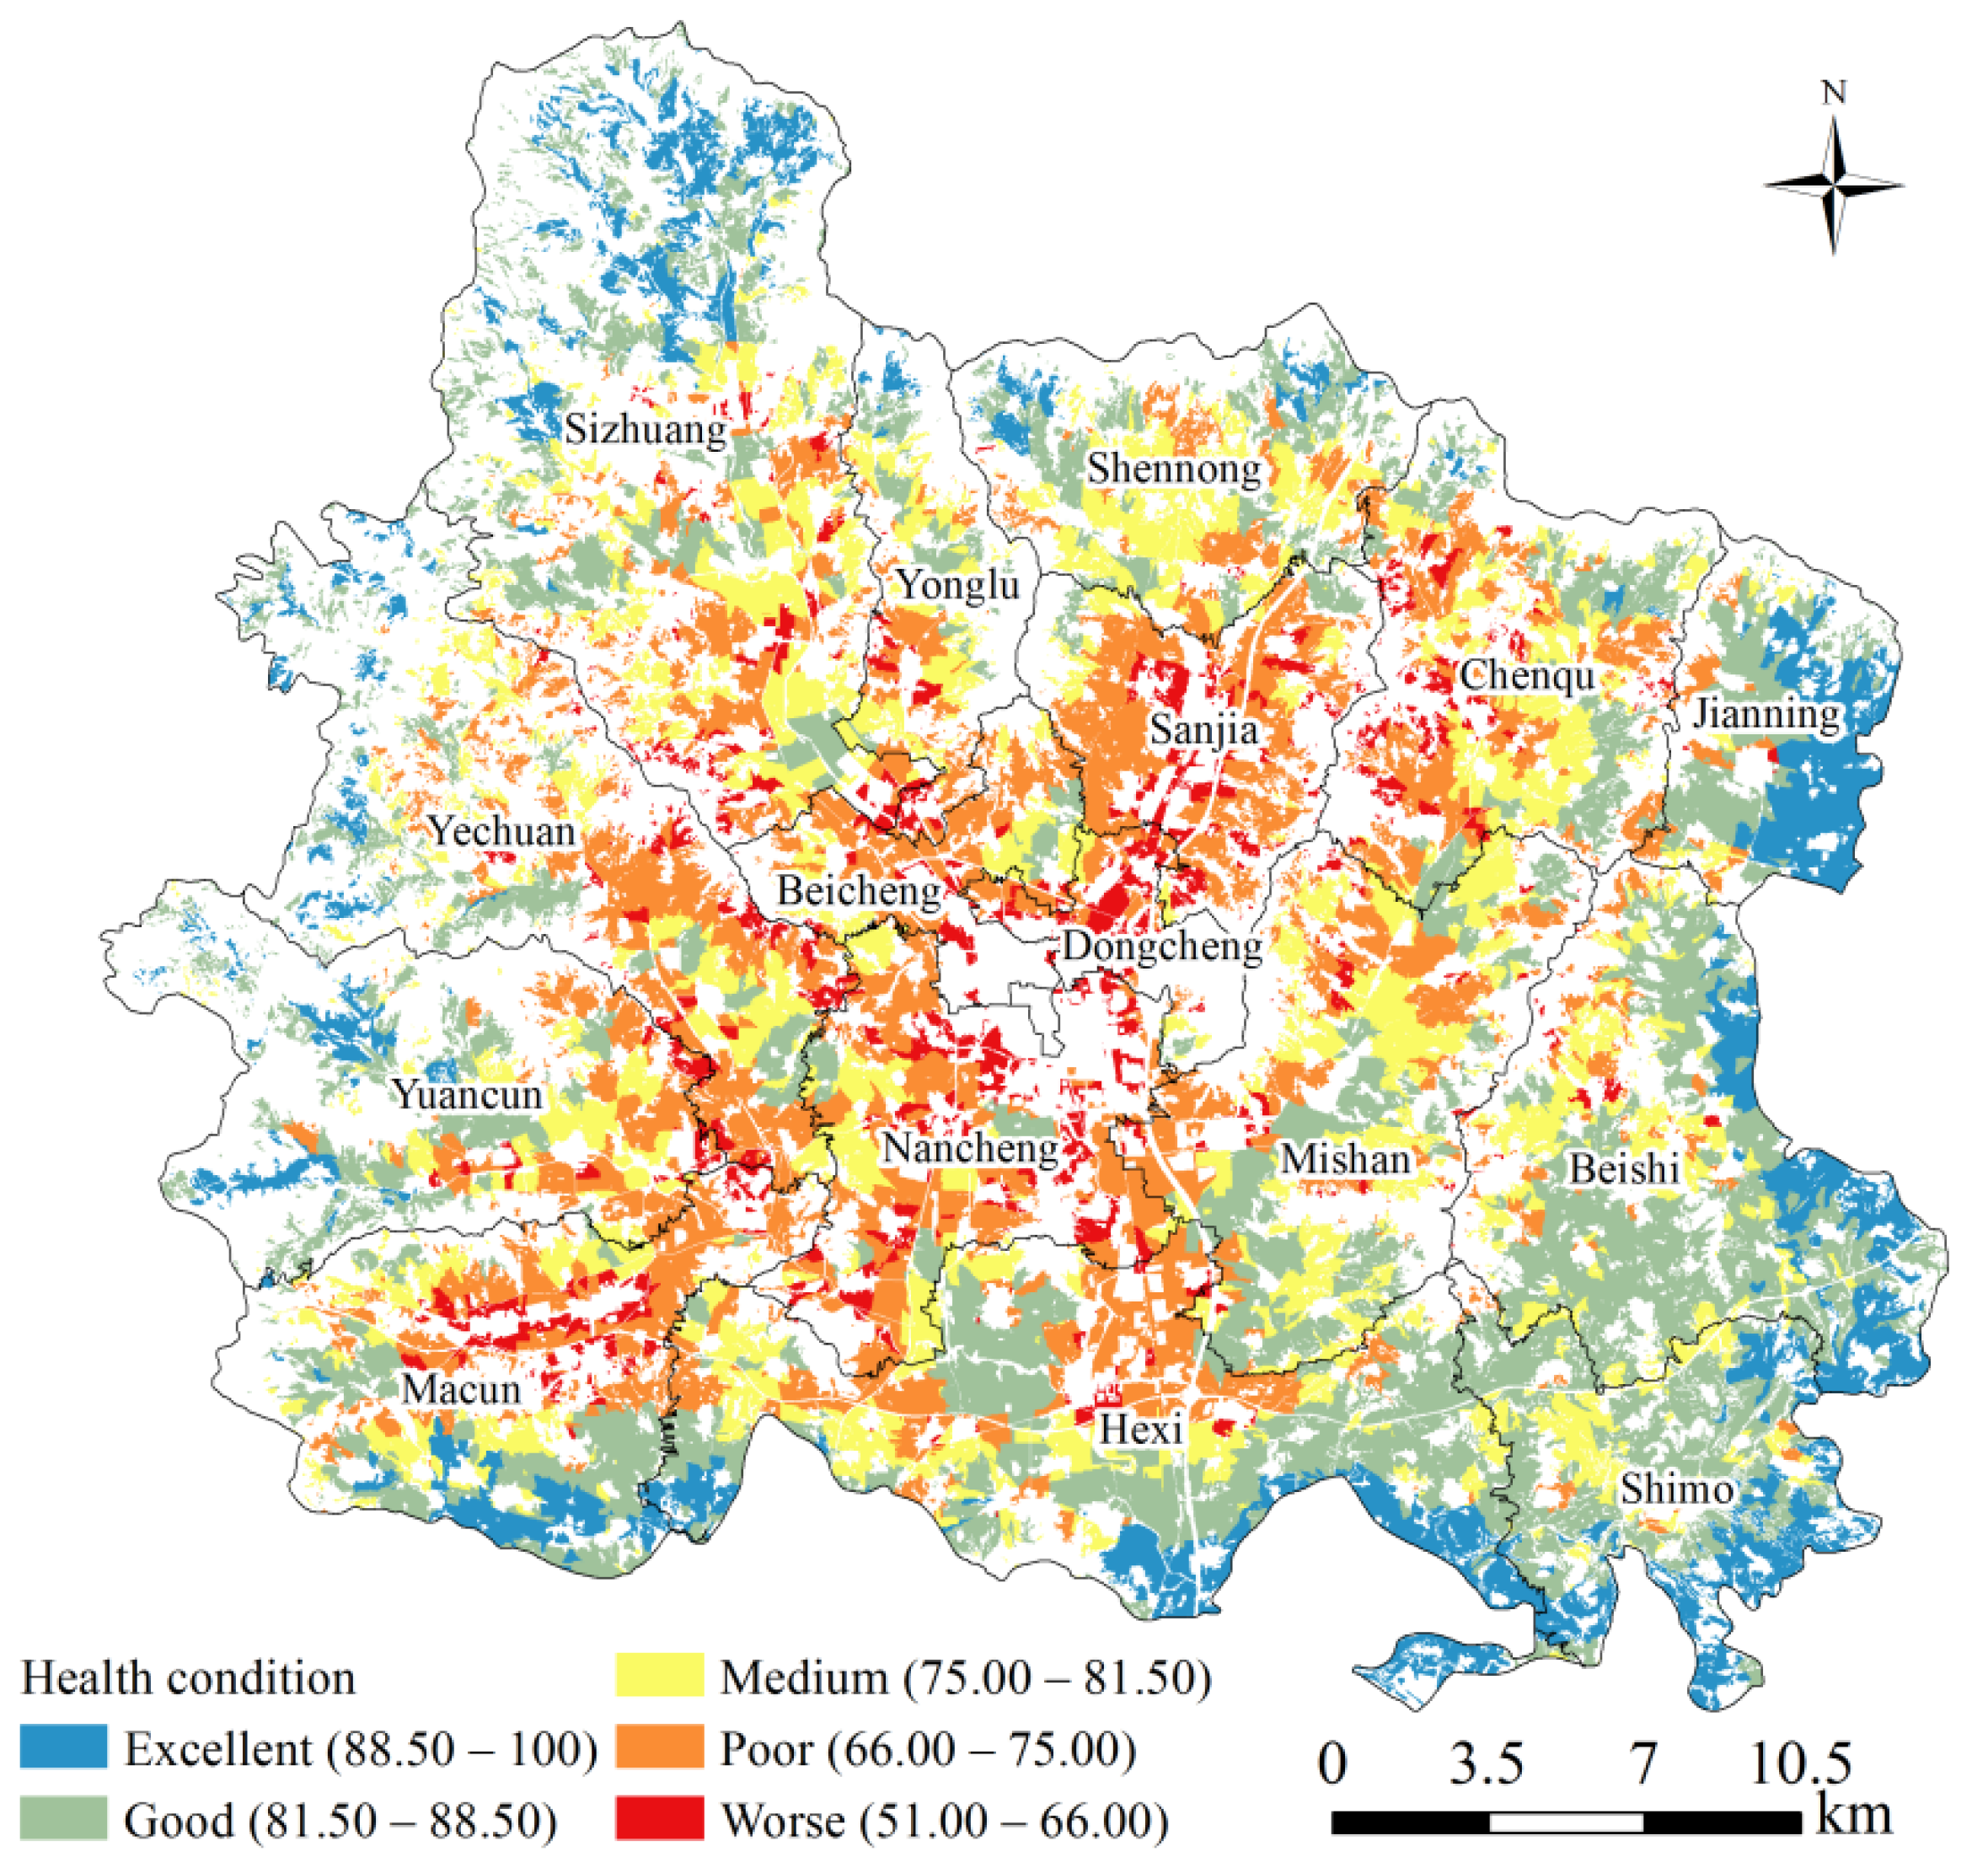
The average score of the HC of arable land in Gaoping was 79.86. The natural breaks method was used to divide the HC into five levels; Figure 4 shows the spatial distribution characteristics of each level. Overall, the HC score exhibited a low trend in the middle areas and high trend at the marginal region. There were obvious differences in the spatial distribution of different grades of arable land HC. Land of good grade accounted for the highest proportion (33.42%; 17,841.74 ha) of the total cultivated land. The good-grade land was scattered throughout the region but was mainly concentrated in the southeastern region, including Shimo and Beishi. This was followed by medium-grade land, which constituted 17,118.73 ha (32.06%) of the total cultivated land, which was mainly located at bands along the ridges of the central region. The cultivated land with the best ecological conditions was mainly distributed in the peripheral areas of the county. The complex terrain, distance from towns and cities, and the low human disturbance explained the high health quality. The poor and worse HC areas accounted for 16.98% and 5.27% of total cultivated land area, respectively; they are scattered throughout the entire region and are generally adjacent to urban residential areas.
This result is consistent with the urban layout, where health scores spread from low to high in a largely circular pattern. The lower scores were concentrated in both the central city and the settlement areas, where frequent human activity, the strong disturbance of arable systems by other ecosystems, the low probability of earthworm distribution, and the occurrence of heavy metal pollution are the main reasons for the poor or worse level of health of the arable land in these areas. In the marginal areas, although areas exist with low vegetation cover, these areas are less threatened by other ecosystems and have high habitat quality scores, along with a high earthworm distribution, combining to form the high score results. Generally, human activities strongly impact health conditions of cultivated land.

3.3. Coupling Coordination Relationship

There was a complicated mechanism between PC and HC. Healthy cultivated land was the foundation that supported productivity, and unhealthy cultivated land was often accompanied by land degradation and pollution. Excessive intensive use was an important contributor to the deterioration of HCs. Therefore, analyzing the spatial matching characteristics and coupling coordination relationship between PC and HC was beneficial to the differentiated protection and detailed management of the arable land, which was significant to the sustainable development of arable land.
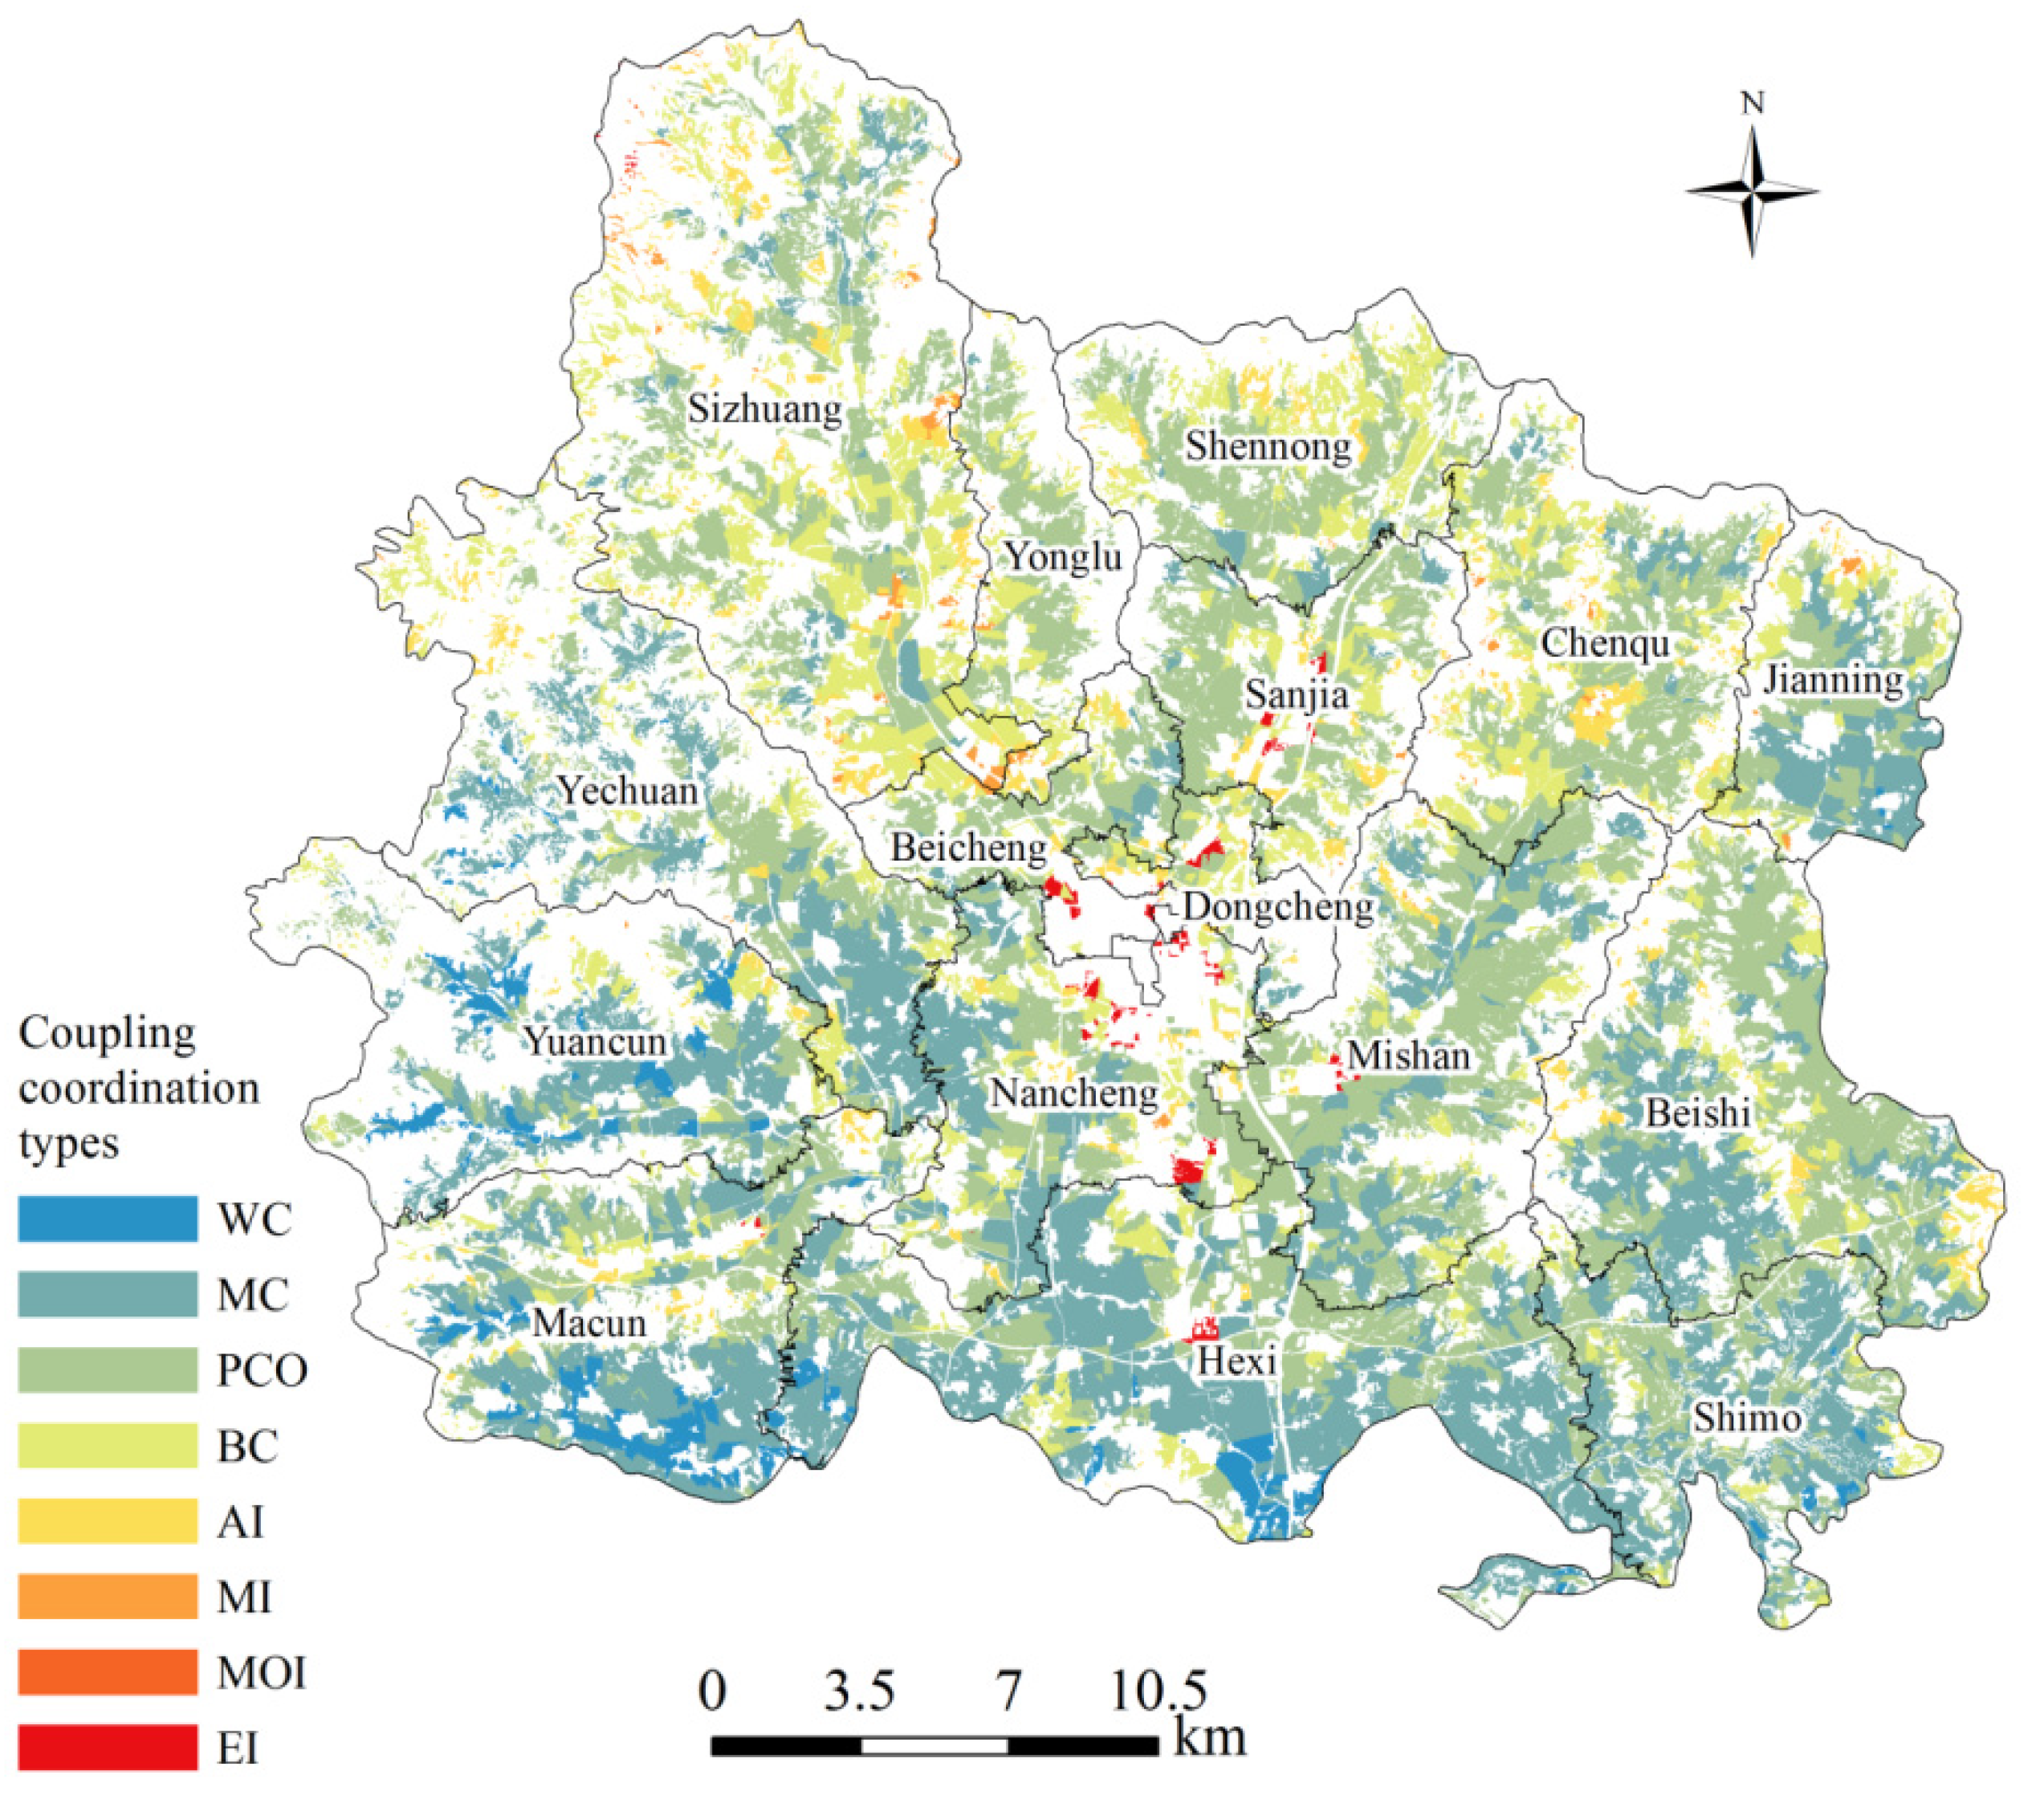
The coupling coordination degree of PC and HC ranged between 0.05 and 0.895, with a mean value of 0.66, indicating that PC and HC were in the primary coordination stage in Gaoping City. Figure 5 showed the spatial distribution characteristics of the coupling coordination degree. The coordination stage covered most of the area, and the WC, MC, and PCO were mainly concentrated in the southern region of Gaoping, while the imbalance stage was mainly distributed in the central and northern region. Coordination and imbalance transitioned through BC and AI stages, which were mainly distributed in the north-central region.
In the study region, the PCO, MC, and BC were dominant, accounting for 45.24%, 31.80%, and 15.36% of the cultivated land, respectively. There was no cultivated land with QC and SI stages in the entire city. The area shares of MI, MOI, and EI stages were all <1%, which were 260.48, 4.25, and 252.95 ha, respectively. Following this, the WC and AI accounted for 2.66% and 3.97%, respectively, and cover 3541.26 ha of the total cultivated land area.
The coupling coordination relationship of PC and HC varied widely in the administrative division of the town (Table 7). The WC stage was mainly concentrated in Hexi, Macun, and Yuancun, accounting for 25.67%, 33.90%, and 32.00%, respectively. The MC stage had the largest area in Hexi town at 4155.44 ha, followed by Shimo and Yechuan at 2019.20 and 1946.59 ha, respectively. The BC and AI stages were mainly concentrated in Sizhuang town, accounting for 25.48% and 28.42%, respectively. Likewise, MI had the largest distribution in Sizhuang at 171.06 ha, and the MOI was only distributed in Sizhuang at 4.25 ha. The EI was mainly concentrated in the central region, which mainly included Beicheng, Nancheng, and Hexi towns.

4. Discussion

4.1. Evaluation Model Analysis

Since the factors affecting cultivated land productivity are not equally important, discovering their interrelationship has become a major direction of research. The “law of minimum” proposed that crop growth and yield depend on a minimum number of factors. This indicates that the plant will change relative to the smallest factor within a range. It is difficult to influence the growth of the plant when this limiting factor is overlooked, even if other nutrients continue to be added [2,48]. In practical research, many scholars have analyzed the impact of limiting factors on cultivated land productivity [49,50,51]. Wen et al. proposed that the productivity of cultivated land is mainly affected by limiting factors [33]. An increasing number of studies have confirmed that there is a good correlation between cultivated land productivity calculated using the limiting factor method, and the grain yield [15,16]. The accuracy of the results and the reliability of the methodology were verified in this study by establishing correlations between actual standard grain yields and indexes in 16 townships. We compared the advantages of PCI and the existing national utilization quality index (NUQI). The NUQI was produced from the Gaoping County Cultivated Land Quality Grade Update Database, which executed “Regulation for Gradation on Agriculture Land Quality” (GB/T 28407–2012) by the Ministry of Natural Resources of China. Figure 6 shows the correlation between standard grain yield and each index. Although all R2 were relatively low, the results of this study correlated better with standard grain yield (R2 = 0.29) compared to NUQI (R2 = 0.08). The reason for the poor correlation may come from the fact that the township yield data weakens the intra-township variation, especially in the study area where the terrain is complex and yield variation is evident. Therefore, it is necessary to investigate the yield data of plots in the future to further optimize the research content.
Many researchers focused on the soil fertility and climatic conditions during the process of cultivated land productivity evaluation. For example, the Storie index and the M-SQR method mostly use soil attributes to evaluate cropland capacity [52,53]; meanwhile, the AEZ model considers more climatic conditions. However, in local areas, terrain and infrastructure conditions will also significantly affect the PC of cultivated land. Therefore, we constructed a relatively comprehensive evaluation system for cultivated land productivity, with indicators of the land surface slope, topographic position, and utilization conditions, combined with the indicators of the climatic conditions and soil properties.
The health of cultivated land is closely linked to human activities [54]. Therefore, from an ecosystem perspective, we analyzed human disturbance to cultivated land and established a cultivated land health evaluation system. We established the evaluation system from both internal and external perspectives, which makes up for the deficiency of the studies by Tan [55] and Zhao [5], which only focused on the external environment or soil health unilaterally.

4.2. Analysis of Coupling Coordination Influence Factors

Research on the path of cultivated land protection needs to be oriented toward the actual “shortage” of cultivated land. Analyzing the structural relationship between PC and HC can identify factors that limit the coupling and coordination of farmland systems and provide directional guidance for farmland conservation.
Figure 7A shows that the climatic conditions scores as the coupling coordination degree decreases. However, high climate scores appear in the EI stage, which was mainly due to the poor health. At the EI level, the external HC and internal HC of arable land were in a lagging state, both significantly below the average, and were the main factors limiting coupling coordination (Figure 7C).
In the coordination stage (Figure 7B), all indicators of the WC and MC were higher than the average stage, and the BC stage indicators were all lower than the average stage. In addition to the WC, MC, PCO, and BC all exhibited poor levels in external HC. Croplands in these stages were the priority areas where managers need to enhance the external ecology. Compared with other stages, the BC grade had a lower soil property score. Improving soil attribute elements was an important measure for the coordinated development of the BC stage, combined with the cropland productivity limiting factor.
In the imbalance stage (Figure 7C), the factors showed significant variability. Soil properties had the lowest scores in both AI and MI, at 45.61 and 44.64, respectively, which were the main factors limiting the coupling coordination. These cultivated lands are mainly distributed in the northern region and along the sides of the mountain, including Sizhuang and Chenqu. These areas have higher altitudes, and the soil types are mainly mountain cinnamon soil and skeletol cinnamon soil. The main limiting factors are the available soil depth and gravel content, with soil properties scores mostly between 30 and 50. The soil cultivability is poor, which limits the growth of crops. The ranking of each factor score in the MOI was as follows: external HC > internal HC > utilization conditions > geographical conditions > soil properties. The low productivity and high health conditions placed these arable lands in the MOI stage. These arable lands are concentrated in the Sizhuang, with a fragmented distribution of plots. The available soil depth and the topographic position limit the soil fertility and the geographical condition, which are the main reasons for the productivity. Instead, these areas are located in the northernmost part of the county, which is less disturbed and has a good ecological environment. In the future, the production capacity can be gradually increased while ensuring that the ecological environment is not damaged. In the EI, the opposite situation to the MOI was presented, where 97.88% of arable land had a higher PC than HC. Between them, external HC was the main limiting factor. These arable lands are mainly distributed around the central city, including Nancheng, Beicheng, and Sanjia. These areas are strongly affected by human disturbance, especially the threat of other ecosystems to the cultivated land system, resulting in a significantly lower habitat quality than other areas. At the same time, these areas also have the problem of low vegetation coverage. These reasons lead to low external HC and limit the coupling and coordination relationship. In the future, the land management department should reduce the threat of external ecosystems to farmland ecosystems. In the context of ensuring food security, formulating reasonable use planning is an effective measure to solve this problem [56]. By delimiting the growth boundaries of urban and rural areas, we can reduce the occupation of cultivated land by construction land. Reasonable layout of railways, highways, and other projects and protected ecological corridors for animal migration is needed. Second, it is necessary to improve the biodiversity of the farmland ecosystem. Many studies have shown that increasing the variety of crops or improving non-biological diversity around farmland can improve crop pollination and pest self-control [57,58]. Therefore, the government should guide farmers to implement scientific planting methods such as crop rotation, intercropping, and planting of multiple crops and hedges to improve the ecological environment of farmland.

4.3. Limitations and Future Directions

Based on the PC and HC system of cultivated land, the PCI and HCI for Gaoping were evaluated, and the spatial distribution characteristics and coupling coordination relationship were analyzed. However, arable land is a complex system, and some limitations can be improved in the future. First, due to the limitations regarding raw data, we used different types and resolutions of data, which may have resulted in the low accuracy of evaluation results. In the future, it will be necessary to construct a database of factors with the same accuracy to improve the evaluation accuracy. Second, PC and HC are determined by various factors, such as pesticide usage and groundwater depth. In the future, it will be necessary to establish a more scientifically comprehensive evaluation system by combining the relationship between factors and PC (HC). Third, the PC and HC of arable land were constantly changing. Currently, we only analyzed the spatial distribution of PC and HC without exploring their temporal variation characteristics. Future research should focus on the evolution mechanism of the PC and HC to understand the historical spatiotemporal dynamics.

5. Conclusions

In this study, we established an evaluation system of arable land productivity for four components (climate, landform, soil, and utilization) and evaluated the PC using the limiting factor method in Gaoping City. The evaluation results revealed that the average index of PC was 1617.35, and the higher-grade regions were dominant, with an area of 19,419.78 ha. An HC evaluation system including internal and external factors was constructed. The average score of the HC of arable land was 79.86. The HC score exhibited a low in the middle areas and a high trend at edge areas, indicating that human activities have a strong impact on health conditions. The coupling coordination relationship between PC and HC was analyzed, and the overall coupling coordination degree of PC and HC was at the primary coordination stage. The shortage factors affecting the coupling coordination relationship were analyzed to provide supporting information for sustainable cultivated land management.

Supplementary Materials

The following are available online at https://www.mdpi.com/article/10.3390/land10121296/s1, Table S1: Scoring of crop type and climatic (solar and temperature) conditions, Table S2: The sensitivity of habitat type to each threat factor, Table S3: The maximum distance and weight of the threat factors, Table S4: Scoring and grading of geomorphology, soil, and utilization factors, Table S5: Scoring and grading of health condition factors.

Author Contributions

Conceptualization, X.L. (Xiaoliang Li) and K.W.; Funding acquisition, K.W.; Investigation, X.L. (Xiaoliang Li) and R.Z.; Methodology, X.L. (Xiaoliang Li), K.W. and R.Z.; Project administration, K.W.; Resources, K.W. and Q.Y.; Software, X.L. (Xiaoliang Li) and X.L. (Xiao Li); Supervision, K.W. and Y.L.; Visualization, X.L. (Xiaoliang Li); Writing—original draft, X.L. (Xiaoliang Li); Writing—review and editing, X.L. (Xiaoliang Li), Y.L. and X.L. (Xiao Li). All authors have read and agreed to the published version of the manuscript.

Funding

This research was funded by National Natural Science Foundation of China, grant number 42171261.

Institutional Review Board Statement

Not applicable.

Informed Consent Statement

Not applicable.

Data Availability Statement

The datasets used and/or analyzed during the current study are available from the corresponding author upon reasonable request.

Conflicts of Interest

The authors declare no conflict of interest.

References

  1. Xu, M.G.; Lu, C.A.; Zhang, W.J.; Li, L.; Duan, Y.H. Situation of the quality of arable land in China and impeovement strategy. Chin. J. Agric. Resour. Reg. Plan. 2016, 37, 8–14. [Google Scholar]
  2. Li, X.L.; Wu, K.N.; Chu, X.X.; Yang, Q.J.; Zhang, X.D.; Hao, S.H. Research progress and prospects for cultivated land productivity evalutaion. China Land Sci. 2019, 33, 91–100. [Google Scholar]
  3. Smyth, S.J.; Phillips, P.W.; Kerr, W.A. Food security and the evaluation of risk. Glob. Food Secur. 2015, 4, 16–23. [Google Scholar] [CrossRef]
  4. Lu, X.H.; Zhang, Y.W.; Zou, Y.C. Evaluation the effect of cultivated land protection policies based on the cloud model: A case study of Xingning, China. Ecol. Indic. 2021, 131, 108247. [Google Scholar] [CrossRef]
  5. Zhao, R.; Wu, K.N.; Li, X.L.; Gao, N.; Yu, M.M. Discussion on the unified survey and evaluation of cultivated land quality at county scale for China’s 3rd National Land Survey: A case study of Wen County, Henan Province. Sustainability 2021, 13, 2513. [Google Scholar] [CrossRef]
  6. Gao, L.L.; Zhang, C.; Lv, Y.H.; Chen, W.L.; Yun, W.J.; Ma, J.N. Construction and application of multi-factor cultivated land health productivity evaluation system. Trans. Chin. Soc. Agric. Mach. 2020, 51, 215–222. [Google Scholar]
  7. Huang, J.K.; Wei, W.; Cui, Q.; Xie, W. The prospects for China’s food security and imports: Will China starve the world via imports? J. Integr. Agric. 2017, 16, 2933–2944. [Google Scholar] [CrossRef]
  8. Wang, J.; Zhang, Z.; Liu, Y. Spatial shifts in grain production increases in China and implications for food security. Land Use Policy 2018, 74, 204–213. [Google Scholar] [CrossRef]
  9. Lv, X.; Niu, S.D.; Gu, G.Z.; Peng, W.L. Conceptual cognition and research framework on sustainable intensification of cultivated land use in China from the perspective of the “New Agriculture, Countryside and Peasants”. J. Nat. Resour. 2020, 35, 2029–2043. [Google Scholar]
  10. Teng, L. To achieve green restoration of polluted farmland, Chinese Academy of Sciences experts talk about crop rotation fallow system. Earth 2016, 9, 55–56. [Google Scholar]
  11. Yun, W.J.; Liang, M.Y.; Tang, H.Z. Improving the quality of arable land focuses on building healthy capacity. China Land 2015, 3, 22–23. [Google Scholar]
  12. Sui, B.; Dong, S.S.; Meng, H.B.; Wang, J.Y.; Shen, Y.J.; Ding, J.T.; Zhou, H.B.; Feng, J. Innovation in agricultural engineering and technology to accelerate green development of agriculture. Trans. Chin. Soc. Agric. Eng. 2020, 36, 1–6. [Google Scholar]
  13. Zhang, J.; Chen, H.; Chen, L.; Cao, S. Improving food security in China by taking advantage of marginal and degraded lands. J. Clean. Prod. 2018, 171, 1020–1030. [Google Scholar] [CrossRef]
  14. Liu, L.; Zhou, D.; Chang, X.; Lin, Z. A new grading system for evaluating China’s cultivated land quality. Land Degrad. Dev. 2020, 31, 1482–1501. [Google Scholar] [CrossRef]
  15. Mueller, L.; Schindler, U.; Shepherd, T.G.; Ball, B.C.; Smolentseva, E.; Pachikin, K.; Hu, C.; Hennings, V.; Sheudshen, A.K.; Behrendt, A.; et al. The Muencheberg soil quality rating for assessing the quality of global farmland. In Novel Measurement and Assessment Tools for Monitoring and Management of Land and Water Resources in Agricultural Landscapes of Central Asia; Springer: Cham, Switzerland, 2014; pp. 235–248. [Google Scholar]
  16. Hennings, V.; Höper, H.; Mueller, L. Small-scale soil functional mapping of crop yield potentials in Germany. In Novel Methods for Monitoring and Managing Land and Water Resources in Siberia; Springer: Cham, Switzerland, 2016; pp. 597–617. [Google Scholar]
  17. Great Britain. Ministry of Agriculture. Agricultural Land Classification of England and Wales: Revised Guidelines and Criteria for Grading the Quality of Agricultural Land; MAFF Publications: London, UK, 1988. [Google Scholar]
  18. Ye, S.; Song, C.; Shen, S.; Gao, P.; Cheng, C.; Cheng, F.; Wan, C.; Zhu, D. Spatial pattern of arable land-use intensity in China. Land Use Policy 2020, 99, 104845. [Google Scholar] [CrossRef]
  19. Campbell, B.M.; Beare, D.J.; Bennett, E.M.; Hall-Spencer, J.M.; Ingram, J.S.; Jaramillo, F.; Ortiz, R.; Ramankutty, N.; Sayer, J.A.; Shindell, D. Agriculture production as a major driver of the earth system exceeding planetary boundaries. Ecol. Soc. 2017, 22, 8. [Google Scholar] [CrossRef]
  20. Ramankutty, N.; Mehrabi, Z.; Waha, K.; Jarvis, L.; Kremen, C.; Herrero, M.; Rieseberg, L.H. Trends in global agricultural land use: Implications for environmental health and food security. Annu. Rev. Plant Biol. 2018, 69, 789–815. [Google Scholar] [CrossRef] [Green Version]
  21. Moebius-Clune, D.J.; Gugino, B.K.; Idowu, O.J.; Schindelbeck, R.R.; Ristow, A.J.; van Es, H.M.; Thies, J.E.; Shayler, H.A.; McBride, M.B.; Kurtz, K.S.M.; et al. Comprehensive Assessment of Soil Health—The Cornell Framework, Edition 3.2; Cornell University: Geneva, NY, USA, 2016; Available online: http://www.css.cornell.edu/extension/soil-health/manual.pdf (accessed on 5 October 2021).
  22. Huber, S.; Syed, B.; Freudenschuss, A.; Ernstsen, V.; Loveland, P. Proposal for a European Soil Monitoring and Assessment Framework, Technical Report 61; EEA: Copenhagen, Denmark, 2001. [Google Scholar]
  23. Zu, J.; Hao, J.M.; Chen, L.; Zhang, Y.B.; Wang, J.; Kang, L.T.; Guo, J.H. Analysis on trinity connotation and approach to protect quantity, quality and ecology of cultivated land. J. China Agric. Univ. 2018, 23, 84–95. [Google Scholar]
  24. Zhang, C.; Qiao, M.; Yun, W.J.; Liu, J.J.; Zhu, D.H.; Yang, J.Y. Trinity comprehensive regulatory system about quantity, quality and ecology of cultivated land. Trans. Chin. Soc. Agric. Mach. 2017, 48, 1–6. [Google Scholar]
  25. Zhu, Q.Y.; Chen, Y.R.; Hu, W.Y.; Mei, Y. Spatiotemporal pattern of coupling coordination degree between land intensive use and regional ecological efficiency in China. Trans. Chin. Soc. Agric. Eng. 2020, 36, 234–243. [Google Scholar]
  26. Xu, W.X.; Li, L.; Zhou, J.P.; Liu, C.J. The dynamic evolution and its driving mechanism of coordination of rural rejuvenation and new urbanization. J. Nat. Resour. 2020, 35, 2044–2062. [Google Scholar] [CrossRef]
  27. Ariken, M.; Zhang, F.; Liu, K.; Fang, C.; Kung, H.T. Coupling coordination analysis of urbanization and eco-environment in Yanqi Basin based on multi-source remote sensing data. Ecol. Indic. 2020, 114, 106331. [Google Scholar] [CrossRef]
  28. Fan, Y.; Fang, C.; Zhang, Q. Coupling coordinated development between social economy and ecological environment in Chinese provincial capital cities-assessment and policy implications. J. Clean. Prod. 2019, 229, 289–298. [Google Scholar] [CrossRef]
  29. Song, G.; Chen, L.L.; Zou, Z.H. Spatial heterogeneity of early-warning status of cultivated land system security and its driving factors in Heilongjiang Province. Trans. Chin. Soc. Agric. Eng. 2018, 34, 1–9. [Google Scholar]
  30. Chen, W.G.; Kong, X.B.; Wen, L.Y.; Zhu, H.M.; Zhang, B.B. Construction and application of cultivated land health evaluation index system based on demand-function-dimension. J. China Agric. Univ. 2021, 26, 106–117. [Google Scholar]
  31. Sun, Y.M. Study on the Land Type Classification of Wanbailin District of Taiyuan City and Its Application to Cultivated Land Classification. Doctoral Dissertations, China Agricultural University, Beijing, China, 2005. [Google Scholar]
  32. Zhao, X.J.; Ye, Y.; Zhou, J.H.; Liu, L.; Dai, W.J.; Wang, Q.X.; Hu, Y.M. Comprehensive evaluation of cultivated land quality and sensitivity analysis of index weight in hilly region of Pearl River Delta. Trans. Chin. Soc. Agric. Eng. 2017, 33, 226–235. [Google Scholar]
  33. Wen, L.Y.; Zhang, Q.P.; Kong, X.B.; Zhang, B.B.; Yun, W.J.; Sun, X.B.; Liu, J.F. Arable land consolidation zoning based on comprehensive evaluation of capacity and health. Trans. Chin. Soc. Agric. Eng. 2019, 35, 79–89. [Google Scholar]
  34. Yun, W.J. Protect the health of cultivated land and maintain the natural ecological. China Nat. Resour. News 2019, 23. [Google Scholar] [CrossRef]
  35. Fu, S.L. Strengthening the research on soil fauna diversity and their ecological functions using novel technology and field experimental facility. Biodivers. Sci. 2018, 26, 1031–1033. [Google Scholar] [CrossRef] [Green Version]
  36. Liang, W.J.; Dong, Y.H.; Li, Y.B.; Zhang, X.K.; Li, Q.; Wu, Z.J. Biological characterization and regulation of soil health. Chin. J. Appl. Ecol. 2021, 32, 719–728. [Google Scholar]
  37. Cooper, R.J.; Hama-Aziz, Z.Q.; Hiscock, K.M.; Lovett, A.A.; Vrain, E.; Dugdale, S.J.; Sünnenberg, G.; Dockerty, T.; Hovesen, P.; Noble, L. Conservation tillage and soil health: Lessons from a 5-year UK farm trial (2013–2018). Soil Tillage Res. 2020, 202, 104648. [Google Scholar] [CrossRef]
  38. Zhang, X.R.; Zhou, J.; Li, M.M. Analysis on spatial and temporal changes of regional habitat quality based on the spatial pattern reconstruction of land use. Acta Geogr. Sin. 2020, 75, 160–178. [Google Scholar]
  39. Dai, Y.Z.; Li, J.F.; Yang, J.X. Spatiotemporal responses of habitat quality to urban sprawl in the Changsha metropolitan area. Prog. Geogr. 2018, 37, 1340–1351. [Google Scholar]
  40. Phillips, S.J.; Dudík, M.; Schapire, R.E. Maxent Software for Modeling Species Niches and Distributions (Version 3.9). Available online: http://biodiversityinformatics.amnh.org/open_source/maxent/ (accessed on 25 August 2020).
  41. Phillips, S.J.; Anderson, R.P.; Schapire, R.E. Maximum entropy modeling of species geographic distributions. Ecol. Model. 2006, 190, 231–259. [Google Scholar] [CrossRef] [Green Version]
  42. Zhao, Y.; Deng, X.W.; Xiang, W.H.; Chen, L.; Ouyang, S. Predicting potential suitable habitats of Chinese fir under current and future climatic scenarios based on Maxent model. Ecol. Inform. 2021, 64, 101393. [Google Scholar] [CrossRef]
  43. Li, M.M. The Method of Vegetation Fraction Estimation by Remote Sensing. Master’s Theses, University of Chinese Academy of Science, Beijing, China, 2003. [Google Scholar]
  44. Zhao, L.L.; Zhang, R.; Liu, Y.X.; Zhu, X.C. The differences between extracting vegetation information from GF1-WFV and Landsat8-OLI. Acta Ecol. Sin. 2020, 40, 3495–3506. [Google Scholar]
  45. Qian, F.; Wang, W.; Wang, Q. Quantification of synergetic relationship between natural quality and site conditions of cultivated land based on coupling coordination degree model. Trans. Chin. Soc. Agric. Eng. 2018, 34, 284–291. [Google Scholar]
  46. Liu, J.; Jin, X.; Xu, W.; Gu, Z.; Yang, X.; Ren, J.; Fan, Y.; Zhou, Y. A new framework of land use efficiency for the coordination among food, economy and ecology in regional development. Sci. Total Environ. 2020, 710, 135670. [Google Scholar] [CrossRef]
  47. Jiang, L.; Bai, L.; Wu, Y. Coupling and coordinating degrees of provincial economy, resources and environment in China. J. Nat. Resour. 2017, 32, 788–799. [Google Scholar]
  48. Frank, M.D.; Beattie, B.R.; Embleton, M.E. A comparison of alternative crop response models. Am. J. Agric. Econ. 1990, 72, 597–603. [Google Scholar] [CrossRef]
  49. Feng, M.Q.; Huang, P.; Pan, H.Y.; Xu, J. Study on potentials of cultivated land quality improvement based on combination of restricted factors-taking Shifang as an example. Chin. J. Agric. Resour. Reg. Plan. 2019, 40, 126–133. [Google Scholar]
  50. Yao, Q.; Li, Q.Y.; Kong, X.B.; Guan, X. Study on temporal-spatial distribution of cultivated land utilization potential in Dalate Banner and its limiting factors. Shandong Agric. Sci. 2014, 46, 88–95. [Google Scholar]
  51. Zhao, D.L.; He, S.S.; Yang, J.Y.; Zhang, C.; Li, P.S.; Du, Z.B. Qualitative potential calculation of arable land consolidation based on limiting factors and hot spot analysis. Trans. Chin. Soc. Agric. Mach. 2017, 48, 158–164. [Google Scholar]
  52. O’Geen, A.T.; Southard, S.B. A revised Storie Index modeled in NASIS. Soil Surv. Horiz. 2005, 46, 98–108. [Google Scholar] [CrossRef]
  53. Mueller, L.; Schindler, U.; Behrendt, A.; Eulenstein, F.; Dannowski, R. The Muencheberg Soil Quality Rating (SQR). Available online: https://orgprints.org/id/eprint/30579/ (accessed on 25 August 2021).
  54. Ye, S.J.; Song, C.Q.; Cheng, F.; Zhang, L.N.; Cheng, C.X.; Zhang, C.; Yang, J.Y.; Zhu, D.H. Cultivated land health-productivity comprehensive evaluation and its pilot evaluation in China. Trans. Chin. Soc. Agric. Eng. 2019, 35, 66–78. [Google Scholar]
  55. Tan, Y.Z.; Chen, H.; Lian, K.; Yu, Z.N. Comprehensive evaluation of cultivated land quality at county scale: A case study of Shengzhou, Zhejiang Province, China. Int. J. Environ. Res. Public Health 2020, 17, 1169. [Google Scholar] [CrossRef] [Green Version]
  56. Kehoe, L.; Romero-Muñoz, A.; Polaina, E.; Estes, L.; Kreft, H.; Kuemmerle, T. Biodiversity at risk under future cropland expansion and intensification. Nat. Ecol. Evol. 2017, 1, 1129–1135. [Google Scholar] [CrossRef]
  57. Blesh, J.; Hoey, L.; Jones, A.D.; Friedmann, H.; Perfecto, I. Development pathways toward “zero hunger”. World Dev. 2019, 118, 1–14. [Google Scholar] [CrossRef]
  58. Lichtenberg, E.M.; Kennedy, C.M.; Kremen, C.; Batary, P.; Berendse, F.; Bommarco, R.; Bosque-Pérez, N.A.; Carvalheiro, L.G.; Snyder, W.E.; Williams, N.M.; et al. A global synthesis of the effects of diversified farming systems on arthropod diversity within fields and across agricultural landscapes. Glob. Chang. Biol. 2017, 23, 4946–4957. [Google Scholar] [CrossRef] [Green Version]
Figure 1. Production capacity and health condition evaluation system framework.
Land 10 01296 g001
Figure 2. Location of the study area in China.
Land 10 01296 g002
Figure 3. Spatial distribution of cultivated land production capacity (PC).
Land 10 01296 g003
Figure 4. Spatial distribution of cultivated land health condition (HC).
Land 10 01296 g004
Figure 5. Spatial distribution of coupling coordination types. WC, MC, PCO, BC, AI, MI, MOI, and EI represent well coordination, moderate coordination, primary coordination, barely coordinate, approach imbalance, mild imbalance, moderate imbalance, and extreme imbalance, respectively.
Land 10 01296 g005
Figure 6. Correlation between the production capacity index (PCI), national utilization quality index (LUQI), and standard grain yield. The 2014 and 2015 soybean, wheat, and corn yields were converted to standard grain yields according to yield ratio.
Land 10 01296 g006
Figure 7. Fraction spectra of coupling coordination factors at different stages. (A) Scores of climatic elements at each stage; (B) scores of various factors in the coordination stage; and (C) scores of various factors in the imbalance stage. WC, MC, PCO, BC, AI, MI, MOI, EI, and Average represent well coordination, moderate coordination, primary coordination, barely coordinate, approach imbalance, mild imbalance, moderate imbalance, extreme imbalance, and average value of the factors, respectively.
Land 10 01296 g007
Table 1. Main standards for cultivated land productivity and health evaluation in China.
Land Management DepartmentsStandard or CriterionPurpose and Mission
Ministry of Natural Resources of the People’s Republic of ChinaRegulation for Gradation on Agriculture Land Quality (GB/T 28407-2012)Identify the potential, actual, and economic production capacity of arable land.
Cultivated Land Quality ClassificationIdentify the natural environmental characteristics of arable land in a visual way to reflect the resource endowment of arable land.
Ministry of Agriculture and Rural Affairs of the People’s Republic of ChinaCultivated Land Quality Grade (GB/T 33469-2016)Evaluate soil fertility and biodiversity characteristics.
Ministry of Ecology and Environment of the People’s Republic of China“Soil Environmental Quality ‘Risk Control Standard for Soil Contamination of Agricultural land’” (GB 15618-2018)Identify the risk of soil contamination on agricultural land to safeguard the safety of agricultural products, the normal growth of crops, and the soil ecology.
Technical Criterion for Eco-System Status Evaluation (HJ 192–2015)Evaluate the ecological environment of counties, provinces, and ecological zones.
Table 2. Cultivated land production capacity (PC) evaluation system.
TypeFactorMeasurable ParametersReference Source
Basic indicatorsClimatic conditionsSolar-temperature potential productivity or climatic potential productivityRegulation for Gradation on Agriculture Land Quality (GB/T 28407-2012)
Yield ratio coefficient
Limiting indicatorsGeographical conditionsLand surface slopeCultivated Land Quality Grade (GB/T 33469-2016)
Topographic position
Soil propertiesAvailable soil depthCultivated Land Quality Grade (GB/T 33469-2016); Regulation for Gradation on Agriculture Land Quality (GB/T 28407-2012)
Soil texture
Soil organic content
Soil pH
Depth to impeding layer
Gravel content
Utilization conditionsGuaranteed rate of irrigation waterRegulation for Gradation on Agriculture Land Quality (GB/T 28407-2012)
Land parcel conditions
Farmland accessibility
Road accessibility
Table 3. Cultivated land health condition (HC) evaluation system.
TypeFactorMeasurable ParameterReference Source
Basic indicatorsInternal HCEarthwormZhao [5]; Cooper [37]; Cultivated Land Quality Grade (GB/T 33469-2016)
Soil heavy metal“Soil Environmental Quality ‘Risk Control Standard for Soil Contamination of Agricultural land’” (GB 15618-2018)
External HCVegetation coverageTechnical Criterion for Eco-System Status Evaluation (HJ 192-2015)
Habitat quality
Table 4. Classification of the coupling coordination relationship.
Coupling Coordination IndexRating
0.900–1.000Quality coordination (QC)
0.800–0.899Well coordination (WC)
0.700–0.799Moderate coordination (MC)
0.600–0.699Primary coordination (PCO)
0.500–0.599Barely coordinate (BC)
0.400–0.499Approach imbalance (AI)
0.300–0.399Mild imbalance (MI)
0.200–0.299Moderate imbalance (MOI)
0.100–0.199Severe imbalance (SI)
0.000–0.099Extreme imbalance (EI)
Table 5. Dataset description and sources.
No.Dataset NameDescriptionDATA SOURCE
1Land use/coverVector; 1:50,000Gaoping County Land Use Database (2016)
2Climatic conditions (Solar-temperature potential productivity or climatic potential productivity and yield ratio)Vector; 1:50,000Gaoping County Cultivated Land Quality Grade Update Database (2016)
3Land surface slope Raster; 30 × 30 mGeospatial Data Cloud (http://www.gscloud.cn/, accessed on 20 August 2020) DEM processing results.
4Topographic positionVector; 1:50,000Gaoping County Cultivated Land Fertility Database (2015)
5Available soil depth; soil texture; depth to impeding layer; gravel contentRaster; 100 × 100 mGaoping County Soil Database
6Soil organic matter, pHRaster; 250 × 250 mSoilGrids (https://soilgrids.org, accessed on 20 August 2020)
7Guaranteed rate of irrigation waterVector; 1:50,000Gaoping County Cultivated Land Quality Grade Update Database (2016)
8Soil heavy metals data (cadmium, mercury, arsenic, lead, and chromium)Vector; 1:50,000Gaoping County Land Quality Geochemical Evaluation Database (2010)
9EarthwormField investigationQuadrat (0.5 m length, 0.5 m width, and 0.3 m depth)
10NDVIRaster; 30 × 30 mLandsat 8 OLI/TIRS remote sensing image data (https://earthexplorer.usgs.gov/, accessed on 20 August 2020)
Table 6. The weight of internal HC indicators.
FactorMeasurable ParameterWeight
Internal HC (0.5)Earthworm0.4
Soil heavy metal0.6
External HC (0.5)Vegetation coverage0.5
Habitat quality0.5
Table 7. The area of coupling coordination category in each town.
TownWCMCPCOBCAIMIMOIEI
Area/haArea/haArea/haArea/haArea/haArea/haArea/haArea/ha
Beicheng0.00 138.70 832.38 225.42 77.59 0.19 0.00 22.30
Beishi0.43 1620.71 2584.81 415.28 229.47 1.16 0.00 0.00
Chenqu0.00 232.90 2209.18 967.70 286.00 26.83 0.00 0.00
Dongcheng0.00 22.94 131.94 127.72 42.83 0.00 0.00 20.55
Hexi364.77 4155.44 2389.11 498.29 17.47 0.00 0.00 58.34
Jianning7.88 903.41 853.13 188.14 31.40 22.80 0.00 0.00
Macun481.70 1879.36 1153.73 264.48 126.30 0.61 0.00 3.85
Mishan0.00 1077.30 2440.48 274.64 60.72 1.55 0.00 13.24
Nancheng2.00 732.67 1401.91 413.59 130.58 12.75 0.00 80.37
Sanjia0.00 79.98 1470.76 452.00 135.68 6.58 0.00 48.93
Shennong0.00 147.80 1699.14 949.83 124.82 1.79 0.00 0.00
Shimo54.62 2019.20 1532.83 186.39 4.46 0.00 0.00 0.00
Sizhuang0.00 465.91 2574.18 2089.45 602.60 171.06 4.25 5.37
Yechuan54.97 1946.59 1480.44 582.91 152.24 2.88 0.00 0.00
Yonglu0.00 23.94 856.11 301.22 47.31 11.25 0.00 0.00
Yuancun454.71 1533.51 540.88 262.34 50.72 1.04 0.00 0.00
Publisher’s Note: MDPI stays neutral with regard to jurisdictional claims in published maps and institutional affiliations.

