Article

Urban Community Power: Enhancing Urban Forest Diversity and Reversing Ecosystem Disservices in Zomba City, Malawi

by
Patrick J. Likongwe
1,2,*,
Frank B. Chimaimba
2,3,
Sosten S. Chiotha
2,
Treaser Mandevu
2,
Lois Kamuyango
2 and
Hesekia Garekae
1
1
Department of Environmental Science, Rhodes University, Grahamstown 6140, South Africa
2
Leadership for Environment and Development Southern and Eastern Africa (LEAD SEA), Mulunguzi, Fishing Flies Road, Zomba, Malawi
3
Chancellor College, University of Malawi, Zomba, Malawi
*
Author to whom correspondence should be addressed.
Land 2021, 10(11), 1258; https://doi.org/10.3390/land10111258
Submission received: 21 September 2021 / Revised: 4 November 2021 / Accepted: 9 November 2021 / Published: 17 November 2021
(This article belongs to the Special Issue What Is Next for Urban Landscape Ecology?)

Abstract

:
Tree species diversity in urban green spaces supports the provision of a wide range of urban ecosystem services, well studied in developed countries and less so in developing countries, where little is discussed concerning the role of urban communities in addressing the eminent threat facing green spaces. A study was, therefore, conducted to assess the impact of community involvement in the management of urban green spaces, which is mostly left in the hands of the central government in most developing countries. Two hills, namely, Sadzi and Chiperoni hills, were selected within Zomba city, where the latter has no community involvement in managing it. Trees with diameters at breast height (DBH) of ≥5 cm were measured and identified to species level from 25 sampled plots (20 × 20 m each). The results found a total of 51 species, 40 genera and 17 families, with the Fabaceae family dominant in both hills. A Shannon index of above 3.0 was recorded from both hills, with a greater tree density for Sadzi hill at 695 trees/ha. Sadzi hill has gained more than a twofold increase in green cover, while Chiperoni has lost 10%. Despite being in the regenerating phase, the community management is contributing to urban green space provision, ecosystem services and biodiversity conservation.

1. Introduction

In pursuit of sustainable cities, urban green spaces (UGS) are increasingly recognized worldwide as a fundamental resource [1,2,3]. Research confirms that urban green spaces, which include open spaces, whether formal or informal, private or public, but mostly covered by vegetation, offer a spectrum of benefits and values, also known as ecosystem services, to the social and economic systems in urban landscapes [4]. Urban green spaces are known to provide cultural benefits including, among others, spiritual and religious significance, symbolic values, educational values, recreational values and property value improvement [5,6]. They are also recognized in regulating local weather [7], reducing water runoff [8], improving air quality [9,10] and conserving biodiversity. Central to these urban green spaces are trees and forests which bring an important vegetation component [11,12].
It is logical that the diversity of benefits that urban greens spaces offer to urban landscapes ought to justify their conservation, management and expansion. Surprisingly, statistics indicate that urban green spaces are depleting at an alarming rate across the globe [13]. In Africa, the situation is even worse. This is attributed to factors such as weak policies [14], inadequate resources, urbanization pressure [15], lack of priority given to green spaces in development agendas [13] and inadequate involvement of urban communities [13,16]. In the majority of African countries, management of urban green spaces is usually under the obligation of city authorities with little or no community involvement [17,18]. While this type of management has some advantages such as fast implementation of activities in urban green spaces, it is associated with numerous disadvantages. There is a broad consensus that poor involvement of urban communities in the management of urban green spaces has led communities to think that managing green spaces is solely the duty of city authorities. This line of thinking usually gives the community liberty to misuse the green spaces in its neighborhood.
There has been a growing body of literature that argues and advocates for community involvement in urban planning including management of urban green spaces [16,19,20,21,22]. Community involvement, here, entails actively engaging urban communities at all levels of decision making on matters concerning urban development. According to [23], community involvement and engagement in urban green spaces create a sense of ownership which result in caring, resourcing, innovations and, subsequently, long-term sustainability. Meanwhile, most available studies and empirical evidence on the value of community involvement in the management of urban green spaces are from European and American countries [22,23,24], whilst very few are from African countries [16,25]. Sub-Saharan African countries are critically understudied.
Against this background, this paper attempts to provide additional empirical evidence from Africa on the benefits of community involvement in the management of urban green spaces by comparing two urban green spaces in Zomba city, Malawi. This study uses the cases of Sadzi hill and Chiperoni hill, which are green spaces with different management systems. Specifically, this paper attempts to shed light on the impact of the community management through comparing the tree species composition, diversity indices, vegetation cover and ecosystem services and disservices of the two hills.

2. Materials and Methods
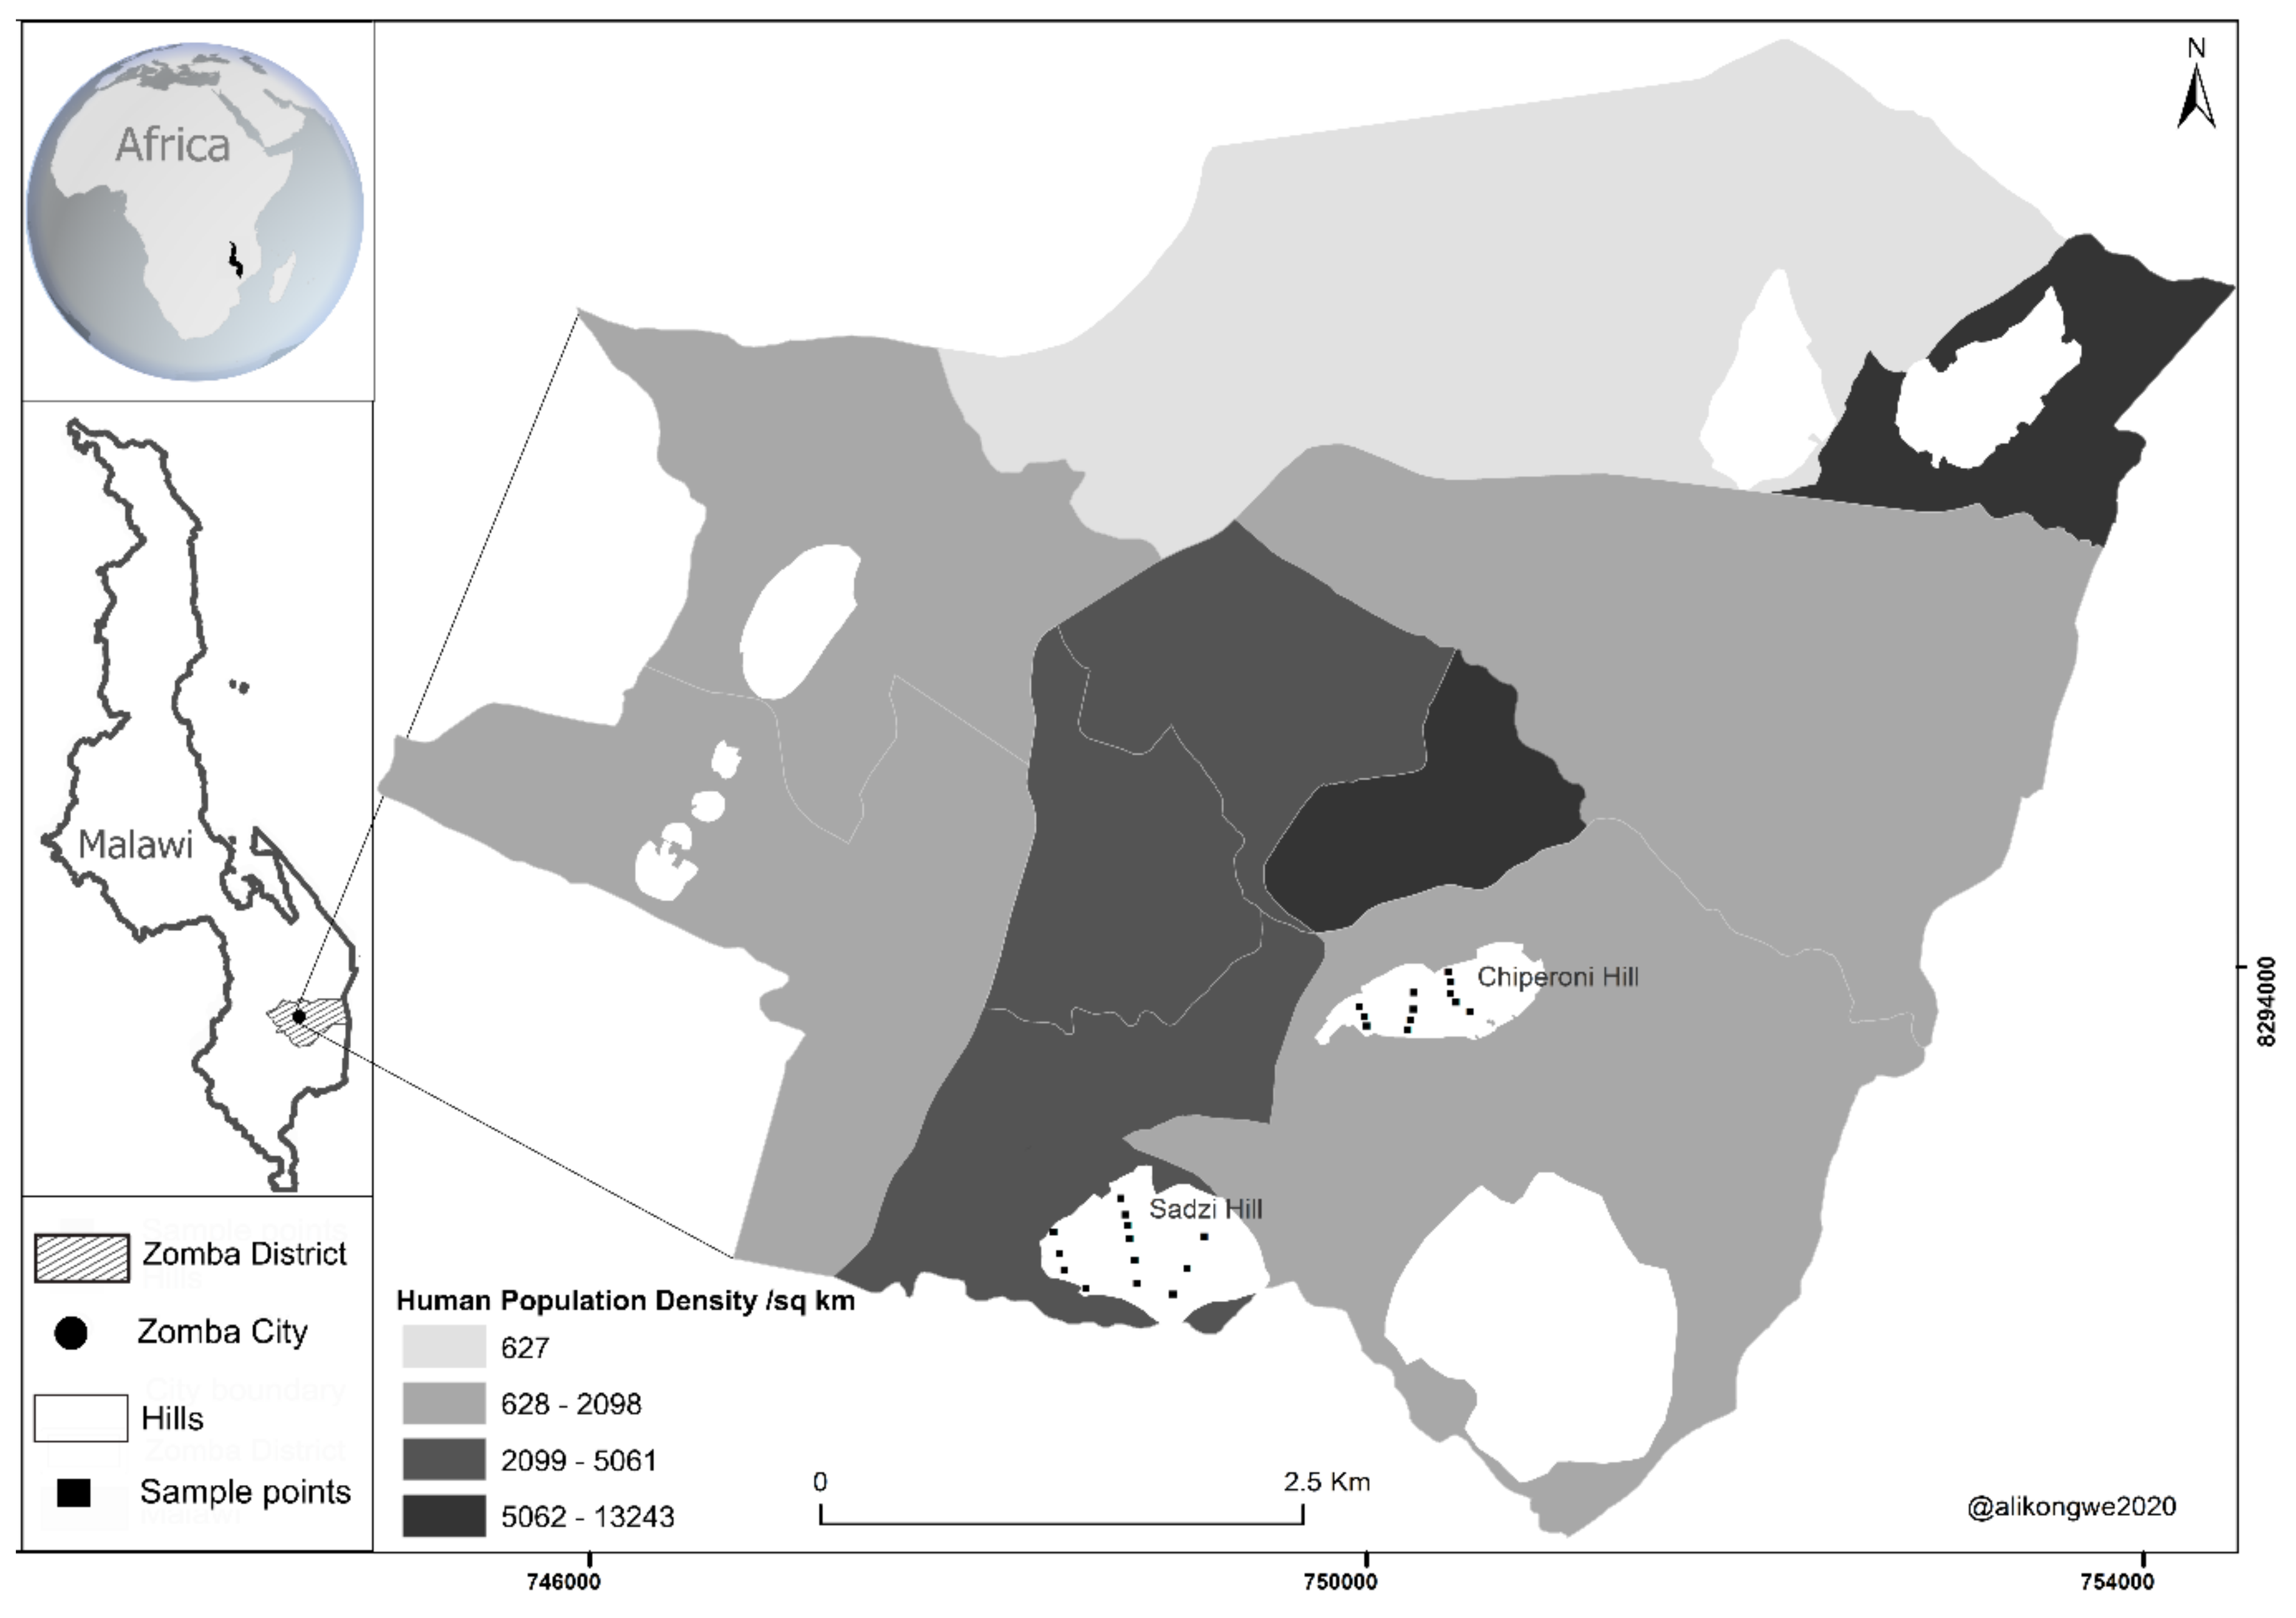
2.1. Study Site

This study was conducted in the city of Zomba (15°22′35.71″ S and 35°20′08.35″ E), specifically in the two hills of Chiperoni and Sadzi from the Mpira and Sadzi wards, respectively. Based on the recent population and housing survey, Zomba city’s population stands at 2500 people/km2 from the ten wards (Figure 1). The city covers an area of 42 km2, located at the foot of the Zomba Plateau, which is 2085 m above sea level. The city experiences a tropical climate, with temperatures ranging between 10 and 35 °C, and an annual rainfall range between 600 and 1500 mm. Zomba is endowed with six afforestation hills which contribute 11.8% to the total urban area. The hills under study are in close proximity to each other, where the socio-economic status of the surrounding communities is mixed, with medium- and high-density setups, as well as informal settlements.
Sadzi hill was once protected under the Wood Energy World Bank project. However, at the end of the project in 1996, the hill experienced serious environmental degradation due to high demand for forest products, encroachment for farming and settlement. Before the restoration drive, over 350 farming plots were active within the 110 ha Sadzi hill. The degradation resulted in ecosystem disservices of soil erosion and mud and rock slides from the hill top to the residents below [26], posing a threat to their coexistence with the hill. These ecosystem disservices were more pronounced during the rainy season. They prompted the Sadzi community leaders to elect a 15-member Sadzi Concerned Citizen committee that was challenged to manage the hill’s recovery. The committee was mandated to implement a management plan through tree planting and natural regeneration plus protection from wild fires, and efforts began in 2014.
The first tree seedlings planted were provided by Leadership for Environment and Development (LEAD) and the Forestry Research Institute of Malawi (FRIM) through the Lake Chilwa Basin Climate Change Adaptation Programme (LCBCCAP), and the city council through the Malawi Social Action Fund (MASAF III), Christian Aid and the Sadzi Concerned Citizen committee. The committee has never received any financial support in its endeavors to restore the degraded hill but has benefited from technical advice from the district forest office and the city of Zomba. The community deploys guards who are paid from the MWK 2000.00 (equivalent of USD 2.72 at MWK 735.29 to USD 1—2019 average) monthly contributions made by each committee member. Currently, the committee and the city council authorities are working on formalizing the byelaws for the management of this hill, as well as on having the committee sit in the environment committee of the city council. All these arrangements are absent in Chiperoni hill, and it still remains a common pool resource with minimal local government involvement. This study, therefore, aimed at assessing the impact of urban community management efforts through a comparison of the tree species composition, diversity, vegetation cover, ecosystem services and ecosystem disservices between Sadzi and Chiperoni hills.

2.2. Data Collection

To understand the differences between tree species composition and diversity, a total of 25 plots measuring 20 × 20 m (400 m2) were randomly selected from three transects in each hill, 12 from Chiperoni and 13 from Sadzi hill (Figure 1), between March and May 2018. In each sampling plot, a full inventory of trees taller than 1.5 m and with a diameter at breast height (DBH = 1.3 m from the ground) of ≥5 cm was conducted. Trees in each sampling plot were identified up to species level with the help of tree experts from the National Herbarium and Botanical Gardens (NHBG) and Forestry Research Institute of Malawi (FRIM). The tree species identified were documented as either ‘indigenous’ or ‘exotic’ based on their origin. DBH was measured in centimeters (cm) for each stem using diameter tape and classified into four groups: (1) 5–10 cm, (2) 11–20 cm, (3) 21–30 cm and (4) >30 cm. The height of each stem was estimated using a hypsometer, and the GPS coordinates were taken for each plot with the help of a Garmin 62sc.
High resolution satellite imagery for both Chiperoni and Sadzi hills were extracted from Google Earth Pro. In the images were of May 2013 before the community management interventions and around the same time seven and eight years later in May 2020 for Sadzi hill and May 2021 for Chiperoni hill, respectively. The choice of the months was mindful of the fact that all tree leaf cover is available as shedding of leaves sets in from August each year. Classification of land use on the hills was conducted between the two time periods to appreciate any vegetation cover differences between the two hills.
Moreover, a total of 11 complementary key informant interviews were conducted with participants drawn from various stakeholders (Table 1). These informants were purposively chosen based on their knowledge, expertise and long-term experience in environmental advocacy and the position they held in the community, government departments and conservation agencies. The interviews were conducted either through face-to-face interactions or telephone, depending on the availability of the interviewee. On average, the duration of the interviews ranged between 20 and 30 min. Table 1 summarizes information about the key informant interviews. The key informant interviews which took place in June 2021 sought to understand the impacts of the community management interventions on tree management and any related ecosystem services or disservices accrued. Key guiding questions included the following: What are the ecosystem services obtained from the hills over time? Is there any change in the delivery of ecosystem services? What are the ecosystem disservices experienced from the hills, and have these changed over time? How are different stakeholders including communities involved in the decision-making process?

2.3. Computation of Growth Parameters and Biodiversity Indices

The computation models for the growth parameters and biodiversity indices undertaken in this study are summarized in Table 2. The species accumulation curves showed that the sampling efforts were exhaustive enough for each hill.

2.4. Data Analysis

Tree species data were entered in Microsoft Excel 2013, where descriptive statistics and preliminary summaries were executed, and data arrangements were made prior to export to R for further analysis. Student’s t-test was used to test for significant differences in the growth variables of individual trees from the two hills. All other analyses were computed in the R environment under RStudio (version 1.2.1335; R Core Team 2019). The ‘vegan’ community ecology package [27] functions of specpool () and diversity () were used to analyze species extrapolated values of richness and the Shannon–Wiener diversity index, respectively.
For vegetation cover classification, the extracted satellite images were imported in QGIS where they were classified using the Semi-Automatic Classification Plugin. The obtained classified results were used for analyzing and predicting land cover. The classes which were considered for classification were vegetation and bare land. Thereafter, the classified areas were computed and converted to percentages for explicit results.

3. Results

3.1. Tree Species Composition and Structure

In total, 445 individual trees were recorded from 25 plots in both hills. Both hills were highly endowed with a composition of indigenous tree species, with more in Chiperoni hill (97%). Sadzi hill had a mean of 27.83 trees per plot, with a maximum of 57 trees in one plot as compared to Chiperoni, whose values were lower. There were more tree families in Sadzi as compared to Chiperoni, as outlined in Table 3. However, in terms of tree abundance from the plots sampled, there was a significant difference between the two hills (p = 0.0005), with Sadzi having an estimated 695 trees/ha, a higher number compared to Chiperoni (Table 3). All plots in Sadzi hill had trees except one plot which was fully covered with bamboo (Oxtenanthera abyssinica—local bamboo). For Chiperoni, out of the 12 plots, 3 plots had a different composition. The first plot had only one tree species, Pterocarpus angolensis; the second plot had no trees and was only covered with Hypatheria Dissoluta (dominating grass); and the third plot was bare, and it was an abandoned garden.
This study further found a total of 51 tree species from both hills, belonging to 40 genera and 17 plant families. The most common plant family was Fabaceae, with 20 tree species, followed by the Anacardiaceae, Combretaceae and Phyllanthaceae families, each with 4 tree species (in Appendix A). Four families had doubleton species each, while nine families were composed of singletons. For the genera, the most common was Brachystegia, with five tree species, followed by Dalbergia, with three tree species. There were five genera of Eucalyptus, Strychnos, Combretum, Albizia and Rhus, each with doubleton species, while the rest of the 33 genera had singleton species. Sadzi hill alone hosted 42 of the 51 tree species and 34 genera which were significantly different from those of Chiperoni (p = 0.005), while the families between the hills were not significantly different (Table 2). The top six tree species in terms of abundance from both hills were Dalbergia boehmii (n = 49), Diplorhynchus condylocarpon (n = 39), Eucalyptus saligna (n = 29), Pterocarpus angolensis (n = 25), Bauhinia petersiana (n = 24) and Anonna senegalensis (n = 21). More details are outlined in Appendix A.
The resulting individual tree DHBs had an overall mean of 6.42 cm, and there was an overall mean height of 4.6 m. Chiperoni hill recorded a lower mean DBH of 6.27 cm (Sadzi hill—6.42 cm) and a lower mean tree height of 4.27 m (Sadzi hill—4.71 m), as outlined in Figure 2. The boxplots, however, exclude two tree individuals of Uapaca kirkiana that were the only big trees at a DBH of 44.5 cm and 44.6 cm from Chiperoni hill and Sadzi hill, respectively (Table 3).
Both hills are in the new regenerating phase as they were dominated by the small DBH class of 05–10 cm, represented by 95.7% of all tree individuals recorded, corresponding to 50 of the tree species unveiled. Comparatively, Sadzi hill had a slightly greater exotic tree species (13.7%) contribution than Chiperoni (3%). However, for each hill, there were more indigenous species in the first DBH class of 05–10 cm (Figure 3). The first two classes controlled 99.3% of the size of the trees in both hills. Singleton species were found in the two classes of 21–30 cm and >30 cm, represented by Strychnos innocua and Uapaca kirkiana, respectively, both in Chiperoni hill. There was only Uapaca kirkiana in the last size class for Sadzi hill and none in the 21–30 cm class.

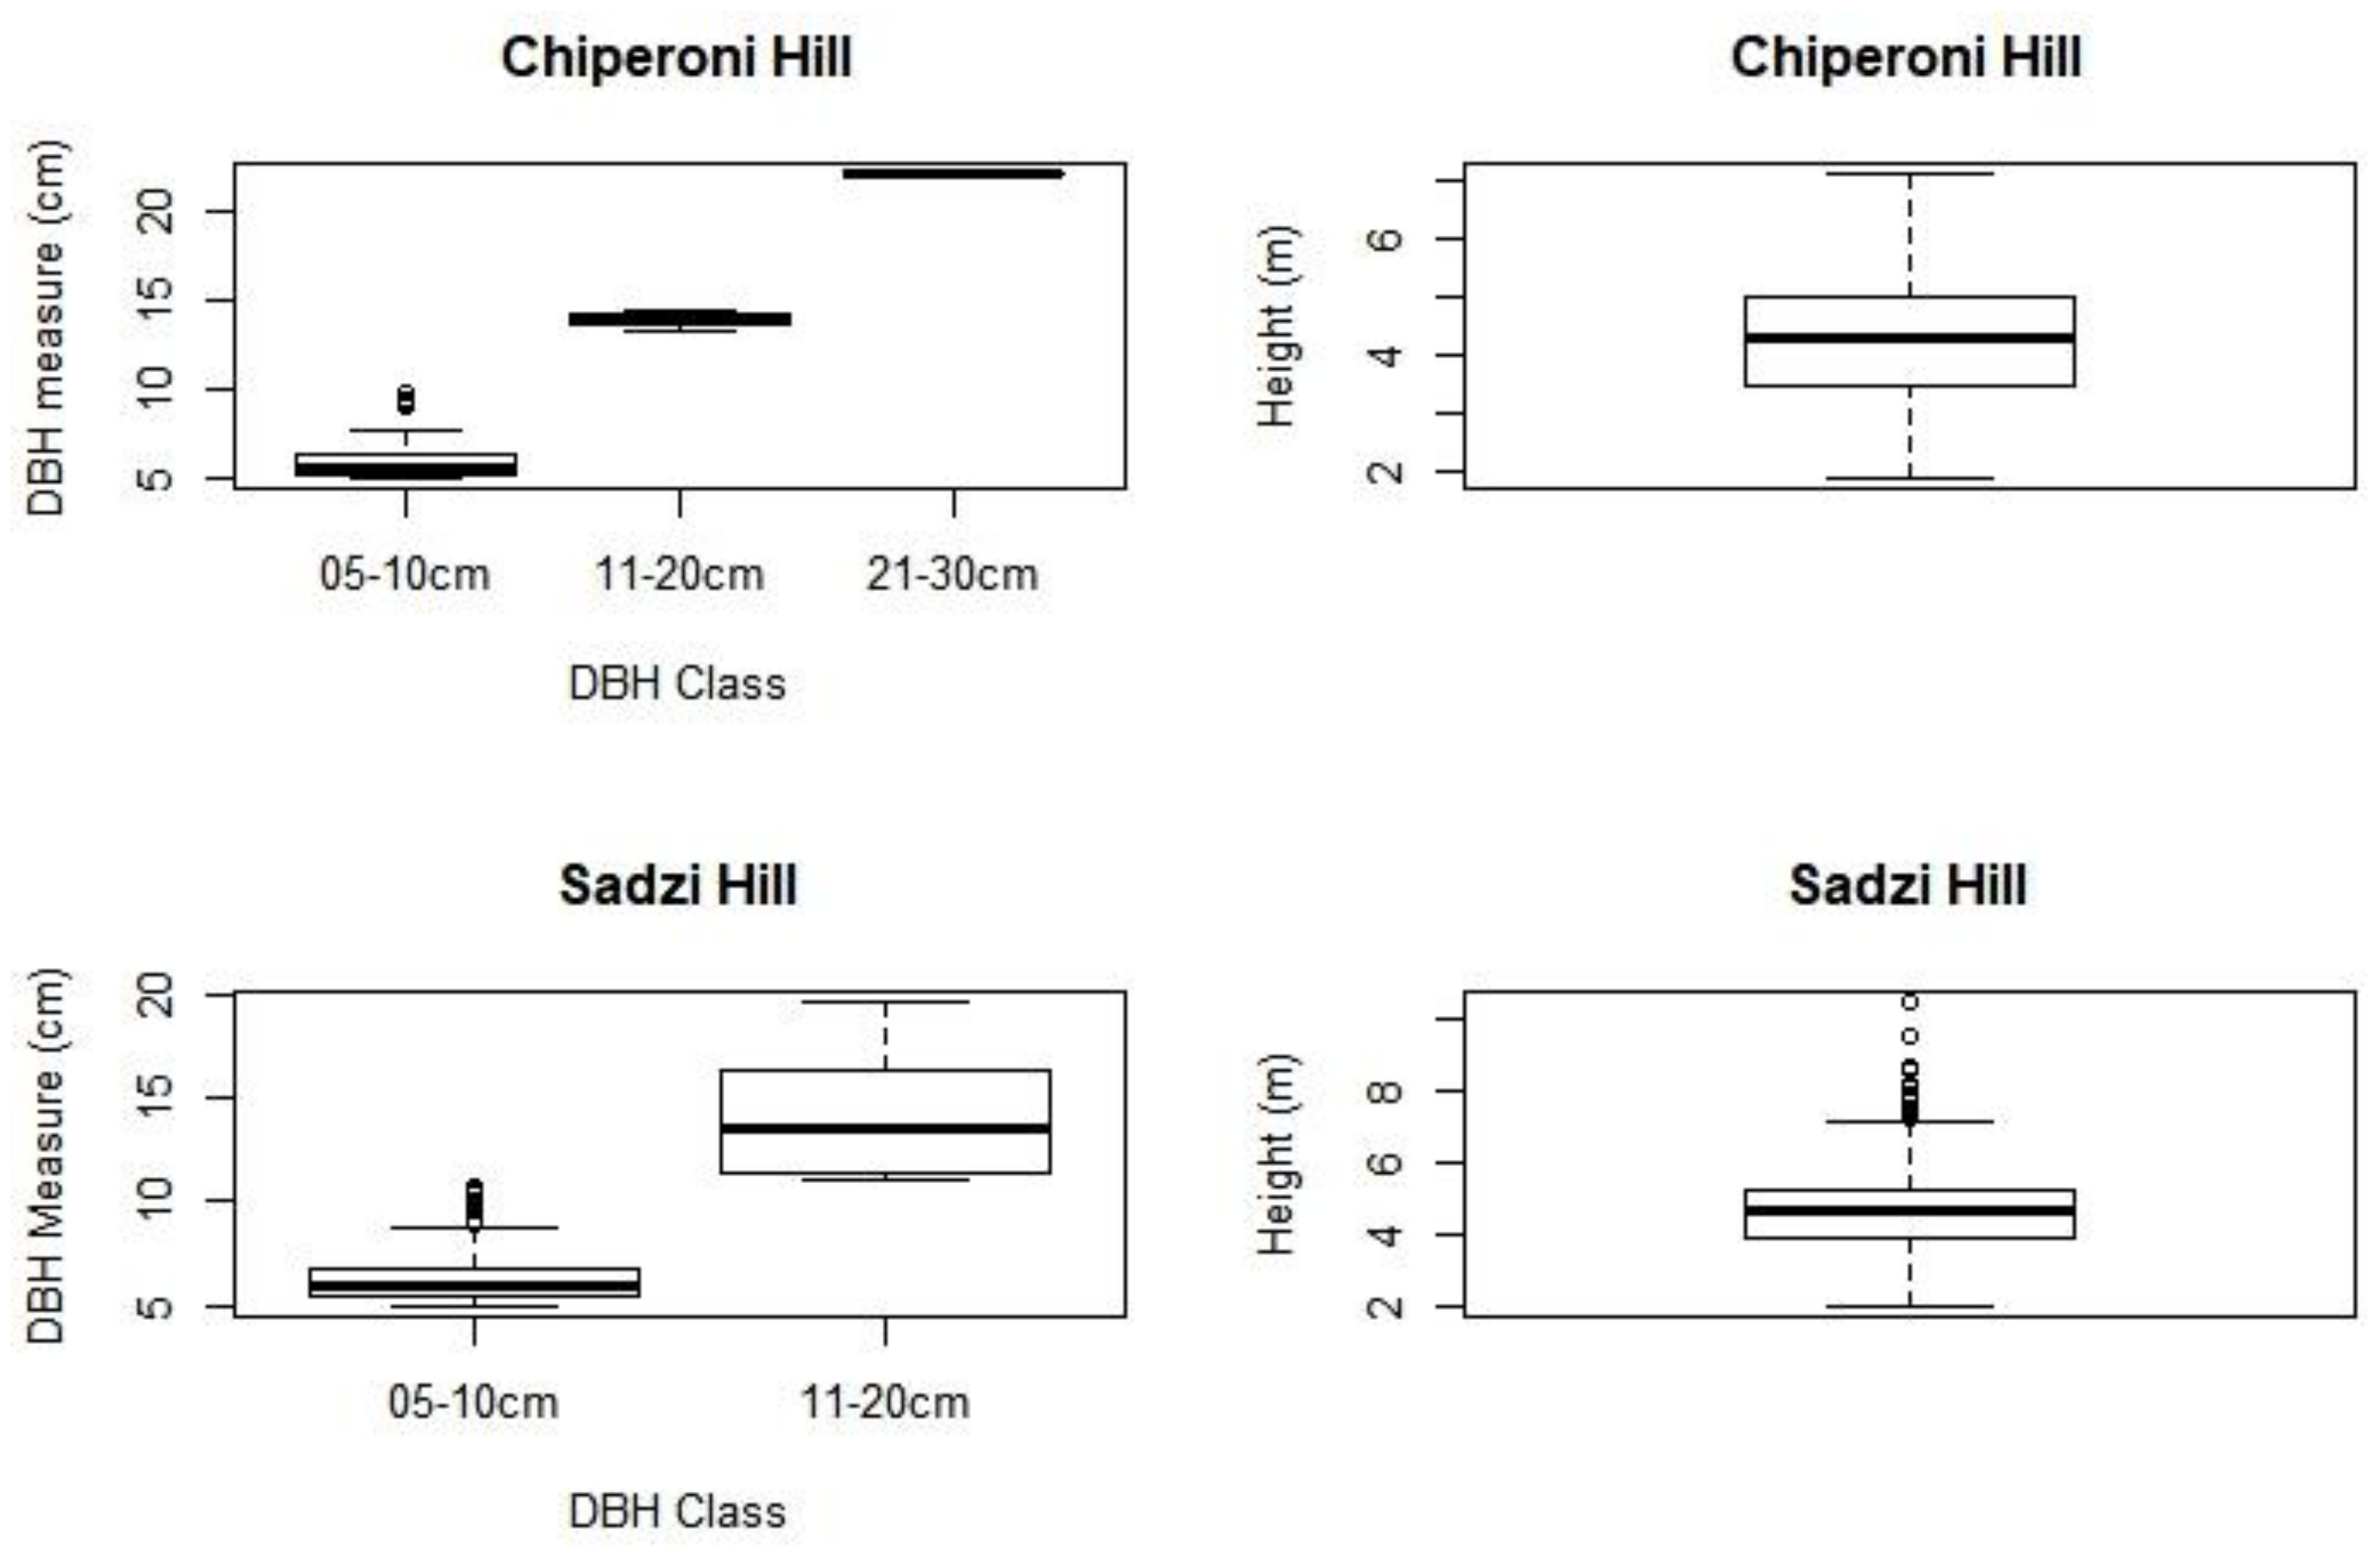
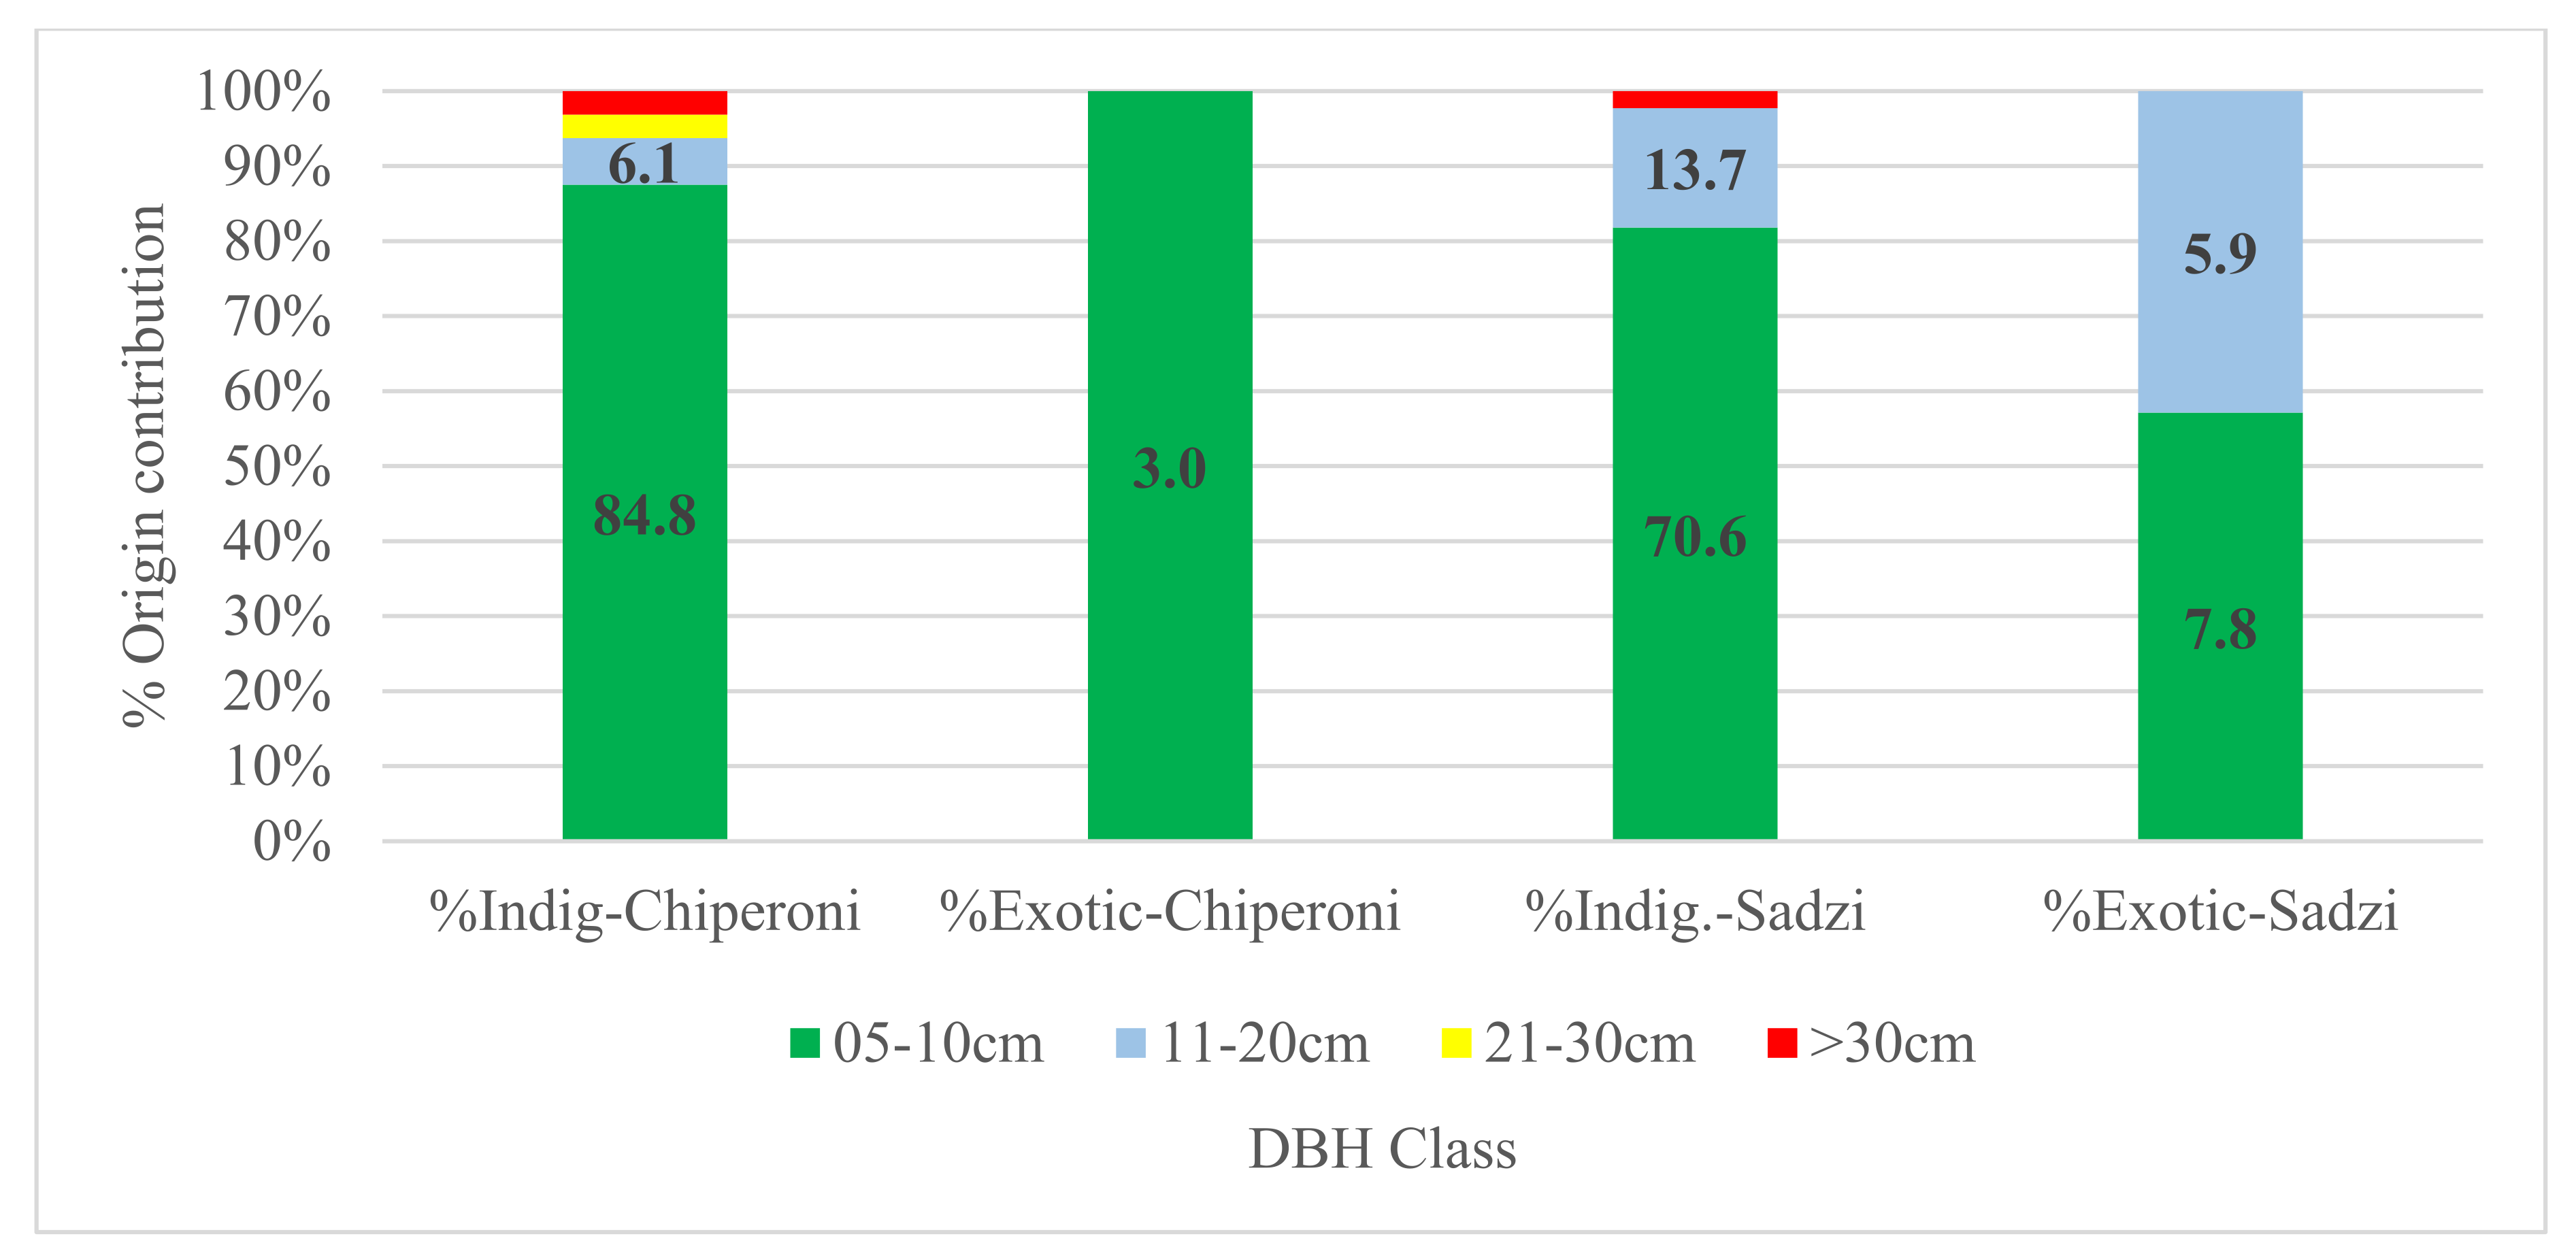
3.2. Growth Parameters, Biodiversity Indices and Importance Value Index

Estimated tree species from the hills using Chao1 revealed that Chiperoni hosts more tree species, at 380, than Sadzi. The Shannon–Wiener diversity, maximum diversity and Shannon’s equitability indices between the hills were not statistically different from each other. Despite this, the Shannon–Wiener, maximum diversity and Shannon’s equitability indices from Sadzi hill were higher. However, the tree species Shannon equitability index of 0.89 for Chiperoni hill was higher than that of Sadzi hill (Table 4). There was a 75.7% dissimilarity in the tree species found in both hills; in other words, only 24.3% of the tree species found in both hills are similar.
The species importance value index (IVI) for the sampled species from both hills was very low, with Diplorhynchus condylocarpon registering 8.03%, followed by Dalbergia boehmii (7.59%) and Eucalyptus saligna (5.35%). More than half of the IVI (54.2%) was from the top 10 tree species out of the 51 from both hills. Regarding the individual hills, the top ten species added up to 71.6% (IVI—214.73) in Chiperoni hill, while those in Sadzi hill added up to 67.7% (IVI—203.02). The relative dominance from the hills (Table 5 and Table 6) was higher than the relative frequency and relative density. Most of the low-IVI species in this study were from Sadzi hill, where species with IVI values of less than 2 totaled 14, with the 5 lowest species being Dalbergia nyasae, Allophyllus africanus, Stereospermum kunthianum, Dombeya rotundifolia and Steganotaenia araliacea. There was no tree species in Chiperoni hill that had an IVI value of less than 2. The dominant species was Dalbergia boehmii from Sadzi hill, with an IVI of 50.33, followed by Diplorhynchus condylocarpon, with an IVI of 36.7, from Chiperoni hill.
For the family importance value index, from both hills, the maximum IVI was recorded by the Fabaceae family. This was co-dominated by Phyllanthaceae (12.44%) and Apocynaceae (10.61%). The top ten families comprised 90.9%, with an almost equal representation for the relative frequency, relative density and relative dominance (Table 7).

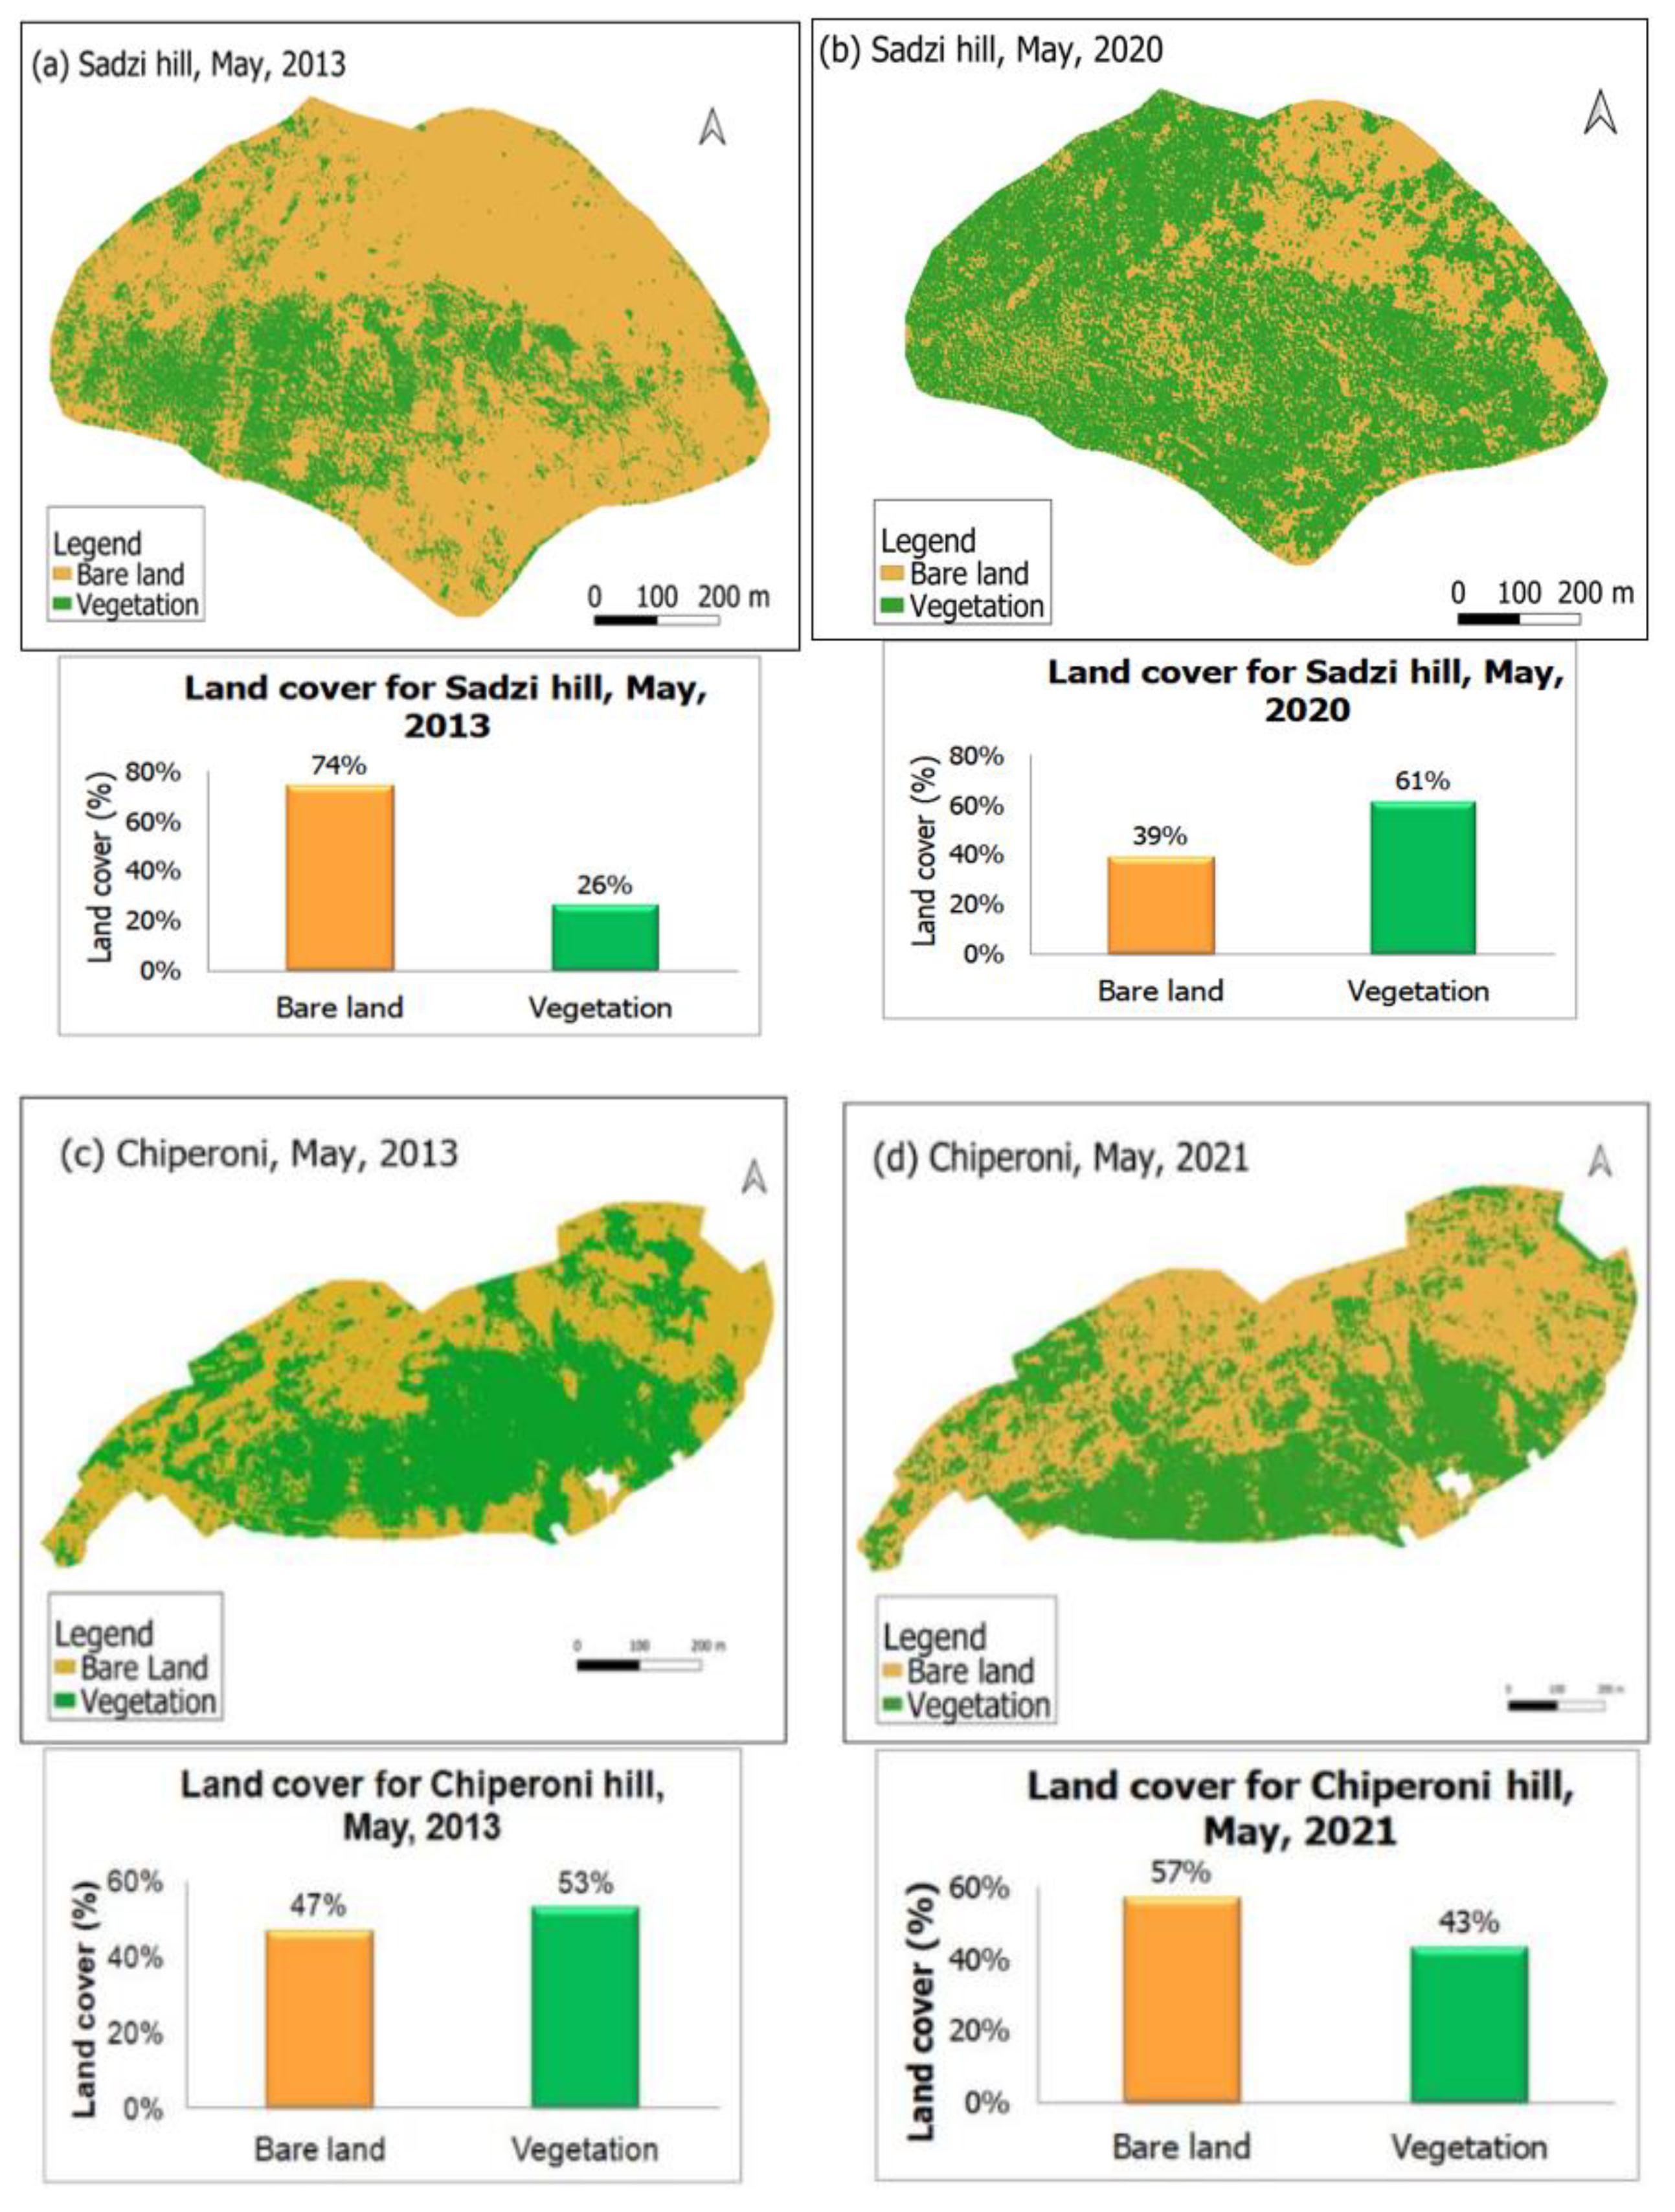
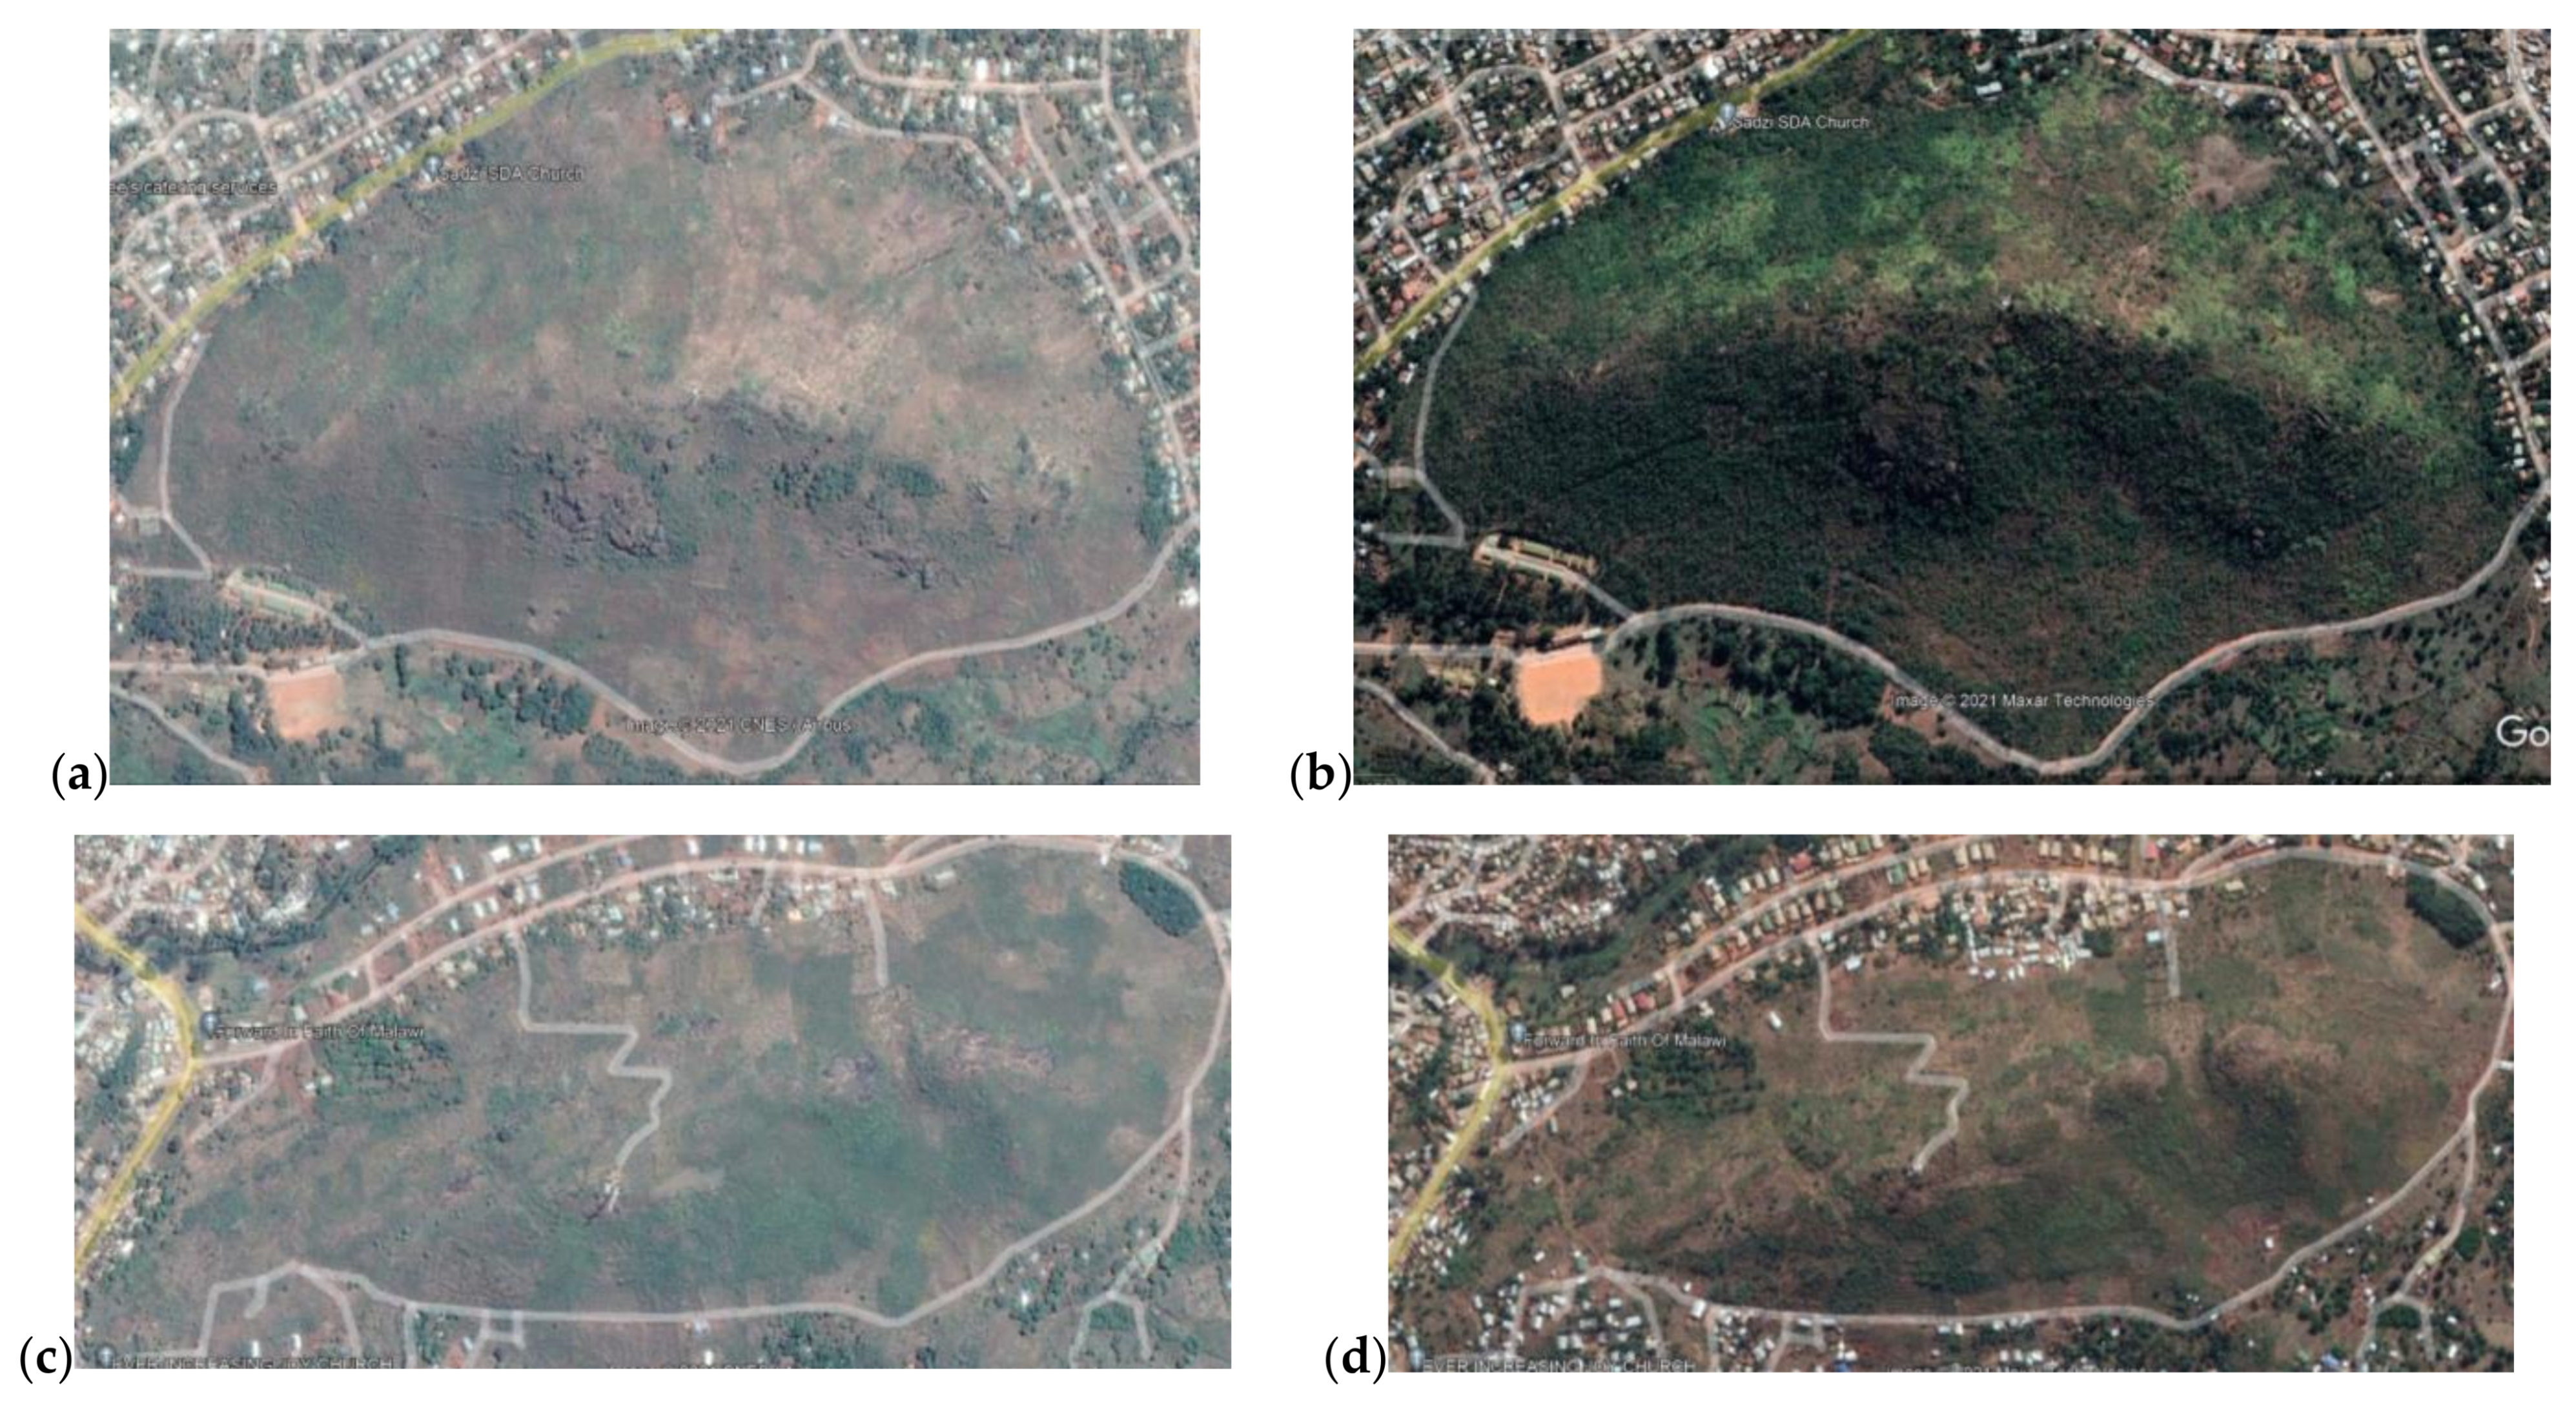
3.3. Spatial–Temporal Vegetation Cover Changes

The results from the classification conducted on the two hills in terms of vegetation cover and bare land proportions in 2013 and 2020 show that Sadzi hill gained an over twofold increase in vegetation cover, while Chiperoni hill lost 10% of its vegetation cover within the same period (Figure 4). The gain in green cover is attributed to the local conservation group that is tirelessly managing the hill despite several drawbacks.
The Google satellite images (Figure 5) of both hills confirm the changes noticeable in both Sadzi and Chiperoni hills. While Sadzi has gained a good vegetation cover, this scenario is absent in Chiperoni hill, which is an example of the tragedy of commons; the management initiatives available at Sadzi are absent here. Other quarters are claiming ownership of the hill and selling some parcels of land to others who are clearing it to build dwelling houses. Classification analysis on structures built within Chiperoni hill revealed an increase in malpractice, with only 2 houses being shown within the hill boundaries in 2013, increasing to 20 houses at present, with some spaces cleared in preparation for house construction or gardening. The only outstanding green space within the hill is the graveyard, in the top right corner, whose green cover was maintained throughout the study periods.

3.4. Impact of Community Management on Vegetation Cover Changes

The key informant interviews revealed that the green cover gain in Sadzi hill is bringing with it numerous ecosystem services that the surrounding community is noticing, appreciating and enjoying, unlike the communities surrounding Chiperoni hill. First and foremost is the end to mud slides as the hill has good vegetation cover, from both ground cover growth and trees, which is controlling runoff down the hill. For over three years now, there have been no cases of running water into people’s households around the hill, as was the case when the hill was bare, as echoed by one of the community members.
‘I am very happy with the restoration from the hill as three years now, I have had no problems with muddy waters running from the hill through my house, rainy seasons were a nightmare but that is now history’.
Sadzi community member
Biodiversity recovery in terms of fauna around the hill includes baboons, rabbits, guinea pigs, a variety of snakes including pythons, pollinators, flocks of guineafowls, quails and numerous other bird species, whereas none could be seen 5 years ago. Sentiments of passion were shared across the respondents and, to a greater extent, from the community management group, as they aspire to continue with the restoration in all spheres, as quoted below.
‘Our vision is to continuously restore the hill and allow all other wild animals that are meant to stay in this hill to stay as they were created to be in this area but we chased them off due to our actions’.
Chairperson from Sadzi Hill Community Management Group
More trees are maturing, and they can be used in the construction industry and to provide support as wind breaks, calling for a proper management plan, as expressed by the forestry officer responsible for the area. The hill is now used as a space for worshiping, where five synagogues or ministries meet at their designated times. Further, weddings have been officiated within the hill spaces. The regeneration has brought with it esthetic beauty and fresh air.
‘With the group duly elected, a constitution and by-laws were crafted to aid in managing the hill and now efforts are towards production of a management plan where the hill will be categorized in line with the core functions it is providing like tourism and hiking routes, conservation area, bee keeping area, provisioning area for harvesting poles, and other things as agreed by all relevant stakeholders’.
Forest Extension Officer, Zomba Forestry Department
With this recovery, bee keeping initiatives with beehive support from the Zomba Action Project have begun at Sadzi hill as one way of protecting the regenerating urban forest, which is now a shining example and a pride for the city and the country in general, as stated by the city council mayor below. This covers all four types of ecosystem services of provisioning, regulating, cultural and supporting services, a serious gain in contrast to the ecosystem disservices (EDS) that gave them a push to reverse the status quo.
‘Sadzi hill is a shining example in Zomba city and augers well with our vision for ‘A green and clean city’, with plans for a hiking trail, a recreation center, tourism hotspot, and environmental education center’.
Mayor, Zomba City Council
Efforts by communities to achieve the attained restoration were first driven by the passion within a group of people who were fed up with the EDS. This was followed by community appreciation of the drive and passion for restoration that the few individuals showed, which was supported by all relevant stakeholders within the city. This called for formalization of the group through formal elections for their recognition at all levels. This, in turn, invigorated the elected group to seek help which came in the form of materials (tree seedlings, tree nursery equipment) and technical expertise. The support was never monetary, and the group had their own nursery which supported tree planting in areas where regeneration was non-existent. On top of this, guards were employed to patrol the hill, with support from the community management group. For instance, in 2019, a wildfire was put out within a short time with support from the community management group and the residents surrounding Sadzi hill. All in all, community passion for conservation, law enforcement efforts and engagement of key stakeholders at all levels (community members, local chiefs, city council, forestry department, NGOs) from 2014 onwards have contributed to the success of Sadzi hill.

4. Discussion

4.1. Tree Species Composition and Diversity Index

The two afforestation hills harbor a considerable number of indigenous tree species, perhaps due to the high natural regeneration that was observed during the field work, with a greater number of more densely regenerated trees in Sadzi hill that were even smaller than 5 cm in DBH, compared to Chiperoni hill. The dominance of the Fabaceae family (20 species) outshines that found in the urban forest of Ibadan metropolis in Nigeria, which was composed of 7 tree species, with a higher number of families (54) in the urban as compared to the peri-urban setup, with 16 families [28]. In a separate study on an urban forest in the city of Minna, Nigeria, 17 tree families were found, with more in Abuja (27) as compared to the peri-urban diversity, whose values were also very low [29]. However, the Fabaceae family was also composed of more tree species. A study by [30] in Kilengwe forest, Morogoro, Tanzania, also found the Fabaceae family to dominate, with 21 species, followed by Moraceae (5 species) and Sterculiaceae (4 species), the latter two being absent in the current study sites. In this study, 55% of the tree species belonged to the Fabaceae family in Chiperoni hill and 45% in Sadzi hill. This confirms the reported findings of [31,32,33,34], which found the Fabaceae family to dominate lowland tropical forests, dominating up to 50% of the species richness, especially in the coastal forests of Tanzania [35].
Of the seven tree species planted by the community members interested in managing Sadzi hill, only Senna siamea was amongst the sampled species. Four of the eleven protected tree species in Malawi [36] were found in the hills, with three species in both hills (Afzelia quanzensis, Pterocarpus angolensis and Terminalia sericea) and the fourth one only found in Sadzi hill (Bridelia micirantha). The species richness, diversity and evenness between the hills were not significantly different. The observed tree species richness, which is a measure of diversity, heavily underestimated the richness of species from Chiperoni hill, with a great magnitude. The Chao 1 estimator for Chiperoni revealed over three times the observed species richness, unlike the other estimators, which were not so different. The authors of [37] found that with a low sampling intensity and a high number of rare species, observed species richness becomes an unreliable indicator of species diversity. However, with the reduced tree density in Chiperoni hill, the chances of obtaining a higher number of species remain questionable. Furthermore, without management in Chiperoni hill, the few remaining singleton and doubleton species could be lost with time. On the other hand, Sadzi hill could have more than the estimated number as the tree density was higher (almost three times that of Chiperoni hill), with more regenerated trees whose DBH values were smaller than 5 cm, and which were not recruited in this study. The 24.3% similarity in the tree species between the hills is an indication that the combined diversity between the hills would enrich the tree biodiversity levels within the city.

4.2. Growth Parameters, Biodiversity Index and Importance Value Index

Shannon–Wiener diversity indices from the two study hills were higher (Sadzi = 3.195; Chiperoni = 3.026) than the values from Seminary hill, India, at 1.41 [38], and from the built-up area of Sokoto city, Nigeria, at 1.84 [39], with low equitability or evenness values of 0.49 and 0.56, respectively, against 0.86 and 0.89 from the two hills. The higher Shannon–Wiener diversity and evenness scores signify a more stable ecosystem, whereas those in India signify a less stable ecosystem with less ecological niches [38]. The higher diversity scores in the study area underscore the low levels of human interferences as the space is solely left to regenerate, unlike in the Sokoto built-up area, where the diversity score is a result of deliberate human actions of promoting tree species for their economic, esthetic and other values amidst their homestead [39]. The high diversity scores observed in the hills agree with the ‘intermediate disturbance hypothesis’ which indicates that higher species tend to occur in areas of low to moderate levels of human development [40].
The ecological and conservation importance of species in a given ecosystem is commonly assessed by using the IVI, which also provides an overview of the species social structure [41,42]. The top ten tree species from both hills had IVI values (Sadzi = 203.02; Chiperoni = 214.73) that were not significantly different from each other (Student’s t-test: p = 0.367). Tree species with a low IVI value need to be prioritized for species conservation as compared to the ones with high values [43]. Combined from both hills, Diplorhynchus condylocarpon had the highest IVI value (63.627), being a dominant species, as found by [44] in a study on the Nongeni Forest Reserve in Morogoro, Tanzania. In this study, the top ten families accounted for 90.9%, which is higher compared to the results from [39], where the five most dominant families accounted for 88.4% in a study on urban tree composition, diversity and structural characteristics from two cities in North West Nigeria. Only the Fabaceae family was present in both study sites, and it is also dominant in Lubumbashi city, the Democratic Republic of Congo [45].

4.3. Vegetation Cover Changes and Impact of Community Management Efforts on Restoration

The vegetation cover analysis for Chiperoni in the period between 2013 and 2021 indicated a 10% drop in vegetation cover as a result of an increase in human pressure on the hill’s resources. This is well justified with the Google satellite images that show an increase in the number of houses being built on the hill in the period under study. Moreover, the key informant interviews revealed that there is a weak management committee and a lack of community involvement in some decision making regarding management of the hill. These assertions have resulted in an increase and a decrease in some ecosystem services provided by the hills in comparison (Table 8). According to [13], depletion of urban forests in Africa is caused by an increase in urbanization, poor enforcement of development control, conflicting land ownership and a lack of priority given to urban green spaces. The encroachment, in a way, is an invitation to EDS, as the continued reduction in vegetation cover due to deforestation for construction of houses and farming will give way to mud slides, soil erosion and biodiversity loss. The National Biodiversity Strategy and Action Plan II (2015–2025) [46] further points out that loss of plant and animal species is indeed threatened by habitat loss as a result of urban expansion, human population growth, forestry exploitation, fires and unsustainable harvesting of plants for medicinal purposes.
Human population growth and its exerted pressure on the study hills rendered Sadzi almost bare, but coordinated efforts in managing the hill have reversed the trend as plant and animal species are being restored. The vegetation cover trends for Sadzi hill in the period between 2013 and 2020 show over a twofold increase in vegetation cover. This is attributed largely to the strong community management committee of Sadzi hill. This indicates the influence of communities in the successful management of urban green spaces. This also concurs with the findings by [13] that identified community involvement in the management of urban green spaces as one of the factors affecting successful urban green space management in Africa. There are many factors that can trigger active involvement of communities in urban forest management. The current study reveals that EDS such as landslides and soil erosion, as a result of Sadzi hill’s depletion, triggered the communities to begin conservation initiatives of the green space. The gain in vegetation cover of Sadzi hill is a plus in these times of climate change, as efforts in green infrastructure or nature-based solutions are being encouraged. For instance, climate change-related hazards such as high overall temperatures which exacerbate urban heat islands, higher nighttime temperatures and heat wave problems can be dealt with through increased tree canopy cover, availability of parks and open spaces and green roofs in urban environments [47].
The restoration taking place in Sadzi hill provides a good starting point for the creation of urban green spaces where the greenery in the hill can be easily converted to parks for ease of access by the communities around it. Furthermore, nature walks can be established where city residents can enjoy a walk within the mountain greenery. The World Health Organization (WHO) recommends at least 9 m2 of green space per person, with an ideal of 50 m2, while taking at least a 10-min walk to a nearby park [2]. It is common knowledge that parks and other green spaces should provide multifunctional and multi-scale ecosystem services to their residents, and Sadzi hill is offering these [48,49,50]. The ecosystem services the hill is providing span from provisioning, regulating, cultural and supporting services (Table 8). Provisioning services in the form of food come from the fruit trees available (Mangifera indica, Uapaca kirkiana, Annona squamosa, Psidium guajava), regulating the environment (soil, temperature, water and air), playing a cultural role (natural medicine, esthetic beauty, spiritual connection, physical exercises) and a supporting function and, finally, providing home to flora and fauna. In terms of food provision from the tree species sampled, both hills boasted Anonna senegalensis, Parinari curatellifolia, Strychnos spinose and Uapaca kirkiana as wild fruit tree species which the communities around the hill enjoy when in fruiting season. Wild fruits add to the dietary diversity of urban residents, as reported by [51] in a study on foraging wild food in urban spaces from two towns in South Africa where wild fruits were consumed a few times a year as they are seasonal, mostly during the rainy season, eaten as a snack at any time of the day, as reported by 79% of the respondents.
The EDS the hills are producing that are affecting human wellbeing as of now are different (Table 9). Sadzi hill has moved from more EDS to very few EDS, with more ecosystem services emerging. Contrary to this, Chiperoni hill is on a path of increased EDS as provisioning ecosystem services are increasing at the expense of regulating, cultural and supporting ecosystem services. Despite the fact that there is no clear relationship between biodiversity and EDS [52], the Millennium Ecosystem Assessment advocates for the maintenance of sufficient levels of biodiversity as a primary supporting service, hence the need for ecosystem level management frameworks for securing ecosystem services for human wellbeing [48]. However, there are good examples of the link between diminished biomass and biodiversity with increased EDS such as an increased probability and magnitude of flooding of adjacent lands, homes and infrastructure due to loss of riparian vegetation [52]. EDS are rarely discussed in green space management and biodiversity conservation [53,54]. Despite this, there are no recorded EDS from Sadzi hill with the current restoration level. However, there are threats of snake bites from the snakes present in the mountain. Some characteristics of urban green spaces perceived as negative for human wellbeing include allergens from trees and flowers, damage to infrastructure by plants and animals, increase in unwanted species such as pests and nuisance animals and fear of and stress from dark green areas [52,55]. In a study by [55], it was concluded that the abundance and species composition of hornets, critical pests in Japan, were both strongly associated with the level of urban greenness, where an increase in the greenness of urban areas meant an increase in hornet abundance and altered species composition.
It is expected that if the new regenerated trees are undisturbed, in the coming years, afforestation hills such as Sadzi will contribute more to the overall carbon stock of Zomba city. Additionally, with the many small regenerated trees with a DBH of below 5 cm, there is high potential for increasing the number of tree species present in the hill. The success of Sadzi hill’s regeneration is already a contribution Zomba city is making to SDG nos. 3 (good health and wellbeing), 11 (sustainable cities and communities), 13 (climate action), 15 (life on land) and 17 (partnerships for the goals). In fact, of the 10 targets for SDG 11, 3 relate to nature-based solutions: increase access to green spaces, reduce loss of lives and livelihoods from disaster and increase city planning to create safe, inclusive, resilient and sustainable cities [56]. The 1st World Forum on Urban Forest held in December 2018 in Mantova, Italy, called for action on urban forests and green spaces to make cities greener, healthier and happier for all. They also issued a challenge to all cities of the globe to adhere to the ‘Tree Cities of the World Programme’. With more partnerships and support for communities such as those of Sadzi, bare hills in urban environments can be a different story, reversing ecosystem disservices to ecosystem services.
It is pleasing to note that the city council has environmental management byelaws that support community participation in natural resource management. One of the clauses in support of this in the byelaws states that ‘The City of Zomba shall facilitate the formation of area committees within the city in order to promote the tree planting, protection and management of trees and forest vegetation with an aim of encouraging community participation’. As much as this is appreciated, the conservation group in Sadzi expressed concern over the conduct of some authorities who still want to take charge of the hill for economic benefits and not conservation. Fines are not punitive enough for those caught cutting trees within the hill. This may result in negative outcomes on the hill where community participation is higher than municipality involvement. The authors of [57] noted that meaningful community engagement increases the likelihood of more positive outcomes in urban greening projects; however, the roles of the municipality should not be ignored. It is worth noting that community consultation and participation alone are not sufficient to immunize a created green space or park from damage as it requires true community involvement, stewardship and willingness to act to prevent damage from free reign agents [57]. The Sadzi hill conservation group has the latter two qualities, but community involvement is still a problem; in some quarters, there is a feeling that the community has been denied access to other economic activities on the hill such as gardening, molding bricks and tree cutting for fuel wood, charcoal and timber which were attributed to the ecosystem disservices that triggered a call for a reversal to start conserving the mountain first with a stop to all the activities and let natural regeneration take charge with supplemental tree planting where necessary. The efforts by the Sadzi conservation group concur with an assertion by the authors of [58] who noted that local communities are drawing effectively on community science for better conservation and livelihood outcomes globally, in a manner compatible with broader trends towards ecosystem-based management and local stewardship. Despite these efforts by the community group [59], revealed that most local municipalities were not managing their urban trees and green spaces in a planned or systematic manner due to constraining factors such as insufficient funds, insufficient personnel, lack of equipment and lack of political support in two poorer provinces in South Africa, which are common in most developing countries in African cities.

5. Conclusions

With the successes scored from Sadzi hill, urban community management has illustrated its importance in natural resource management and its resulting contribution towards biodiversity conservation, the availability of urban green spaces and the related ecosystem services and disservices. With the higher estimated potential of species richness for Chiperoni hill, supported with community management, the hill can also highly compete with Sadzi hill in biodiversity conservation, provision of green spaces and a myriad of ecosystem services. Hills within city environments can provide the ecosystem services that are needed by the residents and should not be encroached for agricultural or dwelling reasons which result in the production of more ecosystem disservices in the long run. This study provides the baseline tree biodiversity present in both hills; however, a similar study needs to be conducted at least after five years to appreciate further changes, if any, in tree species richness, diversity and evenness between the hills, and any changes in community management efforts and power dynamics. This will also help to understand the state of biodiversity reserves and ecosystem services these urban green spaces are providing to the local communities and the city in general. As this study focused on tree species richness, diversity and evenness, another study can also include the fauna in both hills. To sustain the restoration efforts achieved, there is a need to consider incorporating both ecosystem services and ecosystem disservices that may emerge in the management plans for the hills. As efforts are put in place to continuously realize more ecosystem services, notable ecosystem disservices need to be reduced, as well as making deliberate efforts to build the adaptive capacity of the communities to either minimize or respond to EDS. Environmental education and science communication are, therefore, key in reducing the fear and vulnerabilities that accompany increased urban greenness, which may bring with it wildlife–human conflicts that are viewed as ecosystem disservices.

Author Contributions

Conceptualization, P.J.L. and F.B.C.; methodology, P.J.L., F.B.C., T.M. and L.K.; software, T.M. and L.K.; validation, P.J.L.; formal analysis, P.J.L., T.M. and L.K.; investigation, P.J.L. and F.B.C.; resources, S.S.C.; data curation, P.J.L.; writing—original draft preparation, P.J.L.; writing—review and editing, F.B.C., H.G. and S.S.C.; visualization, P.J.L.; supervision, S.S.C.; project administration, P.J.L.; funding acquisition, S.S.C. All authors have read and agreed to the published version of the manuscript.

Funding

This study was conducted under the project ‘Adaptability, Food Security, Risk and the Right to the City in sub-Saharan Africa: Towards Sustainable Livelihoods and Green Infrastructure’ (AFRICITY). This was funded by the German Federal Ministry of Education and Research (BMBF) (Project ID: 01DG16015). The mobility grant was from the German Academic Exchange Service (DAAD) (Project ID: 57353580).

Acknowledgments

Special thanks to the field team who took courage traversing the hills during data collection and tree identification. We would also like to acknowledge the service provided by the Forest Research Institute of Malawi for the field gadgets that made field measurements during data collection possible. Gratitude goes to the key informants for the time they gave us and the detailed information they provided without looking for something in return.

Conflicts of Interest

The authors declare no conflict of interest. The funders had no role in the design of the study; in the collection, analyses or interpretation of data; in the writing of the manuscript, or in the decision to publish the results.

Appendix A

Table A1. List of tree species (DBH ≥ 5 cm) recorded in the study sites and their abundance; species with asterisk (*) are exotic.
FamilyTree SpeciesChiperoniSadziTotal Abundance
AnacardiaceaeLannea discolour246
Rhus longipes 33
Rhus natalensis 22
Sclerocarya birrea 11
AnnonaceaeAnonna senegalensis21719
ApiaceaeSteganotaenia araliacea 11
ApocynaceaeDiplorhynchus condylocarpon112839
Holarrhena pubescens 33
Rauvolfia caffra3 3
AraliaceaeCussonia arborea61117
AsteraceaeVernonia corolata112
BignoniaceaeStereospermum kunthianum112
ChrysobalanaceaeParinari curatellifolia11213
CombretaceaeCombretum molle246
Combretum zeyheri2 2
Pteleopsis myritifolia7 7
Terminalia sericea123
FabaceaeAcacia gerrardii5 5
Afzelia quanzensis134
Albizia antunesiana112
Albizia versicolor 66
Bauhinia petersiana51924
Bobgunnia madagascariensis 77
Brachystegia boehmii 11
Brachystegia bussei 1818
Brachystegia longifolia134
Brachystegia spiciformis 22
Brachystegia utilis167
Dalbergia boehmii24749
Dalbergia melanoxylon2 2
Dalbergia nitidula246
Dalbergiella nyasae 11
Julbernardia globiflora11819
Pericopsis angolensis 88
Piliostigma thonningii 55
Pterocarpus angolensis81725
* Senna siamea 55
Lamiaceae* Gmelina arborea 2020
Vitex doniana 88
LoganiaceaeStrychnos innocua7 7
Strychnos spinose5 5
MalvaceaeDombeya rotundifolia 11
Grewia micrantha1 1
Meliaceae* Toona ciliata 77
Myrtaceae* Eucalyptus camaldulensis5 5
* Eucalyptus saligna 2929
PhyllanthaceaeBridelia micrantha 22
Margaritaria discoidea14 14
Pseudolachnostylis maprouneifolia1910
Uapaca kirkiana 44
SapindaceaeAllophyllus africanus 11

References

  1. Gairola, S.; Noresah, M.S. Emerging trend of urban green space research and the implications for safeguarding biodiversity: A viewpoint. Nat. Sci. 2010, 8, 43–49. [Google Scholar]
  2. World Health Organization, Regional Office for Europe. Urban Green Spaces: A Brief for Action; World Health Organization, Regional Office for Europe: Copenhagen, Denmark, 2017. [Google Scholar]
  3. Titz, A.; Chiotha, S.S. Pathways for Sustainable and Inclusive Cities in Southern and Eastern Africa through Urban Green Infrastructure? Sustainability 2019, 11, 2729. [Google Scholar] [CrossRef] [Green Version]
  4. Haines-Young, R.; Potschin, M. Guidance on the Application of the Revised Structure. 2018, p. 53. Available online: https://cices.eu/content/uploads/sites/8/2018/01/Guidance-V51-01012018.pdf (accessed on 16 September 2021).
  5. Jim, C.Y.; Chen, W.Y. Recreation–amenity use and contingent valuation of urban greenspaces in Guangzhou, China. Landsc. Urban Plan. 2006, 75, 81–96. [Google Scholar] [CrossRef]
  6. O’Brien, L.; De Vreese, R.; Kern, M.; Sievänen, T.; Stojanova, B.; Atmiş, E. Cultural ecosystem benefits of urban and peri-urban green infrastructure across different European countries. Urban For. Urban Green. 2017, 24, 236–248. [Google Scholar] [CrossRef]
  7. Farhadi, H.; Faizi, M.; Sanaieian, H. Mitigating the urban heat island in a residential area in Tehran: Investigating the role of vegetation, materials, and orientation of buildings. Sustain. Cities Soc. 2019, 46, 101448. [Google Scholar] [CrossRef]
  8. Yao, L.; Chen, L.; Wei, W.; Sun, R. Potential reduction in urban runoff by green spaces in Beijing: A scenario analysis. Urban For. Urban Green. 2015, 14, 300–308. [Google Scholar] [CrossRef]
  9. Nowak, D.J.; Crane, D.E.; Stevens, J.C. Air pollution removal by urban trees and shrubs in the United States. Urban For. Urban Green. 2006, 4, 115–123. [Google Scholar] [CrossRef]
  10. Nowak, D.J.; Hirabayashi, S.; Bodine, A.; Hoehn, R. Modeled PM2.5 removal by trees in ten U.S. cities and associated health effects. Environ. Pollut. 2013, 178, 395–402. [Google Scholar] [CrossRef] [PubMed]
  11. Hernández, H.J.; Villaseñor, N.R. Twelve-year change in tree diversity and spatial segregation in the Mediterranean city of Santiago, Chile. Urban For. Urban Green. 2018, 29, 10–18. [Google Scholar] [CrossRef]
  12. Gong, C.; Yu, S.; Joesting, H.; Chen, J. Determining socioeconomic drivers of urban forest fragmentation with historical remote sensing images. Landsc. Urban Plan. 2013, 117, 57–65. [Google Scholar] [CrossRef]
  13. Mensah, C.A. Urban Green Spaces in Africa: Nature and Challenges. Int. J. Ecosyst. 2014, 4, 1–11. [Google Scholar]
  14. Murtala, D.; Manaf, L.A. Progress and Methodological Approaches in Urban Trees and Forests Research in Africa. J. Environ. Earth Sci. 2019, 9, 32. [Google Scholar]
  15. Gwedla, N.; Shackleton, C.M. Population size and development history determine street tree distribution and composition within and between Eastern Cape towns, South Africa. Urban For. Urban Green. 2017, 25, 11–18. [Google Scholar] [CrossRef]
  16. Adjei Mensah, C.; Andres, L.; Baidoo, P.; Eshun, J.K.; Antwi, K.B. Community Participation in Urban Planning: The Case of Managing Green Spaces in Kumasi, Ghana. Urban Forum 2017, 28, 125–141. [Google Scholar] [CrossRef]
  17. Azadi, H.; Ho, P.; Hafni, E.; Zarafshani, K.; Witlox, F. Multi-stakeholder involvement and urban green space performance. J. Environ. Plan. Manag. 2011, 54, 785–811. [Google Scholar] [CrossRef]
  18. Southern African Development Community: Show. Available online: https://www.sadc.int/documents-publications/show/SADC_Regional_Biodiversity_Strategy.pdf (accessed on 16 September 2021).
  19. Johnston, M.; Shimada, L. Urban forestry in a multicultural society. J. Arboric. 2004, 30, 185–192. [Google Scholar]
  20. Mahjabeen, Z.; Shrestha, K.K.; Dee, J.A. Rethinking Community Participation in Urban Planning: The Role of Disadvantaged Groups in Sydney Metropolitan Strategy. Australas. J. Reg. Stud. 2009, 15, 45–63. [Google Scholar]
  21. Mattijssen, T.J.M.; van der Jagt, A.; Buijs, A.; Elands, B.; Erlwein, S.; Lafortezza, R. The long-term prospects of citizens managing urban green space: From place making to place-keeping? Urban For. Urban Green. 2017, 26, 78–84. [Google Scholar] [CrossRef]
  22. Mattijssen, T.; Buijs, A.; Elands, B. The benefits of self-governance for nature conservation: A study on active citizenship in the Netherlands. J. Nat. Conserv. 2018, 43, 19–26. [Google Scholar] [CrossRef]
  23. Vargas-Hernández, J.G.; Pallagst, K.; ZdunekWielgołaska, J. Urban green spaces as a component of an ecosystem: Functions, services, users, community involvement, initiatives and actions. Rev. Urban. 2017, 37, 1–26. [Google Scholar] [CrossRef]
  24. Wamsler, C.; Alkan-Olsson, J.; Björn, H.; Falck, H.; Hanson, H.; Oskarsson, T.; Simonsson, E.; Zelmerlow, F. Beyond participation: When citizen engagement leads to undesirable outcomes for nature-based solutions and climate change adaptation. Clim. Chang. 2020, 158, 235–254. [Google Scholar] [CrossRef] [Green Version]
  25. du Toit, M.J.; Cilliers, S.S.; Dallimer, M.; Goddard, M.; Guenat, S.; Cornelius, S.F. Urban green infrastructure and ecosystem services in sub-Saharan Africa. Landsc. Urban Plan. 2018, 180, 249–261. [Google Scholar] [CrossRef]
  26. Chimaimba, F.B.; Kafumbata, D.; Chanyenga, T.; Chiotha, S. Urban tree species composition and diversity in Zomba city, Malawi: Does land use type matter? Urban For. Urban Green. 2020, 54, 126781. [Google Scholar] [CrossRef]
  27. Oksanen, J.; Blanchet, F.G.; Kindt, R.; Legendre, P.; Minchin, P.R.; O’Hara, R.B.; Simpson, G.L.; Solymos, P.; Henry, M.; Stevens, M.H.H.; et al. Vegan: Community Ecology Package. R Package Version 2.2–1.2. 2012. [Google Scholar]
  28. Agbelade, A.D.; Onyekwelu, J.; Apogbona, O. Assessment of Urban Forest Tree Species Population and Diversity in Ibadan, Nigeria. Environ. Ecol. 2016, 4, 185–192. [Google Scholar] [CrossRef]
  29. Agbelade, A. Tree Species Diversity and their Benefits in Urban and Peri-Urban Areas of Abuja and Minna, Nigeria. Appl. Trop. Agric. 2016, 21, 27–36. [Google Scholar]
  30. Kacholi, D.S. Analysis of Structure and Diversity of the Kilengwe Forest in the Morogoro Region, Tanzania. Int. J. Biodivers. 2014, 2014, e516840. [Google Scholar] [CrossRef] [Green Version]
  31. Gentry, A.H. Changes in Plant Community Diversity and Floristic Composition on Environmental and Geographical Gradients. Ann. Mo. Bot. Gard. 1988, 75, 1–34. [Google Scholar] [CrossRef]
  32. Valencia, R.; Balslev, H.; Paz YMiño, C. High tree alpha-diversity in Amazonian Ecuador. Biodivers. Conserv. 1994, 3, 21–28. [Google Scholar] [CrossRef]
  33. Addo-Fordjour, P.; Obeng, S.; Anning, A.K.; Addo, M.G. Floristic Composition, Structure and Natural Regeneration in a Moist Semi-Deciduous Forest Following Anthropogenic Disturbances and Plant Invasion. Available online: https://restoration.elti.yale.edu/resource/floristic-composition-structure-and-natural-regeneration-moist-semi-deciduous-forest (accessed on 16 September 2021).
  34. Kacholi, D.S.; Whitbread, A.M.; Worbes, M. Diversity, abundance, and structure of tree communities in the Uluguru forests in the Morogoro region, Tanzania. J. For. Res. 2015, 26, 557–569. [Google Scholar] [CrossRef]
  35. Burgess, N.D.; Clarke, G.P. Coastal forests of eastern Africa. Coast. For. East. Afr. 2000, 64, 337–367. [Google Scholar]
  36. Table_4_5—Protected Tree Species in Malawi. Available online: http://www.sdnp.org.mw/enviro/action_plan/table_4_5.html (accessed on 17 September 2021).
  37. Chao, A.; Chazdon, R.L.; Colwell, R.K.; Shen, T.-J. Abundance-based similarity indices and their estimation when there are unseen species in samples. Biometrics 2006, 62, 361–371. [Google Scholar] [CrossRef] [PubMed]
  38. Dhyani, S.; Singh, A.; Gujre, N.; Joshi, R.K. Quantifying tree carbon stock in historically conserved Seminary Hills urban forest of Nagpur, India. Acta Ecol. Sin. 2021, 41, 193–203. [Google Scholar] [CrossRef]
  39. Dangulla, M.; Abd Manaf, L.; Ramli, M.F.; Yacob, M.R. Urban tree composition, diversity and structural characteristics in North-western Nigeria. Urban For. Urban Green. 2020, 48, 126512. [Google Scholar] [CrossRef]
  40. Mckinney, M. Effects of urbanization on species richness: A review of plants and animals. Urban Ecosyst. 2008, 11, 161–176. [Google Scholar] [CrossRef]
  41. Sarkar, M.; Devi, A. Assessment of diversity, population structure and regeneration status of tree species in Hollongapar Gibbon Wildlife Sanctuary, Assam, Northeast India. Trop. Plant Res. 2014, 1, 26–36. [Google Scholar]
  42. Gopal, D.; Nagendra, H.; Manthey, M. Vegetation in Bangalore’s Slums: Composition, Species Distribution, Density, Diversity, and History. Environ. Manag. 2015, 55, 1390–1401. [Google Scholar] [CrossRef] [PubMed]
  43. Kacholi, D.S. Effects of Habitat Fragmentation on Biodiversity of Uluguru Mountain Forests in Morogoro Region, Tanzania; Cuvillier Verlag: Göttingen, Germany, 2013; Available online: https://cuvillier.de/uploads/preview/public_file/7914/Leseprobe.pdf (accessed on 16 September 2021).
  44. Kacholi, D.S. Assessment of Tree Species Richness, Diversity, Population Structure and Natural Regeneration in Nongeni Forest Reserve in Morogoro Region, Tanzania. Tanzan. J. Sci. 2019, 45, 330–345. [Google Scholar]
  45. Useni Sikuzani, Y.; Malaisse, F.; Kaleba, S.C.; Mwanke, A.K.; Yamba, A.M.; Khonde, C.N.; Bogaert, J.; Kankumbi, F.M. Tree diversity and structure on green space of urban and peri-urban zones: The case of Lubumbashi City in the Democratic Republic of Congo. Urban For. Urban Green. 2019, 41, 67–74. [Google Scholar] [CrossRef]
  46. National Biodiversity Strategy and Action Plan II 2015–2025. Available online: https://cepa.org.mw/Library/government-publications/national-biodiversity-strategy-and-action-plan-ii-2015-2025 (accessed on 17 September 2021).
  47. Hobbie, S.E.; Grimm, N.B. Nature-based approaches to managing climate change impacts in cities. Philos. Trans. R. Soc. B Biol. Sci. 2020, 375, 20190124. [Google Scholar] [CrossRef] [Green Version]
  48. Millennium Ecosystem Assessment. Ecosystems and Human Well-Being: Health Synthesis. 2005. Available online: https://www.who.int/publications-detail-redirect/ecosystems-and-human-well-being-health-synthesis. (accessed on 16 September 2021).
  49. Benedict, M.A.; McMahon, E. Green Infrastructure: Linking Landscapes and Communities; Island Press: Washington, DC, USA, 2006. [Google Scholar]
  50. Hansen, R.; Pauleit, S. From multifunctionality to multiple ecosystem services? A conceptual framework for multifunctionality in green infrastructure planning for urban areas. Ambio 2014, 43, 516–529. [Google Scholar] [CrossRef] [PubMed] [Green Version]
  51. Garekae, H.; Shackleton, C.M. Urban foraging of wild plants in two medium-sized South African towns: People, perceptions and practices. Urban For. Urban Green. 2020, 49, 126581. [Google Scholar] [CrossRef]
  52. Shackleton, C.M.; Ruwanza, S.; Sanni, G.S.; Bennett, S.; De Lacy, P.; Modipa, R.; Mtati, N.; Sachikonye, M.; Thondhlana, G. Unpacking Pandora’s Box: Understanding and Categorising Ecosystem Disservices for Environmental Management and Human Wellbeing. Ecosystems 2016, 19, 587–600. [Google Scholar] [CrossRef]
  53. Lyytimäki, J.; Sipilä, M. Hopping on one leg—The challenge of ecosystem disservices for urban green management. Urban For. Urban Green. 2009, 8, 309–315. [Google Scholar] [CrossRef]
  54. Lyytimäki, J. Ecosystem disservices: Embrace the catchword. Ecosyst. Serv. 2015, 12, 136. [Google Scholar] [CrossRef]
  55. Azmy, M.M.; Hosaka, T.; Numata, S. Responses of four hornet species to levels of urban greenness in Nagoya city, Japan: Implications for ecosystem disservices of urban green spaces. Urban For. Urban Green. 2016, 18, 117–125. [Google Scholar] [CrossRef]
  56. United Nations. Sustainable Development Goals|United Nations Development Programme. 2015. Available online: https://www.undp.org/sustainable-development-goals?utm_source=EN&utm_medium=GSR&utm_content=US_UNDP_PaidSearch_Brand_English&utm_campaign=CENTRAL&c_src=CENTRAL&c_src2=GSR&gclid=Cj0KCQjw1ouKBhC5ARIsAHXNMI-PaZFhOCglUMtogq9K7CISLgfc6JnIIQRpW7AohYzzqWDySYIPnpEaAjVnEALw_wcB (accessed on 16 September 2021).
  57. Shackleton, C.M.; Njwaxu, A. Does the absence of community involvement underpin the demise of urban neighbourhood parks in the Eastern Cape, South Africa? Landsc. Urban Plan. 2021, 207, 104006. [Google Scholar] [CrossRef]
  58. Charles, A.; Loucks, L.; Berkes, F.; Armitage, D. Community science: A typology and its implications for governance of social-ecological systems. Environ. Sci. Policy 2020, 106, 77–86. [Google Scholar] [CrossRef]
  59. Chishaleshale, M.; Shackleton, C.M.; Gambiza, J.; Gumbo, D. The prevalence of planning and management frameworks for trees and green spaces in urban areas of South Africa. Urban For. Urban Green. 2015, 14, 817–825. [Google Scholar] [CrossRef]
Figure 1. Location of the study hills within Zomba city, Malawi.
Land 10 01258 g001
Figure 2. DBH (cm) and height (m) distribution of individual trees from the two hills.
Land 10 01258 g002
Figure 3. Tree species contribution in different DBH classes from Chiperoni and Sadzi hills.
Land 10 01258 g003
Figure 4. Status of land cover of Sadzi and Chiperoni hills in 2013 and 2020/2021, respectively. (a) Sadzi hill, May 2013, (b) Sadzi hill, May 2020, (c) Chiperoni hill, May 2013 (d) Chiperoni hill, May 2021.
Land 10 01258 g004
Figure 5. Google satellite images showing the vegetative gains in Sadzi hill and encroachment in Chiperoni hill. (a) Sadzi hill image in May 2013, (b) Sadzi hill image in June 2020, (c) Chiperoni hill image in May 2013 and (d) Chiperoni hill image in May 2021.
Land 10 01258 g005
Table 1. Details of the number of key informants interviewed and justification for selection in the study.
Key InformantNumberWhy Selected
Parks and recreation department1The department oversees all green spaces in the city including the hills
Non-governmental organization (NGO)1NGO had extensive work experience with the two hills
City council2These represented the administrative and political leaders of the city
Forest department1The department provides technical expertise on trees within the city
Conservation committee leaders2Leaders of the committees responsible for managing the hills
Community leaders2The green spaces (hills) are within their jurisdiction
Community members2To have a community perspective
Table 2. Growth parameters and biodiversity indices computed in the study.
Diversity IndexEquationWhat for
Chao1 S e s t = S o b s + a 2 2 b Estimating potential for species richness in each hill
Shannon–Wiener H = i = 1 s P i In ( P i ) Understanding current tree species abundance and richness—diversity
Shannon’s Maximum Diversity H m a x = In S Maximum species diversity
Shannon’s Equitability H E = H H m a x = i = 1 s P i In ( P i ) In S Species evenness if different from the hills
Bray–Curtis Dissimilarity B C i j = 1 2 C i j S i + S j Checking species dissimilarity between the hills
Importance Value IndexIVI = RF + RD + RDoAggregate species importance from each hill
RF = relative frequency; RD = relative density; RDo = relative dominance.
Table 3. Summary of tree species composition for the two hills.
ParameterChiperoni HillSadzi Hill
Number of plots sampled1213
Number of trees sampled112 a333 b
Mean number of trees/plot9.75 a27.83 b
Maximum number of trees/plot29 a57 b
Estimated number of trees/ha244 a695 b
Percent indigenous tree counts95%82%
Percent indigenous tree species97%90%
Mean DBH (cm)6.64 a6.59 a
Maximum DBH (cm)22.0 a19.6 a
Maximum height (m)7.19.5
Number of tree species32 a42 b
Number of genera25 a34 b
Number of families13 a16 a
a,b Values followed by similar letters are not significantly different (p > 0.05).
Table 4. Summary of growth parameters and biodiversity statistics from the two hills.
StatisticChiperoni HillSadzi Hill
Chao1 (Sest)380292
Shannon–Wiener diversity index (H′)3.033.20
Maximum diversity index (Hmax)3.503.80
Shannon’s equitability index (EH)0.890.86
Bray–Curtis dissimilarity (BCij)75.7%
Table 5. Summary of growth characteristics for the top ten important value indices of tree species from Chiperoni hill, in order of IVI.
No.FamilySpeciesRFRDRDoIVI
1ApocynaceaeDiplorhynchus condylocarpon13.739.8213.1536.70
2PhyllanthaceaeMargaritaria discoidea1.9612.5019.8034.26
Uapaca kirkiana1.960.896.569.41
3FabaceaeJulbernardia globiflora11.769.8211.0932.68
Pterocarpus angolensis9.807.146.6423.59
4LoganiaceaStrychnos innocua1.966.2517.9326.14
Strychnos spinose3.924.462.0810.47
5AraliaceaeCussonia arborea7.845.364.6317.83
6CombretaceaePteleopsis myritifolia1.966.254.3112.52
7Myrtaceae* Eucalyptus camaldulensis3.924.462.7311.11
Total58.8266.9688.94214.73
Exotic species are marked with an asterisk (*).
Table 6. Summary of growth characteristics for the top ten important value indices of tree species from Sadzi hill, in order of IVI.
No.FamilySpeciesRFRDRDoIVI
1FabaceaeDalbergia boehmii2.9414.1133.2750.33
Bauhinia petersiana4.905.714.4715.08
Pterocarpus angolensis4.905.103.9513.96
Brachystegia bussei3.925.404.0613.38
2Myrtaceae* Eucalyptus saligna7.848.7111.9928.54
3ApocynaceaeDiplorhynchus condylocarpon4.908.4113.6226.93
4Lamiaceae* Gmelina arborea2.946.018.4517.39
5AnnonaceaeAnonna senegalensis7.845.103.6916.64
6AraliaceaeCussonia arborea4.903.303.0011.20
7ChrysobalanaceaeParinari curatellifolia3.923.602.039.56
Total49.0265.4688.53203.02
Exotic species are marked with an asterisk (*).
Table 7. Summary of family importance value index values in both hills.
No.FamilyRFRDRDoFIVI
1Fabaceae20.0045.0531.8896.33
2Phyllanthaceae7.627.2122.4837.31
3Apocynaceae12.3810.149.3231.84
4Myrtaceae9.527.665.7322.91
5Araliaceae8.573.834.7617.16
6Lamiaceae3.816.316.7916.91
7Annonaceae8.574.282.7015.55
8Combretaceae6.674.052.4913.21
9Anacardiaceae5.712.7025310.94
10Loganiaceae2.862.705.1110.67
Total85.7193.9293.78272.86
RF—relative frequency; RD—relative density; RDo—relative dominance; FIVI—family importance value index.
Table 8. Current ecosystem services from the hills under study.
HillSadziChiperoni
ProvisioningWild fruits
Medicinal plants
Increased presence of trees that can be used for construction
Wild fruits
Medicinal plants
Fuel wood
Building materials
Crop cultivation for food
RegulatingSoil erosion prevention
Wind break
Temperature regulation
Regulation of water flow and runoff
Water purification
Carbon storage
Pollination
Carbon storage
Pollination
CulturalEsthetic beauty
Spiritual connection
Physical exercise
Tourism possibilities
Physical exercise
SupportingHome to more flora and fauna
Maintenance of functional diversity
Home to flora and fauna
Table 9. Ecosystem disservices before and after restoration efforts.
Before RestorationEcosystem Disservices
Sadzi HillSoil erosion from water and wind, mud and rock slides
Chiperoni HillSoil erosion, reduced biodiversity due to fires
After Seven Years
Sadzi HillNone reported currently
Chiperoni HillIncreased soil erosion, increased biodiversity loss due to unsustainable harvesting of biomass and fires
Publisher’s Note: MDPI stays neutral with regard to jurisdictional claims in published maps and institutional affiliations.

