
Optimization of Land Use Based on the Source and Sink Landscape of Ecosystem Services: A Case Study of Fengdu County in the Three Gorges Reservoir Area, China

 ,
, 
Abstract
:1. Introduction
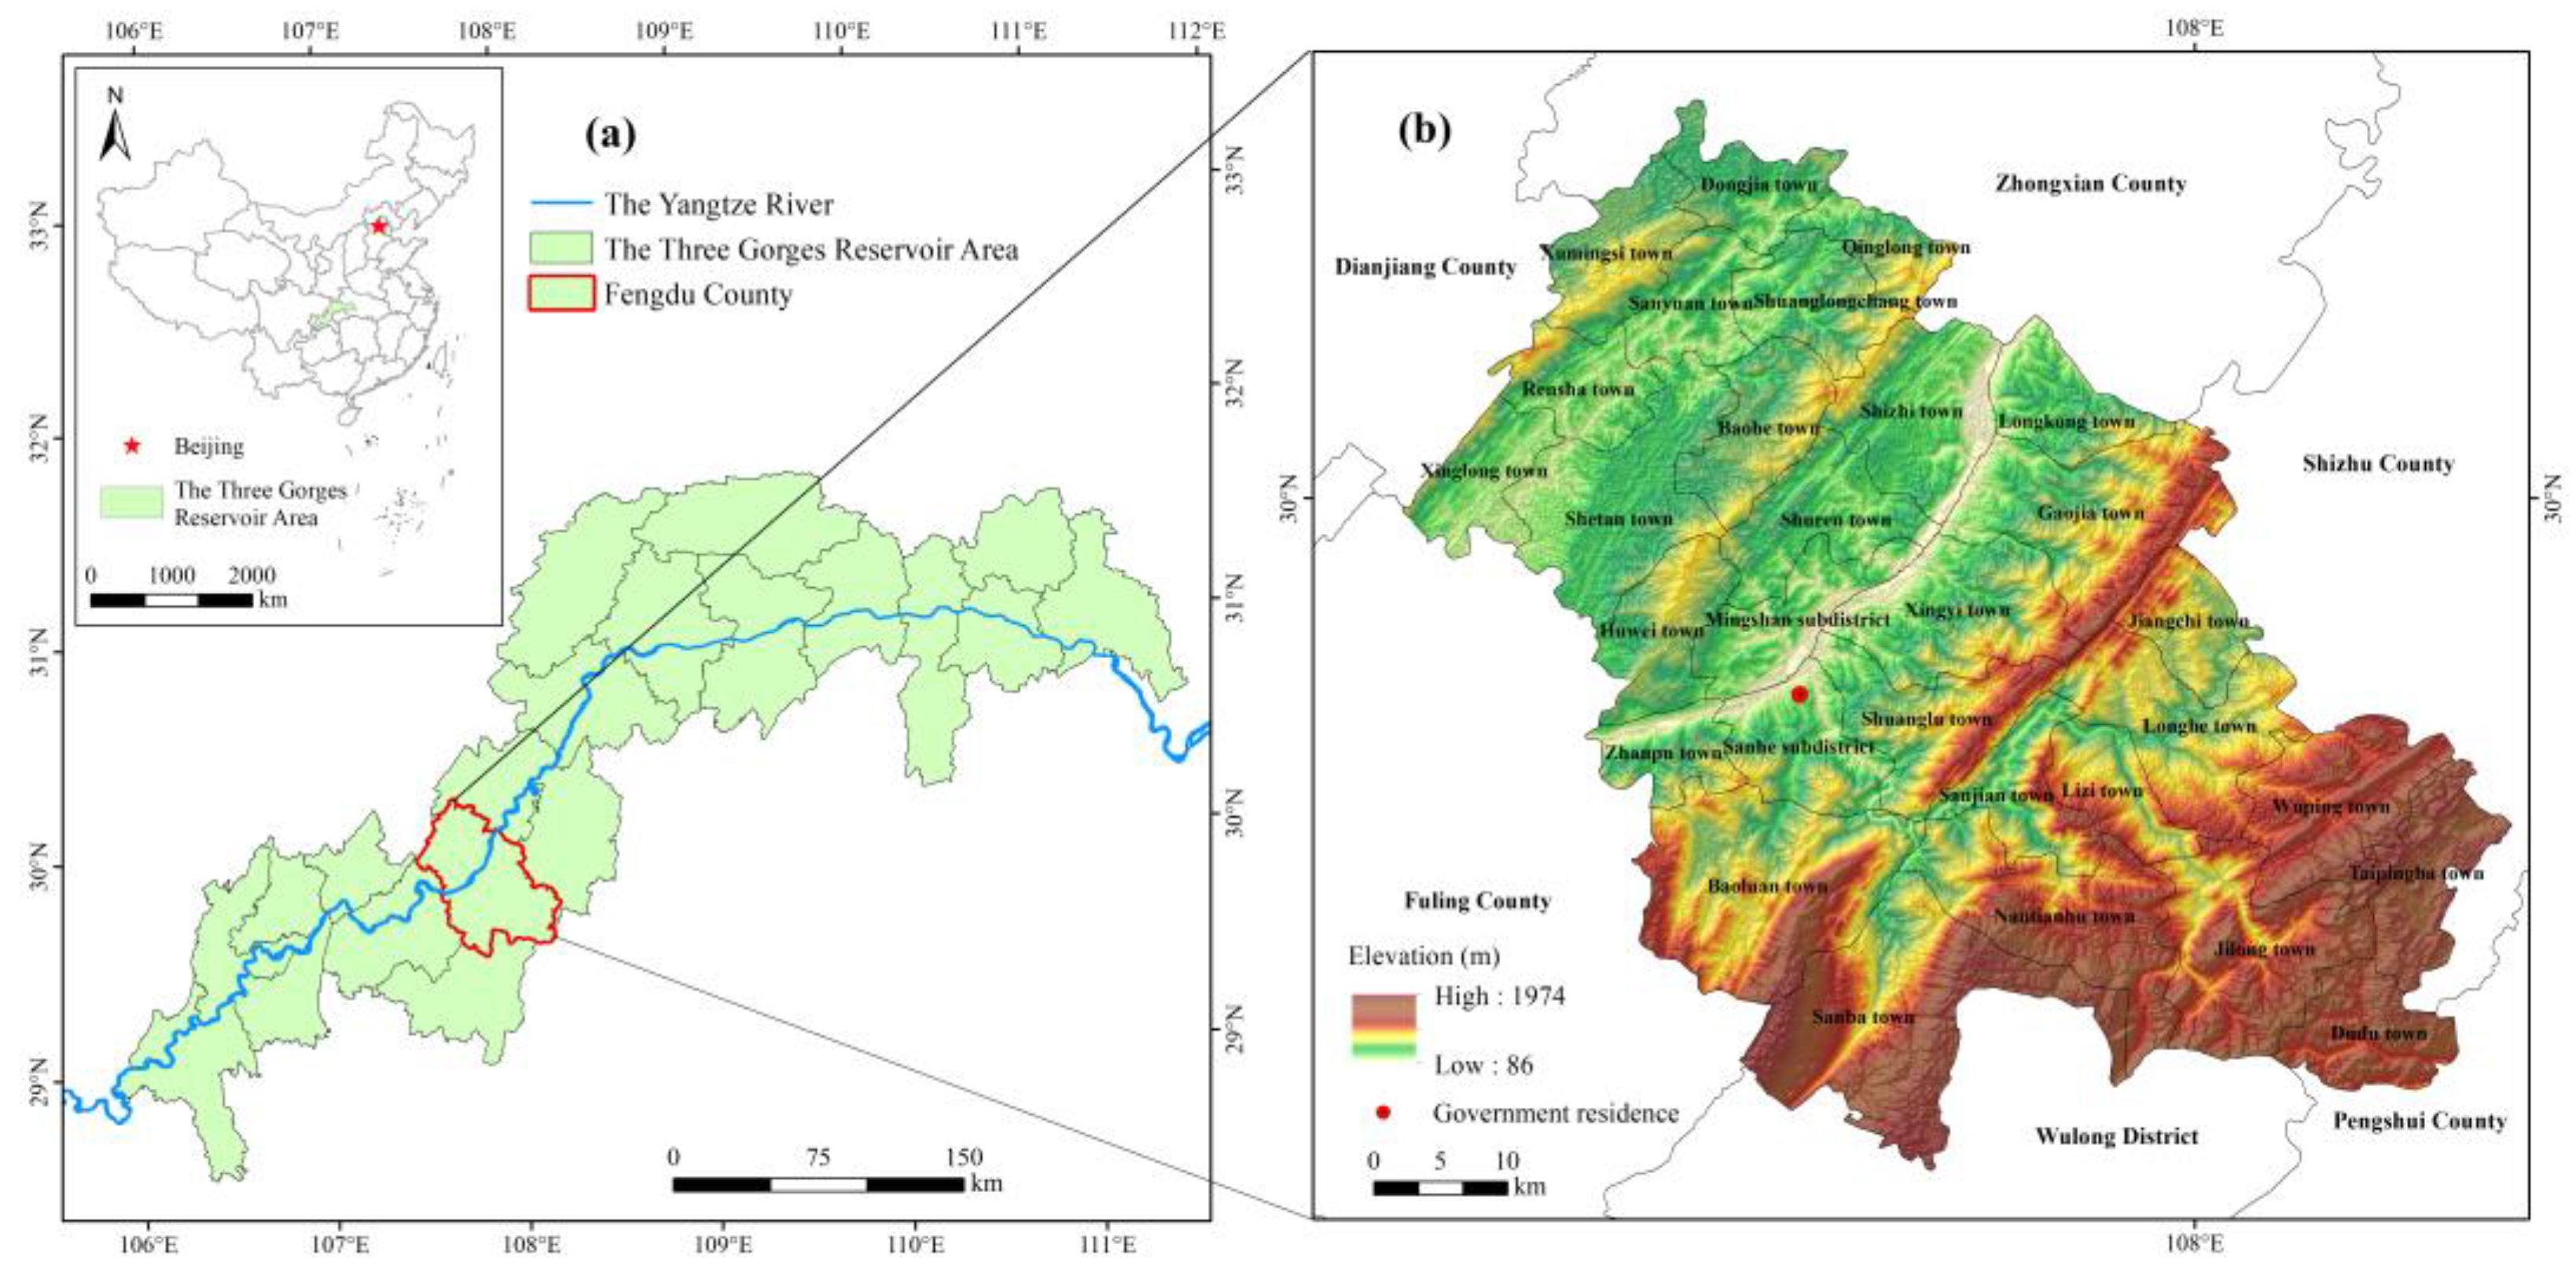
2. Study Area and Data Sources
3. Methodology
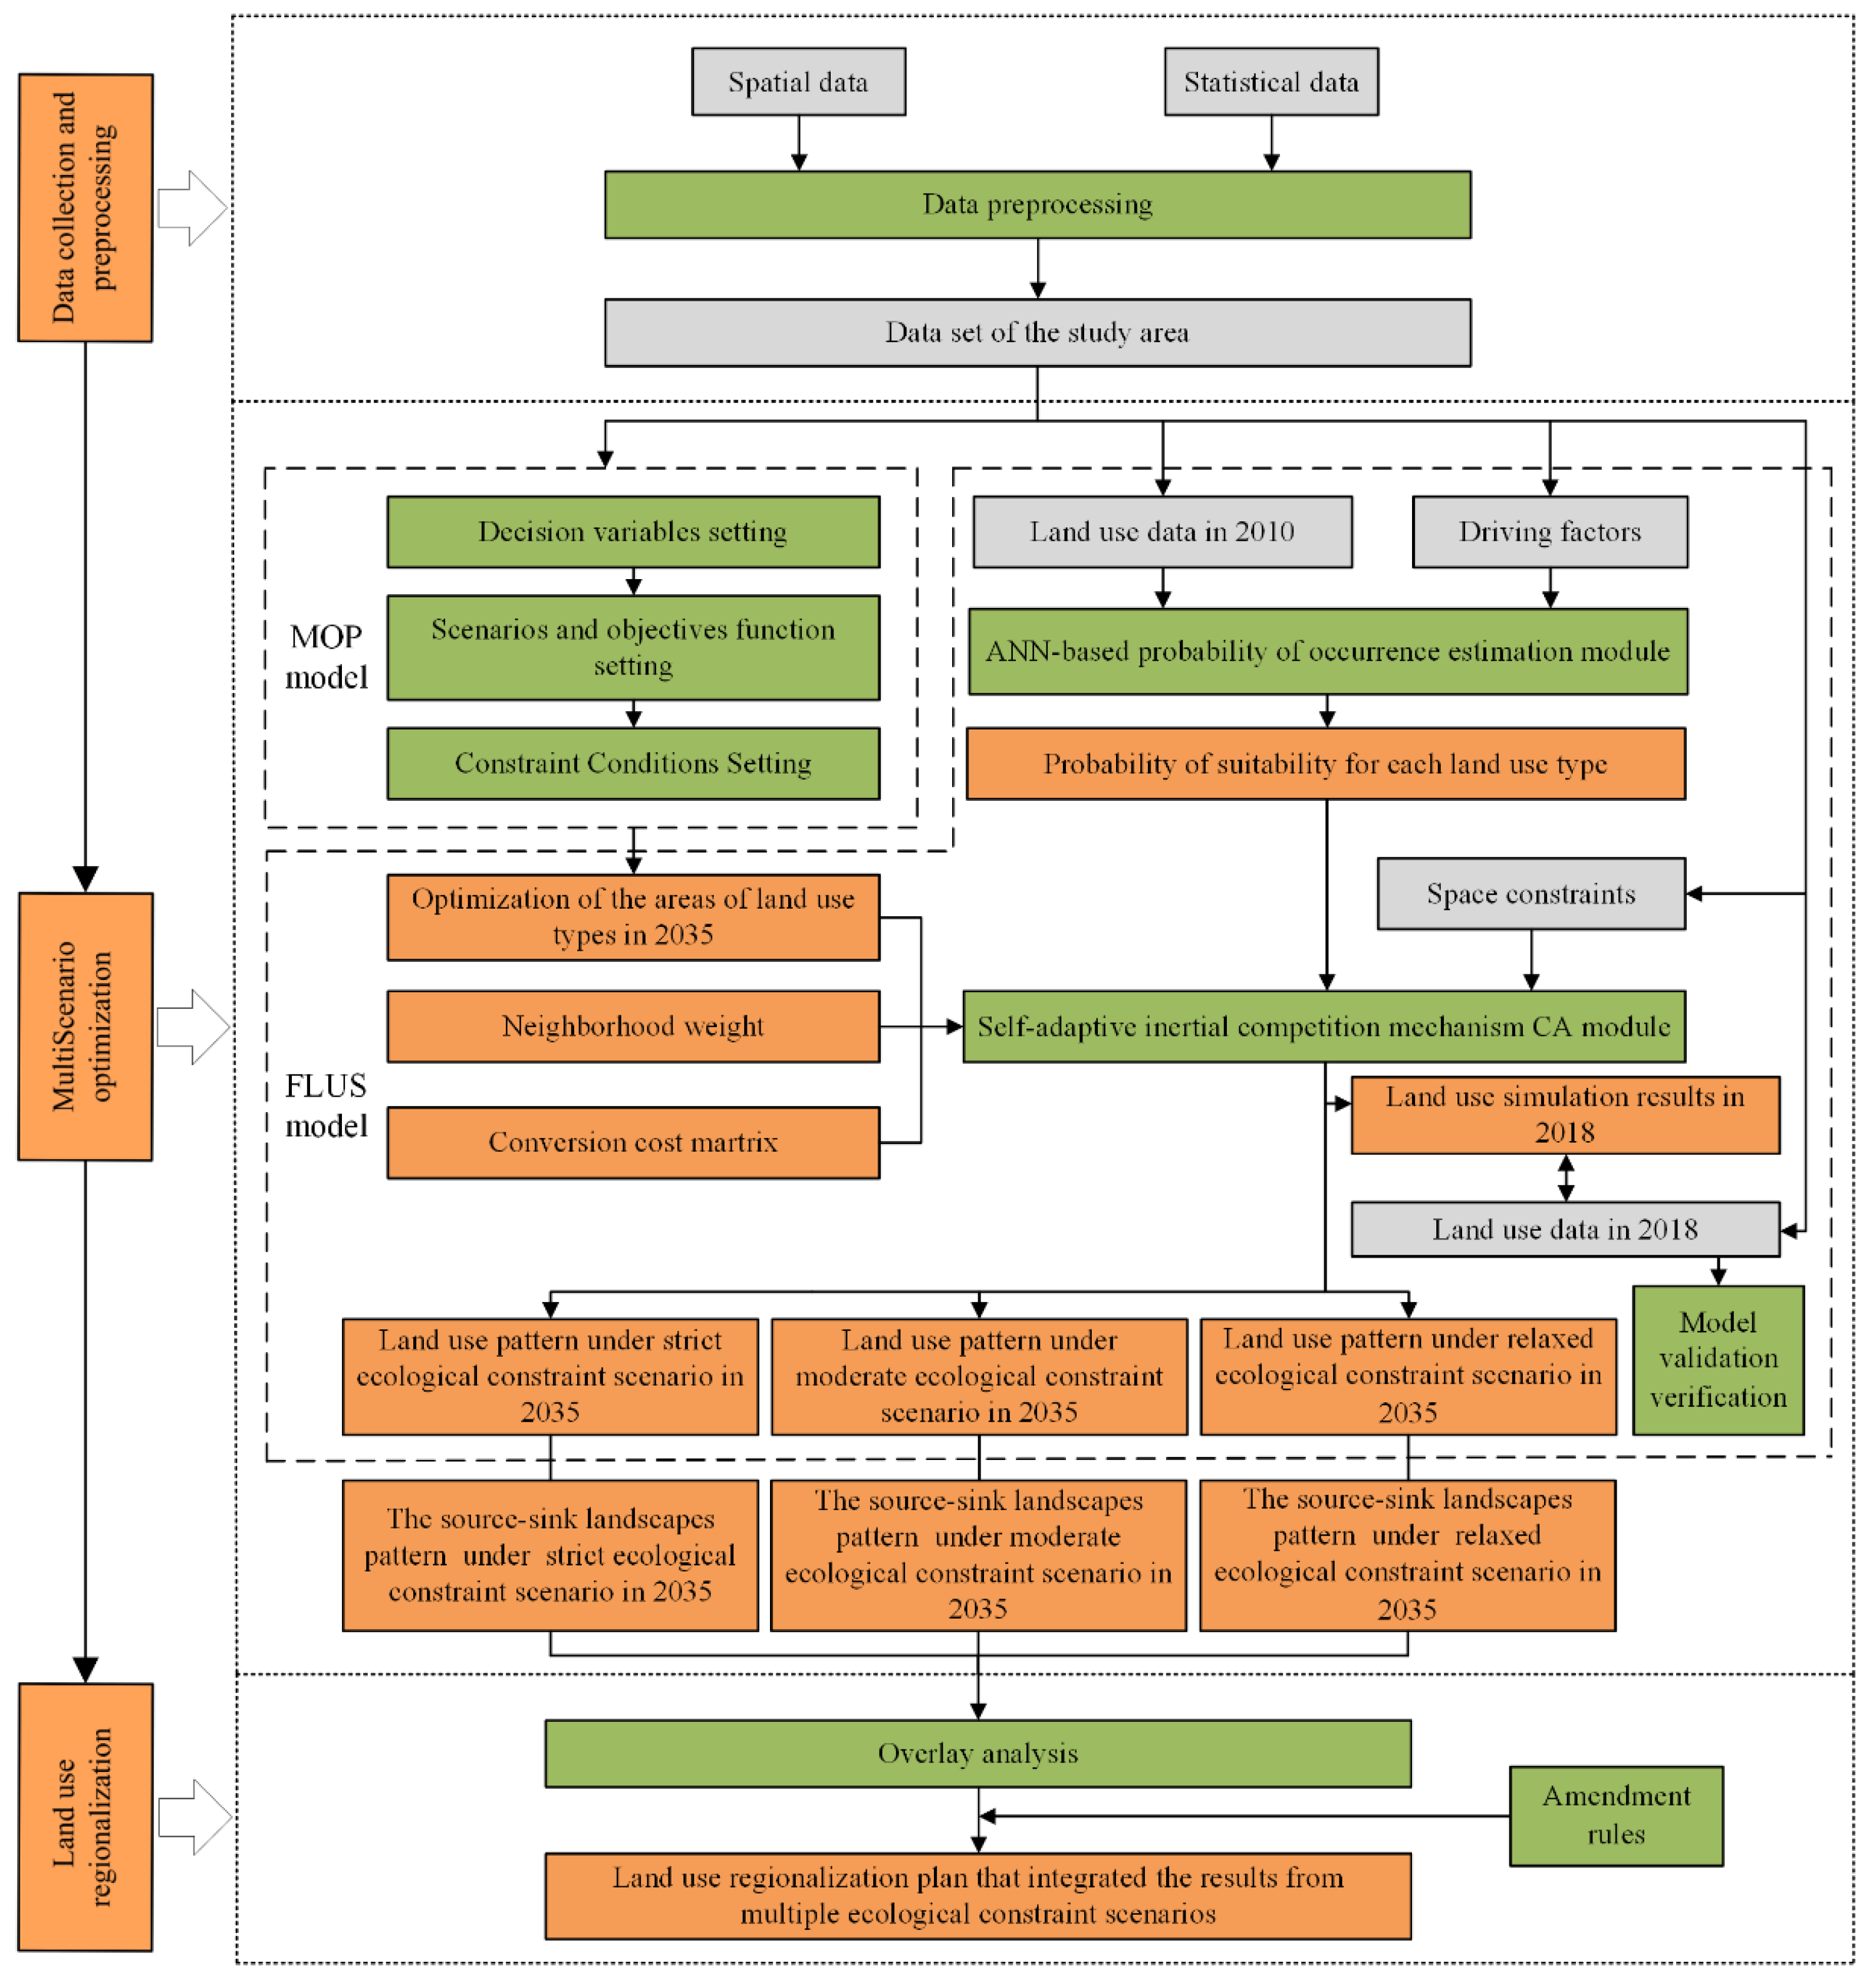
3.1. Land Use Optimization Framework Based on the Source-Sink Landscape of ESs
3.2. Optimization of the Areas of Land Use Types Based on the MOP Model
3.2.1. Scenarios and Objective Function Setting
3.2.2. Constraint Conditions Setting
3.3. Optimization of the Land Use Spatial Configuration Based on the FLUS Model
3.3.1. ANN-Based Probability of Occurrence Estimation Module
3.3.2. Self-Adaptive Inertial Competition Mechanism CA Module
3.3.3. Model Validation
4. Results
4.1. Multiscenario Optimization of Land Use in Fengdu County
4.1.1. Results of the Land Use Type Area Optimization
- (1)
- Under the SEC scenario, the area of ISLs increased, reaching the maximum of the three scenarios (1676.62 km2), and the area of CSLs was greatly reduced, reaching the minimum of the three scenarios (1190.43 km2). There was no significant change in the area of SLs since 2018 (33.81 km2). The areas of forest and water increased to 1438.64 km2 and 57.89 km2, respectively, and the areas of paddy fields, dry land, and grassland decreased to 327.12 km2, 863.31 km2, and 180.09 km2, respectively. Although there was an increase in urban land area, it increased only to the lower limit of the constraint (28.89 km2), whereas the rural residential area was significantly reduced to 4.92 km2.
- (2)
- Under the MEC scenario, the areas of the ISLs and SLs increased to 1609.52 km2 and 49.74 km2, respectively, whereas the area of the CSLs decreased to 1241.60 km2. Compared with those in the SEC scenario, there were significantly smaller increases in the ISLs and reductions in the CSLs, and significantly higher increases in the SLs. Under this scenario, the areas covered by forest, water, and urban land increased to 1371.54 km2, 57.89 km2, and 41.54 km2, respectively, and the areas covered by paddy fields, dry land, grassland, and rural residential sites decreased to 335.84 km2, 905.76 km2, 180.09 km2, and 8.20 km2, respectively.
- (3)
- Under the REC scenario, the areas of the ISLs, CSLs, and SLs were 1603.96 km2, 1243.32 km2, and 53.58 km2, respectively. With the relaxation of the ecological constraints, the increases in the ISLs and the reductions in the CSLs were further reduced, whereas the increases in the SLs were further increased. The areas of forest and urban land increased to 1369.96 km2 and 45.38 km2, and the areas of paddy fields and dry land decreased to 350.24 km2 and 893.08 m2, respectively. The areas of rural residential sites, grassland, and water remained unchanged.
4.1.2. Optimization of the Spatial Configuration of Land Use
- (1)
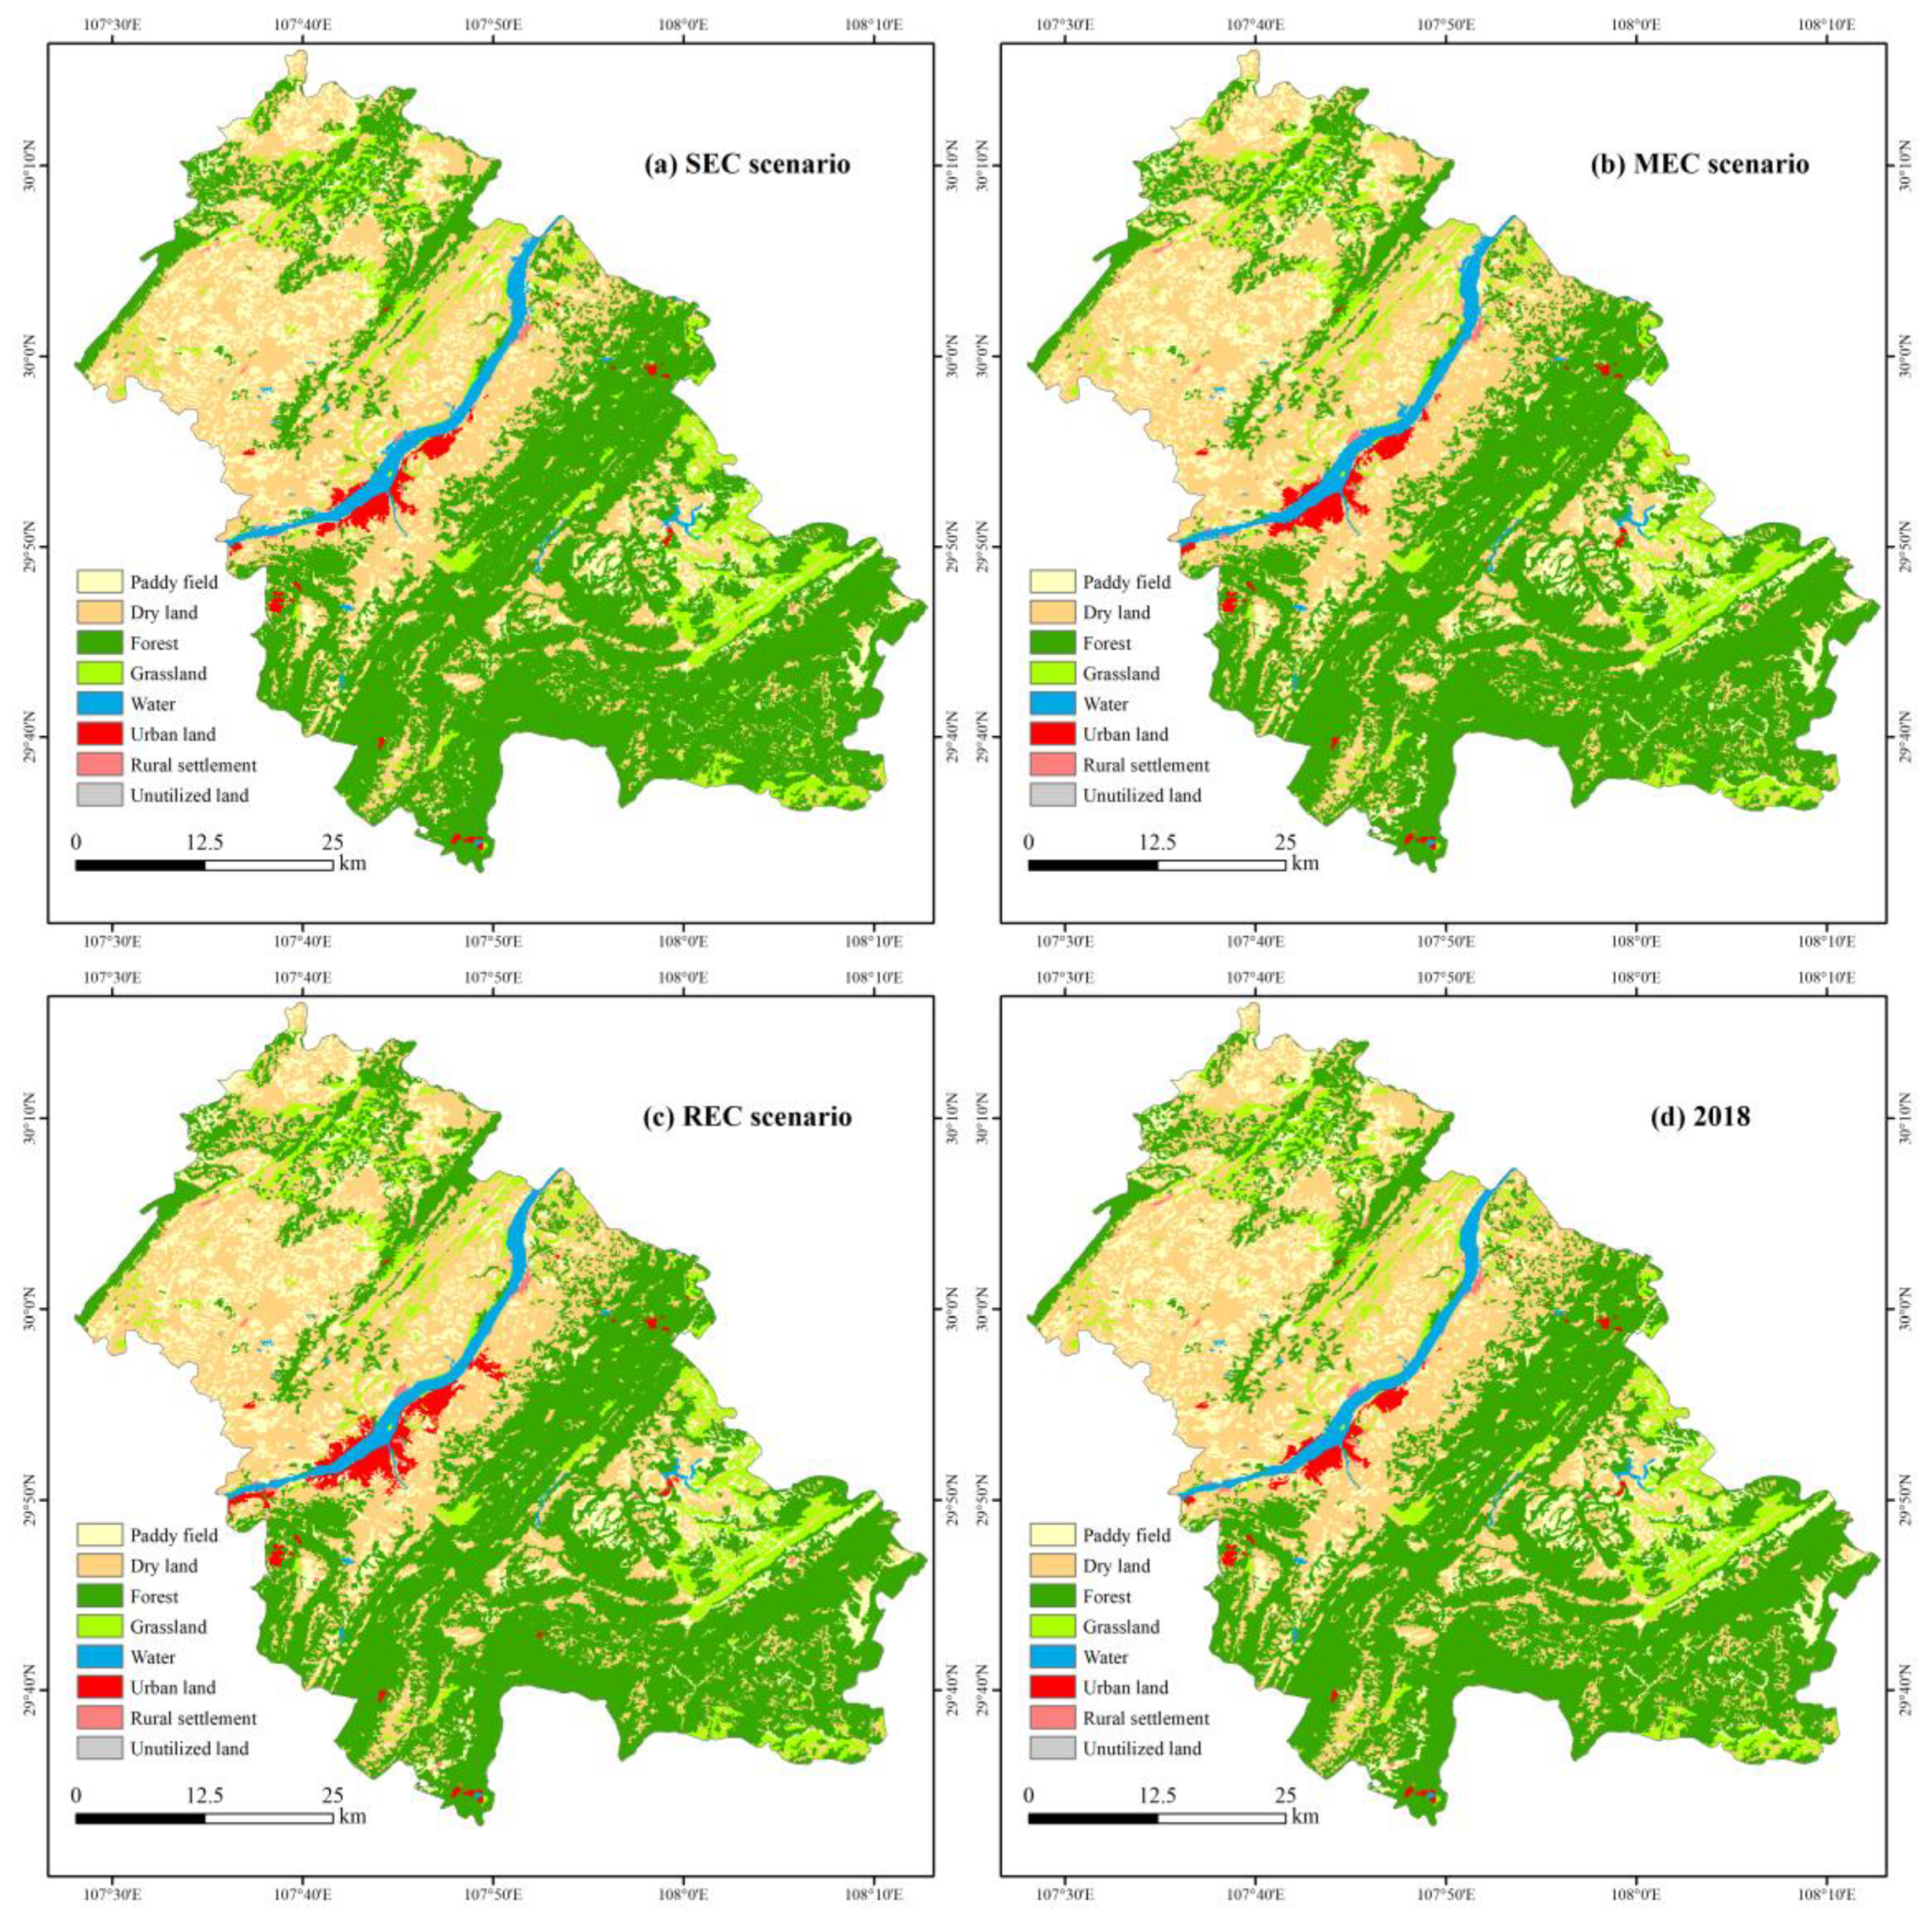
- The development goals of the SEC scenario are to ensure regional ecological security, reduce regional ecological problems through a series of ecological restoration projects, and comprehensively improve ES functions. As shown in Figure 5a, under this scenario, the spatial scope of the ISL expanded rapidly, and the area of the source landscapes was generally greater than that of the Sins—this balance provided support for improving the overall ES function of the study area. The advancement of the Grain for Green Program has transformed many dry land areas and paddy fields with large farming radii and steep slopes into forestland. The area covered by water also expanded significantly. The newly added water was mainly concentrated along the Yangtze River. The low-lying terrain of this area is conducive to the formation of water features. With the effective implementation of prevention and control measures for rocky desertification, all the unused land in the study area has been transformed into other land use types. Urban land mainly expanded to the west, but the expansion was not obvious. Most of the newly added urban land was transformed from dry land, and the new urban land area was mainly concentrated in the Mingshan subdistrict and Sanhe subdistrict. Moreover, some rural settlements located in remote mountainous areas, with underdeveloped transportation systems and extreme rates of population decrease, were transformed into forests, dry land, or paddy fields after the abandonment of the settlements. The mean patch fractal dimension (MPFD), landscape division index (DIVISION), Shannon’s diversity index (SHDI), and aggregation index (AI) were calculated in Fragstats software version 4.2. The results showed that the MPFD was 1.09, DIVISION was 0.94, SHDI was 1.58, and AI was 93.37. The configuration of the central town was relatively regular, the degree of fragmentation was low, and the spatial aggregation of different landscape types was relatively high.
- (2)
- The development goal of the MEC scenario is to consider both economic growth and ecological protection. As shown in Figure 5b, under this scenario, the development of the source and sink landscapes was consistent, and the increases in the ISLs and the reductions in the CSLs were less than those in the SEC scenario, but the spatial change trend was similar to that in the SEC scenario. Among the land use types in the sink landscapes, whereas urban land continued to expand westward, there was also a trend of eastward expansion. The newly added urban land was mainly concentrated in the Mingshan subdistrict and Sanhe subdistrict, Shuanglu town, and Xingyi town. Moreover, a small number of rural settlements were transformed into forests, dry land, and paddy fields. Under this scenario, the MPFD of the study area was 1.16, the DIVISION was 0.96, the SHDI was 1.32, and the AI was 93.67. The configuration of the central town was relatively regular, the degree of fragmentation was moderate, and the spatial aggregation of different landscape types was moderate.
- (3)
- The development goal of the REC scenario is to maximize economic benefits. As shown in Figure 5c, under this scenario, the spatial scope of the sink landscapes was significantly expanded, the area occupied by sink landscapes exceeded that occupied by source landscapes, and the ES supply in the study area faced very large decreasing pressure. Of the three scenarios, the increase in urban land use was highest in this scenario. In addition to Mingshan subdistrict, Sanhe subdistrict, Shuanglu town, and Xingyi town, urban land also increased significantly within Zhanpu town. The urban land area expanded from east to west along the Yangtze River. The main reason for this trend is that regions to the south and north are densely covered by basic farmland protection areas of existing towns, restricting the expansion of urban land. In addition, the western part of the county has flat terrain, dense road networks, excellent geographic locations, and functional water and land transportation facilities; therefore, it is suitable for urban development. The increases in the ISLs and the decreases in the CSLs in this scenario were further reduced compared with those in the SEC scenario, and the spatial change trend was similar to that in the SEC scenario. In the REC scenario, the MPFD of the study area was 1.38, the DIVISION was 0.98, the SHDI was 1.23, and the AI was 92.08. The configuration of the central town was relatively scattered, the degree of fragmentation was high, and the degree of spatial aggregation of different landscape types was low.
4.2. Land Use Regionalization and Control Strategy in Fengdu County
- (1)
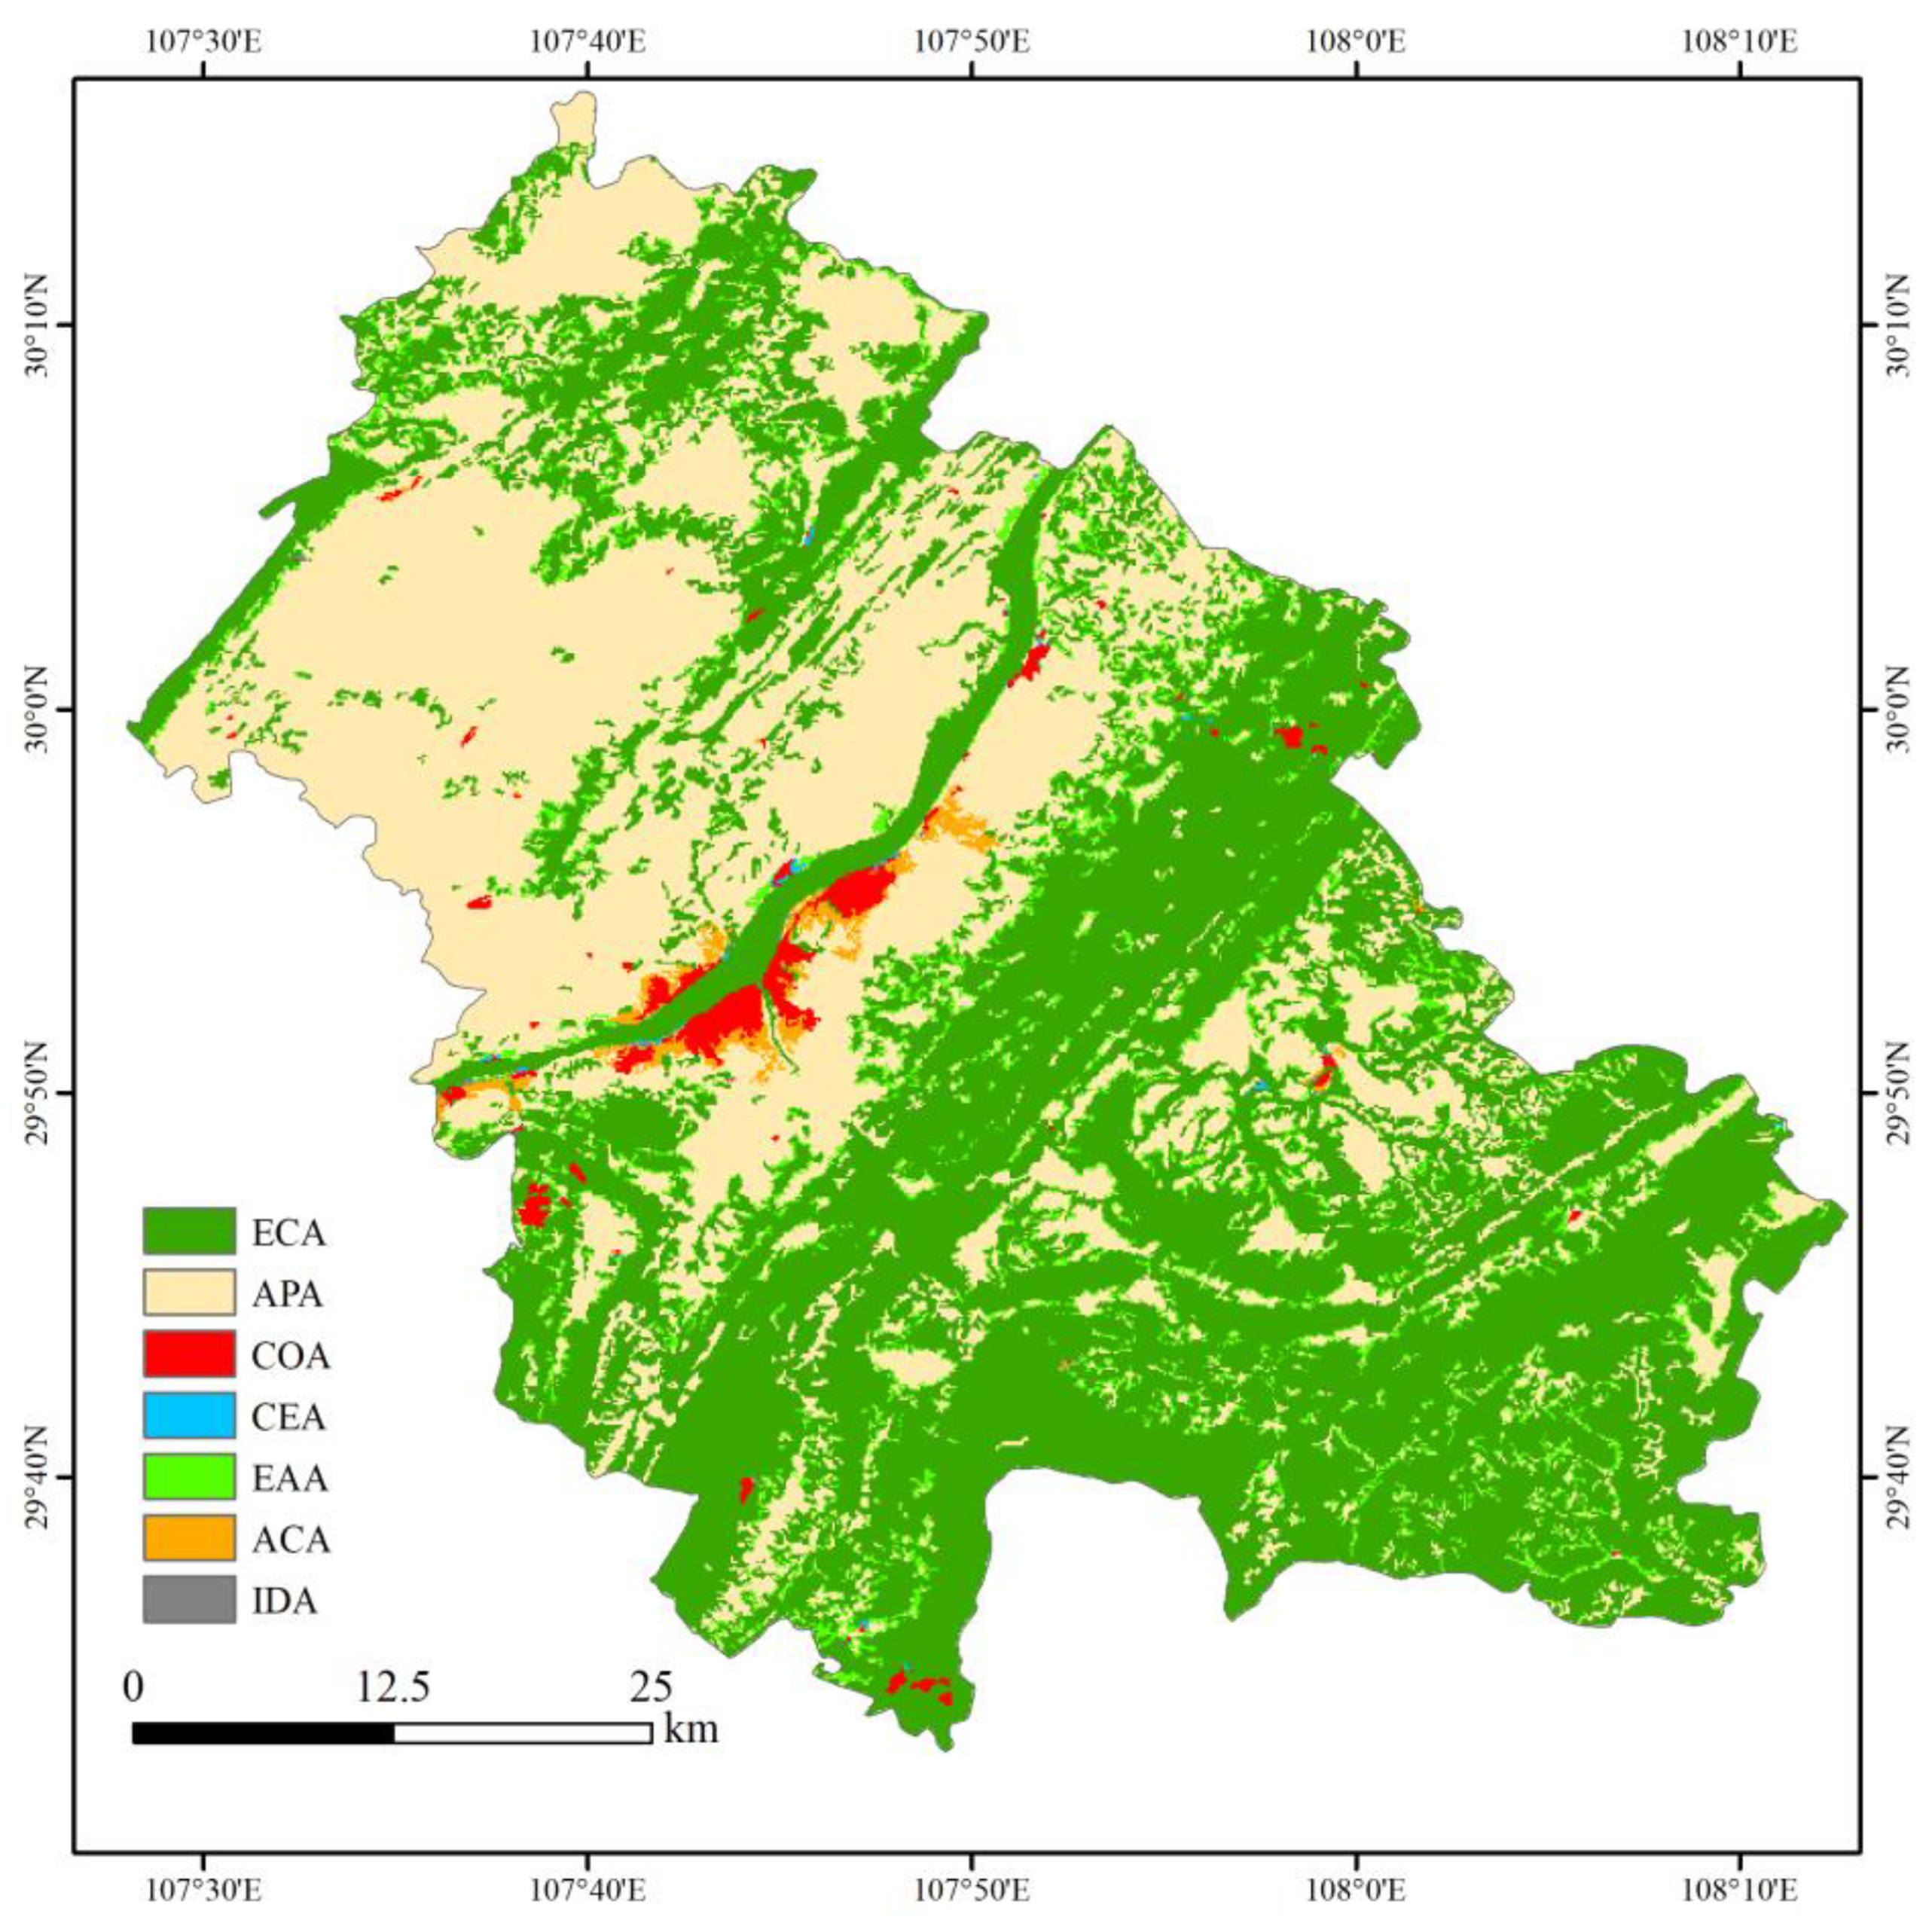
- Priority was given to ensuring ecological areas in Fengdu County and the grid cells that contained only ISL under all three ecological constraint scenarios were allocated to the ecological conservation area (ECA). Second, the grid cells that contained only CSLs and the grid cells that contained only SLs under the three scenarios were allocated to the agricultural production area (APA) and construction optimization area (COA). (2) The grid cells with different landscape types under the three scenarios were allocated to flexible control areas with multiple spatial functions, including the construction-ecological area (CEA), ecological-agricultural area (EAA), agricultural-construction area (ACA), and integrated development area (IDA). (3) Within the study area, the grid cells in the COA, CEA, and IDA that exceeded the boundaries of the permitted construction area were allocated to the ECA, and the grid cells that exceeded the boundaries of the permitted construction area in the ACA were allocated to the APA. (4) To ensure agricultural and ecological stability relative to the spatial configuration of the seven types of areas, a small number of COAs with heavy fragmentation were allocated to the ECAs or APAs based on their suitability.
- (2)
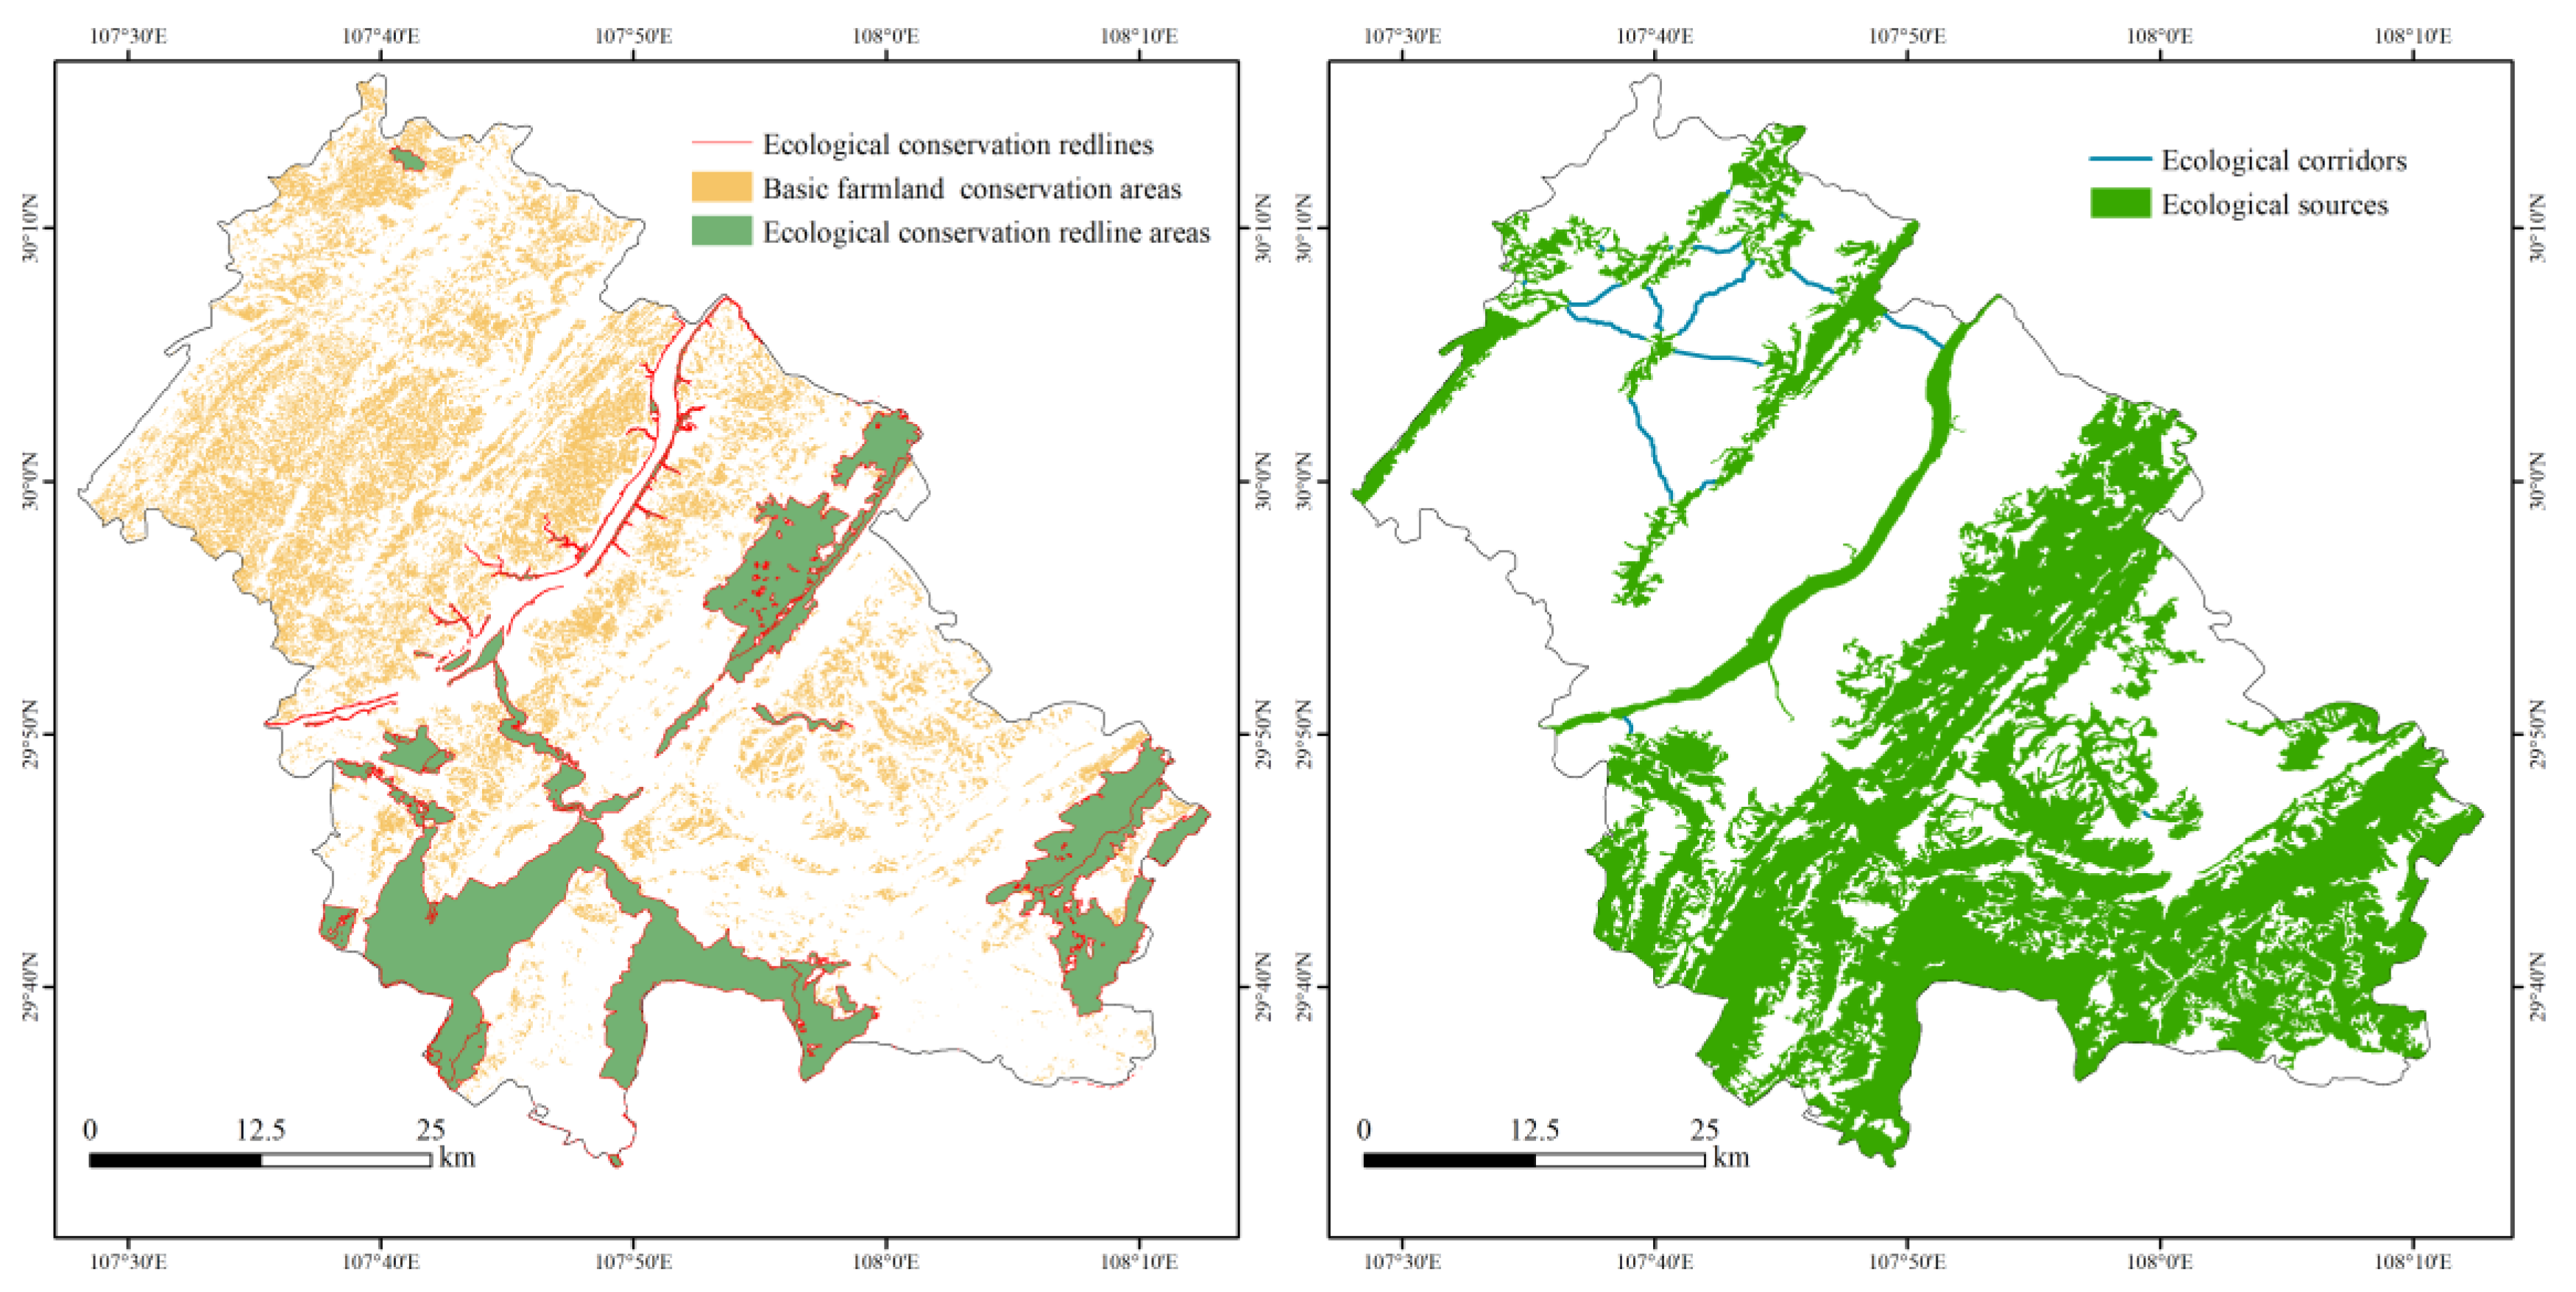
- The ECA was the most widely distributed type of area in Fengdu County, and the highest concentrations of the ECA were located in the area south of the Yangtze River. The ECA covered 1556.83 km2, accounting for approximately 53.67% of the total area of the study area. Urban and rural construction, and cultivated land reclamation activities, must be strictly prohibited in this area, and activities that destroy landscapes, vegetation, topography, and landforms, such as mining and borrowing are prohibited. Second, ecological restoration should be carried out in key areas that have been destroyed by human activities to optimize the vegetation coverage and the water environment. Moreover, it is possible to sustainably develop and utilize the ecological resources in this region, develop ecotourism, popularize science education and other projects, and enhance the cultural service values of the ecosystem. At the same time, it could be commented that better ecological corridors for the forest should be restored in the north of and along the Yangtze river.
- (3)
- The APA was widely distributed throughout the study area, and the highest concentration was in the area north of the Yangtze River. The area of the APA was 1123.23 km2, accounting for approximately 38.72% of the total area of the study area. First, it should be confirmed that the basic farmland in the study area is occupied and not abandoned. Second, the transformation of land should be encouraged to promote management of cultivated land at the appropriate scale. Moreover, to comprehensively improve the production environment and enhance agricultural modernization, high-quality farmland construction projects and rural land consolidation projects should be actively carried out, and appropriately planned ditches, mechanical tillage roads, breeding and seedling sites, greenhouses, hardening and drying yards, and other agricultural facilities should be allowed to occupy cultivated land. In addition, the demand for land associated with the development of agricultural science and technology research, ecological agricultural tourism, and other projects in the region should be supported.
- (4)
- The COA is mainly distributed along the Yangtze River, with an area of 31.51 km2, accounting for approximately 1.09% of the total area of the study area. First, development and construction activities should be limited to suitable locations in this area. Moreover, it is necessary to strengthen the spatial matching between the permanent population and construction land, encourage the turnover of idle homesteads, and carry out cross-regional transactions and allocation of land use indicators to achieve a balance between the growth and decline in construction land between urban and rural areas. Second, the redevelopment of old urban areas and inefficient land should be actively carried out to develop emerging industries or green spaces. Furthermore, village renovation should be encouraged, and rural settlements should be guided to moderate concentration. The construction of transportation facilities, public service facilities, park squares, and other projects should also be carried out to comprehensively improve the living conditions of rural residents.
- (5)
- The CEA was mainly distributed around the COA, and the area of the CEA was only 2.60 km2. In the development and planning processes, the CEA should be prioritized for the protection and restoration of the ecological environment, and the development of eco-friendly spaces, such as country parks and ecologically friendly green spaces, should be encouraged. While adhering to the priority of ecological protection, the CEA can also be developed as construction land—however, the land in the area should not be transferred to high-polluting enterprises, such as the chemical and metal smelting industries.
- (6)
- The EAA was mainly distributed around the ECA, with an area of 163.56 km2, accounting for approximately 5.64% of the total area of the study area. In the future, this area should be given priority to be used as ecological space for the cultivation of forests. Moreover, it can be used for agricultural space to carry out production activities, such as grain and cash crop planting—however, green agriculture should be developed, and pollutants, such as pesticides and chemical fertilizers, should be completely prohibited. The EAA can also encourage the development of eco-agricultural tourism in accordance with local conditions to promote rural revitalization in Fengdu County.
- (7)
- The ACA, which was largely in the middle of the study area, was mainly distributed around the ECA. The area of the ACA was 21.96 km2, accounting for approximately 0.76% of the total area of the study area. This area can not only be used as agricultural land for the cultivation of agricultural products, but also can be developed to meet the land demand for economic development and residents’ lives. Moreover, the ACA is close to urban and rural residential areas, giving it good geographic locations. Therefore, the cultivated land in the ACA should be planted mainly with high value-added cash crops to improve the economic benefits of land use.
- (8)
- IDA was distributed mainly around the ECA, APA, and COA. This type of land had the smallest area in Fengdu County, with an area of only 1.17 km2. The IDA had the most diverse land use functions related to the process of regional development, and its use should be focused on the protection of ecological spaces and the establishment of a good foundation for the improvement of ES functions in the study area. After those objectives are achieved, then, this area can be used as construction space to increase the living area of residents, and as agricultural space to increase the amount of arable land. Therefore, a highly flexible land use control policy should be implemented in the IDA, allowing this land use type to provide space for various types of land according to the development needs of Fengdu County, and promoting the coordinated development of space in the territory.
5. Discussion
5.1. Advantages of Land Use Optimization Models
5.2. Feasibility of Land Use Regionalization
5.3. Implications for Spatial Management in the TGRA Territory
5.4. Limitations
6. Conclusions
- (1)
- By integrating the MOP model and FLUS model, a study of county-level land use optimization was carried out according to the following flow: optimization of the areas of various land use types, followed by spatial configuration optimization and land use regionalization. This flow can effectively enhance the reliability and applicability of land use optimization results.
- (2)
- The results of the land use optimization process showed that there were large differences in the areas and spatial distributions of the source and sink landscapes under the three ecological constraint scenarios. Under the SEC scenario, the areas of the ISLs, CSLs, and SLs were 1676.62 km2, 1190.43 km2, and 33.81 km2, respectively. A large area of CSLs and a small area of sink landscapes were transformed into ISLs, the degree of landscape fragmentation was low, and the area covered by source landscapes was generally greater than that covered by sink landscapes. Under the MEC scenario, the areas of the ISLs, CSLs, and SLs were 1609.22 km2, 1241.60 km2, and 49.74 km2, respectively. The development of the source and sink landscapes was consistent, the degree of fragmentation was moderate, and the land use changes ranged from centralized development to balanced development. Under the MEC scenario, the areas of the ISLs, CSLs, and SLs were 1603.96 km2, 1243.32 km2, and 53.58 km2, respectively. A large amount of CSLs were transformed into sink landscapes, the degree of fragmentation was high, and the area occupied by Sins was generally higher than that occupied by source landscapes.
- (3)
- The results of land use optimization under different scenarios were superimposed, and the results indicated that Fengdu County is divided into seven types of areas: ecological conservation area; agricultural production area; construction optimization area; construction-ecological area; ecological-agricultural area; agricultural-construction area; and integrated development area. Different areas have different spatial functions, and differentiated land management policies should be adopted.
- (4)
- In the future, the spatial governance of all the counties in the TGRA territory should be strengthened, more coordinated land space development and protection patterns should be developed, and ecological protection and restoration projects should be carried out in mountains, rivers, forests, fields, lakes, and grasslands to comprehensively improve regional ES functions.
Author Contributions
Funding
Institutional Review Board Statement
Informed Consent Statement
Data Availability Statement
Conflicts of Interest
Abbreviations
| ES | Ecosystem service |
| ESV | Ecosystem service value |
| SEC | Strict ecological constraint |
| MEC | Moderate ecological constraint |
| REC | Relaxed ecological constraint |
| TGRA | Three Gorges Reservoir Area |
| SL | Sink landscape |
| ISL | Important source landscape |
| CSL | Agricultural space |
| ECA | Ecological conservation area |
| APA | Agricultural production area |
| COA | Construction optimization area |
| CEA | Construction-ecological area |
| EAA | Ecological-agricultural area |
| ACA | Agricultural-construction area |
| IDA | Integrated development area |
Appendix A

| Scenarios | Paddy Field | Dry Land | Forest | Grassland | Water | Urban Land | Rural Settlement | Unused Land |
|---|---|---|---|---|---|---|---|---|
| Model validation | 0.5 | 0.1 | 0.3 | 0.3 | 05 | 1.0 | 0.8 | 0.3 |
| SE | 0.5 | 0.1 | 0.8 | 0.4 | 0.8 | 0.8 | 0.5 | 0.3 |
| ME | 0.5 | 0.1 | 0.5 | 0.3 | 0.5 | 1.0 | 0.5 | 0.3 |
| RE | 0.5 | 0.1 | 0.2 | 0.3 | 0.2 | 1.0 | 0.5 | 0.3 |
| Land Use Type | Paddy Field | Dry Land | Forest | Grassland | Water | Urban Land | Rural Settlement | Unused Land |
|---|---|---|---|---|---|---|---|---|
| Paddy field | 1 | 1 | 1 | 1 | 1 | 1 | 1 | 1 |
| Dry land | 1 | 1 | 1 | 1 | 1 | 1 | 1 | 0 |
| Forest | 1 | 1 | 1 | 0 | 1 | 1 | 1 | 0 |
| Grassland | 1 | 1 | 1 | 1 | 1 | 1 | 1 | 0 |
| Water | 1 | 1 | 1 | 1 | 1 | 1 | 1 | 0 |
| Urban land | 0 | 1 | 0 | 0 | 1 | 1 | 0 | 0 |
| Rural settlement | 0 | 1 | 0 | 0 | 0 | 1 | 1 | 0 |
| Unused land | 0 | 1 | 1 | 0 | 1 | 0 | 0 | 1 |
| Land Use Type | Paddy Field | Dry Land | Forest | Grassland | Water | Urban Land | Rural Settlement | Unused Land |
|---|---|---|---|---|---|---|---|---|
| Paddy field | 1 | 0 | 1 | 1 | 1 | 0 | 0 | 0 |
| Dry land | 1 | 1 | 1 | 1 | 1 | 1 | 1 | 0 |
| Forest | 0 | 0 | 1 | 0 | 1 | 0 | 0 | 0 |
| Grassland | 0 | 0 | 1 | 1 | 1 | 1 | 1 | 0 |
| Water | 0 | 0 | 0 | 0 | 1 | 0 | 0 | 0 |
| Urban land | 0 | 0 | 0 | 0 | 0 | 1 | 0 | 0 |
| Rural settlement | 1 | 1 | 1 | 0 | 1 | 1 | 1 | 0 |
| Unused land | 1 | 0 | 0 | 0 | 0 | 0 | 0 | 1 |
| Land Use Type | Paddy Field | Dry Land | Forest | Grassland | Water | Urban Land | Rural Settlement | Unused Land |
|---|---|---|---|---|---|---|---|---|
| Paddy field | 1 | 0 | 1 | 0 | 0 | 1 | 1 | 1 |
| Dry land | 1 | 1 | 1 | 1 | 1 | 1 | 1 | 0 |
| Forest | 0 | 1 | 1 | 0 | 0 | 1 | 0 | 0 |
| Grassland | 1 | 1 | 1 | 1 | 1 | 1 | 1 | 0 |
| Water | 0 | 0 | 0 | 0 | 1 | 0 | 0 | 0 |
| Urban land | 0 | 0 | 0 | 0 | 0 | 1 | 0 | 0 |
| Rural settlement | 1 | 1 | 1 | 1 | 1 | 1 | 1 | 0 |
| Unused land | 1 | 1 | 1 | 1 | 1 | 1 | 1 | 1 |
| Land Use Type | Paddy Field | Dry Land | Forest | Grassland | Water | Urban Land | Rural Settlement | Unused Land |
|---|---|---|---|---|---|---|---|---|
| Paddy field | 1 | 1 | 1 | 1 | 1 | 1 | 1 | 0 |
| Dry land | 1 | 1 | 1 | 1 | 1 | 1 | 1 | 0 |
| Forest | 1 | 1 | 1 | 1 | 1 | 1 | 1 | 0 |
| Grassland | 1 | 1 | 1 | 1 | 1 | 1 | 1 | 0 |
| Water | 0 | 0 | 0 | 0 | 1 | 0 | 0 | 0 |
| Urban land | 0 | 0 | 0 | 0 | 0 | 1 | 0 | 0 |
| Rural settlement | 1 | 1 | 0 | 0 | 0 | 1 | 1 | 0 |
| Unused land | 0 | 0 | 0 | 0 | 0 | 0 | 0 | 1 |
References
- Costanza, R.; dArge, R.; deGroot, R.; Farber, S.; Grasso, M.; Hannon, B.; Limburg, K.; Naeem, S.; Oneill, R.V.; Paruelo, J.; et al. The value of the world’s ecosystem services and natural capital. Nature 1997, 387, 253–260. [Google Scholar] [CrossRef]
- Tolessa, T.; Senbeta, F.; Kidane, M. The impact of land use/land cover change on ecosystem services in the central highlands of Ethiopia. Ecosyst. Serv. 2017, 23, 47–54. [Google Scholar] [CrossRef]
- Baral, H.; Keenan, R.J.; Sharma, S.K.; Stork, N.E.; Kasel, S. Economic evaluation of ecosystem goods and services under different landscape management scenarios. Land Use Pol. 2014, 39, 54–64. [Google Scholar] [CrossRef]
- Mea, M.E.A.J.E. Ecosystems and Human Well-Being: Desertification Synthesis; World Resources Institute: Washington, DC, USA, 2005; Volume 5, pp. 1–100. [Google Scholar]
- Yan, J.M.; Chen, H.; Xia, F.Z. Cognition, Direction and Path of Future Spatial Planning based on the Background of Multiple Planning Integration. China Land Sci. 2017, 21, 21–27. [Google Scholar] [CrossRef]
- Scolozzi, R.; Morri, E.; Santolini, R. Delphi-based change assessment in ecosystem service values to support strategic spatial planning in Italian landscapes. Ecol. Indic. 2012, 21, 134–144. [Google Scholar] [CrossRef]
- Li, R.Q.; Li, Y.F.; Hu, H. Support of ecosystem services for spatial planning theories and practices. Acta Geogr. Sin 2020, 75, 2417–2430. [Google Scholar] [CrossRef]
- Bateman, I.; Harwood, A.; Watson, R.; Abson, D.; Andrews, B.; Binner, A.; Crowe, A.; Day, B.; Dugdale, S.; Fezzi, C.; et al. Bringing Ecosystem Services into Economic Decision-Making: Land Use in the United Kingdom. Science 2013, 341, 45–50. [Google Scholar] [CrossRef]
- Goldstein, J.H.; Caldarone, G.; Duarte, T.K.; Ennaanay, D.; Hannahs, N.; Mendoza, G.; Polasky, S.; Wolny, S.; Daily, G.C. Integrating ecosystem-service tradeoffs into land-use decisions. Proc. Natl. Acad. Sci. USA 2012, 109, 7565–7570. [Google Scholar] [CrossRef] [Green Version]
- Johnson, K.A.; Polasky, S.; Nelson, E.; Pennington, D. Uncertainty in ecosystem services valuation and implications for assessing land use tradeoffs: An agricultural case study in the Minnesota River Basin. Ecol. Econ. 2012, 79, 71–79. [Google Scholar] [CrossRef]
- Guerry, A.D.; Polasky, S.; Lubchenco, J.; Chaplin-Kramer, R.; Daily, G.C.; Griffin, R.; Ruckelshaus, M.; Bateman, I.J.; Duraiappah, A.; Elmqvist, T.; et al. Natural capital and ecosystem services informing decisions: From promise to practice. Proc. Natl. Acad. Sci. USA 2015, 112, 7348–7355. [Google Scholar] [CrossRef] [Green Version]
- Kindu, M.; Schneider, T.; Teketay, D.; Knoke, T. Changes of ecosystem service values in response to land use/land cover dynamics in Munessa–Shashemene landscape of the Ethiopian highlands. Sci. Total Environ. 2016, 547, 137–147. [Google Scholar] [CrossRef] [PubMed]
- Barral, M.P.; Oscar, M.N. Land-use planning based on ecosystem service assessment: A case study in the Southeast Pampas of Argentina. Agric. Ecosyst. Environ. 2012, 154, 34–43. [Google Scholar] [CrossRef]
- Jin, G.; Chen, K.; Zhang, L.; Liao, T.; Najmuddin, O. Measuring ecosystem services based on government intentions for future land use in Hubei Province: Implications for sustainable landscape management. Landsc. Ecol. 2021, 36, 2025–2042. [Google Scholar] [CrossRef]
- Laurans, Y.; Rankovic, A.; Billé, R.; Pirard, R.; Mermet, L. Use of ecosystem services economic valuation for decision making: Questioning a literature blindspot. J. Environ. Manag. 2013, 119, 208–219. [Google Scholar] [CrossRef]
- Pulliam, H.R. Sources, Sinks, and Population Regulation. Am. Nat. 1988, 132, 652–661. [Google Scholar] [CrossRef]
- Liding, C.; Bojie, F.; Jianying, X.; Jie, G. Location-weighted landscape contrast index: A scale independent approach for landscape pattern evaluation based on “Source-Sink” ecological processes. Acta Ecol. Sin. 2003, 23, 2406–2413. [Google Scholar]
- Liding, C.; Bojie, F.; Wenwu, Z. Source-sink landscape theory and its ecological significance. Acta Ecol. Sin. 2006, 16, 1444–1449. [Google Scholar] [CrossRef]
- Murray, D.; Neilson, B.T.; Brahney, J. Source or sink? Quantifying beaver pond influence on non-point source pollutant transport in the Intermountain West. J. Environ. Manag. 2021, 285, 112127. [Google Scholar] [CrossRef] [PubMed]
- Wu, J.; Zhu, Q.; Qiao, N.; Wang, Z.; Sha, W.; Luo, K.; Wang, H.; Feng, Z. Ecological risk assessment of coal mine area based on “source-sink” landscape theory—A case study of Pingshuo mining area. J. Clean. Prod. 2021, 295, 126371. [Google Scholar] [CrossRef]
- Zhou, Z.X.; Li, J. The correlation analysis on the landscape pattern index and hydrological processes in the Yanhe watershed, China. J. Hydrol. 2015, 524, 417–426. [Google Scholar] [CrossRef]
- Wang, Q.; Fu, M.; Wei, L.; Han, Y.; Shi, N.; Li, J.; Quan, Z. Urban ecological security pattern based on source-sink landscape theory and MCR model: A case study of Ningguo City, Anhui Province. Acta Sci. Circumstantiae 2016, 36, 4546–4554. [Google Scholar] [CrossRef]
- Daojin, L.; Yong, F.; Zhedong, Q.; juiping, C. Research on Nature Reserves Zoning Based on Landscape Ecology Source-Sink Throry. Resour. Environ. Yangtze Basin 2014, 23, 53–59. [Google Scholar] [CrossRef]
- Xiaofu, L.; Jianmin, S.; Linbo, Z. The Application of the Least Cumulative Resistance Model in the Evaluation of Urban Land Ecological Suitability—As an Example of Xiamen City. Acta Ecol. Sin. 2010, 30, 421–428. [Google Scholar]
- Ma, S.; Wen, Z. Optimization of land use structure to balance economic benefits and ecosystem services under uncertainties: A case study in Wuhan, China. J. Clean. Prod. 2021, 311, 127537. [Google Scholar] [CrossRef]
- Wang, W.; Jiao, L.; Dong, T.; Xu, Z.; Xu, G. Simulating urban dynamics by coupling top-down and bottom-up strategies. Int. J. Geogr. Inf. Sci. 2019, 33, 2259–2283. [Google Scholar] [CrossRef]
- Wu, C.; Chen, B.; Huang, X.; Dennis Wei, Y.H. Effect of land-use change and optimization on the ecosystem service values of Jiangsu province, China. Ecol. Indic. 2020, 117, 106507. [Google Scholar] [CrossRef]
- Yanfang, L.; Dongping, M.; Jianyu, Y. Optimization of land use structure based on ecological GREEN equivalent. Geo-Spat. Inf. Sci. 2002, 5, 60–67. [Google Scholar] [CrossRef]
- Chuai, X.; Huang, X.; Lai, L.; Wang, W.; Peng, J.; Zhao, R. Land use structure optimization based on carbon storage in several regional terrestrial ecosystems across China. Environ. Sci. Policy 2013, 25, 50–61. [Google Scholar] [CrossRef]
- Sadeghi, S.H.R.; Jalili, K.; Nikkami, D. Land use optimization in watershed scale. Land Use Pol. 2009, 26, 186–193. [Google Scholar] [CrossRef]
- Zhang, P.; Liu, Y.; Pan, Y.; Yu, Z. Land use pattern optimization based on CLUE-S and SWAT models for agricultural non-point source pollution control. Math. Comput. Model. 2013, 58, 588–595. [Google Scholar] [CrossRef]
- Gao, Q.; Kang, M.; Xu, H.; Jiang, Y.; Yang, J. Optimization of land use structure and spatial pattern for the semi-arid loess hilly–gully region in China. Catena 2010, 81, 196–202. [Google Scholar] [CrossRef]
- Li, Z.; Wu, S.L.; Zhang, S.W.; Nie, C.; Li, Y.; Huang, Y.F. Optimization of Land Reuse Structure in Coal Mining Subsided Areas Considering Regional Economic Development: A Case Study in Pei County, China. Sustainability 2020, 12, 3335. [Google Scholar] [CrossRef] [Green Version]
- Zhang, W.T.; Huang, B. Land Use Optimization for a Rapidly Urbanizing City with Regard to Local Climate Change: Shenzhen as a Case Study. J. Urban Plan. Dev 2015, 141, 12. [Google Scholar] [CrossRef]
- Yang Lu, X.I.E.Y.Z.L.Q.I.U.T.J.J. Land Use Optimization Configuration based on Multi-Objective Genetic Algorithm and FLUS Model of Agro-pastoral Ecotone in Northwest China. J. Geo-Inf. Sci. 2020, 22, 568–579. [Google Scholar] [CrossRef]
- Aerts, J.C.J.H.; Heuvelink, G.B.M. Using simulated annealing for resource allocation. Int. J. Geogr. Inf. Sci. 2002, 16, 571–587. [Google Scholar] [CrossRef] [Green Version]
- Yang, X.; Zheng, X.-Q.; Lv, L.-N. A spatiotemporal model of land use change based on ant colony optimization, Markov chain and cellular automata. Ecol. Model. 2012, 233, 11–19. [Google Scholar] [CrossRef]
- Bijandi, M.; Karimi, M.; Bansouleh, B.F.; van der Knaap, W. Reallocation model in land consolidation using multi-objective particle swarm optimization dealing with landowners’ rights. Trans. GIS 2021, 25, 2168–2188. [Google Scholar] [CrossRef]
- Halmy, M. Land use/land cover change detection and prediction in the north-western coastal desert of Egypt using Markov-CA. Appl. Geogr. 2015, 63, 101–112. [Google Scholar] [CrossRef]
- Shen, G.; Chen, Q.; Tang, B.-S.; Yeung, S.; Hu, Y.; Cheung, G. A system dynamics model for the sustainable land use planning and development. Habitat Int. 2009, 33, 15–25. [Google Scholar] [CrossRef]
- Xiong, Y.; Chen, Y.; Peng, F.; Li, J.; Yan, X. Analog simulation of urban construction land supply and demand in Chang-Zhu-Tan Urban Agglomeration based on land intensive use. J. Geogr. Sci. 2019, 29, 1346–1362. [Google Scholar] [CrossRef] [Green Version]
- Lin, J.; Li, X. Large-scale ecological red line planning in urban agglomerations using a semi-automatic intelligent zoning method. Sustain. Cities Soc. 2019, 46, 101410. [Google Scholar] [CrossRef]
- Zhao, X.; Ma, X.; Tang, W.; Liu, D. An adaptive agent-based optimization model for spatial planning: A case study of Anyue County, China. Sustain. Cities Soc. 2019, 51, 101733. [Google Scholar] [CrossRef]
- Liu, X.; Liang, X.; Li, X.; Xu, X.; Pei, F.; Ou, J.; Chen, Y.; Li, S. A future land use simulation model (FLUS) for simulating multiple land use scenarios by coupling human and natural effects. Landsc. Urban Plan. 2017, 168, 94–116. [Google Scholar] [CrossRef]
- Santé-Riveira, I.; Boullón-Magán, M.; Crecente-Maseda, R.; Miranda-Barrós, D. Algorithm based on simulated annealing for land-use allocation. Comput. Geosci. 2008, 34, 259–268. [Google Scholar] [CrossRef]
- Liu, D.; Kong, X.; Zhou, B.; Tian, Y.; Liu, Y.; Wang, H. Spatial optimization of rural settlement relocation by incorporating inter-village social connections under future policy scenarios. Trans. GIS 2019, 23, 688–704. [Google Scholar] [CrossRef]
- Wang, W.; Jiao, L.; Jia, Q.; Zhang, W.; Su, F.; Xu, G.; Ma, S. Delineating urban growth boundaries under multi-objective and constraints. Sustain. Cities Soc. 2020, 61, 102279. [Google Scholar] [CrossRef]
- Meng, Q.H.; Fu, B.-J.; Yang, L.Z. Effects of land use on soil erosion and nutrient loss in the Three Gorges Reservoir Area, China. Soil Use Manag. 2001, 17, 288–291. [Google Scholar] [CrossRef]
- Wang, R.J.; Wang, Y.; Sun, S.Y.; Cai, C.J.; Zhang, J.F. Discussing on “source-sink” landscape theory and phytoremediation for non-point source pollution control in China. Environ. Sci. Pollut. Res. 2020, 27, 44797–44806. [Google Scholar] [CrossRef]
- Zhao, H.; Zhang, H.; Miao, C.; Ye, X. Linking Heat Source–Sink Landscape Patterns with Analysis of Urban Heat Islands: Study on the Fast-Growing Zhengzhou City in Central China. Remote Sens. 2018, 10, 1268. [Google Scholar] [CrossRef] [Green Version]
- Burkhard, B.; Kroll, F.; Müller, F.; Windhorst, W. Landscapes‘ Capacities to Provide Ecosystem Services—A Concept for Land-Cover Based Assessments. Landsc. Online 2009, 15, 1–22. [Google Scholar] [CrossRef]
- Zhang, H.; Yang, Q.; Zhang, Z.; Lu, D.; Zhang, H. Spatiotemporal Changes of Ecosystem Service Value Determined by National Land Space Pattern Change: A Case Study of Fengdu County in The Three Gorges Reservoir Area, China. Int. J. Environ. Res. Public Health 2021, 18, 5007. [Google Scholar] [CrossRef] [PubMed]
- Liding, C.; Shurong, Z.; Bojie, F.; Hongjia, P. Correlation analysis on spatial pattern of land use and soil at catchment scale. Acta Ecol. Sin. 2003, 23, 2497–2505. [Google Scholar]
- Song, X.-P.; Hansen, M.C.; Stehman, S.V.; Potapov, P.V.; Tyukavina, A.; Vermote, E.F.; Townshend, J.R. Global land change from 1982 to 2016. Nature 2018, 560, 639–643. [Google Scholar] [CrossRef]
- Carsjens, G.; Van der Knaap, W. Strategic land-use allocation: Dealing with spatial relationships and fragmentation of agriculture. Landsc. Urban Plan. 2002, 58, 171–179. [Google Scholar] [CrossRef]
- Janssen, R.; van Herwijnen, M.; Stewart, T.J.; Aerts, J.C.J.H. Multiobjective Decision Support for Land-Use Planning. Environ. Plan. B Plan. Des. 2008, 35, 740–756. [Google Scholar] [CrossRef]
- Xin, L.; Ning, L.; Minghao, O. Review of the studies on land use structure and layout optimization. J. Arid Land Resour. Environ. 2016, 30, 103–110. [Google Scholar] [CrossRef]
- Martín-Martín, C.; Bunce, R.G.H.; Saura, S.; Elena-Rosselló, R. Changes and interactions between forest landscape connectivity and burnt area in Spain. Ecol. Indic. 2013, 33, 129–138. [Google Scholar] [CrossRef]
- Saura, S.; Estreguil, C.; Mouton, C.; Rodríguez-Freire, M. Network analysis to assess landscape connectivity trends: Application to European forests (1990–2000). Ecol. Indic. 2011, 11, 407–416. [Google Scholar] [CrossRef]
- Jinrui, L.; Zongzhu, C.; Tingtian, W.; Yuanling, L.; Qi, Y.; Xiaohua, C. Spatial autocorrelation pattern analysis of land use and the value of ecosystem services in northeast Hainan island. Acta Ecol. Sin. 2018, 39, 2366–2377. [Google Scholar] [CrossRef]
- Xing, L.; Zhu, Y.; Wang, J. Spatial spillover effects of urbanization on ecosystem services value in Chinese cities. Ecol. Indic. 2020, 121, 107028. [Google Scholar] [CrossRef]
- Fu, Y.; Shi, X.; He, J.; Yuan, Y.; Qu, L. Identification and optimization strategy of county ecological security pattern: A case study in the Loess Plateau, China. Ecol. Indic. 2020, 112, 106030. [Google Scholar] [CrossRef]
- Zhao, X.Q.; Li, S.N.; Pu, J.W.; Miao, P.P.; Wang, Q.; Tan, K. Optimization of the National Land Space Based on the Coordination of Urban-Agricultural-Ecological Functions in the Karst Areas of Southwest China. Sustainability 2019, 11, 6752. [Google Scholar] [CrossRef] [Green Version]
- Shuai, C.; Xiaobin, J.; Xuhong, Y.; Rui, S.; Jing, L.; Bo, H.; Weiyi, X.; Yinkang, Z. Coupled MOP and GeoSOS-FLUS models research onoptimization of land use structure and layout in Jintan district. J. Nat. Resour. 2019, 34, 1171–1185. [Google Scholar] [CrossRef]
- Wan, K.K.W.; Li, D.H.W.; Yang, L.; Lam, J.C. Climate classifications and building energy use implications in China. Energy Build. 2010, 42, 1463–1471. [Google Scholar] [CrossRef]
- Wu, X.; Sucui, L.; Suyan, L.; Jianfei, X.; Xujiao, L.; Tao, S.; Zengwei, T.; Xiangyu, Y. Evaluation and application of landscape ecological effects before and after land consolidation. J. China Agric. Univ. 2017, 22, 152–162. [Google Scholar] [CrossRef]
- Liang, X.; Liu, X.P.; Li, X.; Chen, Y.M.; Tian, H.; Yao, Y. Delineating multi-scenario urban growth boundaries with a CA-based FLUS model and morphological method. Landsc. Urban Plan. 2018, 177, 47–63. [Google Scholar] [CrossRef]
- Junjie, Z.; Yanli, G.; Yumei, C.; Wei, Z.; Tao, Y. Spatial optimization on the municipal level based on “multiple planningintegration”: A case study of Yantai City. Prog. Geogr. 2018, 37, 1045–1054. [Google Scholar] [CrossRef]
- Hu, S.; Chen, L.; Li, L.; Zhang, T.; Yuan, L.; Cheng, L.; Wang, J.; Wen, M. Simulation of Land Use Change and Ecosystem Service Value Dynamics under Ecological Constraints in Anhui Province, China. Int. J. Environ. Res. Public Health 2020, 17, 4228. [Google Scholar] [CrossRef]
- Liu, Y.; Wang, H.; Ji, Y.; Liu, Z.; Zhao, X. Land Use Zoning at the County Level Based on a Multi-Objective Particle Swarm Optimization Algorithm: A Case Study from Yicheng, China. Int. J. Environ. Res. Public Health 2012, 9, 2801–2826. [Google Scholar] [CrossRef] [Green Version]
- Mei, Z.; Wu, H.; Li, S. Simulating land-use changes by incorporating spatial autocorrelation and self-organization in CLUE-S modeling: A case study in Zengcheng District, Guangzhou, China. Front. Earth Sci. 2018, 12, 299–310. [Google Scholar] [CrossRef]
- Kongjian, Y.; Wei, L.; Dihua, L.; Chunbo, L.; Gang, H.; Hailong, L. Suitability analysis of heritage corridor in rapilly urbanizing region: A case study of Taizhou City. Geogr. Res. 2005, 24, 69–77. [Google Scholar] [CrossRef]
- Liu, Y.; Cui, N.; Han, R.; Guo, L. Establishing Ecological Security Patterns Based on Reconstructed Ecosystem Services Value in Rapidly Urbanizing Areas: A Case Study in Zhuhai City, China. Sustainability 2020, 12, 6629. [Google Scholar] [CrossRef]
- Cui, L.; Wang, J.; Sun, L.; Lv, C. Construction and optimization of green space ecological networks in urban fringe areas: A case study with the urban fringe area of Tongzhou district in Beijing. J. Clean. Prod. 2020, 276, 124266. [Google Scholar] [CrossRef]
- Qing, C.; Guangming, Z.; LIn, S.; Jie, L.; Lu, H.; Anlei, W. ldentifying ecological corridors using shortest path algorithm based on raster data. Geogr. Res. 2012, 21, 1523–1534. [Google Scholar] [CrossRef]
- Zhang, D.; Wang, X.; Qu, L.; Li, S.; Lin, Y.; Yao, R.; Zhou, X.; Li, J. Land use/cover predictions incorporating ecological security for the Yangtze River Delta region, China. Ecol. Indic. 2020, 119, 106841. [Google Scholar] [CrossRef]
- Guo, H.; Cai, Y.; Yang, Z.; Zhu, Z.; Ouyang, Y. Dynamic simulation of coastal wetlands for Guangdong-Hong Kong-Macao Greater Bay area based on multi-temporal Landsat images and FLUS model. Ecol. Indic. 2021, 125, 107559. [Google Scholar] [CrossRef]
- Pontius, R.G.; Millones, M. Death to Kappa: Birth of quantity disagreement and allocation disagreement for accuracy assessment. Int. J. Remote Sens. 2011, 32, 4407–4429. [Google Scholar] [CrossRef]
- Chen, Y.; Li, X.; Liu, X.; Ai, B. Modeling urban land-use dynamics in a fast developing city using the modified logistic cellular automaton with a patch-based simulation strategy. Int. J. Geogr. Inf. Sci. 2014, 28, 234–255. [Google Scholar] [CrossRef]
- Pontius, R.G.; Boersma, W.; Castella, J.-C.; Clarke, K.; de Nijs, T.; Dietzel, C.; Duan, Z.; Fotsing, E.; Goldstein, N.; Kok, K.; et al. Comparing the input, output, and validation maps for several models of land change. Ann. Reg. Sci. 2008, 42, 11–37. [Google Scholar] [CrossRef] [Green Version]
- Bennett, E.M.; Peterson, G.D.; Gordon, L.J. Understanding relationships among multiple ecosystem services. Ecol Lett. Ecol. Lett. 2009, 12, 1394–1404. [Google Scholar] [CrossRef]
- Baró, F.; Palomo, I.; Zulian, G.; Vizcaino, P.; Haase, D.; Gómez-Baggethun, E. Mapping ecosystem service capacity, flow and demand for landscape and urban planning: A case study in the Barcelona metropolitan region. Land Use Policy 2016, 57, 405–417. [Google Scholar] [CrossRef] [Green Version]
- Gao, L.; Bryan, B.A. Finding pathways to national-scale land-sector sustainability. Nature 2017, 544, 217–222. [Google Scholar] [CrossRef] [PubMed]
- Cao, T.G.; Yi, Y.J.; Liu, H.X.; Xu, Q.; Yang, Z.F. The relationship between ecosystem service supply and demand in plain areas undergoing urbanization: A case study of China?s Baiyangdian Basin. J. Environ. Manag. 2021, 289, 8. [Google Scholar] [CrossRef] [PubMed]


| Types | Datasets | Sources | Resolution |
|---|---|---|---|
| Spatial data | Land use datasets (2010, 2018) | http://www.resdc.cn/, accessed on 2 August 2021 | 30 m |
| Administrative boundary, river system, and roads in the study area | http://www.ngcc.cn/ngcc/, accessed on 2 August 2021 | Vector | |
| Elevation | http://www.gscloud.cn/, accessed on 2 August 2021 | 30 m | |
| Precipitation and temperature | http://www.geodata.cn/, accessed on 5 August 2021 | 1 km | |
| Soil texture and soil organic matter content | http://westdc.westgis.ac.cn/, accessed on 6 August 2021 | 1 km | |
| Ecological conservation redlines and basic farmland conservation areas | Chongqing planning and Natural Resources Bureau | Vector | |
| GDP grid data and population grid data | http://www.geodata.cn/, accessed on 9 August 2021 | 1 km | |
| Statistical data | Socio-economic indicators (gross domestic product, urban resident population) and agricultural production indicators (output of farming, forestry, animal husbandry, fishery, and agricultural service industries) | “Chongqing Statistical Yearbook”, and “Fengdu Yearbook” | — |
| Land Use Type | Paddy Field | Dry Land | Forest | Grassland | Water | Urban Land | Rural Settlement | Unused Land |
|---|---|---|---|---|---|---|---|---|
| Ecological benefit | 1.03 | 0.91 | 5.60 | 4.78 | 67.93 | −0.69 | −0.69 | 0.05 |
| Economic benefit | 11.01 | 11.01 | 7.31 | 25.15 | 9.35 | 80.52 | 19.41 | 0.1 |
| Constraint Types. | Constraint Variables | Constraint Conditions |
|---|---|---|
| Total area constraint | The total area of each land use type | |
| Planning objective constraints | Cultivated land area | |
| Forest area | ||
| Urban land area | ||
| Unused land area | ||
| Ecological environment constraints | Total area of ecological land | Total area of ecological land in 2018 |
| Grassland area | alue in 2018 | |
| Water area | Value in 2018 | |
| habitat quality | ||
| Intensive development constraints | Urban land area | |
| Rural residential area |
| Land Use Types | 2018 | SEC Scenario | MEC Scenario | REC Scenario | |
|---|---|---|---|---|---|
| ISLs | Forest | 1316.42 | 1438.64 | 1371.54 | 1369.96 |
| Grassland | 181.77 | 180.09 | 180.09 | 181.77 | |
| Water | 52.33 | 57.89 | 57.89 | 52.23 | |
| Subtotal | 1550.52 | 1676.62 | 1609.52 | 1603.96 | |
| CSLs | Paddy field | 367.18 | 327.12 | 335.84 | 350.24 |
| Dry land | 950.20 | 863.31 | 905.76 | 893.08 | |
| Unused land | 0.05 | 0 | 0 | 0 | |
| Subtotal | 1317.43 | 1190.43 | 1241.60 | 1243.32 | |
| SLs | Urban land | 24.68 | 28.89 | 41.54 | 45.38 |
| Rural settlement | 8.24 | 4.92 | 8.20 | 8.24 | |
| Subtotal | 32.92 | 33.81 | 49.74 | 53.58 | |
Publisher’s Note: MDPI stays neutral with regard to jurisdictional claims in published maps and institutional affiliations. |
© 2021 by the authors. Licensee MDPI, Basel, Switzerland. This article is an open access article distributed under the terms and conditions of the Creative Commons Attribution (CC BY) license (https://creativecommons.org/licenses/by/4.0/).
Share and Cite
Zhang, H.; Yang, Q.; Zhang, H.; Zhou, L.; Chen, H. Optimization of Land Use Based on the Source and Sink Landscape of Ecosystem Services: A Case Study of Fengdu County in the Three Gorges Reservoir Area, China. Land 2021, 10, 1242. https://doi.org/10.3390/land10111242
Zhang H, Yang Q, Zhang H, Zhou L, Chen H. Optimization of Land Use Based on the Source and Sink Landscape of Ecosystem Services: A Case Study of Fengdu County in the Three Gorges Reservoir Area, China. Land. 2021; 10(11):1242. https://doi.org/10.3390/land10111242
Chicago/Turabian StyleZhang, Haozhe, Qingyuan Yang, Huiming Zhang, Lulu Zhou, and Hongji Chen. 2021. "Optimization of Land Use Based on the Source and Sink Landscape of Ecosystem Services: A Case Study of Fengdu County in the Three Gorges Reservoir Area, China" Land 10, no. 11: 1242. https://doi.org/10.3390/land10111242
APA StyleZhang, H., Yang, Q., Zhang, H., Zhou, L., & Chen, H. (2021). Optimization of Land Use Based on the Source and Sink Landscape of Ecosystem Services: A Case Study of Fengdu County in the Three Gorges Reservoir Area, China. Land, 10(11), 1242. https://doi.org/10.3390/land10111242