Article

Assessing the Climate Resilience of Sub-Saharan Africa (SSA): A Metric-Based Approach

1
Key Laboratory of Geographical Processes and Ecological Security in Changbai Mountains, Ministry of Education, School of Geographical Sciences, Northeast Normal University, Changchun 130024, China
2
School of Humanities and Law, Northeastern University, Shenyang 110169, China
*
Author to whom correspondence should be addressed.
Land 2021, 10(11), 1205; https://doi.org/10.3390/land10111205
Submission received: 28 September 2021 / Revised: 29 October 2021 / Accepted: 4 November 2021 / Published: 7 November 2021
(This article belongs to the Topic Climate Change and Environmental Sustainability)

Abstract

:
The impacts of climate change have resulted in the emergence of resilience as the de factor framework for countries seeking to capture the differential and uneven ability to prepare, react, respond and cope with volatile and rapid changes of climate-related stresses. Despite being considered by many researchers the most vulnerable region to the negative effects of climate change, the climate resilience of Sub-Saharan Africa has not been extensively studied. Using countries in Sub-Saharan Africa (SSA) as a study area, this paper constructed a pragmatically based resilience metric called the composite national climate resilience index (CNCRI) that can be used as a tool for the policy word. The inherent variables used to construct the CNCRI were justified and used to measure the resilience of countries in SSA based on five different dimensions. The result indicates that the CNCRI score, 1.05 (least resilient) to 44.8 (most resilient), and the island countries of Mauritius, Seychelles, and Cape Verde are comparatively more resilient than the rest of the countries in the study area. Regionally, Southern Africa is more resilient compared to East, West, and Central Africa. The vulnerability and readiness metric suggested that Cape Verde is the only country in SSA to have low vulnerability and high readiness, while most countries have high vulnerability and low readiness, making them the least resilient countries needing urgent mitigation and adaptation actions. Lastly, finding from this study could provide the policy world with insight for improving the overall ability to prepare and respond to the negative impacts of climate in the study area.

1. Introduction

In Africa, the impacts of climate change are already putting a massive strain on cities, resources, and the natural landscape [1,2,3]. Climate change factors, including rising temperatures, are profoundly affecting humanity in different ways [4]. Over the years, climate data clearly shows that there has been a progressive rise in temperature and a decrease in mean annual rainfall in all five bio-climatic zones in Africa [5]. According to the Intergovernmental Panel on Climate Change, rising temperatures in Sub-Saharan Africa are expected to be greater than the global average, resulting in the decline of rainfall in the region [6]. The extreme weather conditions have resulted in frequent droughts in the region where farmers are dependent on the traditional form of agriculture that is rainfall. Hence, affecting the economic growth and livelihood of the poor, especially as it relates to food security [6]. Moreover, in countries like Mauritanian, Niger, and South Sudan, heavy rains have caused severe flooding affecting thousands of people, damaging houses and farmland. For instance, in South Sudan, the 2019 severe flooding following heavy rainfalls that lasted for about 6 months from June to December affected more than 900,000 inhabitants and caused a major humanitarian crisis [7]. The catastrophe damaged more than 70,000 hectares of cultivated land. The 2015 El Nino-induced drought caused food insecurity affecting more than 10.2 million people, one of the highest on records [8] in Ethiopia, Kenya, and Uganda. Rising temperatures are projected to lower productivity in major staple crops such as maize, cassava, rice, yams, and plantain [6]. Cash crops, which are the leading foreign exchange earner, are sensitive to climatic conditions. For instance, climatic zones in Ghana suitable for cocoa, coffee, and cola nuts production are shrinking as the temperature rises, causing drought, desertification, and loss of arable lands [9]; hence, investment in agriculture is becoming more expensive and less profitable in SSA. The effects of climate change on social and environmental factors of health (clean air, safe drinking water, sufficient food, and secure shelter) are enormous in SSA [10]. For example, the intense tropical cyclone Idai that hit Mozambique and neighboring countries Zimbabwe and Malawi in March 2019 caused a ruinous and humanitarian crisis in the three countries. In Zimbabwe, it was estimated that more than 270,000 people were affected, and over 340 deaths were recorded caused by Idai [11].
The region is facing the impacts of climate-related disasters such as droughts and floods as well as other forms of socio-economic disturbances such as uncontrolled urbanization, power fluctuations, weak financial system, unemployment, weak institutions, and mismanagement of public funds. However, climate-related disaster impacts and other forms of crises are not even across countries and regions in SSA as response and recovery vary across countries which might be related to varying nature of hazard exposure, hazard impacts, and socio-economic and environmental aptitudes of the country [12]. Therefore, identifying the primary factors that make countries in SSA vulnerable or resilient to climate change is extremely important to prepare, respond, recover and adapt to the impacts of a disaster.
The concept of resilience is now the de facto framework for countries and regions climate-related disaster readiness, response, and recovery [13]. The advancement of the concept “climate change resilience” in recent years has become significant for organizations, communities, governments (local and central) to enhance their ability to prepare and plan for, absorb, recover from and adapt to potential adverse effects of climate change in a timely and efficient manner [14]. The conceptual models and literature on resilience are robust, ranging from those that consider the concept as a system such as food security [15], infrastructure [16] and governance [17], to those that consider resilience as a core construct and place-based concept [18] that has been applied to the human environment such as urban and rural areas [19] as well as thematic areas such as sustainability [20] and climate change [21]. Moreover, some consider resilience as a cross-scale [22] which entails a closer look at the scale at which the framework intends to measure, such as resilience at a local level [23], at the city level [19], and the national and system-level [24]. Hence, resilience scales are argued to be inherently intertwined as the resilience of an individual level is influenced by the resilience of the community extensively, which in turn influenced my national level; nevertheless, features of resilience manifest differently at each level [22]. Lastly, those who consider resilience as a time series highlight the critical importance of the temporal aspect of resilient measurement [25].
The impacts of climate change have resulted in the emergence of resilience for countries seeking to capture the differential and uneven ability to prepare, react, respond and cope with volatile and rapid changes of climate stresses. Over the years, many local communities in SSA have gained expertise in strategic conceptualization, planning, and implementation of adaptation activities across several sectors; nevertheless, most of the adaptation or coping range to climate change and its variability is championed by households or individuals in response to short-term motivations, with little or no support from government stakeholders, non-governmental organizations (NGOs), international organizations, donor countries, etc. The level of investment and finance in climate change risk management in many countries remains insufficient, despite a rapidly growing body of documented evidence [26,27,28] of the subject matter. Although the concept of resilience has become one of the core objectives in the field of climate change studies globally, there are a few studies that have been conducted to measure climate resilience in SSA, a region that is considered to be the most vulnerable to the negative impacts of climate change [3,6,29].
Therefore, this study used a popular method called the composite index method to analyze the spatial pattern of climate resilience in SSA. In this study, we used quantitative variables to construct resilience metrics that meaningfully capture the outcomes of climate change resilience that focus on the national-level study areas. Our objective is to use the matric-based approach to measure a country-level climate resilience that includes more extensive variables and 48 countries in SSA. Our metrics approach aims to capture a country’s social, economic, infrastructure, environmental, and institution interactions that work together towards enhancing climate resilience in SSA. The purpose of this study is to serve as a reference point for examining current and future climate change resilience and the need for adaptation measures.

2. Literature Review

2.1. Climate Change and Climate-Related Disaster in SSA

Climate resilience refers to the strengthening of a country or system to standard climate-related disasters where adaptation and resilience intersect. It can also be defined as the capacity of a system or a unite to cope with or recover from the negative effects of climate change while retaining the critical components of the original system [30]. Climate-related disasters refer to the potential adverse effects of climate change on the social, economic, environmental, and infrastructure of a country or a region. Climate-related risks are created by a range of disasters. Some of them are sudden in their onsets, such as tropical storms and floods, and some are slow in their onset, such as changes in precipitation and temperature leading to droughts [31]. In our view, climate resilience refers to the ability of a country or region to resist, absorb, recover, adapt and develop through continuous learning and adjusting internal economic, social, environmental, and infrastructure systems in the face of climate change-related risks caused by acute shocks or chronic combustion. SSA is the most vulnerable region in the world to climate change and its variabilities. Rainfall anomalies, rising temperatures, and rising sea levels are exacerbating the frequency and intensity of climate-related risks such as droughts, floods storms, and epidemics, resulting in the transformation of the region’s geography. The recent natural disasters such as the devasting cyclone Kenneth and Idai, the flooding and ongoing locust outbreaks in Eastern Africa, the droughts in Southern and Eastern Africa, and the Sahel’s desertification have contributed to food insecurity and mass migration that have threatened millions of people and livelihoods in the region. It is undeniable that there has been considerable progress in socio-economic development in recent decades. However, the region’s ability to prepare for, respond to and recover from disasters is limited due to broader ineffective political, economic, social, environmental, and institutional conditions.
Adapting to climate stimuli is critical for the social and economic development of a country. Adaptation refers to the changes in processes, practices, and structures in ecological, social, infrastructure, and economic systems in response to actual or expected climate stimuli and their effects and impacts. In SSA, climate change adaptation is particularly challenging given countries’ limited capacity and financial resources. Several studies have clearly shown the importance of developing a framework that fosters structural transformation of raising resilience to climate change and improving coping mechanisms. However, implementing effective adaptation measures in many countries in SSA in some cases raises additional challenges from ethnic and political conflicts and security issues.

2.2. Regional Resilience Framework, Scale, and Unite of Measurements

There are several regional resilience frameworks and indicator sets in various degrees of comprehensiveness, validity, and accuracy, which provide local communities and regions with a set of indicators or variables to examine their resiliency, preserve their critical structures and functions in the face of stress and recover quickly to the pre-disaster circumstance [32]. Understanding the question, resilience for whom is crucial because resilience is a cross-scale phenomenon that entails a closer look at the scale the framework intends to measure [33]. However, resilience scales are inherently intertwined as the resilience of an individual is influenced by the resilience of the community extensively, which is, in turn, influenced my national level; nevertheless, resilience qualities manifest differently at each level.
There are three main scales for resilience framework analyses outlined by Bahadur (2017) [33]: resilience at the local level frameworks are generally linked to a particular intervention or designed to help inform programming. They use participatory tools to identify ‘building blocks’ of community resilience and to ask people to gauge which development interventions were the most impactful in building resilience against a disturbance. Community levels variables include quality of the environment and natural resources management institution, access to communal resources, quality of protective infrastructure, levels of peace and security, availability of contingency resources or social safety nets, and social participation in the community. Frameworks that measure the household level of resilience includes several indicators such as income level, access to food, access to basic service such as health, assets, social safety nets. Many studies have employed various dimensions to measure the resilience capacity of a community. For instance, Rifat & Liu (2020) [34] developed a composite community disaster resilience index to measure and compare coastal communities of the United States (US). Cutter et al. (2014) [35] created a resilience matric called the baseline resilience indicators for the community to study US counties using six different dimensions: social, economic, housing and infrastructure, institutional, community, and environment. Lam et al. (2015) [36] used the resilience inference measurement (RIM) model to analyze resilience to climate-related hazards in 52 US counties along the Northern Gulf of Mexico. The study used exposure, damage, and recovery indicators to denote two relationships (vulnerability and adaptability). The problem with this framework and these studies is the potential weakness for actions that are important for large-scale areas and disasters, such as the impacts of climate change that cover almost every dimension of the resilience capacity of a system.
Our studies focus on the third resilience framework, which is resilience at the national or country level, which is qualitatively distinct from those that measure household-level or community resilience [33]. In these studies, the resilience frameworks of the national scale focus on systems, institutions, and policies that deliver resilience for the country. Variables used to measure resilience at the national scale are focused on the national government’s capacity to respond to climate-related disasters. Some of the suggested indicators are institutional knowledge of climate change and integration of climate change into the planning and implementation of policies. Additionally, the difference between our studies and other studies on vulnerability and resilient assessment is the inclusion of institutional dimension indicators that measures the government’s effectiveness before, during, and after a disaster. Indicators such as transparency, access to information, control of corruption and fraud, accountability, participation, and engagement are critical to providing a resilient response to the negative impacts of climate change.

3. Theoretical Framework

As the prominent tool to deal with these volatile and changing stresses, resilience is gaining more and more attention from researchers, academicians, and policymakers throughout the globe [37]. The introduction of resilience by Holling in 1973 as a concept was to provide an alternative for a system (ecosystem) to persist or to return to its original state after being subject to perturbation [38]. There are three broad conceptualizations of resilience, i.e., engineering, ecological and social-ecological resilience. The first is the ability of a system to return to an equilibrium state after a disturbance, and it is termed engineering resilience [13]. Engineering resilience focuses on maintaining a system’s efficiency, constancy and predictability so that they remain near to the pre-determined equilibrium. The second, ecological resilience, rejects the idea of a single equilibrium and instead suggests that there are multiple equilibria that are: how long it takes a system to bounce back after a shock, and how much shock a system can take and persist before changing function [39]. The third, socio-ecological resilience, rejects the common notion of equilibrium of engineering and ecological resilience; instead, it argues that complex social-ecological systems can change, adapt, or transform in response to shocks [40]. The main difference between single equilibrium, multiple equilibrium resilience and social-ecological resilience is that engineering and ecological resilience emphasize “a return to normalcy”, while social-ecological resilience incorporates the elements of complexity that emphasize re-organization and adaptation [40]. The combination of these three conceptualizations of resilience allows for a greater extension cover of potential risks to the unit, where the concept of resilience would apply to both historical risks and future unpredictable risks of climate change. According to the United Nations International Strategy for Disaster Reduction [41], “resilience is the ability of a system, community or society exposed to hazards to resist, absorb, accommodate to and recover from the effects of a hazard in a timely, and efficient manner, including through the preservation and restoration of its essential basic structures and functions”. Figure 1 shows the graphical representation of the climate resilience framework.
In this study, the key determinants of resilience include vulnerability (exposure, sensitivity, and adaptive capacity) and readiness (mitigation and adaptation) (Figure 1). The presence of demonstrable, substantial risk facing a community, country, or system is the common qualifying condition for resilience measurement [40]. Hence, climate risk is the level of exposure to extreme weather conditions, which countries should understand as warnings to be prepared for more frequent or severe conditions in the future [42]. Figure 1 shows the dimensions and determinant of resilience that explains how resilience factors operate to alter the trajectory from risk exposure to negative outcomes.
The challenge factors explain the relationship between the risk factor and the outcome of an event [40]. Exposures to both high levels of climate risks are associated with negative outcomes, but the ability to moderate levels of climate risks is related to fewer negative outcomes. Vulnerability can modify a country’s response to climate stresses. Hence, the identification of various vulnerabilities arising from various physical, social, economic factors helps in the search for actual mechanisms. Vulnerability is the characteristics and circumstances of a community, country, system, or assets that make it susceptible to the emerging effects of a climate-related hazard [41]. Moreover, vulnerability can be defined as a measure of a country’s exposure, sensitivity, and capacity to adapt to the negative effects of climate change [43]. Exposure is a component of vulnerability independent of socio-economic context. Exposure is people, systems, assets, or other elements present in climate hazard zones that are thereby subject to potential losses [41]. The exposed element can be combined with the specific vulnerability to any particular hazard to estimate the quantitative risk associated with that hazard in the area of interest. Sensitivity in the vulnerability component is the extent to which a country is dependent upon a sector affected by the negative impacts of climate hazards or the proportion of people or systems particularly susceptible to climate change shocks [43]. Capacity is the combination of all the strengths, attributes, and resources available within a country that can be used to reduce or over the level of potential climate risks [41]. These capacities reflect already existing sustainable adaptation measures, and they can also reflect capacities to put newer, more sustainable adaption in place.
Lastly, the protective factors explain assets or resources that are used to moderate or reduce the negative effects of climate change [40]. Readiness can be considered a protective component because they help to naturalize or weaken the effects of climate change risks [44]. Readiness is the measure of a country’s ability to leverage investment and convert them to mitigation and adaptation actions from economic, social, government, international agencies, etc. [43]. Adaptation is the adjustment in natural or human systems in response to actual or expected climatic stimuli or their effects, which moderates harm or exploit beneficial opportunities [33,45].

4. Methods and Material
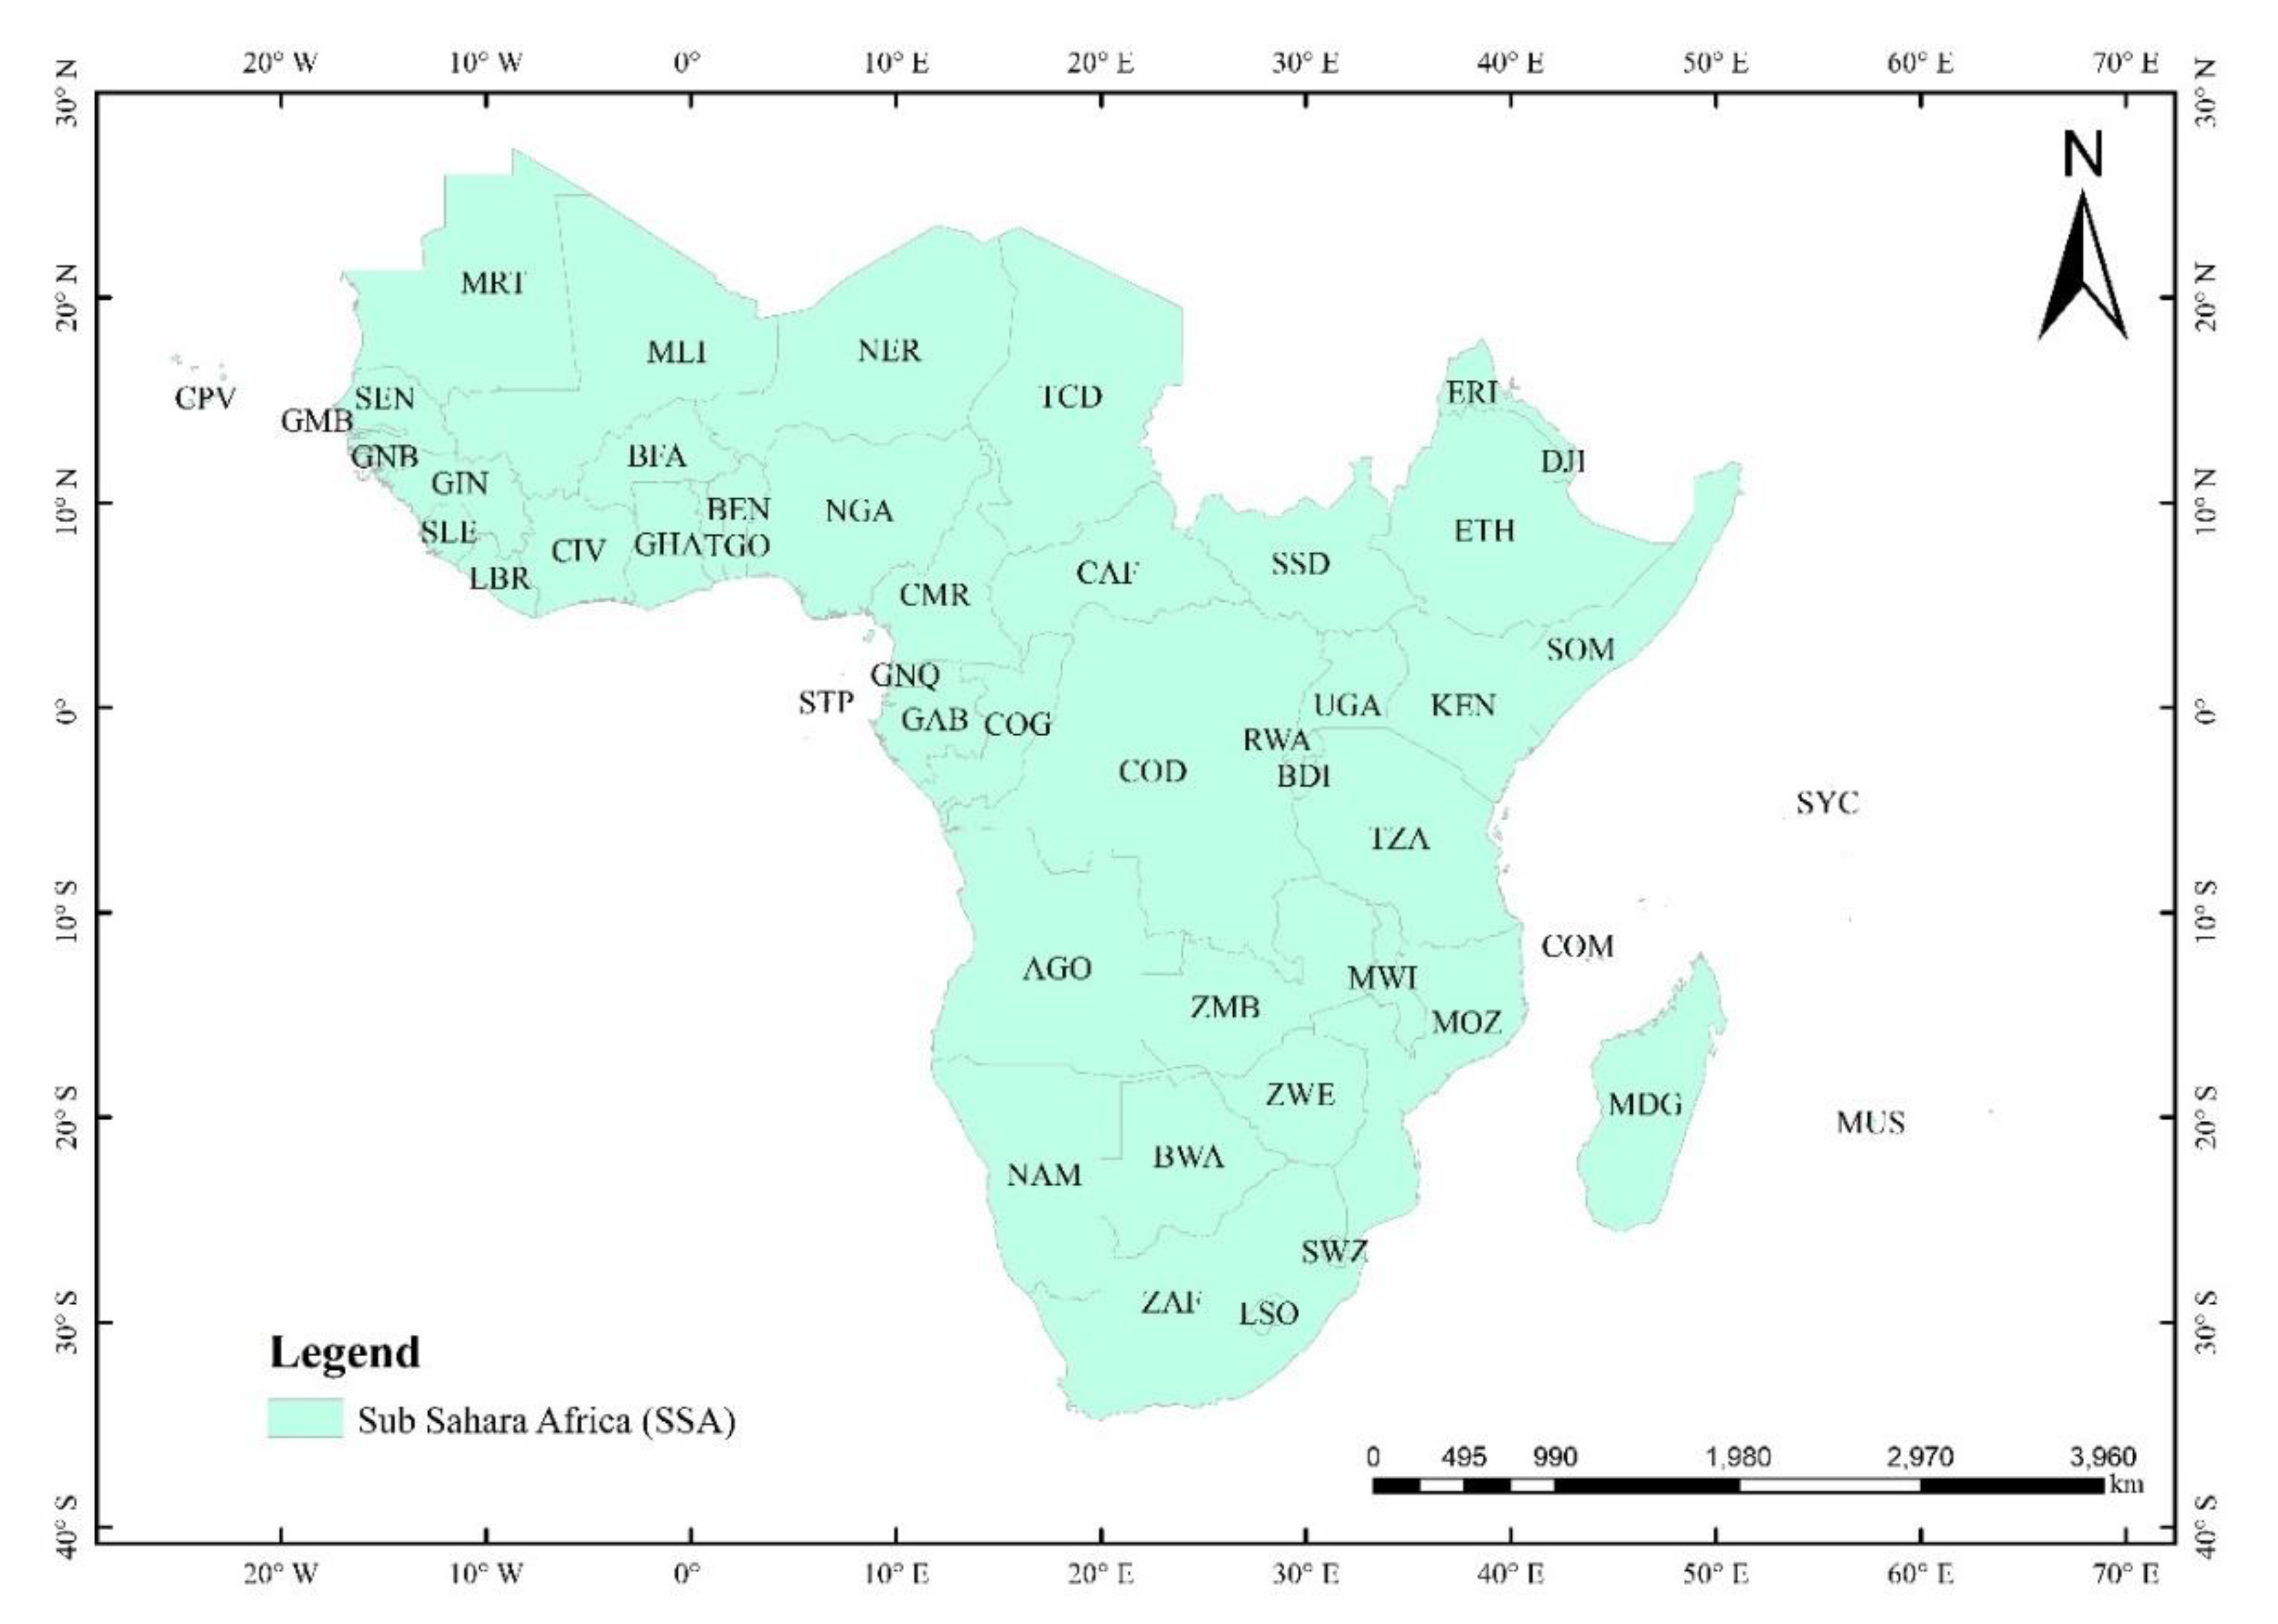
4.1. Study Area

Sub-Saharan Africa (SSA) is geographical and ethnoculturally the area of the African continent that lies South of the Sahara. The UN defines SSA as all African countries and territories that are fully or partially located South of the Sahara. Out of the total 54 countries in Africa, 47 are in SSA, excluding Algeria, Egypt, Morocco, Somalia, Sudan, and Tunisia (see Figure 2). SSA has a wide diversity of bioclimatic zone. The Sahel extends across all of Africa at a latitude of about 10° to 15° N of the equator. Countries such as Mauritania, Mali, Niger, Chad, and Sudan lie in the Northern territories of the Sahara Desert. The Sahel region has a hot semi-arid climate. South of the Sahelian region is the savanna which stretches from the Atlantic Ocean to the Ethiopian highlands. Tropical Africa or the tropical rainforest stretches along the Southern coast of West Africa and across most of Central Africa. In the East lies the woodlands, savannas, and grasslands are found in the equatorial zone. South of the equatorial forests lies the Western and Southern Mongolian forest-savanna mosaic, which is the transitional zones between the tropical forests and the miombo woodland belt that spans the continent from Angola to Mozambique and Tanzania. The Kalahari Desert lies in South-Western Africa.

4.2. Data Source

The data for this study were collected from 5 different data sources. This study focuses on the year 2019 for constructing and assessing the inherent composite resilience indicator. We intentionally used free and open data sources so that the composite resilience indicator set could be simulated with an easy amount of effort. Over 10 datasets were obtained from the World Bank catalog through an online portal. Other sources of data obtained for these studies include the international monetary fund (IMF), the African development bank group (Africa information highway), and climate watch. The vulnerability and readiness metric dataset were obtained from Notre Dame Global Adaptation Initiative (ND-GAIN). Resilience variables were not available for all the countries in SSA in the year 2019; hence, we obtained the closest year possible to 2019 for the analysis.

4.3. Methods

In this study, we used the composite index metric and the vulnerability and readiness metric to measure and compare the resilience of countries in SSA to the negative impacts of climate change. Specifically, the composite index metric is used to analyze the spatial characteristics of resilience levels among countries in SSA; while the vulnerability and readiness metrics are used to examine and compare the vulnerability and adaptation capacity of countries in SSA.

4.3.1. Construction of Composite National Climate Resilience Index (CNCRI)

This study aims to evaluate and compare the resilience of countries in Sub-Saharan Africa (SSA) to the negative impacts of climate change through the use of composite index measurement [34,35,46] and vulnerability and readiness index metric [43]. The assessment of the climate resilience of the countries in SSA consist of variables that help to either increase or decrease the risk of adverse climate-related disasters. For instance, an increase in CO2 emission may increase vulnerability, while protected terrestrial and marine areas may increase resilience to climate-related disasters. Initially, 41 variables were chosen through conceptual and empirical justification from previous studies to represent the 5 types of resilience dimensions (social, economic, infrastructure, environmental and institution). Eleven variables were eliminated after correlation analysis revealed a high degree of collinearity with other variables. Following the elimination of extraneous variables, the final set contained 29 variables that were used to measure and compare the climate resilience of SSA [23,34,35,47,48]. After the raw indicator variables were collected, the data then underwent a process of transformation and normalization. Raw data count variables were transformed into rate, percentages, averages. The purpose is to compare countries in SSA of varying sizes and characteristics. Normalization refers to scaling all variables using one method so that all the data have comparable reference points. In this research, the index is created by combining different sets of variables using simple mathematical and statistical methods.
The diverse indicators that comprise the CNCRI include percentages, rates, and currency values. To include them in a composite measure, we transform these indicators to enable comparisons on a common scale. This study used the minimum-maximum scaling procedure to obtain values reasonable to compare the indicators. We calculate a value from 0 to 100 for each variable as;
s c a l e = ( O b s e r v e d   v a l u e m i n i m u m m a x i m u m m i m i u m   ) 100
The indicators used in the CNCCRI vary in their directionality. For instance, access to electricity is an indicator for which higher values are more desirable. However, the poverty headcount ratio at $ 1.90 a day is better when lower. We, therefore, calculated each negative variable as;
        s c a l e = 1 [ ( o b s e r v e d   v a l u e m i n i m u m M a x i m u m M i n i m u m ) 100 ]
Single indicator variables cannot directly measure a phenomenon; therefore, we created a composed index by combining many variables that could be effective for decision-making and comparing a country’s performance. Many researchers [34,35,46] have used a wide range of indicator variables in their attempt to measure disaster resilience. These indicator variables represent different dimensions of resilience, including social, economic, environmental, infrastructural, institutional, community, ecological, physical, etc. However, this study focuses on the first five mentions above. Climate resilience is composed of dimensions, and to measure and compare countries of SSA we constructed a CNCRI.
This study used existing statistical data to estimate an abstract concept such as climate resilience. Hence, it is important to explain the variables included in examining resilience levels in SSA. The 6 variables in the social dimension category are intended to provide demographic qualities of a country’s population that are associated with health, education, and communication. For example, countries that have a larger number of physicians and insurance programs could demonstrate higher levels of resilience than countries with fewer of these characteristics. In the same vein, countries or regions with more access to telephone service would be better prepared for and respond better before, during, and after a disaster. Table 1. shows a list of relevant citations that provide conceptual or empirical justification to the study.
In this study, the indicators in the economic resilience category are based on our interest in how the general economic profile and character of a country can be of benefit in a climate-related disaster management context. The indicators are intended to represent the country’s economic diversity, innovations, and skilled labor force. In SSA, the agriculture sector is perhaps the sector most prone to the impacts of climate-related disaster because employees in the sector are temporary, and its activities are highly dependent on weather conditions; therefore, its inclusion in this analysis. Moreover, we included employment rate [34] and poverty [52] because countries with large employment rates and low poverty rates can enhance resilience; on the other hand, countries with high unemployment and extreme poverty are more vulnerable to the impacts of climate-related disasters. Additionally, we included an indicator of assistance and aid. Countries can enhance climate resilience through foreign development assistance and aids to help combat the problems posed by climate change [53]. Furthermore, access to financial services can strengthen the resilience of households or regions in the face of climate-related disasters and inherently provide support to livelihoods and stimulate economic activities after a disaster [63].
The environmental dimension is an important aspect of climate change resilience. The height at which infrastructure, resources, cities and communities sit concerning tides, water level, floodwater, etc., determines their exposure and vulnerability to the impacts of climate change [35]. Countries with a lower percentage of their land elevation below 5 m are more likely to be resilient to the impacts of climate change-related disasters such as flooding and cyclones than countries with a higher percentage of land elevation below 5 m [35]. Moreover, the percentage of forest area is added to the environmental dimension because they help stabilize the climate. Forests regulate ecosystems, protect biodiversity, play an integral part in the carbon cycle, support livelihoods, and can help drive sustainable growth [56]. Hence, countries with a high percentage of forest area can be considered resilient to climate change impacts.
The variables in the infrastructure dimension include access to sanitation [64], access to safe water [65], access to clean fuel and technology for cooking [66], access to electricity [66], access to internet services, and medical care. Access to water, sanitation, energy, housing, and transport improve life. Additionally, information and communication technologies promote growth, communication and improve the delivery of health and other services in times of disaster [34]. Furthermore, countries with more hospital beds could better serve with medical care to patients and thus reduce fatalities [35].
Lastly, the 4 variables in the institutional dimension are meant to examine aspects related to government effectiveness, regulatory qualities, control of corruption, accountability, and political stability for policies and programs implementation [62]. In this context of institutional dimension, resilience stems not directly from currency amount but from the institutional knowledge and experience of navigating policies and implementing climate programs. For example, a country with a high rate of government effectiveness has control of corruption, public life, and decision making are based on gender equality, and with a high level of accountability to implement climate programs and policies could be more resilient to the impacts of climate-related disaster and vice versa.
We used the principal component analysis (PCA) with Oblimin rotation in SPSS to reduce the number of variables from 29 (i.e., 6 for social, 6 for economic, 6 for infrastructure, 6 for environment, and 5 for institutional) across the 5 dimensions; with a KMO value of 0.828, 0.761, 0.690, 0.860, and 0.791 for the social, economic, environmental, infrastructure, and institutional, respectively, and a Bartlett’s test p-value of 0.000 for each dimension. Hence, the PCA examination indicates that it is appropriate or factorable to carry component analysis and that the observed correlation follows an identity structure for variables used in the study (see Table 2).
Components with eigenvalues greater than 1.0 from the five dimensions used in this study were retained to quantify the national climate resilience by producing the factor scores. We retain the one component of each dimension to summarize the pattern of variance and co-variance among the measured variables since the percentages of their variance explained accounted for are more than 50%. For example, the first component of the social dimension is dominated by four variables (Physician’s access, educational attainment, Infant mortality, and Nurse and midwifery access), and the first component of infrastructure dimension is dominated by four variables (access to electricity, access to safe water, access to clean fuel and technologies for cooking, and access to internet service). Then the five components from each dimension were combined into a single measure to create the CNCRI.
After using PCA, the dominant variables extracted across the five dimensions were averaged to create dimension-level resilient scores, ranging from 0 to 100. To calculate the overall resilience scores that summarize performance across the five dimensions, every country dimension scores are averaged with equal weighting. The equation for weighting the dimension is:
S c o r e = 0.2   ( A ) + 0.3 ( B ) + 0.2 ( C ) + 0.15 ( D ) + 0.15 ( E )
where A is social; B is economic; C is infrastructure; D is environmental, and E is institutional. The final CNCRI scores are presented as values from 1 to 100 and are used to rank the 48 countries in SSA.

4.3.2. Vulnerability and Readiness Metric

We adopted the Notre Dame Global Adaption Initiative that measures resilience using two key dimensions: vulnerability and readiness. Vulnerability and readiness metrics can be used to inform policymakers on why to invest in climate change adaption programs for countries that are ill-equipped to implement effective preparedness and response measures due to their weak capacity to mitigate and adapt to climate stress. The indicators used to measure vulnerability to climate change impacts include water, health, ecosystem service, food, human habitat, and infrastructure [43]. The Notre Dame Global adaption initiatives define vulnerability as a measure of a country’s exposure, sensitivity, and adaptive capacity to the negative effects of climate change [43].
  • Exposure is the degree to which a unit or system is exposed to the negative impacts of climate change and its variabilities.
  • Sensitivity is the degree to which a country depends on climate-sensitive sectors, or a country’s sector of the economy which is highly susceptible to climate change disturbances. A typical example is a traditional form of farming in many parts of SSA that depend on rainfall for cultivation.
  • Adaptive capacity
Readiness is the measure of a country’s economic, governance, and social abilities to leverage climate finance and investments and convert their effective implementation of climate policies [43]. The measurement of the overall readiness includes economic readiness, government readiness, and social readiness. The vulnerability and readiness scores are composed as [43];
V u l n e r a b i l i t y   a n d   R e a d i n e s s   i n d e x 0 1 = ( R 0 1 V 0 1 + 1 )
where R0-1 is the readiness indicators scaled from 0-1 (higher values are better), and V0-1 is the vulnerability indicators scaled from 0-1 (lower values are better). We used the vulnerability and readiness scores to compare countries’ resilience based on a quadrant graph. The vulnerability and readiness matrix includes 46 countries in SSA, excluding two countries because of a lack of data. The result of the vulnerability and resilience were used to make predictions of countries that need a lot of attention on climate investments.

5. Result

5.1. Spatial Characteristics of the CNCRI

In this study, we assessed the CNCRI constructed from the different components of the five dimensions for climate resilience. We then examined the spatial distribution of the CNCRI scores across countries in SSA. The average score of CNCRI is 19.5, with a standard deviation of 9.6, a minimum value of 1.06 (least resilient), and a maximum value of 44.8 (most resilient). The CNC scores were classified using standard deviation into four (4) categories for visualization purposes (see Figure 3). The highest resilient index value (score 32.03–44.80) are small island countries such as Mauritius, Cape Verde, Seychelles, and South Africa. Regionally, moderately high resilient index values between 20.24 and 32.03 are countries located in Eastern (such as Ethiopia, Kenya, Rwanda, Zambia, Zimbabwe, Tanzania, and Uganda) and Southern Africa (such as Namibia, Botswana, and Swaziland). Other moderate resilient countries are Ghana and Senegal in the West and Cameroon, Sao tome and Principe, and Gabon in the Central region. The moderately low resilient score index score between 9.12 and 20.24 are countries predominately located in West Africa (such as Mauritania, Nigeria, Cote d’Ivoire, Benin, guinea, etc.). Moderately resilient score countries such as Congo in Central and Mozambique, Madagascar, and Malawi in the East as well as Lesotho in the South of Africa. The low resilience index score between 1.06 and 9.12 are countries beneath the Saharan desert, such as Mali, Niger, Chad, Central Africa Republic, and South Sudan. Countries such as Angola and Somalia are among the least resilient in the study area.
Decomposing CNCRI based on the five dimensions allows further exploration of geographic trends in the data (see Figure 4). The high values for social resilient scores are located in small island countries such as Mauritius, Seychelles, Sao tome and Principe and Cape Varved as well as Ghana, Namibia, Ghana, South Africa. The low values for the social resilient dimension are concentrated primarily in West Africa, with countries such as Chad, Sierra Leone, Niger, Mali, and Nigeria scoring less than 0 (negative). Other countries such as South Sudan, Somalia, Central Africa Republic are among the countries with low scores for the social resilience dimension.
The low resilience scores of the economic resilient dimension are Angola, DR, Congo, South Sudan, and Somalia, etc. Much of the least resilient scores are concentrated in West Africa (i.e., Niger, Nigeria, Mali, Chad, etc.) and Central Africa (i.e., Congo, Central Africa Republic, Rwanda, Burundi, Equatoria Guinea, etc.). Other low resilient areas are Eritrea, Lesotho, Zambia, and Swaziland. The high and moderate-high resilient scores of the economic resilient are Ethiopia, South Africa, Mauritius, Cape Verde, Kenya, Seychelles, Namibia, Mozambique, and Madagascar.
Countries with a highly resilient score of the infrastructure dimension are Seychelles, South Africa, Mauritius, Botswana, Cape Verde, and Gabon. Moderate high resilient countries are Ghana, Namibia, Cote d’Ivoire, Mauritania, Zambia, Rwanda, and Swaziland. The low resilient countries in terms of infrastructural dimension are mostly landlocked countries such as Niger, Chad, Central Africa Republic, Congo Republic, South Sudan, Madagascar, etc. Other vulnerable countries are Madagascar, Somalia, Liberia, Benin, and Eritrea.
Except for Mauritania, Djibouti, Eritrea (high resilient), and Kenya, Namibia, Botswana, Lesotho, Swaziland (moderately-high resilient), the rest of SSA is moderately low resilient and low resilient in terms of environmental dimension. Additionally, countries with the high resilient score of institution resilience dimension are Botswana, Mauritius, Seychelles, Cape Verde Namibia, Gambia, and Rwanda. The moderately-high resilient countries of the institution resilient dimension were South Africa, Lesotho, Swaziland, Ghana, Burkina Faso, Zambia, and Senegal. Most of the moderately-low resilient scores of the institutional dimension are concentrated in West and East Africa, while the low resilient countries are primarily concentrated in Central Africa.
Climatically, the CNCRI score indicates that most of the low resilient countries are located in the desert and semidesert zone in the tropical region of SSA. the moderately low and high resilient scores were dominated by countries in the grassland land zone in the tropical and subtropical regions. Countries such as Ghana and Gabon, located in the rainforest zone, and South Africa in the humid subtropical zone are the most resilient in many of the individual resilience dimensions. The top five highest resilient countries of the overall rank of the BNCRI index score are Mauritius (1), Seychelles (2), Cape Verde (3), South Africa (4), and Gabon (5). While the vulnerable countries of the CNCRI index score were Mali (44), Central African Republic (45), Chad (46), South Sudan (47) and Somalia (48) (see Table 3).

5.2. Vulnerability and Readiness Matrix Results

In this section, we used vulnerability and readiness to compare the resilience of countries in SSA in 2019. We employed the quadrant graph to determine the stages of performance of each country in SSA against the negative impacts of climate change. The vertical axis of the graph show vulnerability scores, and the horizontal axis indicates the scores of readiness (see Figure 5). The first quadrant indicates a country with a high level of vulnerability and high levels of readiness for climate change. These countries are Rwanda, Mauritius, Botswana and Sao Tome, and Principe. These countries are confronted with high levels of vulnerability to the negative impacts of climate change. Although adaptation needs may be great, the countries in the first quadrant have a high level of readiness to prepare and respond to climate hazards compared to countries in the second and the third quadrant. Additionally, these countries may be more likely to attract private sector investment in adaptation than countries with low readiness.
Except for the ten countries in the first, third, and fourth quadrant, the rest of the countries are concentrated in the second quadrant with different scores of high vulnerability and low readiness to climate change impacts. Countries at the extremes of the second quadrant, such as Niger, Chad, DR, Congo, Eritrea, Central Africa Republic, have great needs for climate finance and investment to implement effective preparedness and responce to climate disturbance. Hence these countries have great urgency for mitigation and adaptation actions. The third quadrant depicts countries with low vulnerability to the negative effects of climate change and low readiness to prepare and respond to relatively lower climate stresses. Countries such as South Africa, Lesotho, Ghana, Gambia, etc., may need lesser climate investment for adaptation measures compared to the first and the second quadrant. Lastly, the only country in the fourth quadrant in SSA is Cape Verde, with a low level of vulnerability to climate stresses and a relatively high level of readiness and may be well-positioned to implement innovative mitigation and adaptation measures for climate stresses.

6. Discussions

The CNCRI provides a baseline for inspecting the current status for inherent climate change resilience of countries in SSA. Even though there is no absolute threshold for high and low resilience for potential climate stresses, the CNCRI values could act as a reference point for countries to compare their respective rank with other bordering countries. The spatial pattern of the CNCRI scores indicate that the small island countries (Mauritius, Cape Verde, and Seychelles) and South Africa pose high climate resilience. Regionally, the moderate resilient scores of the CNCRI are concentrated primarily in East and South of Africa, while the West and Central Africa are dominated by the least resilient and vulnerable scores. Additionally, the spatial patterns of the individual resilience dimensions (i.e., Social, economic, environmental, infrastructure, and institution) follow almost similar patterns as the CNCRI scores. Furthermore, leaders and policymakers could use the CNCRI and the individual dimensions to improve and provide effective implantation to enhance mitigation and adaptation for potential climate-related disasters. For instance, countries that border along the Sahara Desert shows weaker social, infrastructure, and environmental resilience. Therefore, the CNCRI can be used to aid decision-making for governments, international organizations, donner countries by targeting those countries with certain types of mitigation and adaptation programs that could best enhance climate change resilience.
The values obtained from the CNCRI measurement of resilience reveal unexpected results. The small island countries of Mauritius, Seychelles, and Cape Verde were the most resilient to the negative effects of climate, this was a surprise because these countries are threatened by sea-level rise. In Cape Verde, for instance, the effects of sea-level rise are manifested in increased sea erosion and displacement of people to the inner parts of the island [67]. The possible sea level presents a major challenge for development because the reduction of coastlines could dramatically affect coastal areas where 80% of the population lives, the tourism sector, loss habitat, and biodiversity [68]. In Seychelles, climate change impacts such as sea level, extreme sea-surface temperatures, and coastal flooding are a direct threat to coastal livelihoods and the economy of the country [69].
It is important to note that the variables used to represent the institutional resilience dimension do not stem directly from currency amount but from the institutional knowledge and experience of implementing policies and programs to enhance climate change mitigation and adaptation. For instance, Botswana, Mauritius, and Cape Verde, with a high rate of government effectiveness, have more control over corruption, and with a high level of accountability to implement climate programs and policies, pose higher resilient to the impacts of climate change compared to Somalia, South Sudan, Central Africa Republic, and Burundi that are weak in controlling corruption, less accountable, and less efficient.
Moreover, this study explores the two key determinants of resilience: vulnerability and readiness to help compare adaptation measures needed to enhance climate change resilience of countries in SSA. The result of vulnerability and the readiness matrix sheds light on how many countries in SSA have higher levels of vulnerability to the impacts of climate change and need immediate investments in climate change mitigation and adaptation programs. The vulnerability and readiness matrix further affirm the notion that Africa is arguably the most vulnerable region in the world to the impacts of climate change [70,71]. The vulnerability and readiness matrix also shows that SSA needs to mobilize resources to address the region’s current limitations to deal with extreme events and potential climate disturbances [70,71]. It should be noted that climate finance for mitigation and adaptation measures has increased significantly over the years. However, the United Nations has estimated that the cost of climate adaptation is expected to rise beyond the region’s coping capacity even if warming is kept below 2 °C. The World bank projected that the cost of adaption would increase over time, from 10–13 billion USD annually between 2010 and 2019 to 23–24 billion USD annually between 2040 and 2049 in SSA. Additionally, the United Nations Environment Program estimated that the region needs to reach an adaptation finance of 50 billion USD per year by 2050 under the optimistic 2 degrees Celsius warming scenario. Even though there are many arguments about the financial estimates for SSA, the consensus is that the level of financing for countries in the region is nowhere near enough to meet demonstrated needs for adaptation and mitigation measures.
Our result from the CNCRI score is reasonable enough to approximate a conceptual view of resilience into a concrete representation of reality. However, as Cutter et al. argued in 2014, there are some divergences between the abstract concept of resilience and the resilience indicator structure, which manifested in the statical tests of intentional consistency. This is because indicators have many nuances, and it can be difficult to adequately measure them to represent resilience that manifests itself in so many different ways. Some of the difficulties we faced in this study are the availability of data for some of the countries in the study area and specify appropriate indicators for national-level climate resilience measurement. For instance, health, flood property, insurance coverage, etc. [34,35], are important indicators when measuring disaster resilience; however, most countries in SSA do not have national-level data on insurance coverage, thus, preventing us from including them in the composite indicator. However, such data may be more feasible to collect and use at a community or regional level within a single country. It is important to note that the CNCRI scores and vulnerability and readiness index provide a more realistic climate resilience assessment. However, resilience studies of SSA in the future should focus on a time-series approach that will help in analyzing the past, which comes in handy to forecast the future climate-related disasters. This could help to implement effective adaptation measures to prepare, respond and recover from potential climate damages.
The group of indicators that were used to construct and obtain the CNCRI scores for countries in SSA provide a realistic view of the abstract concept of resilience reasonably well. However, there are some limitations to the use of composite indicators. First, composite indicators lack transparency. Because composite indicators seek to reduce a distinct quality measure into a single summary variable, they can be misused to support a desired policy or provide misleading messages about quality if the process of constructing a composite indicator lacks statistical and conceptual principles or is poorly constructed [72]. Another limitation of a composite indicator is that the selection of metrics and weights can be challenged by others because the process of constructing composite indicators involves subjecting judgment [73]. Lastly, a composite indicator can provide a summary of a complex issue for decision-makers; however, it can also lead to simplistic or inappropriate policies conclusion if dimensions of performance that are difficult to analyze are ignored or if the process of constructing the metric is robust [74]. However, due to the limitations of data sources and other factors, we still choose the current indicator system for climate resilience assessment, which is a better choice at present. In future studies, we may expand a more rational index system to improve the quality of research.

7. Conclusions

In this study, we first define a set of 40 variable indicators that capture the five different dimensions of inherent climate resilience (social, economic, infrastructure, environment, and institution). We obtained a composite index score of country-level resilience using PCA and parallel analyses. The study found that Mauritius, Seychelles, Cape Verde, South Africa, and Gabon are the most resilient countries, whereas, Mali, Central Africa Republic, Chad, South Sudan and Somalia are the most vulnerable countries in SSA. Countries in the study area have distinct characteristics of climate resilience in the various dimensions; therefore, countries need to prioritize their policies to increase the overall resilience of climate hazards. For instance, countries that are more vulnerable on the infrastructure dimension should focus on improving roads, increasing the capacity for hospitals, and increasing access to sanitation, water, and electricity over other dimensions to combat climate hazards.
Secondly, the spatial pattern analysis of the CNCRI provides evidence that most countries in the West and Central regions are the least resilient and vulnerable to the negative impacts of climate change while the South of SSA is the most resilient. The spatial pattern was almost identical in the case of the five individual resilience dimensions. Our study reveals the relevance of the spatial analysis of climate resilience which has received less attention in previous studies when it comes to national level resilience to climate hazards. The spatial analysis of the CNCRI provides practical insights on how climate investment should be directed to improve the overall resilience of SSA to potential climate hazards. Therefore, policymakers, international organization, doner countries, and non-governmental organizations should focus their attention and resources towards the moderately least resilient (West and Central Africa) areas and improve the level of resilience in those areas.
Previous researchers used a matric base approach and different variables to represent resilience dimensions and to assess climate resilience at the community, country, and national levels. However, there is little justification on how to measure country vulnerability and readiness to determine their urgency for climate investment. This study overcomes this gap by assessing resilience determinants composed of vulnerability and readiness index to compare the Sub-Saharan African countries’ resilience to climate risks and their urgency for climate investment programs.
Finally, the resilience determinants composed of vulnerability and readiness provide additional evidence that most countries of SSA need urgent adaptation measures. The result of the study indicates that only Cape Verde in SSA has low vulnerability and high readiness; therefore, is the most resilient. Mauritius, Rwanda, Sao Tome and Principe, and Botswana have high vulnerability and high readiness. Gambia, Lesotho, Ghana and South Africa have low vulnerability and low readiness; however, they still need to increase adaption. The rest of the 36 countries in the second quadrant of SSA have high vulnerability and low readiness, making them the least resilient countries in the region. Therefore, Countries in the second quadrant such as Niger, Chad, DR. Congo, Eritrea, Centra Africa Republic require climate finance and investments to implement effective preparedness and respond to climate disturbances.
The spatial analysis of the CNCRI and the vulnerability and readiness index have a wider application for policymakers. The CNCRI could serve as an effective strategy and policy tool to invest resources equitably to reduce over resilience when distributing them equally among places. In addition, it can serve as a reference point to measure progress because it affords policymakers the prospect to monitor whether disbursement of funds and other resources to enhance resilience at a particular place has worked after recalculating the BNCRI score in the future. Overall, the CNCRI provides the government and the international community the opportunity towards a more effective policy approach to mitigate and adapt to climate hazards and improve resilience.

Author Contributions

Conceptualization, D.S. and Y.W.; methods, D.S.; data curation, D.S; writing-review and editing, D.S.; supervision, Y.W.; validation, Y.J., All authors have read and agreed to the published version of the manuscript.

Funding

This research was funded by the National Natural Science Foundation (NSF) of China, grant number: No. 41971202.

Data Availability Statement

Data available in a publicly accessible repository that does not issue DOIs. Publicly available datasets were analyzed in this study. This data can be found here:
  • Data codes and links of the indicators used for the CNCRI construction.
Resilience DimensionsConceptCodeLink

Social
Educational attainmentSE.ADT.LITR.ZShttps://databank.worldbank.org/metadataglossary/world-development-indicators/series/SE.ADT.LITR.ZS
Pre-marital ageSP.POP.65UP.TO.ZShttps://databank.worldbank.org/metadataglossary/world-development-indicators/series/SP.POP.65UP.TO.ZS
Improved nutritionSN.ITK.DEFC.ZShttps://databank.worldbank.org/metadataglossary/world-development-indicators/series/SN.ITK.DEFC.ZS
Physician’s accessSH.MED.PHYS.ZShttps://databank.worldbank.org/metadataglossary/world-development-indicators/series/SH.MED.PHYS.ZS
Nurse and midwifery accessSH.MED.NUMWhttps://data.worldbank.org/indicator/SH.MED.NUMW.P3
Telephone services accessIT.MLT.MAIN.P2https://databank.worldbank.org/metadataglossary/world-development-indicators/series/IT.MLT.MAIN.P2
Infant mortality SH.DYN.MORThttps://databank.worldbank.org/metadataglossary/world-development-indicators/series/SH.DYN.MORT

Economic
Employment rateSL.TLF.TOTL.INhttps://data.worldbank.org/indicator/SL.TLF.TOTL.IN
PovertySI_POV_DAY1https://www.who.int/data/gho/data/indicators/indicator-details/GHO/proportion-of-population-below-the-international-poverty-line-of-us$1-90-per-day-(-)
Gross Domestic Product (GDP)NY.GDP.PCAP.KD.ZGhttps://databank.worldbank.org/metadataglossary/world-development-indicators/series/NY.GDP.PCAP.KD.ZG
Assistance and AidDT.ODA.ALLD.CDhttps://databank.worldbank.org/metadataglossary/world-development-indicators/series/DT.ODA.ALLD.CD
Access to banking servicesFB.CBK.BRCH.P5https://data.worldbank.org/indicator/FB.CBK.BRCH.P5
Skilled labor forceSL.TLF.ADVN.ZShttps://data.worldbank.org/indicator/SL.TLF.ADVN.ZS


Environment
ForestAG.LND.FRST.ZShttps://databank.worldbank.org/metadataglossary/world-development-indicators/series/AG.LND.FRST.ZS
Efficient energyEG.FEC.RNEW.ZShttps://databank.worldbank.org/metadataglossary/world-development-indicators/series/EG.FEC.RNEW.ZS
CO2 emissionEN.ATM.CO2E.PChttps://databank.worldbank.org/metadataglossary/world-development-indicators/series/EN.ATM.CO2E.PC
PrecipitationAG.LND.PRCP.MMhttps://databank.worldbank.org/metadataglossary/world-development-indicators/series/AG.LND.PRCP.MM
ConservationER.LND.PTLD.ZShttps://databank.worldbank.org/metadataglossary/world-development-indicators/series/ER.PTD.TOTL.ZS
Land elevationAG.LND.EL5M.ZShttps://databank.worldbank.org/metadataglossary/world-development-indicators/series/AG.LND.EL5M.ZS

Infrastructure
Water accessSH.H2O.SMDW.ZShttps://databank.worldbank.org/metadataglossary/world-development-indicators/series/SH.H2O.SMDW.ZS
Sanitation accessSH.STA.SMSS. ZShttps://databank.worldbank.org/metadataglossary/world-development-indicators/series/SH.STA.SMSS.ZS
Electricity access1.1_ACCESS.ELECTRICITY.TOThttps://databank.worldbank.org/metadataglossary/sustainable-energy-for-all/series/1.1_ACCESS.ELECTRICITY.TOT
Fuel accessEG.CFT.ACCS.ZShttps://databank.worldbank.org/metadataglossary/world-development-indicators/series/EG.CFT.ACCS.ZS
Information accessIT.NET.USER.ZShttps://data.worldbank.org/indicator/IT.NET.USER.ZS
Hospital bed https://apps.who.int/gho/data/view.main.HS07v

Institution
Government effectiveness
http://info.worldbank.org/governance/wgi/
https://dataportal.opendataforafrica.org/data/#topic=Governance
Political stability
Control of corruption
Accountability
The data for vulnerability and readiness metric can be found here https://gain.nd.edu/assets/437409/resources.zip

Conflicts of Interest

The authors declare no conflict of interest.

References

  1. Magadza, C.H.D. Climate change impacts and human settlements in Africa: Prospects for adaptation. Environ. Monit. Assess. 2000, 61, 193–205. [Google Scholar] [CrossRef]
  2. Fellmann, T. The assessment of climate change-related vulnerability in the agricultural sector: Reviewing conceptual frameworks. Build. Resil. Adapt. Clim. Chang. Agric. Sect. 2012, 23, 37–62. [Google Scholar]
  3. Toulmin, C. Climate change in Africa. Clim. Chang. Africa 2009. [Google Scholar] [CrossRef]
  4. Yang, J.; Ren, J.; Sun, D.; Xiao, X.; Xia, J.C.; Jin, C.; Li, X. Understanding land surface temperature impact factors based on local climate zones. Sustain. Cities Soc. 2021, 69, 102818. [Google Scholar] [CrossRef]
  5. United Nations Environmental Program. Africa’ s Adaptation Gap; United Nations Environmental Program: Nairobi, Kenya, 2012; pp. 1–58. [Google Scholar]
  6. Niang, I.; Ruppel, O.C.; Abdrabo, M.A.; Essel, A.; Lennard, C.; Padgham, J.; Urquhart, P. Climate Change 2014: Impacts, Adaptation and Vulnerability: Part B: Regional Aspects: Working Group II Contribution to the Fifth Assessment Report of the Intergovernmental Panel on Climate Change; Cambridge University Press: Cambridge, UK, 2015; pp. 1199–1266. [Google Scholar] [CrossRef]
  7. Food and Agriculture Organization. The Sudan 2020 Flood Impact Rapid Assessment; FAO: Rome, Italy, 2020. [Google Scholar]
  8. Food and Agriculture Organization. El Nino Response Plan; FAO: Rome, Italy, 2016; pp. 0–21. [Google Scholar]
  9. Ehiakpor, D.S.; Danso-Abbeam, G.; Baah, J.E.; Yildiz, F.; Hutchins, A.; Tamargo, A.; Bailey, C.; Kim, Y.; Fosu-Mensah, B.Y.; Vlek, P.L.G.; et al. Assessment of Climate Change Impacts on Cocoa Production and Approaches to Adaptation and Mitigation: A Contextual View of Ghana and Costa Rica. Environ. Dev. Sustain. 2016, 14, 1210557. [Google Scholar]
  10. Serdeczny, O.; Adams, S.; Baarsch, F.; Coumou, D.; Reinhardt, J. Climate change impacts in Sub-Saharan Africa: From physical changes to their social repercussions. Regional Environmental Change. 2017, 17, 1585–1600. [Google Scholar] [CrossRef]
  11. Charrua, A.B.; Padmanaban, R.; Cabral, P.; Bandeira, S.; Romeiras, M.M. Impacts of the tropical cyclone idai in mozambique: A multi-temporal landsat satellite imagery analysis. Remote Sens. 2021, 13, 201. [Google Scholar] [CrossRef]
  12. Sako, S.; Ogiogio, G. Africa: Major Development Challenges & their Capacity Building Dimension; African Capacity Building Foundation: Harare, Zimbabwe, 2002. [Google Scholar]
  13. Folke, C.; Carpenter, S.R.; Walker, B.; Scheffer, M.; Chapin, T.; Rockström, J. Resilience thinking: Integrating resilience, adaptability and transformability. Ecol. Soc. 2010, 15, 20. [Google Scholar] [CrossRef]
  14. Davoudi, S.; Brooks, E.; Mehmood, A. Evolutionary Resilience and Strategies for Climate Adaptation. Plan. Pract. Res. 2013, 28, 37–41. [Google Scholar] [CrossRef] [Green Version]
  15. Peake, S.; Ekins, P. Exploring the financial and investment implications of the Paris Agreement. Clim. Policy 2017, 17, 832–852. [Google Scholar] [CrossRef]
  16. Guidotti, R.; Chmielewski, H.; Unnikrishnan, V.; Gardoni, P.; McAllister, T.; van de Lindt, J. Modeling the resilience of critical infrastructure: The role of network dependencies. Sustain. Resilient Infrastruct. 2016, 1, 153–168. [Google Scholar] [CrossRef] [PubMed]
  17. Bedi, N.; Bishop, M.; Hawkins, U.; Miller, O.; Pedraza, R.; Preble, A.; Rico-Rairan, A. Linking Resilience and Good Governance: A Literature Review. Anthos 2014, 6, 15–49. [Google Scholar] [CrossRef] [Green Version]
  18. Nguyen, H.L.; Akerkar, R. Modelling, measuring, and visualising community resilience: A systematic review. Sustainability 2020, 12, 7896. [Google Scholar] [CrossRef]
  19. Spaans, M.; Waterhout, B. Building up resilience in cities worldwide—Rotterdam as participant in the 100 Resilient Cities Programme. Cities 2017, 61, 109–116. [Google Scholar] [CrossRef] [Green Version]
  20. Marchese, D.; Reynolds, E.; Bates, M.E.; Morgan, H.; Clark, S.S.; Linkov, I. Resilience and sustainability: Similarities and differences in environmental management applications. Sci. Total Environ. 2018, 613–614, 1275–1283. [Google Scholar] [CrossRef]
  21. Denton, F.; Wilbanks, T.J.; Abeysinghe, A.C.; Burton, I.; Gao, Q.; Lemos, M.C.; Masui, T.; O’Brien, K.L.; Warner, K.; Bhadwal, S.; et al. Climate-Resilient Pathways: Adaptation, Mitigation, and Sustainable Development; Cambridge University Press: Cambridge, UK, 2015; pp. 1101–1131. [Google Scholar] [CrossRef] [Green Version]
  22. Windle, G.; Bennett, K.M.; Noyes, J. A methodological review of resilience measurement scales. Health Qual. Life Outcomes 2011, 9, 8. [Google Scholar] [CrossRef] [Green Version]
  23. Miles, S.B.; Chang, S.E. Resil US: A community based disaster resilience model. Cartogr. Geogr. Inf. Sci. 2011, 38, 36–51. [Google Scholar] [CrossRef]
  24. Organisation for Economic Co-operation and Development. Guidelines for Resilience Systems Analysis—How to Analyse Risk and Build a Roadmap to Resilience; OECD: Paris, France, 2014; p. 47. [Google Scholar]
  25. Khan, F.M.; Gupta, R. ARIMA and NAR based prediction model for time series analysis of COVID-19 cases in India. J. Saf. Sci. Resil. 2020, 1, 12–18. [Google Scholar] [CrossRef]
  26. Egli, F.; Stünzi, A. A dynamic climate finance allocation mechanism reflecting the Paris Agreement. Environ. Res. Lett. 2019, 14, 114024. [Google Scholar] [CrossRef]
  27. Hof, A.F.; Den Elzen, M.G.J.; Vuuren, D.P. Van Including adaptation costs and climate change damages in evaluating post-2012 burden-sharing regimes. Mitig. Adapt. Strateg. Glob. Chang. 2012, 15, 19–40. [Google Scholar] [CrossRef]
  28. Agrawala, S.; Bosello, F.; Carraro, C.; De Bruin, K.; De Cian, E.; Dellink, R.O.B.; Lanzi, E. Plan or React? Analysis of Adaptation Costs and Benefits Using Integrated Assessment Models. Clim. Chang. Econ. 2011, 2, 175–208. [Google Scholar] [CrossRef] [Green Version]
  29. Girvetz, E.; Ramirez-villegas, J.; Claessens, L.; Lamanna, C.; Navarro-racines, C.; Nowak, A.; Thornton, P.; Rosenstock, T.S. Future Climate Projections in Africa: Where Are We Headed? Springer: Berlin/Heidelberg, Germany, 2019; pp. 15–27. [Google Scholar] [CrossRef] [Green Version]
  30. Inter-American Development Bank. A Framework and Principles for Climate Resilience Metrics in Financing Operations; Inter-American Development Bank: Washington, DC, USA, 2019; pp. 1–41. [Google Scholar]
  31. The United Nations Framework Convention on Climate Change (UNFCCC). Physical and Socio-Economic Trends in Climate-Related Risks and Extreme Events, and Their Implications for Sustainable Development; UNFCCC: New York, NY, USA, 2008; pp. 3–53. [Google Scholar]
  32. Fussel, H.M. Vulnerability in Climate Change Research: A Comprehensive Conceptual Framework; University of California: Los Angeles, CA, USA, 2005. [Google Scholar]
  33. Bahadur, A. RESILIENCE MEASUREMENT FRAMEWORKS AND APPROACHES: A Bird’ s Eye View; Overseas Development Institute: London, UK, 2017. [Google Scholar] [CrossRef]
  34. Rifat, S.A.A.; Liu, W. Measuring Community Disaster Resilience in the Conterminous Coastal United States. ISPRS Int. J. Geo-Inf. 2020, 9, 469. [Google Scholar] [CrossRef]
  35. Cutter, S.L.; Ash, K.D.; Emrich, C.T. The geographies of community disaster resilience. Glob. Environ. Chang. 2014, 29, 65–77. [Google Scholar] [CrossRef]
  36. Lam, N.S.N.; Reams, M.; Li, K.; Li, C.; Mata, L.P. Measuring Community Resilience to Coastal Hazards along the Northern Gulf of Measuring Community Resilience to Coastal Hazards along the Northern Gulf of Mexico. Nat. Hazards Rev. 2015, 17, 04015013. [Google Scholar] [CrossRef] [Green Version]
  37. Luthar, S.S.; Cicchetti, D.; Becker, B. The Construct of Resilience: A Critical Evaluation and Guidelines for Future Work. NIH Public Access 2000, 71, 543–562. [Google Scholar] [CrossRef]
  38. Gunderson, L.H.; Holling, C. Resilience and adaptive cycles. In Panarchy: Understanding Transformations in Human and Natural Systems; Island Press: Washington, DC, USA, 2002; pp. 25–62. [Google Scholar]
  39. Holling, C.S. Engineering resilience versus ecological resilience. In Engineering Within Ecological Constraints; National Academies Press: Washington, DC, USA, 1996; pp. 31–43. [Google Scholar]
  40. Fleming, J.; Ledogar, R.J. Resilience, an Evolving Concept: A Review of Literature Relevant to Aboriginal Research. Pimatisiwin 2008, 6, 7–23. [Google Scholar]
  41. United Nations Office for Disaster Risk Reduction. Terminology on Disasters. In Handbook of Rural Aging; Taylor & Francis: Abingdon, UK, 2009; pp. 111–115. [Google Scholar] [CrossRef]
  42. Eckstein, D.; Künzel, V.; Schäfer, L. Global Climate Risk Index 2021; Germanwatch, e.V.: Berlin, Germany, 2021; p. 52. [Google Scholar]
  43. Chen, C.; Noble, I.; Hellmann, J.; Coffee, J.; Murillo, M.; Chawla, N. University of Notre Dame Global Adaptation Index: Country Index Technical Report; University of Notre Dame: Notre Dame, IN, USA, 2015; p. 46. [Google Scholar]
  44. Yang, J.; Wang, Y.; Xiu, C.; Xiao, X.; Xia, J.; Jin, C. Optimizing local climate zones to mitigate urban heat island effect in human settlements. J. Clean. Prod. 2020, 275, 123767. [Google Scholar] [CrossRef]
  45. Yang, J.; Wang, Y.; Xue, B.; Li, Y.; Xiao, X.; Cecilia, J.; He, B. Contribution of urban ventilation to the thermal environment and urban energy demand: Different climate background perspectives. Sci. Total Environ. 2021, 795, 148791. [Google Scholar] [CrossRef] [PubMed]
  46. Gómez-Limón, J.A.; Arriaza, M.; Guerrero-Baena, M.D. Building a composite indicator to measure environmental sustainability using alternative weighting methods. Sustainability 2020, 12, 4398. [Google Scholar] [CrossRef]
  47. Razafindrabe, B.H.N.; Parvin, G.A.; Surjan, A.; Takeuchi, Y.; Shaw, R. Climate Disaster Resilience: Focus on Coastal Urban Cities in Asia. Asian J. Environ. Disaster Manag. 2009, 1, 101. [Google Scholar] [CrossRef]
  48. Irajifar, L.; Alizadeh, T.; Sipe, N. Disaster resiliency measurement frameworks State of the art. In Proceedings of the 19th International CIB World Building Congress, Brisbane, Australia, 5–9 May 2013. [Google Scholar]
  49. Conzato, F. Measuring Resilience in the context of Sustainable Development. In Power from Statistics: Data, Information and Knowledge; Eurostat: Luxembourg, 2016; pp. 1–4. [Google Scholar]
  50. Chandra, A.; Acosta, J.; Stern, S.; Uscher-Pines, L.; Williams, M.V.; Yeung, D.; Garnett, J.; Meredith, L.S. Building Community Resilience to Disasters; RAND Corporation: Santa Monica, CA, USA, 2011; ISBN 9780833051950. [Google Scholar]
  51. Sutter, D.; Simmons, K.M. Tornado fatalities and mobile homes in the United States. Nat. Hazards 2010, 53, 125–137. [Google Scholar] [CrossRef]
  52. Department for Environmental Food & Rural Affairs. Sustainable Development Indicators; Office for National Statistics: London, UK, 2013; pp. 312–334. [Google Scholar]
  53. Opršal, Z.; Harmáček, J. Is foreign aid responsive to environmental needs and performance of developing countries? Case study of the Czech Republic. Sustainability 2019, 11, 401. [Google Scholar] [CrossRef] [Green Version]
  54. World Bank Financial Access. Measuring Access to Financial Services Around the World; World Bank Financial Access: Washington, DC, USA, 2009; pp. 3–300. [Google Scholar]
  55. Keese, M.; Tan, J.-P. Indicators of skills for employment and productivity: A conceptual framework and approach for low-income countries. In A Report for the Human Resource Development Pillar of the G20 Multi Action Plan on Development; OCDE: Paris, France, 2013; p. 33. [Google Scholar]
  56. Smith, R. The Role of Institutions in Building Frameworks to Measure Sustainable Development: The Canadian Experience". In Measuring Sustainable Development: Integrated Economic, Environmental and Social Frameworks; OECD: Paris, France, 2004; pp. 21–27. [Google Scholar] [CrossRef]
  57. Molyneaux, L.; Brown, C.; Wagner, L.; Foster, J. Measuring resilience in energy systems: Insights from a range of disciplines. Renew. Sustain. Energy Rev. 2016, 59, 1068–1079. [Google Scholar] [CrossRef] [Green Version]
  58. Schaefer, M.; Thinh, N.X.; Greiving, S. How can climate resilience be measured and visualized? Assessing a vague concept using GIS-Based fuzzy logic. Sustainability 2020, 12, 635. [Google Scholar] [CrossRef] [Green Version]
  59. Burger, J.; Gochfeld, M.; Jeitner, C.; Pittfield, T.; Donio, M. Trusted information sources used during and after superstorm sandy: TV and radio were used more often than social media. J. Toxicol. Environ. Health 2013, 76, 1138–1150. [Google Scholar] [CrossRef] [PubMed] [Green Version]
  60. Jan, K. The Resilience of Economic Growth to Political Risk: A Case Study of Pakistan. Rev. Geintec-Gest. Inov. Tecnol. 2021, 11, 1440–1450. [Google Scholar] [CrossRef]
  61. Lewis, J. Social impacts of corruption upon community resilience and poverty. Jàmbá J. Disaster Risk Stud. 2017, 9, 391. [Google Scholar] [CrossRef] [PubMed]
  62. Montero, A.G.; Le Blanc, D. Resilient Institutions in Times of Crisis: Transparency, Accountability and Participation at the National Level Key to Effective Response to COVID-19; United Nations: San Francisco, CA, USA, 2020; pp. 1–4. [Google Scholar]
  63. El-Zoghbi, M.; Chehade, N.; McConaghy, P.; Soursourian, M. The Role of Financial Services in Humanitarian Crises. Role Financ. Serv. Humanit. Cris. 2017. [Google Scholar] [CrossRef]
  64. Assar, M. Sanitation in natural disasters. WHO Chron. 1971, 25, 402–409. [Google Scholar]
  65. Pan American Health Organization. The Challenge in Disaster Reduction for the Water and Sanitation Sector: Improving Quality of Life by Reducing Vulnerabilities; Pan American Health Organization: Washington, DC, USA, 2006; p. 49. [Google Scholar]
  66. Flores, A.; Peralta, L. The Enhancement of Resilience to Disasters and Climate Change in the Caribbean through the Modernization of the Energy Sector; Economic Commission for Latin America and the Caribbean: Santiago, Chile, 2020. [Google Scholar]
  67. Zazo, C.; Goy, J.L.; Hillaire-Marcel, C.; Dabrio, C.J.; González-Delgado, J.A.; Cabero, A.; Bardají, T.; Ghaleb, B.; Soler, V. Sea level changes during the last and present interglacials in Sal Island (Cape Verde archipelago). Glob. Planet. Chang. 2010, 72, 302–317. [Google Scholar] [CrossRef] [Green Version]
  68. Government of Cabo Verde. Ministry of Environment and Agriculture National Meteorology and Geophysics Institute National Adaptation Programme of Action on Climate Change; Government of Cabo Verde: Cabo Verde, Africa, 2007; pp. 1–40. [Google Scholar]
  69. World Bank. Ministry of Environment Energy and Climate Change Seychelles Coastal Management Plan 2019–2024; World Bank: Washington, DC, USA, 2019. [Google Scholar]
  70. Watson, C.; Schalatek, L. Climate Finance Regional Briefing: Sub-Saharan Africa; Climate Fund Update: Heinrich Böll Stiftung, Germany; Washington, DC, USA, 2021. [Google Scholar]
  71. African Development Bank. The Cost of Adaptation to Climate Change in Africa; African Development Bank: Abidjan, Côte d’Ivoire, 2011; pp. 21–36. [Google Scholar]
  72. Barclay, M.; Dixon-woods, M.; Lyratzopoulos, G. The problem with composite indicators. BMJ Qual. Saf. 2019, 28, 338–344. [Google Scholar] [CrossRef] [PubMed] [Green Version]
  73. Profit, J.; Typpo, K.V.; Hysong, S.J.; Woodard, L.D.; Kallen, M.A. Improving benchmarking by using an explicit framework for the development of composite indicators: An example using pediatric quality of care. Implement. Sci. 2010, 5, 1–10. [Google Scholar] [CrossRef] [PubMed] [Green Version]
  74. Dialga, I.; Thi, L.; Giang, H. Highlighting Methodological Limitations in the Steps of Composite Indicators Construction. Soc. Indic. Res. 2017, 131, 441–465. [Google Scholar] [CrossRef]
Figure 1. The graphical representation of the climate resilience framework of the study.
Land 10 01205 g001
Figure 2. Map of the study area.
Land 10 01205 g002
Figure 3. Spatial characteristic of composite national climate resilience index (CNCRI) scores of SSA.
Land 10 01205 g003
Figure 4. Resilience scores for five-dimension categories of SSA: (a) social, (b) economic, (c) infrastructure, (d) environment and (e) institution. Result classified into low, moderately low, moderately high, and high resilient.
Land 10 01205 g004
Figure 5. Comparisons of countries in SSA vulnerability and readiness to climate risks: (a) high vulnerability and high readiness, (b) high vulnerability and low readiness, (c) low vulnerability and low readiness, and (d) low vulnerability and high readiness.
Land 10 01205 g005
Table 1. Description and justification of resilience variables.
Resilience Dimensions ConceptVariable DescriptionJustification

Social
Educational attainment% Population of 15 and above with educationRifat and Liu 2020 [34]
Pre-marital age% Population below 65 years of ageRifat and Liu 2020 [34]
Improved nutrition% Population with a prevalence of undernourishmentConzato 2016 [49]
Physician’s accessphysicians per 10,000 personsChandra et al., 2011 [50]
Nurse and midwifery access% Population of birth attended by skilled health personnelChandra et al., 2011 [50]
Telephone services accessMain telephone lines per 1000 residentsSutter and Simmons 2010 [51]
Infant mortality Mortality rate under 5 years of age per 1000 live birth


Economic
Employment rate% Labor force employedRifat and Liu 2020 [34]
Poverty% Population living below the international poverty line of US$ 1.90 per dayMieila and Toplicianu 2013 [52]
Gross Domestic Product (GDP)% Annual GDP per capita growth
Assistance and AidNet official development assistance and official aid received (current US$)Opršal and Harmáccaron;ek 2019 [53]
Access to banking servicesNumber of banking institutions (commercial banks, savings institutions, and credit unions) per 10,000 residentsWorld Bank 2009 [54]
Skilled labor force% Labor force with advanced education of total working-age population with advanced educationKeese and Tan 2013 [55]


Environment
Forest% Forest as of total land areaSmith 2004 [56]
Efficient energy% Renewable energy consumption of total final energy consumptionMolyneaux et al., 2016 [57]
CO2 emissionPer capita CO2 emissions (metric tons)Mieila and Toplicianu 2013 [52]
PrecipitationAverage precipitation in depth (mm per year)Schaefer, Thinh, and Greiving 2020 [58]
Conservation% Terrestrial and marine protected areas of the total landMieila and Toplicianu 2013 [52]
Land elevation% Land area where elevation is below 5 m of the total landCutter, Ash, and Emrich 2014 [35]

Infrastructure
Water access% Population access to safe waterMieila and Toplicianu 2013 [52]
Sanitation access% Population access to sanitationMieila and Toplicianu 2013 [52]
Electricity access% Population access to electricity
Fuel access% Population with primary reliance on clean fuels and technologyMieila and Toplicianu 2013 [52]
Information access% Population using internet serviceBurger et al., 2013 [59]
Hospital bedHospital bed per 1000 personsRifat and Liu 2020 [34]

Institution
Government effectiveness% Rank among countries government effectiveness (ranges from 0-lowest to 100-highest rank)Chen et al., 2015 [43]
Political stability% Rank among countries political stability and absence of violence rank (0-lowest and 100-highest)Jan 2021 [60]
Control of corruption% Rank among countries control of corruption (0-lowest and 100-highest)Lewis 2017 [61]
Accountability% Rank among countries government accountability (ranges from 0-lowest to 100-highest rank)United Nations 2020 [62]
Table 2. Principal component analysis results of KMO and Bartlett’s test for indicators within each resilience category.
DimensionsNumber of Indicators KMO Test of Sampling AdequacyBartlett’s Test of Significance
Social60.8280.000
Economical60.7610.000
Environmental60.5900.000
Infrastructural60.8600.000
Institutional50.7910.000
Table 3. The rank of countries in Sub-Saharan Africa (SSA) with five highest and lowest resilience scores.
Overall RankCountry
Social
Score
Economic
Score
Infrastructure
Score
Environment
Score
Institution
Score
CNCRI
Score (%)
High resilient
1Mauritius89.543.134.031.728.444.8
2Seychelles83.432.138.234.126.542.3
3Cape Verde72.937.545.010.427.438.0
4South Africa40.830.854.525.321.233.9
5Gabon50.810.847.030.724.132.0
Low resilient
44Mali−5.86.721.112.810.58.1
45Central African Republic−11.04.317.423.75.67.1
46Chad−13.35.813.317.58.15.3
47South Sudan−11.0−10.611.919.11.21.2
48Somalia−10.1−2.614.13.85.11.1
Publisher’s Note: MDPI stays neutral with regard to jurisdictional claims in published maps and institutional affiliations.

