Article

Addressing Peatland Rewetting in Russian Federation Climate Reporting

1
Institute of Forest Science, Russian Academy of Sciences, Uspenskoye, 143030 Moscow Region, Russia
2
Yu. A. Izrael Institute of Global Climate and Ecology, 20B Glebovskaya Str., 107258 Moscow, Russia
3
Department of Applied Mathematics and Computer Modelling, National University of Oil and Gas «Gubkin University», 65 Leninsky Prospekt, 119991 Moscow, Russia
4
Institute of Botany and Landscape Ecology, Greifswald University, Partner in the Greifswald Mire Centre, Soldmannstrasse 15, D-17487 Greifswald, Germany
*
Author to whom correspondence should be addressed.
Land 2021, 10(11), 1200; https://doi.org/10.3390/land10111200
Submission received: 30 September 2021 / Revised: 28 October 2021 / Accepted: 2 November 2021 / Published: 6 November 2021
(This article belongs to the Special Issue Peatland Ecosystem)

Abstract

:
Rewetting is the most effective way to reduce greenhouse gas (GHG) emissions from drained peatlands and must significantly contribute to the implementation of the Paris Agreement on Climate within the land sector. In 2010–2013, more than 73 thousand hectares of fire-prone peatlands were rewetted in the Moscow Region (the hitherto largest rewetting program in the Northern Hemisphere). As the Russian Federation has no national accounting of rewetted areas yet, this paper presents an approach to detect them based on multispectral satellite data verified by ground truthing. We propose that effectively rewetted areas should minimally include areas with wet grasslands and those covered with water (cf. the IPCC categories “rewetted organic soils” and “flooded lands”). In 2020, these lands amounted in Moscow Region to more than 5.3 and 3.6 thousand hectares, respectively. Assuming that most rewetted areas were former peat extraction sites and using IPCC default GHG emission factors, an overall GHG emission reduction of over 36,000 tCO2-eq year−1 was calculated. We furthermore considered the uncertainty of calculations. With the example of a 1535 ha large rewetted peatland, we illustrate the estimation of GHG emission reductions for the period up to 2050. The approach presented can be used to estimate GHG emission reductions by peatland rewetting on the national, regional, and object level.

1. Introduction

Occupying merely 0.4% of the global land surface, drained peatlands emit ~2 Gt of carbon dioxide (CO2) as a result of microbial oxidation of peat and peat fires, which account for ~5% of all anthropogenic greenhouse gas (GHG) emissions [1]. These emissions constitute more than a quarter of the GHG emissions associated with Agriculture, Forestry, and Land Use (AFOLU) [2]. After peatlands are drained, intense methane (CH4) emission may occur from the drainage network and in small amounts after rains or snowmelt also from the intercanal spaces, and also nitrous oxide (N2O) emission as well as dissolved organic matter (DOC) export with runoff water [3,4].
Drained peatlands, especially when unused and abandoned, are extremely fire- prone [5], because of the abundance of combustible material per unit area [6,7], and susceptibility to fire increases with the intensity of drainage [8].
As a result of progressive anthropogenic drainage, the planet’s peatlands have since 1960 changed from a net global sink to a net source of GHGs. Without action, GHG emissions from drained peatlands are projected by 2100 to consume 12–41% of the remaining GHG budget to keep global warming below +1.5–+2 °C [9]. This illustrates the hitherto underexposed importance of drained peatlands for the implementation of the Paris Climate Agreement. The relevance of reporting and accounting for anthropogenic emissions from peatlands and wetlands directed the development of the 2013 Supplement to the 2016 Guidelines for National Greenhouse Gas Inventories: Wetlands [10].
The most effective way to reduce GHG emissions from drained peatlands is their rewetting [11]. The IPCC Special Report “Climate Change and Land” [12] notes that peatland restoration targets the most carbon-rich lands and thus involves less area and less impact on land-use when considering climate change mitigation and adaptation measures. Peatland restoration, for example, requires three times less nitrogen compared to storing a similar amount of carbon in mineral soils [11]. Restoring peatlands through rewetting may significantly reduce GHG emissions [13], even in the case of increased CH4 emissions [14], reduce peat fires [15,16], and help restore biodiversity [17], hydrological [18] and other peatland ecosystem functions [19]. However, when summarizing the various mitigation options, IPCC [12] attributed only medium confidence to peatland restoration, likely due to a lack of scientifically validated data on the effectiveness of peatland rewetting.
Russia has the largest extent of peatlands worldwide [20]. Peatlands occupy more than 8% and together with shallow peatlands (peat < 30 cm) more than 20% of the Russian territory [21,22]. Most peatlands are preserved in their natural state, but more than eight million hectares have been drained for agriculture, forestry and peat extraction [23]. Drained peatlands are mainly located in the European part of the country [24,25,26], in the south of Western Siberia and in the Far East [23]. Peat extraction has been the main driver of peatland drainage and degradation, especially milled peat extraction with intensive drainage, which is the dominant industrial method in Russia and many other countries. Peat mining has affected 0.85–1.5 [23] or 0.9 million hectares [27] of peatlands, 70% of which is attributable to milled peat extraction.
In the Soviet Union, cutover peatlands were normally recultivated for agriculture, less often for other purposes. However, after the decline of the peat industry in the early 1990s an increasing area of predrained and partially excavated areas was abandoned and no longer recultivated [5,23]. As of 1 January 2000, the area listed under peat extraction in Russia was 242.3 thousand ha [28]. The National Cadastre of Anthropogenic Sources and Sinks of Greenhouse Gases [29] reported that from 2000 to 2007 this area had decreased from 261 to 219 thousand ha. However, due to the complex accounting of drained peatlands in the national economy [28], these data are approximate. The reported areas are probably predominantly milling sites and include all sites that IPCC [10,30,31] attributes to peat extraction, i.e., prepared (increasingly less due to the reduced opening of new deposits), under extraction, and abandoned after partial extraction without reclamation. Abandoned milling fields revegetate with difficultly and may stay bare for years, which makes them easily identifiable from satellite imagery [16,32].
These milled peat extraction fields lose, depending on the hydrometeorological conditions, 1.6–4.7 tC ha−1 year−1 by microbial oxidation (irrespective of water and wind erosion). This means that the volume of peat mineralized in 10 years is comparable to the annual volume of peat extracted in industrial mining [33]. The amount of organic matter available for microbial oxidation to CO2 is limited to the peat layers above the groundwater table and emissions may decrease over time, if the surface of the peatland subsides. According to some estimates, Russia is, after Indonesia and the European Union, the World’s largest GHG emitter from drained peatlands [34,35]. At the same time, the significant areas of drained and abandoned peatlands represent a serious potential for reducing greenhouse gas emissions, in addition to the urgent tasks of reducing fire risk and enhancing climate change adaptation capacity by improving environmental safety.
As in many other countries, peatland rewetting in Russia was initiated by environmental NGOs, specially protected areas and other stakeholders and aimed at restoring peatland related biodiversity [23,24]. According to the Water Code of the Russian Federation (2006) [36] peatlands are “water bodies”, which after peat extraction should be rehabilitated primarily through rewetting (article 52 WC). After severe peat fires in central European Russia in 2002 and especially in 2010, the prevention of peat fires became the main driver for rewetting [5]. In 2010–2013, more than 73,000 ha of fire-prone peatlands, i.e., a significant part of the peatlands in that region [37], were rewetted in the Moscow Region (Figure 1), which was at that time the most extensive peatland rewetting initiative in the Northern Hemisphere.
Long-term monitoring showed that the main goal of rewetting, the reduction in the number and extent of peat fires, has been achieved [16]. However, it is also important to estimate the GHG emission changes resulting from rewetting. As official statistics on rewetted peatlands in Russia are lacking, it is, first of all, necessary to determine the areas that are rewetted to be included in the national greenhouse gas reporting of the Russian Federation to the UNFCCC [38]. The purpose of this paper is to present such methodology and, using the example of rewetted areas in Moscow Region, assess the associated greenhouse gas emission reduction using emission factors proposed by the IPCC [10,30,31]. In addition, using the example of one peatland site, we show the applicability of this approach to estimate the GHG emission reduction in a concrete peatland restoration project.

2. Materials and Methods

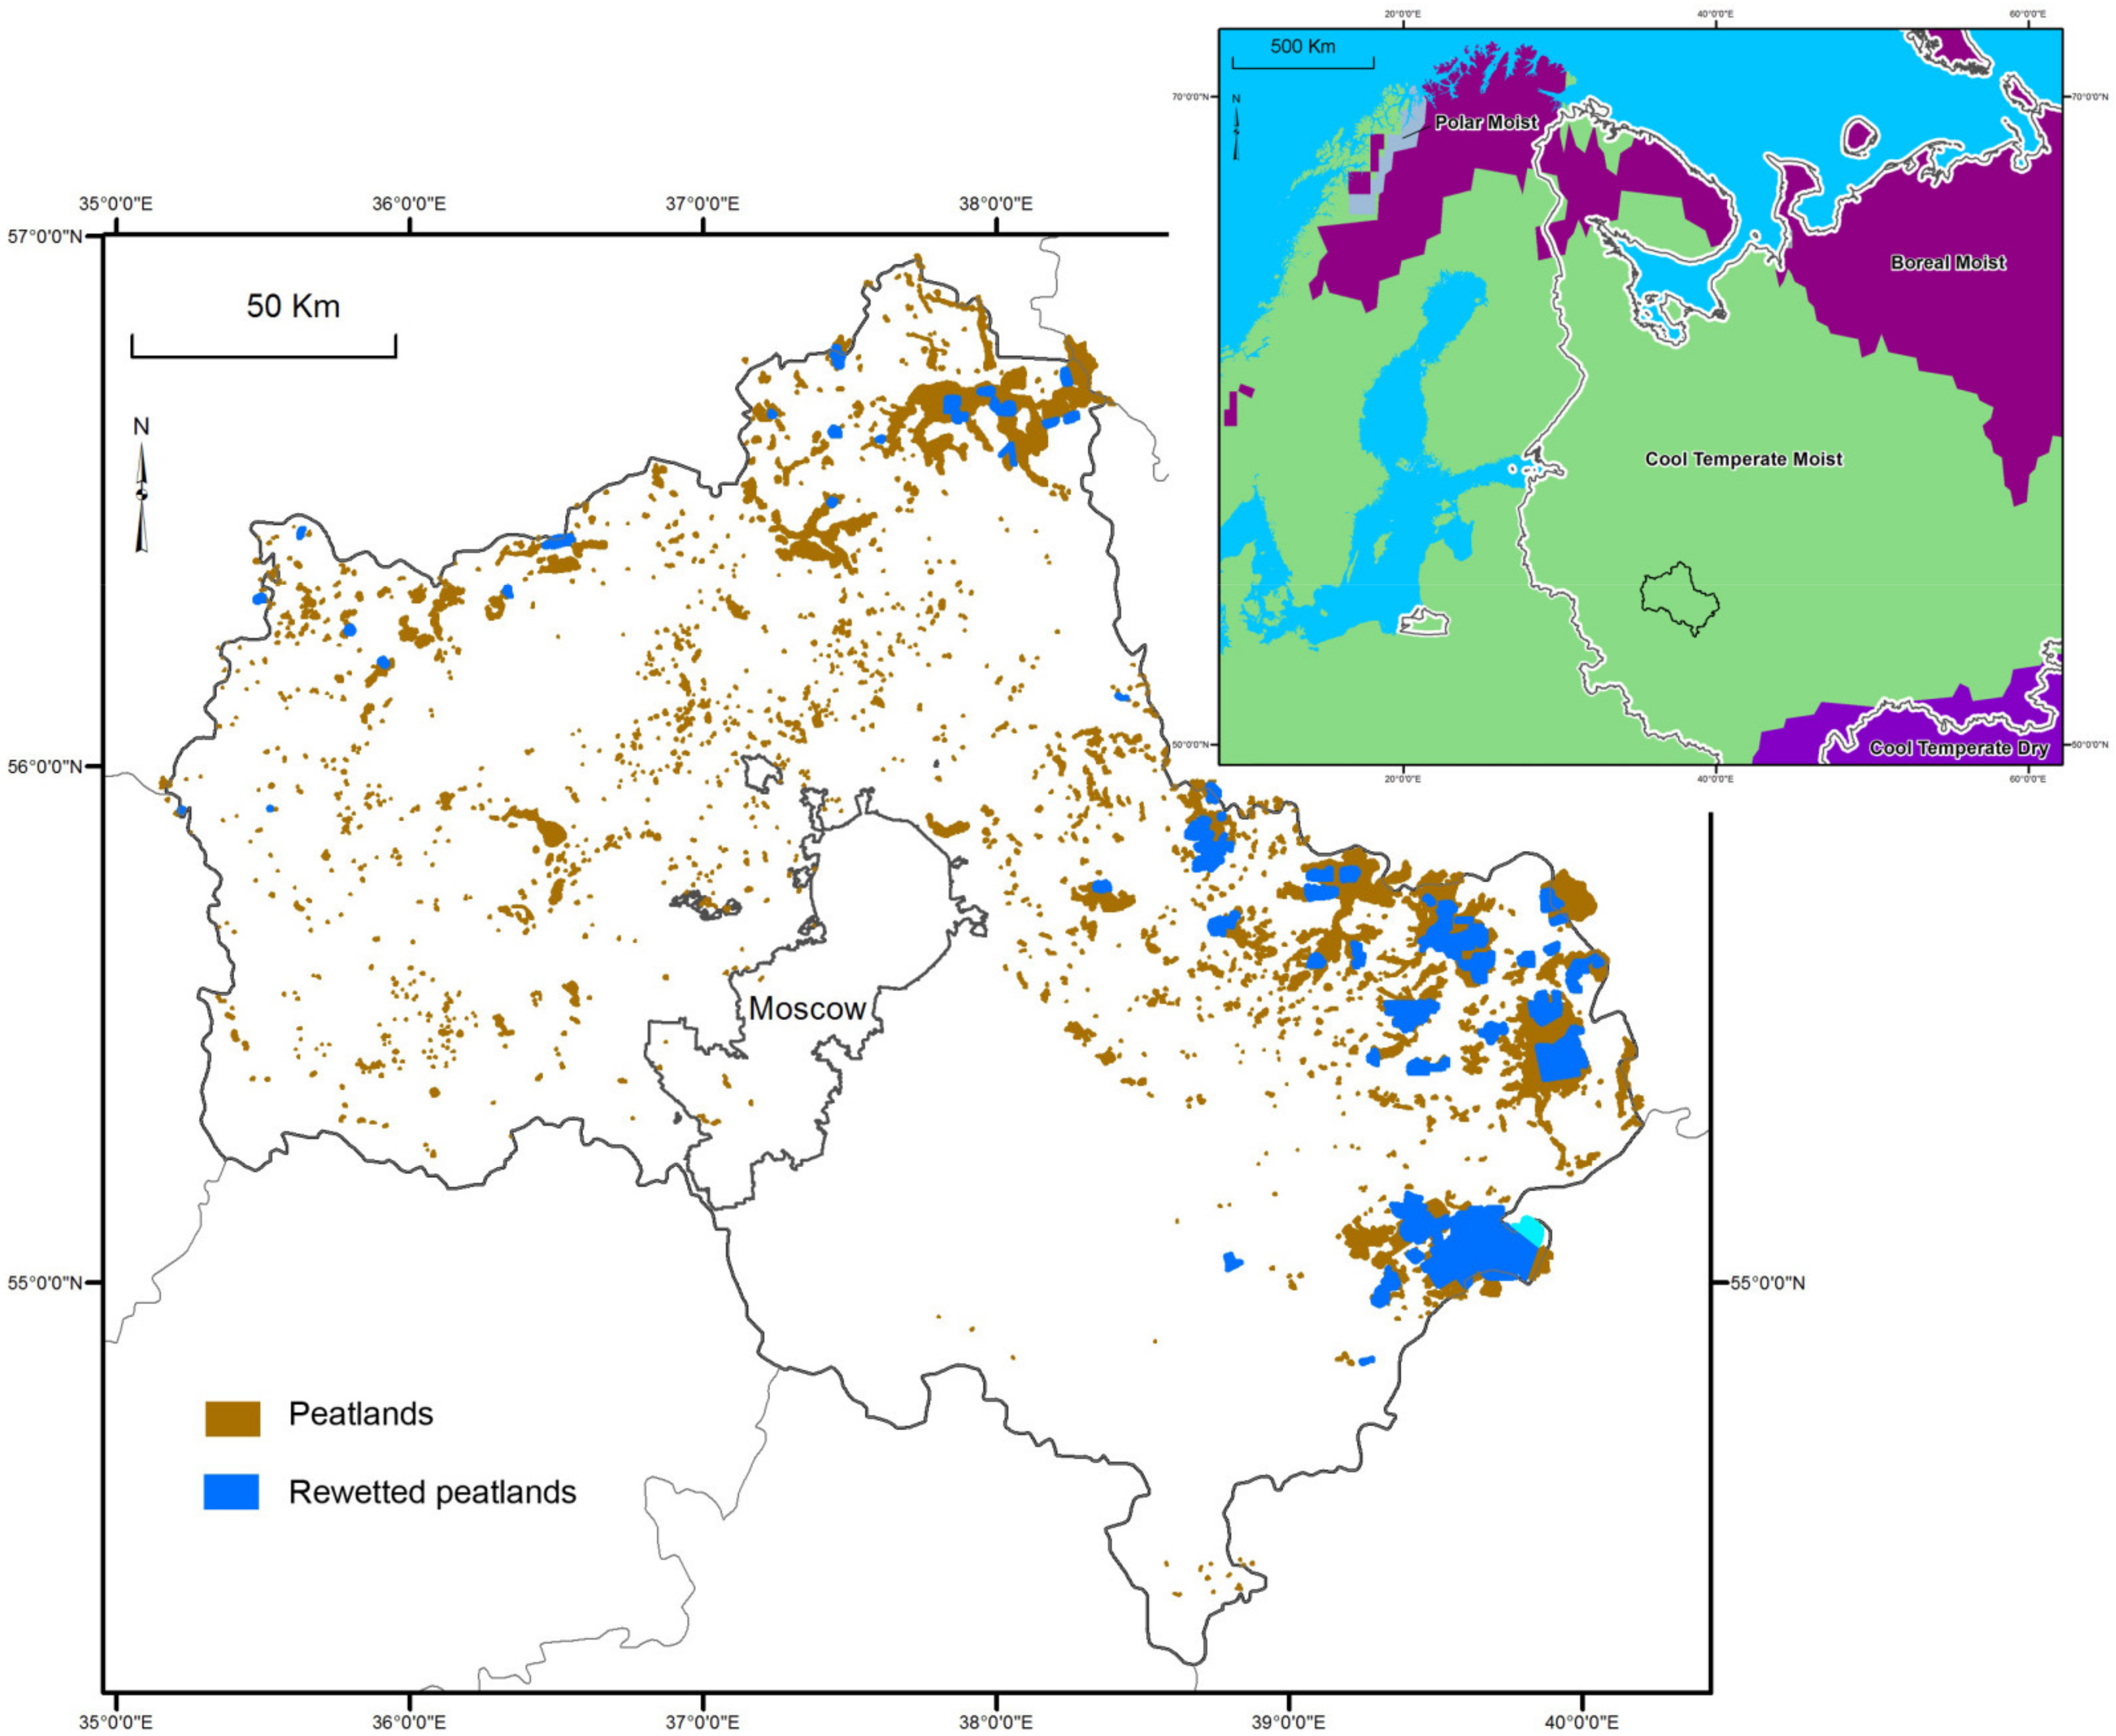
2.1. Rewetting in the Moscow Region

The Moscow Region, the ‘subject’ of the Russian Federation surrounding Moscow City, has an area of 44,329 km2, i.e., is larger than the Netherlands, and is located in the boreo-nemoral-mixed coniferous broad-leaved forest zone [39] with peatlands covering over 250,000 ha or 6% of the area [37] (Figure 2). Since the last quarter of the 19th century, the peatlands in central European Russia have been used for peat extraction and drained for agriculture and forestry [23,24]. After 1917, when other fuel resources became unavailable because of civil war and foreign intervention, peat became a key strategic fuel resource. The ambitious plan for the electrification of the young Soviet State was based on peat resources in the eastern part of Moscow Region [24]. In the second half of the 20th century, the milling method of peat extraction became dominant, after which cutover areas had to be reclaimed for various postextraction uses, with agriculture being a priority. In the 1970s and 1980s, postextraction reclamation lagged behind peat mining, and the collapse of the peat industry in the early 1990s led to large areas of abandoned and not-yet rehabilitated peatlands. These areas, supplemented by abandoned peatlands drained for agriculture and forestry became serious fire hazards [5]. Significant peat fires occurred in 1972, in 2002 and especially in 2010 [16], when, in addition to the economic damage, the combination of anomalous hot weather [40] and extreme smog [41] had catastrophic consequences for human health and life [42,43].
In response, the Government of the Russian Federation decided to combat ongoing and prevent future peat fires, and from the fall of 2010 until 2013 77 drained, fire-prone peatlands with an area of 73,049.84 hectares were rewetted (Figure 2). Rewetting was carried out at different peatlands in several stages, in some cases with a break. Rewetting for ecological restoration covered only limited areas. For the most part, infrastructure for two-way water regulation was created or restored to prevent peat fires but keeping the possibility of returning the land to use, primarily for agriculture. These measures ensured effective fire protection of the drained peatlands. Technical facilities (e.g., dykes, spillway dams with gates of different design, spill over dams, road crossings and other) were financed by the federal budget (with ca. 70 million €), whereas planning was paid by the Moscow Region. In 2014, the responsibility for maintaining the new and reconstructed water management facilities was transferred to a special organization of Moscow Region [16].
Monitoring showed a significant decrease in the number and extent of peat fires at rewetted sites during the fire-hazardous periods after 2010 [16], in contrast to neighboring regions without rewetting. The absence of repeated fires ensured recovery of primarily coniferous and deciduous forest on the burned areas, as well as its continuous growth in adjacent areas not affected by peat fires.

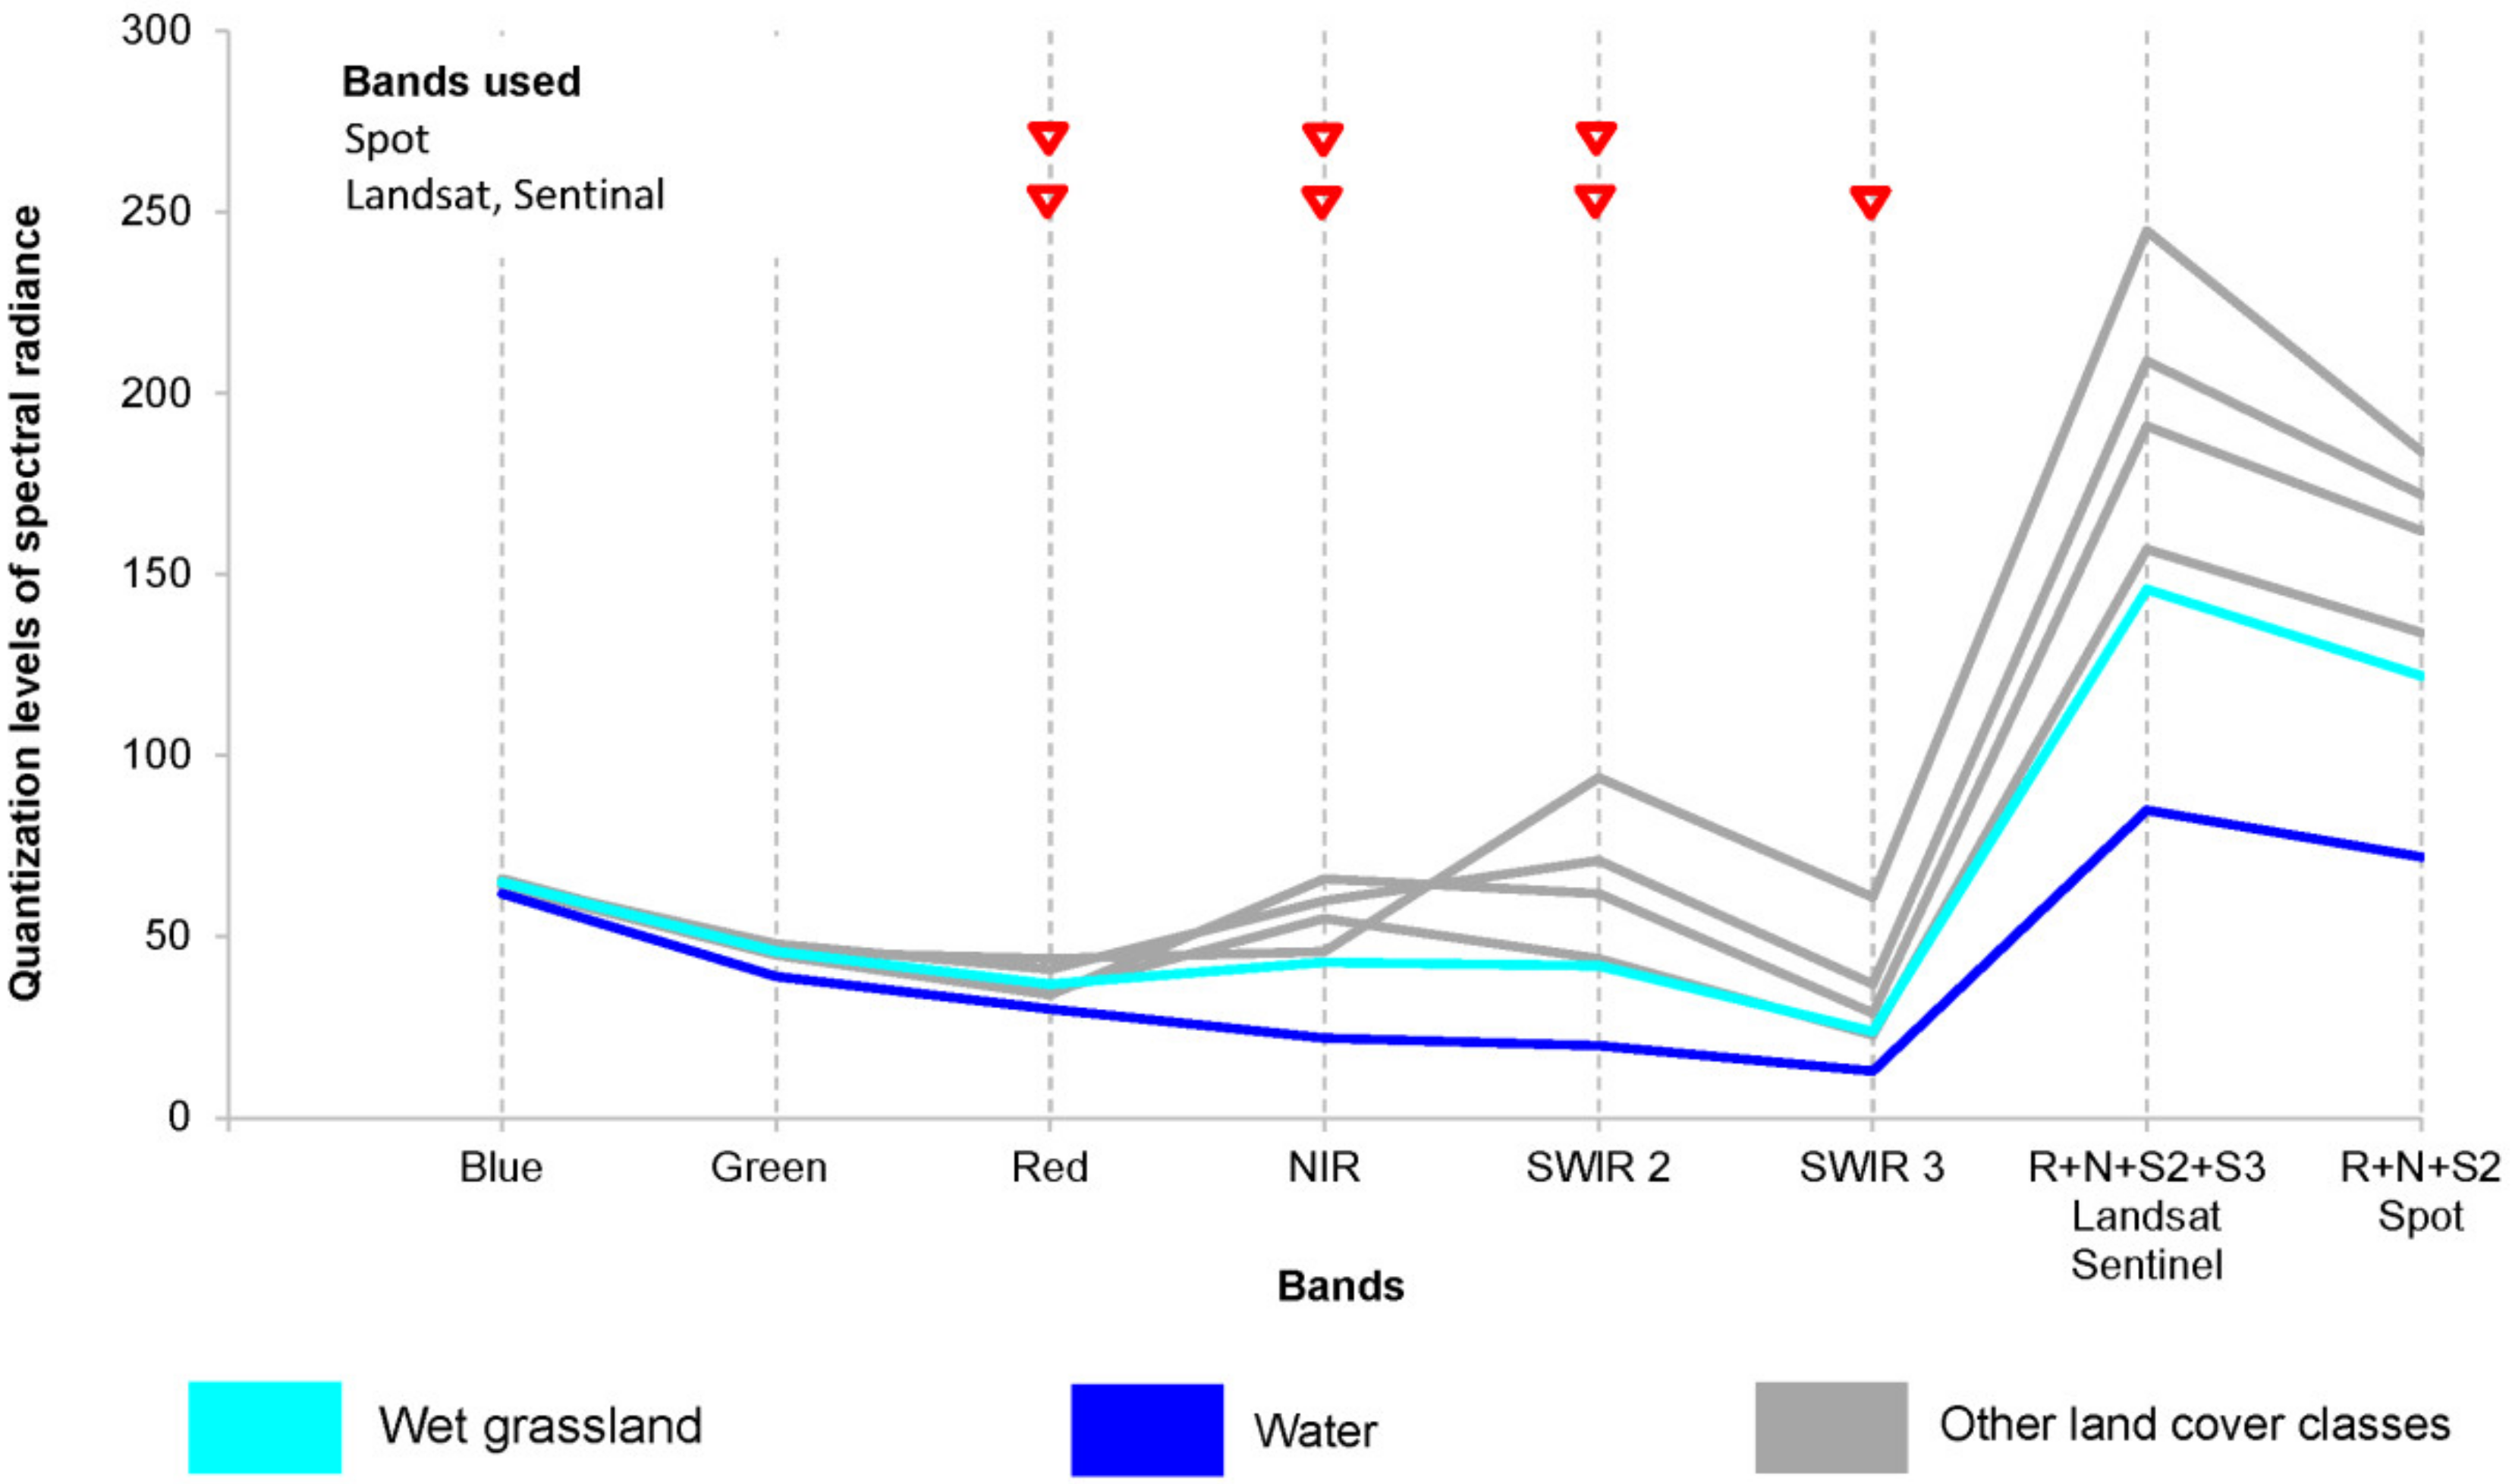
2.2. Determination of the Rewetted Areas

The effect of rewetting differs from place to place. In most cases, water levels are not permanently raised above the peatland surface, but in some cases shallow water bodies are formed. To identify these areas, we used the system of 6 land cover classes previously elaborated using multispectral satellite imagery (using bands of red, nearinfrared and shortwave infrared, Figure 3) and ground data tested at various sites in Moscow and other regions [16,32,44,45,46]. Two land cover classes were considered as rewetted: 1) “wet grassland” with cattail, sedge, reed, and other wetland species, and 2) “water” (Figure 4).
We used the Red, NIR, and SWIR2 of Landsat, Sentinel, and Spot and the SWIR3 band of Landsat and Sentinel. To better distinguish forest and non-forest areas, snow period data were used as well [16,45,47]. Due to cloud cover, technical failures and other limitations, we combined data from different sensors: e.g., Sentinel-2, Landsat-7, and Landsat-8 data of different dates in June, July, and September 2020 and Sentinel-2 data of January 2021 to assess the condition of peatlands for 2020.
To assess the quality of the classification results [48] we used complete error matrices [49], which used cross-tabulation to establish correspondences between the values of the same classes obtained from satellite and ground data (Table 1).

2.3. Emission Factors before Rewetting

We assumed that the peatland areas before rewetting were predominantly abandoned peat extraction sites and consequently used the emission factors for CO2, CH4, N2O and DOC export for ‘peatlands used for peat extraction’ of the IPCC Wetland Supplement [10]. Pre-rewetting satellite imagery showed areas of bare peat at the majority of sites, which points to peat extraction, as in agricultural areas bare peat rarely occurs, with the exception of arable fields periodically. Moreover, “wet grassland” and “water” indicate former peat extraction as users and owners of agricultural land are not (yet) interested in wetland restoration and rewetting of agricultural peatlands has mainly focused on raising the groundwater level during the fire season while maintaining the option for agricultural use afterwards. The use of the Emission Factor (EF) of ‘peatland managed for extraction’ is furthermore more conservative as a ‘baseline’, as GHG emissions from peat extraction sites (Table 2) are generally lower than those from drained agricultural land [10].
To calculate the CH4 emissions prior to rewetting, we used the formulas GHGditch = Areapeatland × 0.05 × EFditch and GHGsoil = Areapeatland × 0.95 × EFsoil, i.e., we used the area proportion occupied by drainage ditches in peat extraction sites of 5% of IPCC [10], Table 2.3, which was consistent with our own estimates [50].

2.4. GHG Emission Factors for Rewetted Areas

For “wet grassland”, we used the EFs for ‘rewetted organic soils’ of IPCC [10] (Table 3), which differentiate between ‘rich’ and ‘poor’ with a soil moisture electrical conductivity of ≥50 μS cm−1 and ≤40–50 μS cm−1, respectively [51]. On the basis of the (limited) available data [33,50], we provisionally interpreted all rewetted areas in Moscow Region as being ‘rich’. For “water”, we used the EF for ‘flooded land’ of IPCC [31] (Table 3). In all cases, average EF values were used. For “wet grassland” we used the IPCC [10] Tier 1 factors for the ‘cool temperate moist’ climate zone (Figure 2, [30], Annex 3A.5.1; [31], Annex 3A.5.1), for “wet grassland” those for the aggregated ‘cool temperate’ zone of IPCC [31], Table 7A.2.

2.5. GHG Emissions Changes after Rewetting

The change in GHG emissions ∆E (including DOC) for the rewetted area was calculated as:
Δ E = S w g n = 1 4 ( E F r o s , i E F p e , i ) + S w n = 1 4 ( E F f l , i E F p e , i )
where i is the agent number (1—CO2, 2—DOC, 3—CH4, 4—N2O), Swg is the area of “wet grassland”, EFros,i is the emission factor for “rewetted organic soils”, EFpe,i is the emission factor for peat extraction sites, Sw is the area of “water”, EFfl,i the emission factor for “flooded land”. Emission factors (EFs) changes after rewetting are given in Table 4.
After rewetting, the methane emission from the area previously occupied by drainage ditches was assumed to be equal to that of ‘flooded land’. Methane emission from drainage ditches is largely determined by turbulent water mixing. This mixing depends on flow velocity [52], which stimulates both diffusive and ebullitive (bubble) emission. After rewetting, the flow is practically stopped and the higher water level with its higher pressure prevents the lateral flow of dissolved and gaseous methane from the peat into the former drainage network. Moreover, the inflow of dissolved and suspended fresh organic matter, the main substrate for methanogenesis, is reduced. The larger water depth decreases warming of the ditch bottom, which also inhibits methanogenesis and probably changes the microbiological environment [53]. Therefore, a significant reduction in methane emission from ditches, from 542 kg CH4-C ha−1 yr−1 before flooding (Table 1) to 84.7 kgCH4-C ha−1 yr−1 after flooding (Table 2) seems reasonable. However, as only 5% of the area is occupied by the drainage network, these changes hardly affect the total methane balance of the rewetted area.
According to IPCC [10], “rewetted organic soils” still export some DOC, which is logical, since some water runoff from such areas does persist. On the other hand, DOC export from “flooded land” is assumed to be “0”, because permanent flooding requires an almost complete ceasing of runoff.
N2O emission after rewetting was attributable to the surrounding managed land [10] and therefore assumed to be ‘zero’. The greenhouse gas emission reduction was expressed in 103 tCO2-eq year−1, using the 100-year global warming potentials of CO2 = 1, CH4 = 25 and N2O = 298.

2.6. Uncertainty Assessment

Uncertainties were estimated following IPCC [54] taking into account the large asymmetric uncertainties of the EFs. We assumed a triangular distribution of the input quantities (approximating the normal distribution) and used the error propagation method.
The probability of error in determining the land cover classes “wet grassland” and “water” was less than 2% [16] and not included in the uncertainty assessment. As the areas of the classes were estimated from satellite imagery with limited resolution, we determined the accuracy of area calculation from the total area of border pixels of each area type (Figure 5). When we assume that more than 50% of the pixel area indeed belongs to the land category in question (“wet grassland” or “water”), we can assume that the error of area determination is not more than half of the area of the bounding pixels of the image (Figure 5).
To obtain a 95% confidence interval, we considered the area as a random variable with a symmetric triangular distribution. The quantiles of the 2.5% and 97.5% levels constitute the confidence limits of the area, respectively. A test for Radovitsky Mokh peatland showed that the uncertainty of the “water” area amounted to about 6% at 10 m (Sentinel-2) and 17% at 30 m resolution (Landsat-7,8), with “wet grassland” reaching values of 20% and 32%, respectively. For calculating emissions for the Moscow Region as a whole, we used area uncertainty values of 20% for “water” and 30% for “wet grassland”. Sensitivity analysis has shown that the uncertainty of CO2 emissions is decisively determined by the uncertainty of emission factors (especially for hydrophilic vegetation), whereas the impact of area uncertainties is insignificant.

3. Results

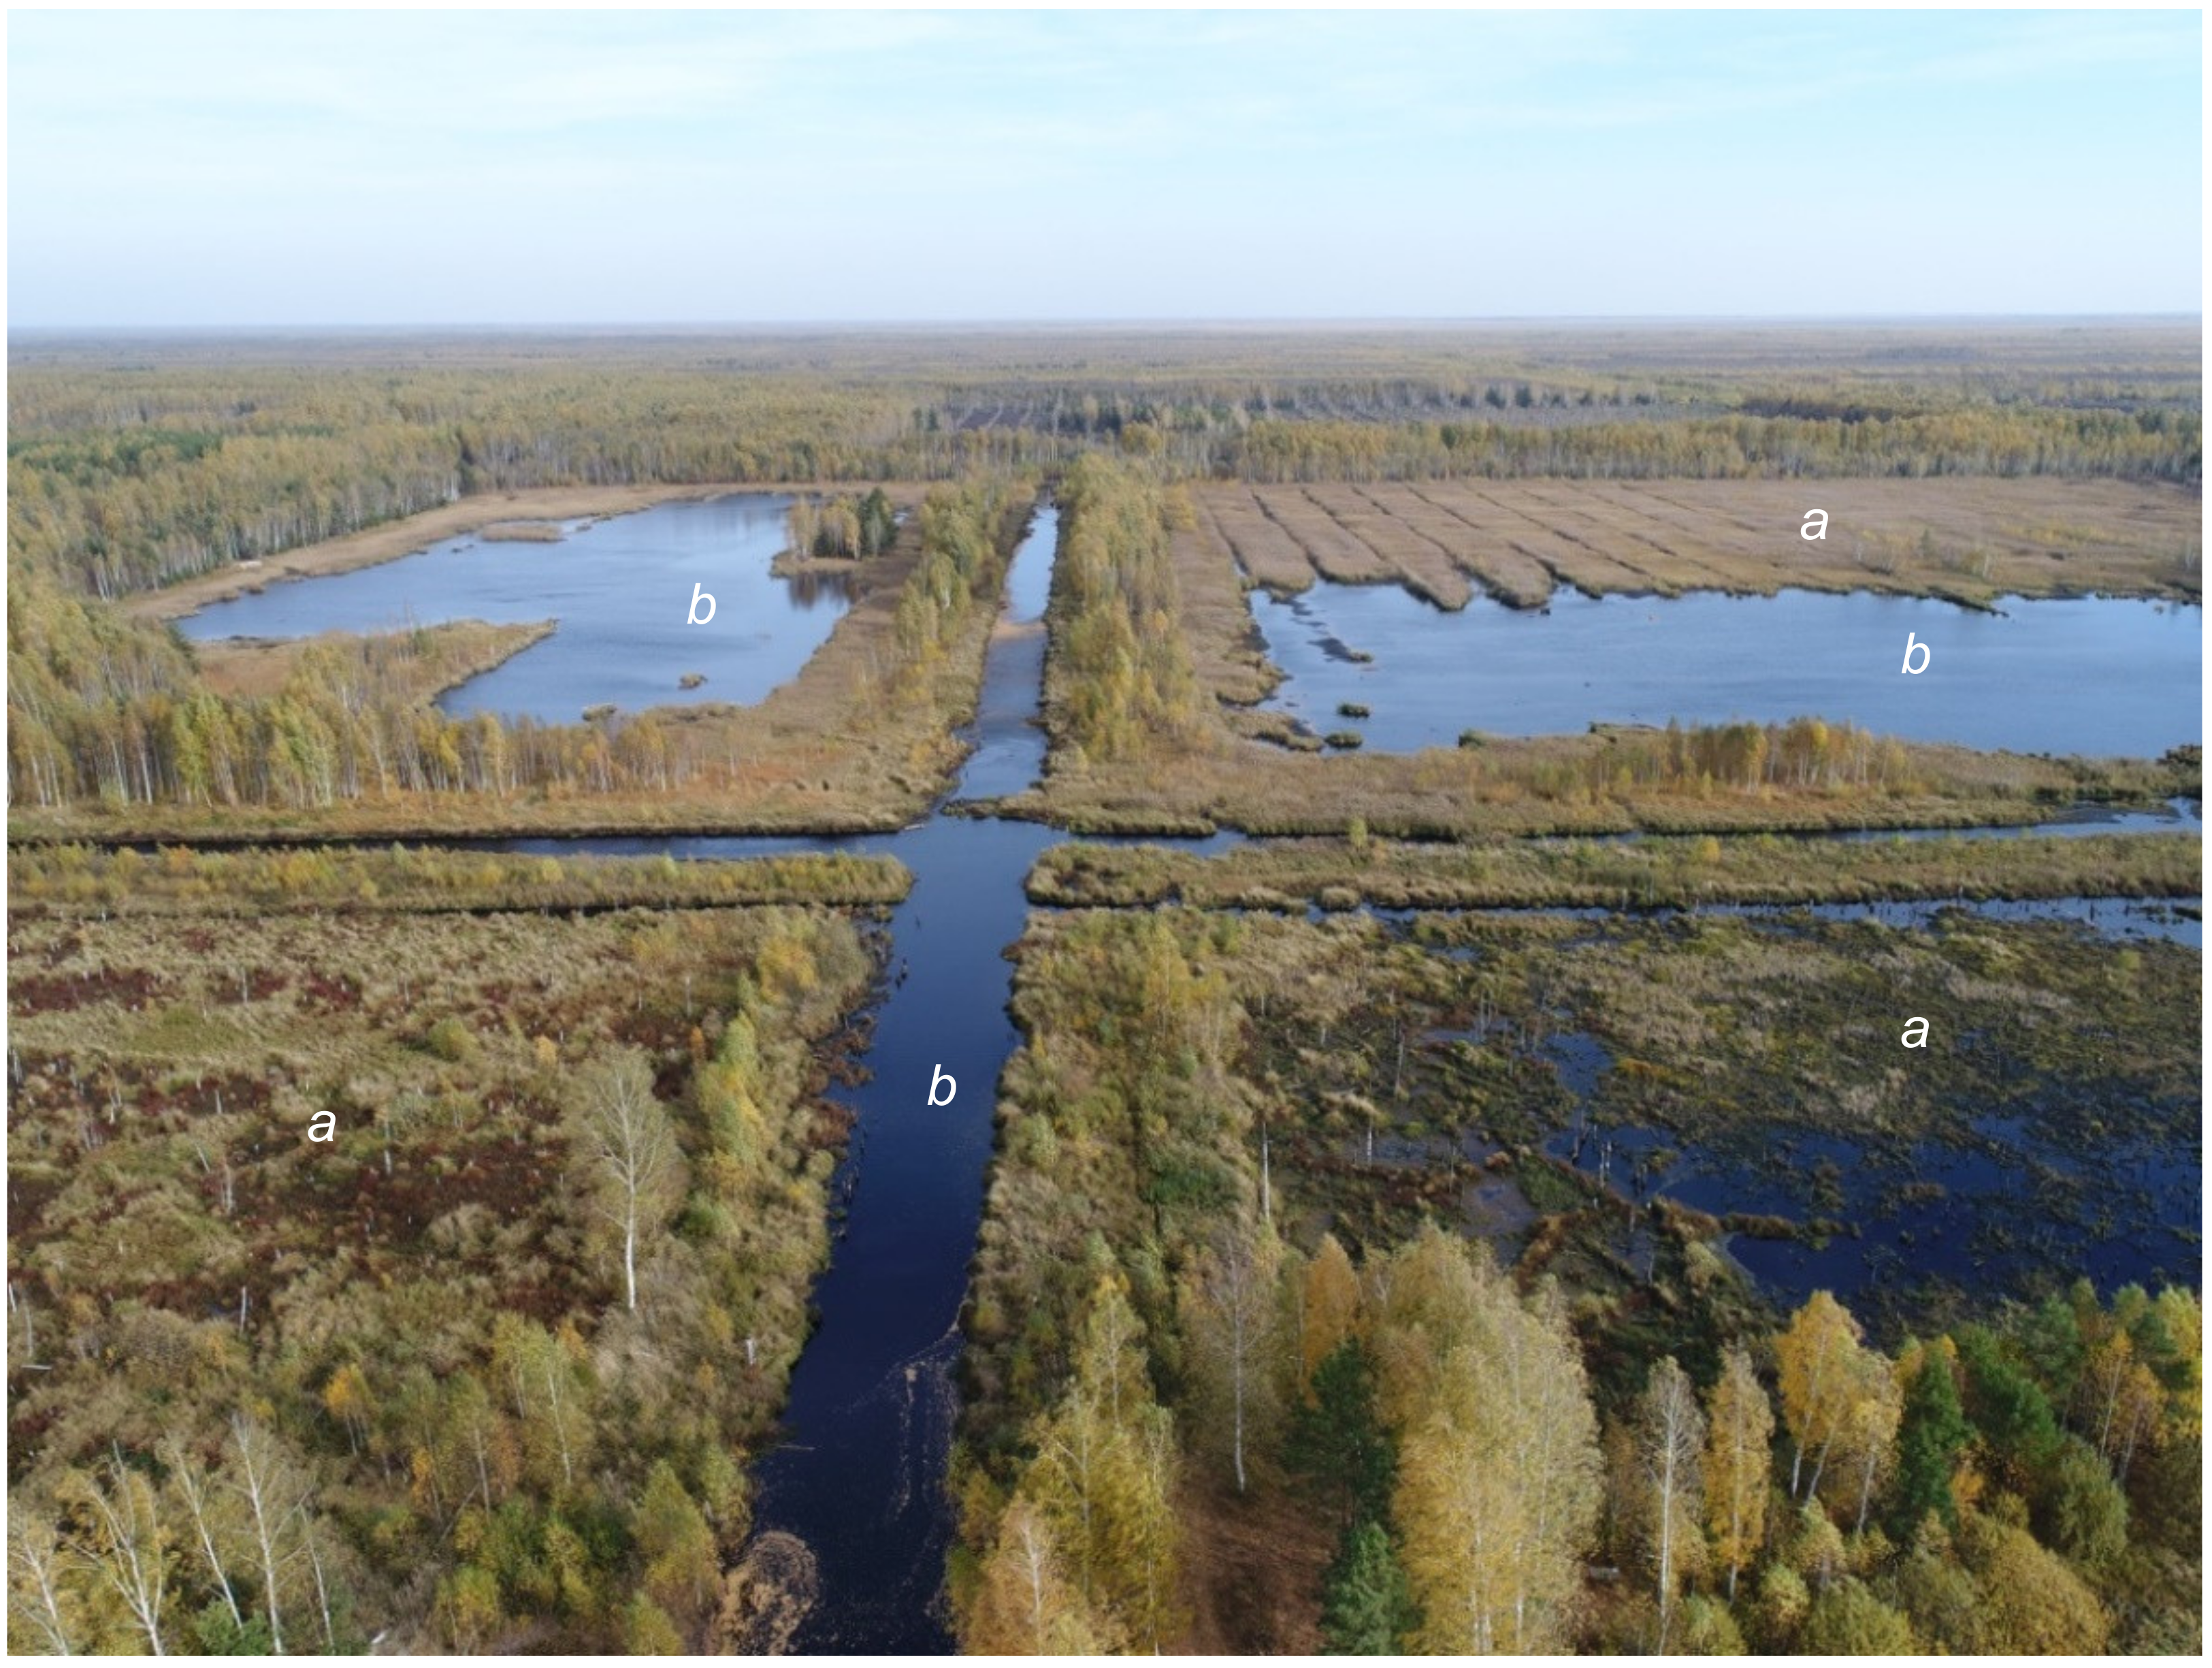
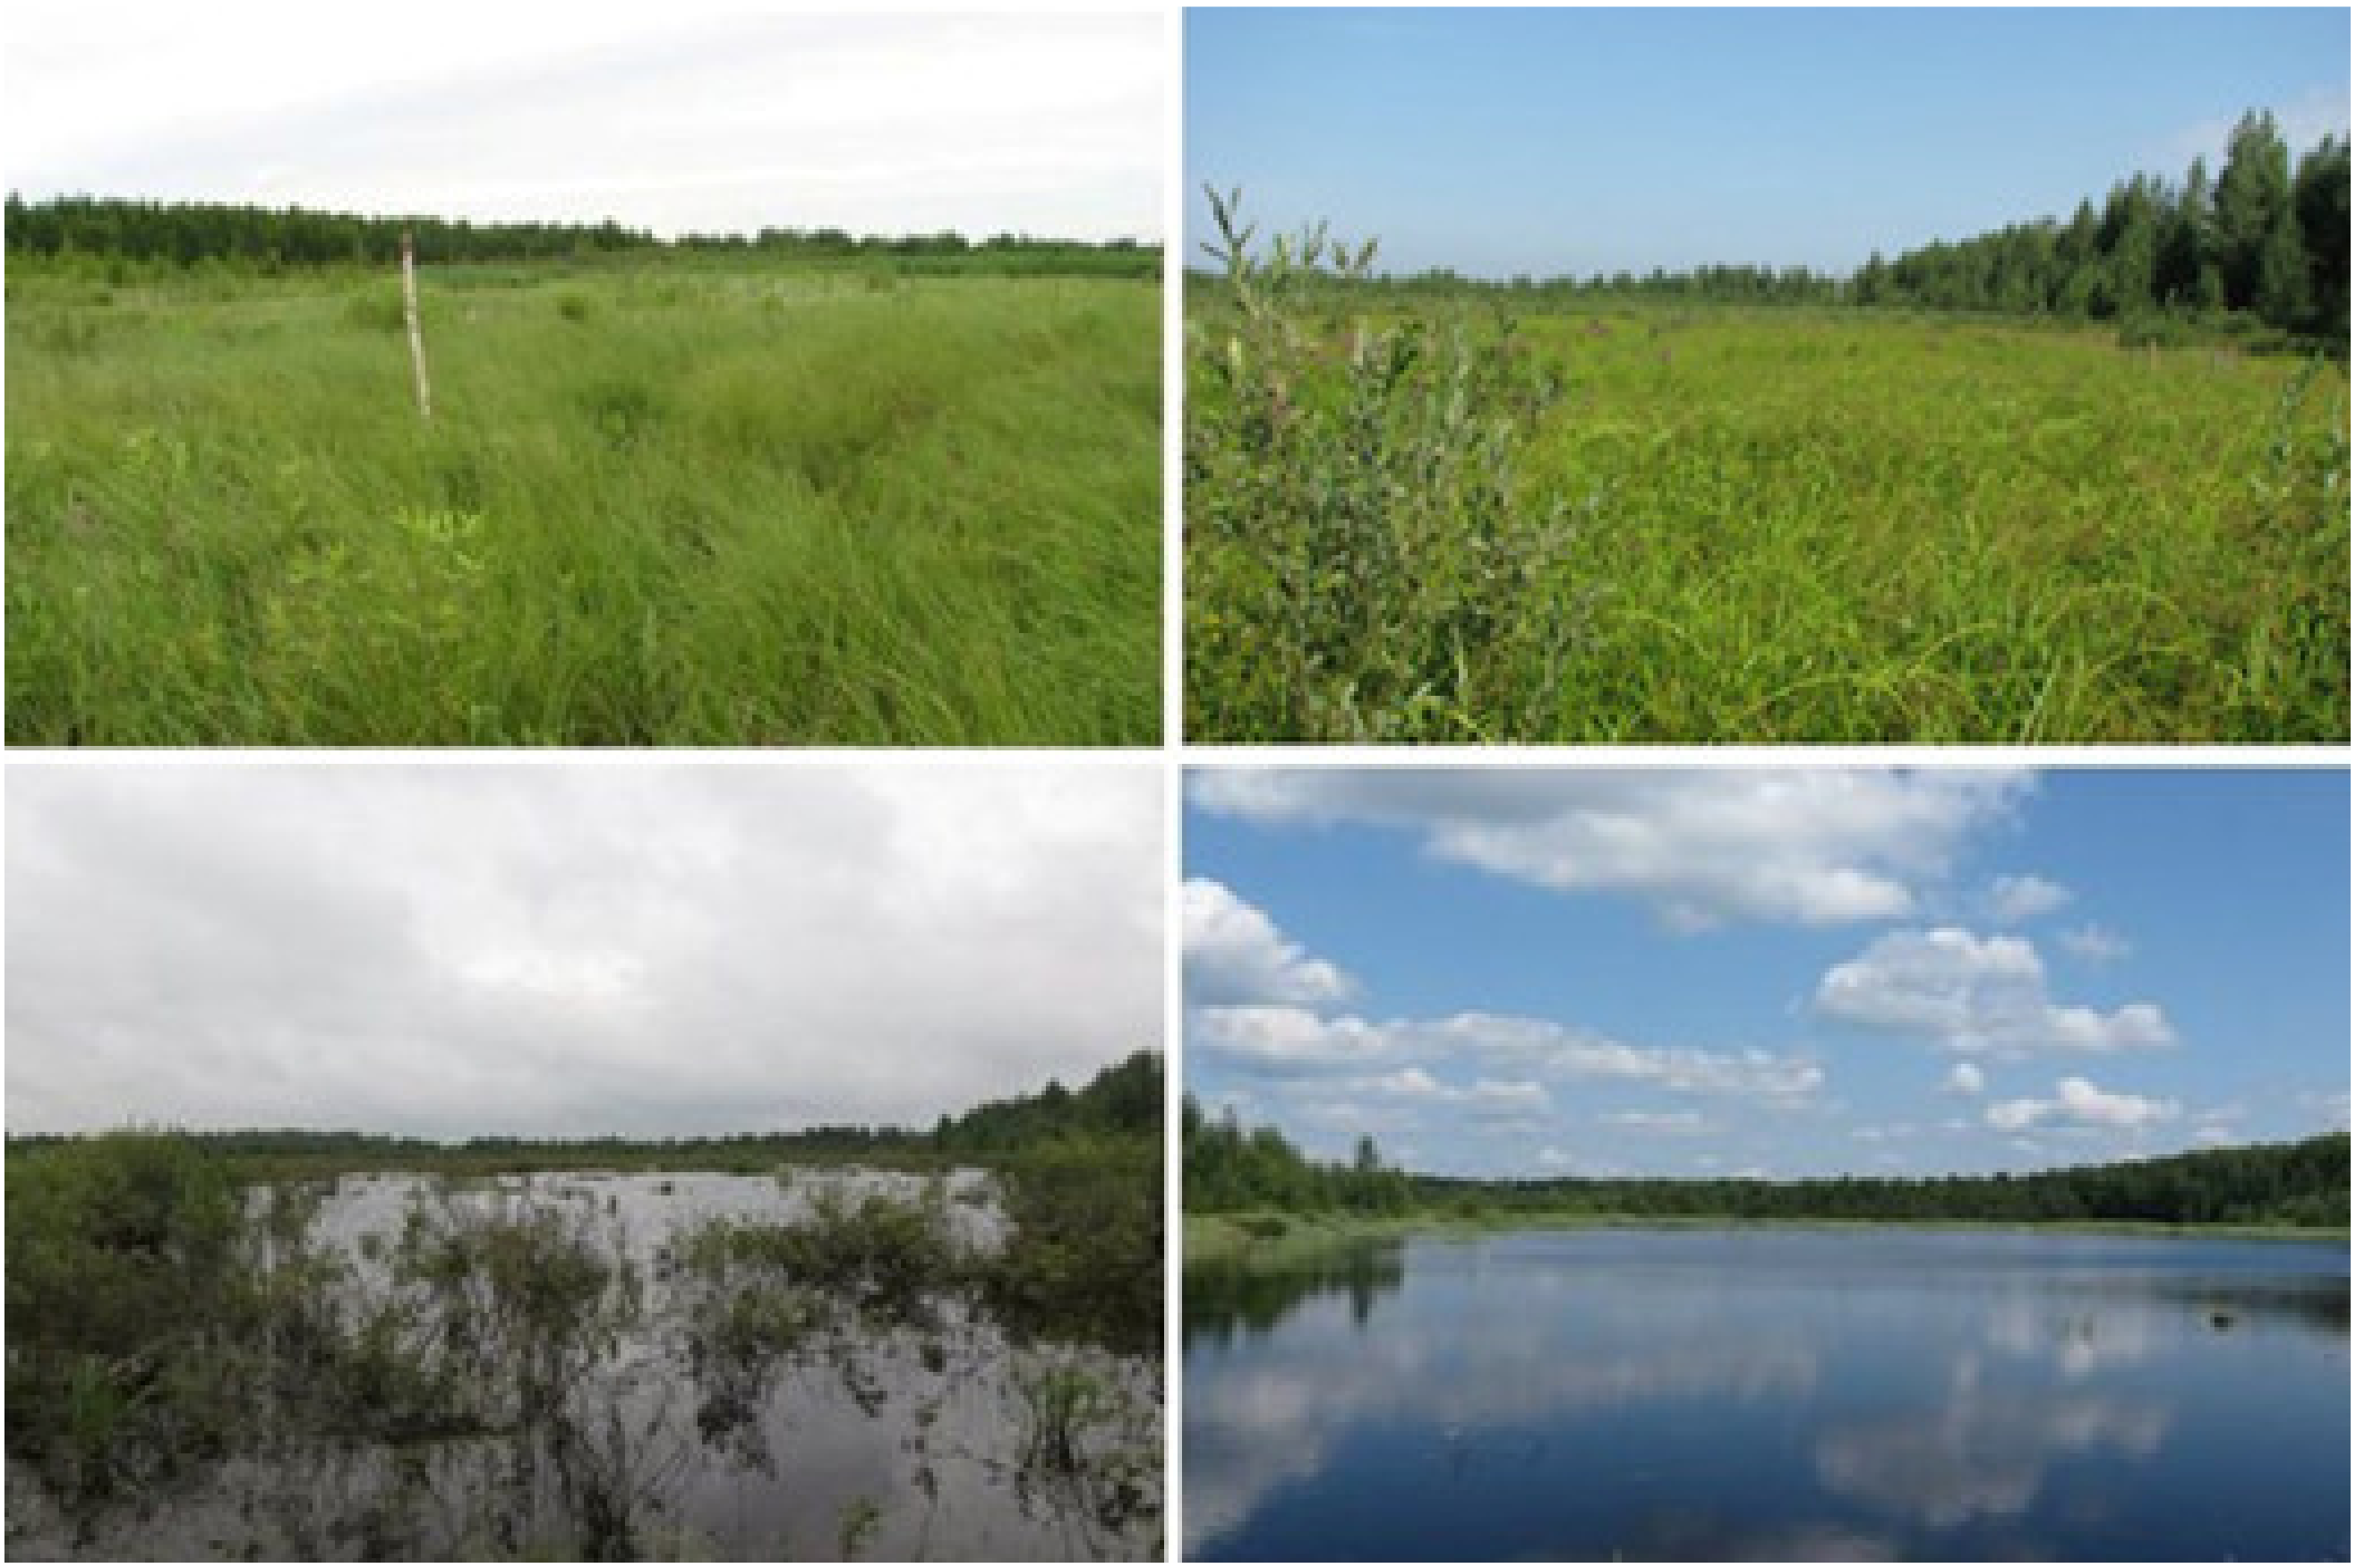
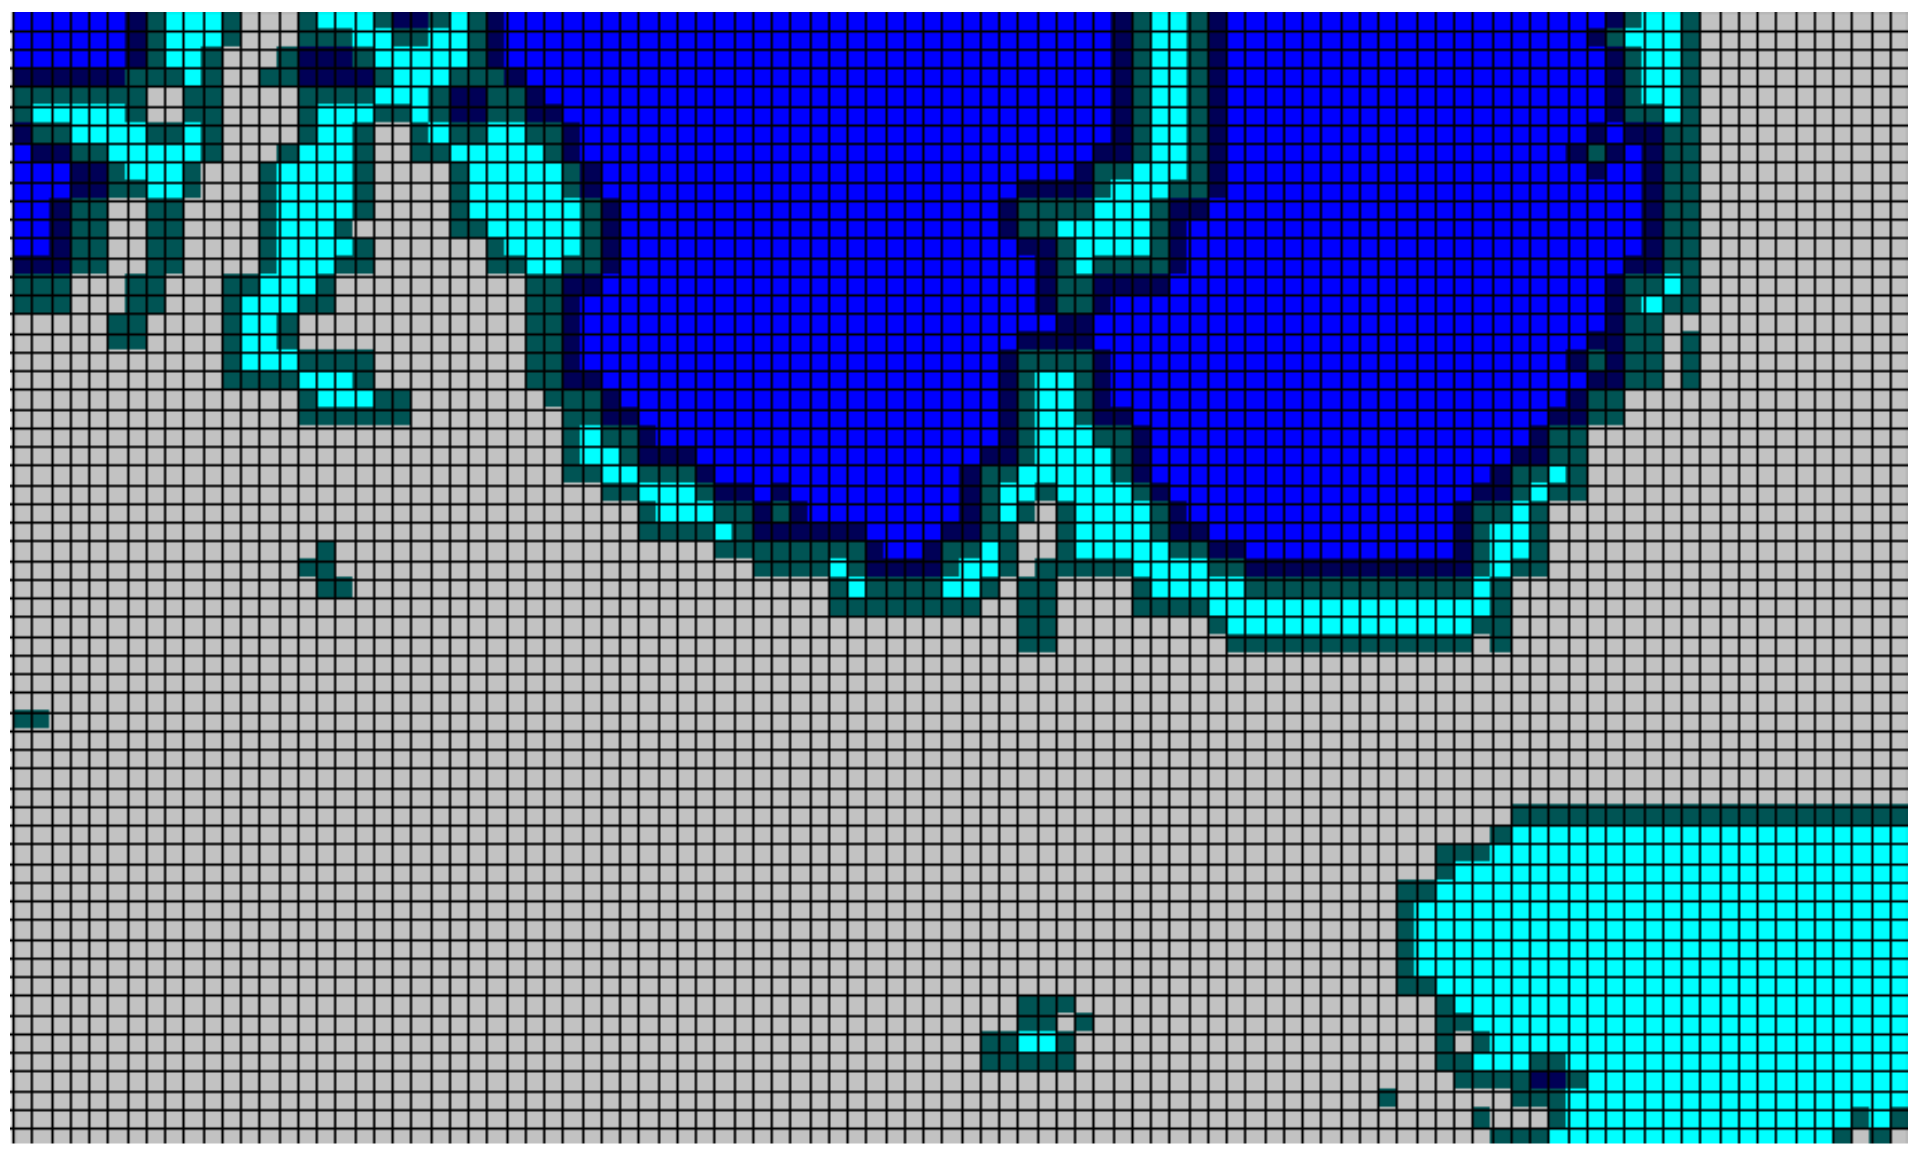
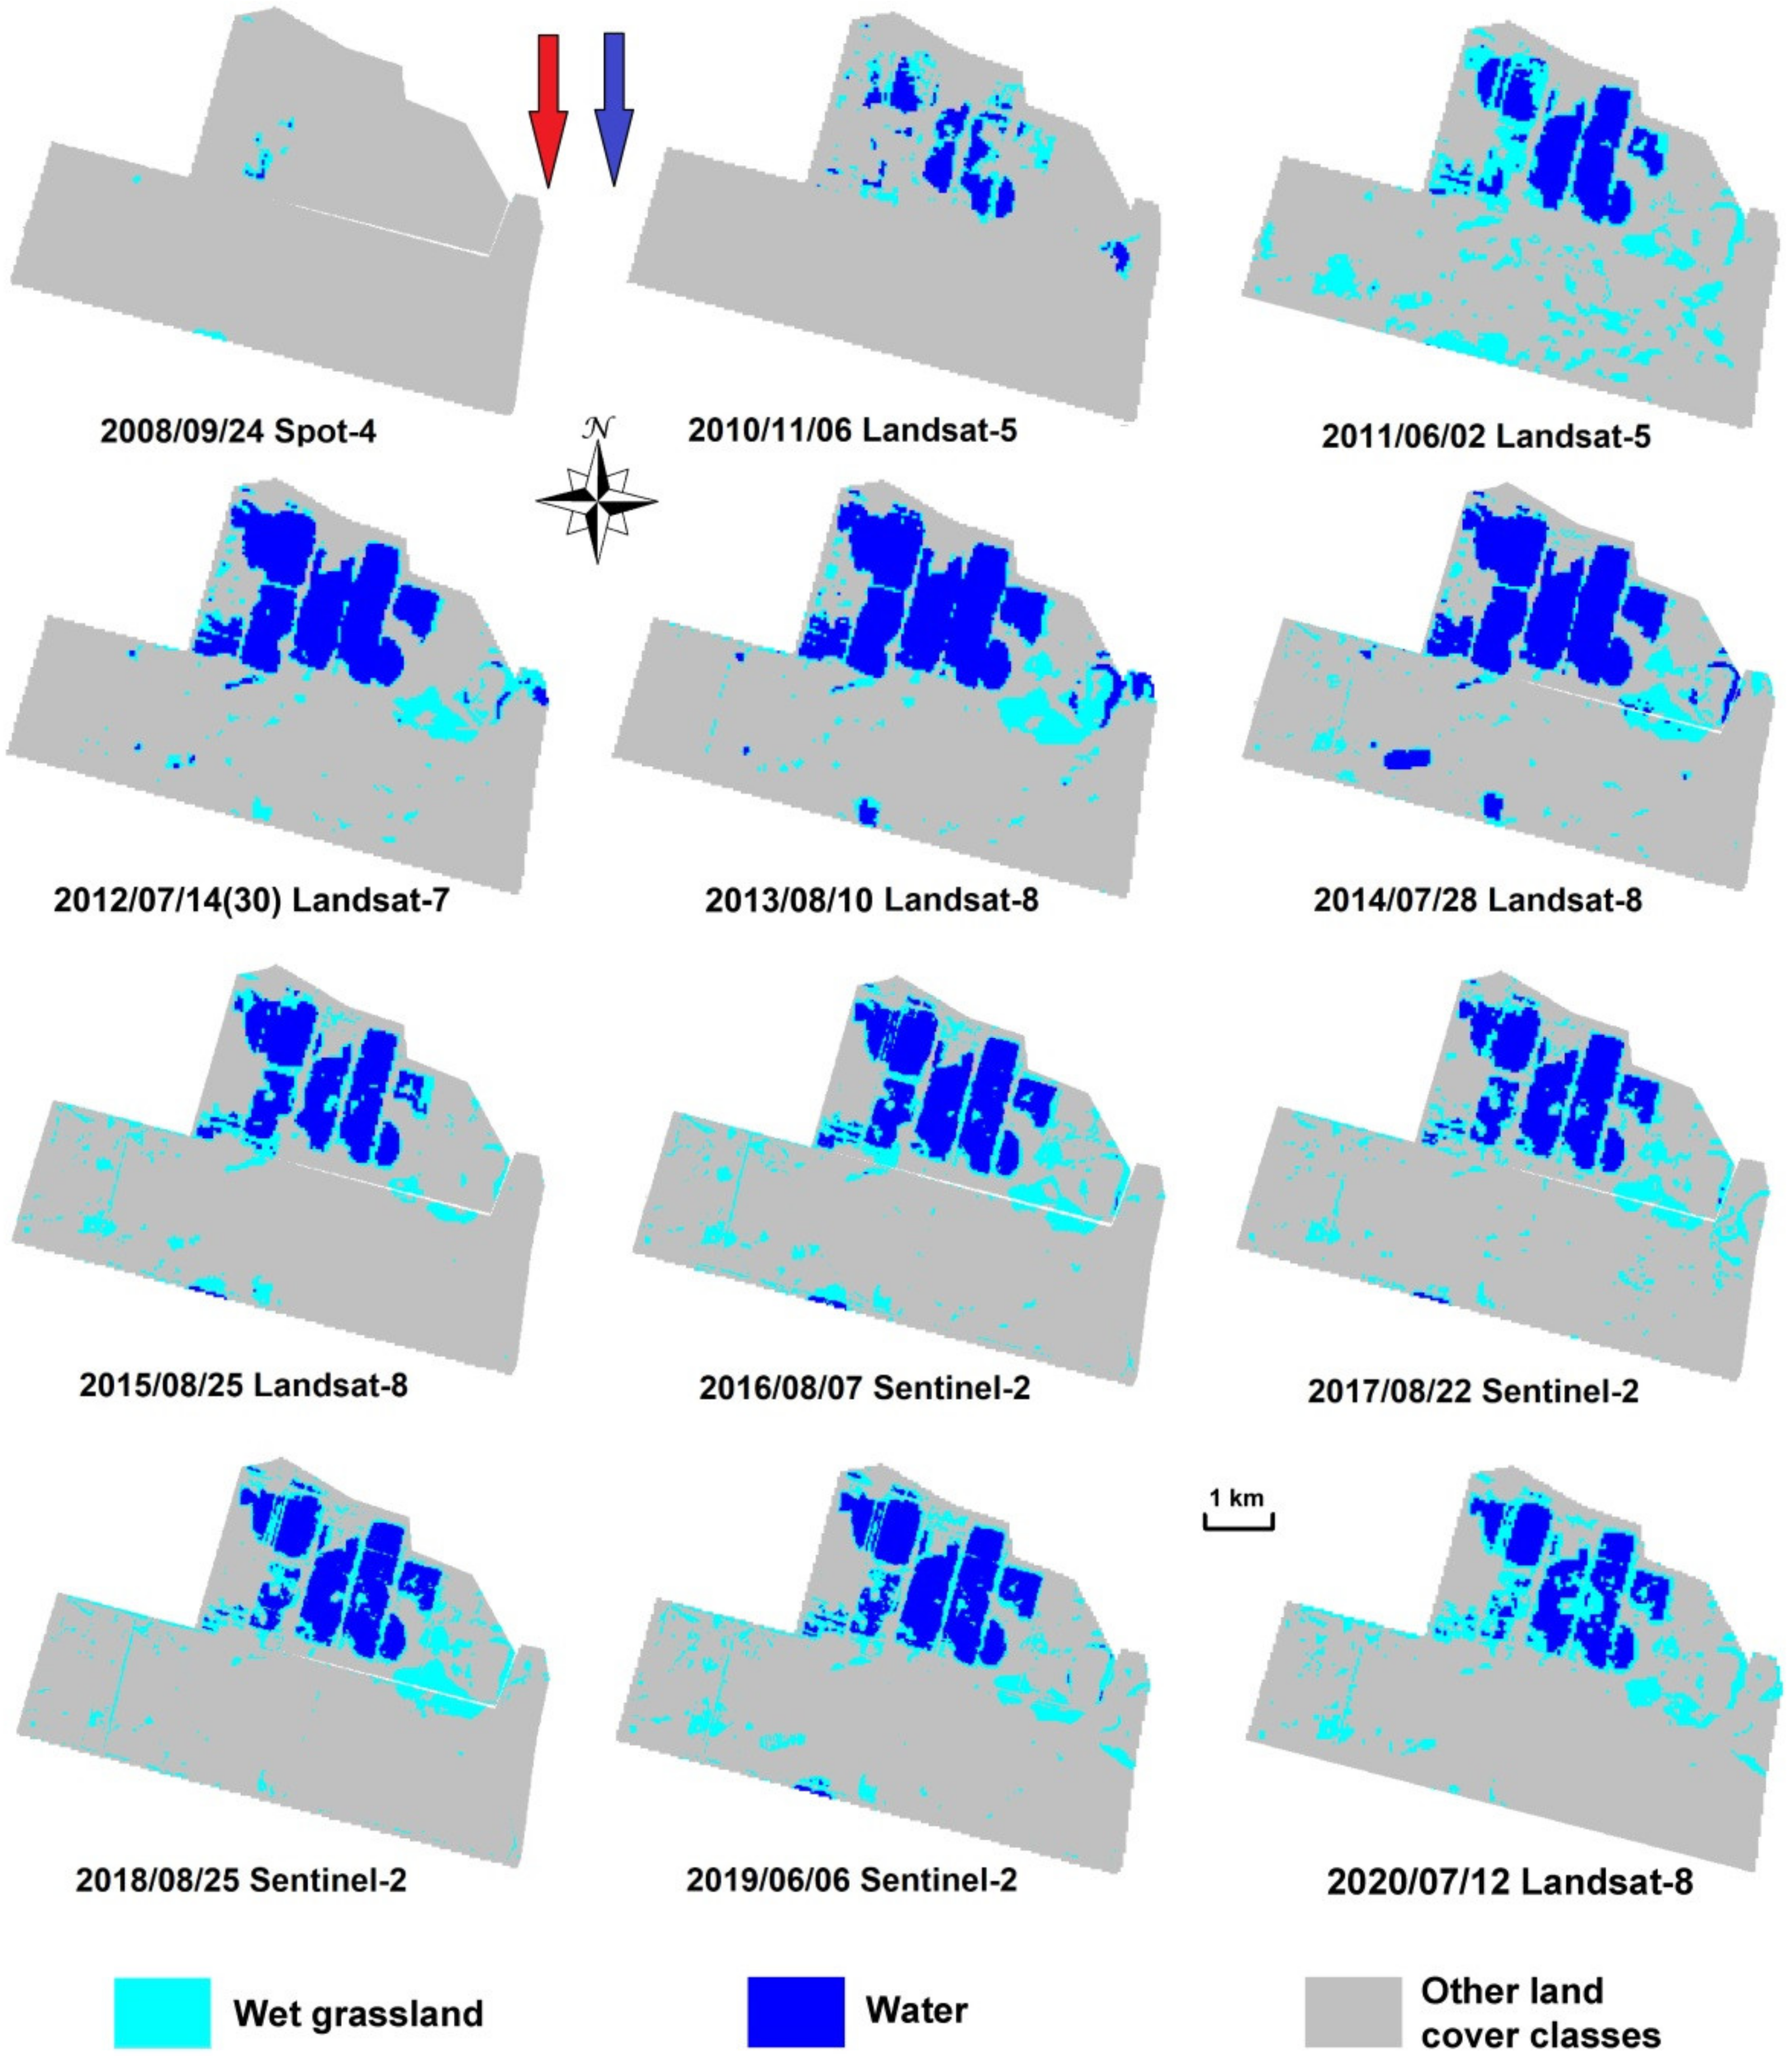
3.1. Land Cover Changes after Rewetting in Radovitsky Mokh

The main trends of land cover changes after rewetting were clearly visible in the example of the 1535 ha Radovitsky Mokh peatland (Figure 6). Rewetting started almost immediately after the fires in autumn 2010. The existing hydraulic structures did not require significant repair and reconstruction, and the abundant rain and later meltwater facilitated a rapid rise of the water level.
In the years after rewetting, the area of “wet grassland” and “water” fluctuated (Figure 6 and Figure 7 left), because, although in the Moscow Region annual precipitation generally exceeds evaporation, the water balance, and especially the volume of snow, may vary considerably between years.
Previous research showed that the area of “water” assessed for all rewetted peatlands in Moscow Region strongly correlated with the amount of precipitation in the preceding 30-days [16]. Such correlation also applied to the test area (Figure 7 right) and is presented here to demonstrate that the area of flooded land may vary slightly depending on weather and climate conditions. To a lesser extent, meteorological conditions preceding the survey date also seemed to affect the area of “wet grassland”. Spectral appearances characterizing this class did not only identify proper hydrophilic vegetation, but also simply inundated areas.
In general, land cover dynamics reflected a logical pattern of progressively expanding “water” areas, modulated by meteorological conditions. This was particularly pronounced in the first years after rewetting. As time passed, the proportion of “wet grassland” increased indicating that shallow water areas were being overgrown.

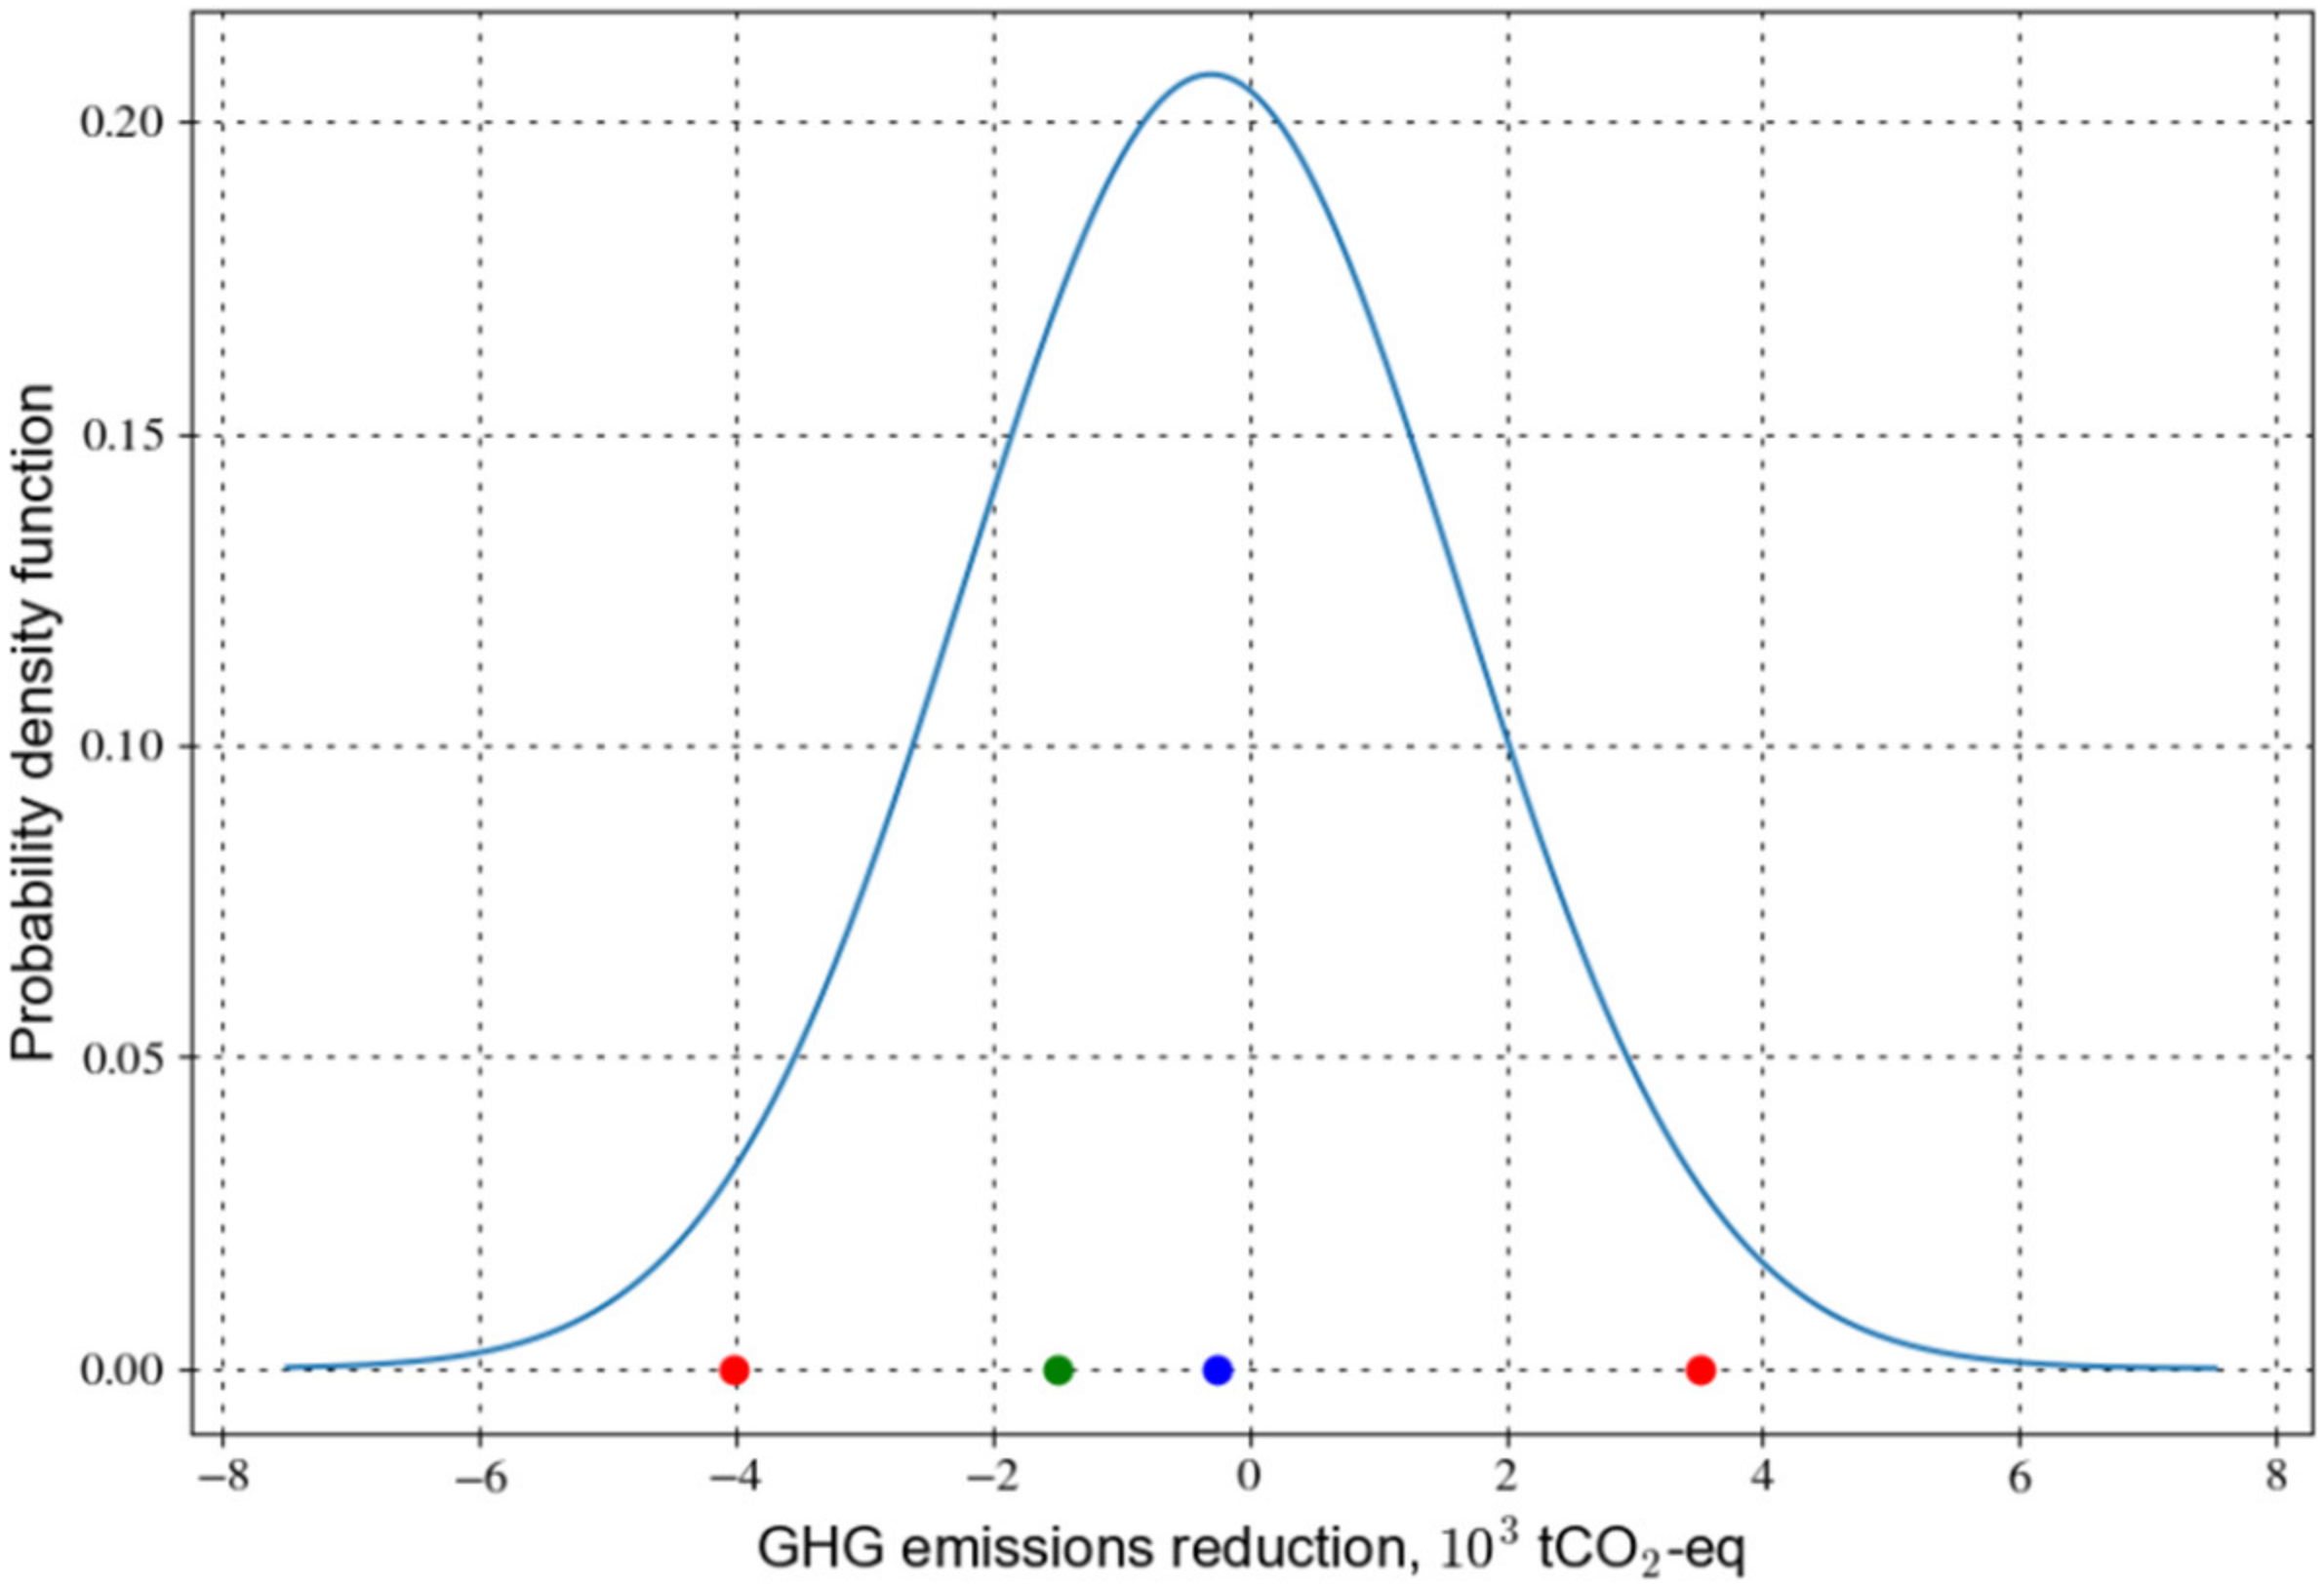
3.2. GHG Emissions Reduction for Radovitsky Mokh

The presented methodology enables estimating emission reduction by rewetting compared to the situation before rewetting. For the 1,534.8 ha of rewetted peatland in Radovitsky Mokh, the area occupied by “wet grassland” and “water” in 2020 amounted to 216.9 ha and 140.6 ha, respectively, which accounts for a total emission reduction of 1.5 103 tCO2-eq.yr−1 (Table 5).
The largest emission reductions were caused by the decrease in carbon dioxide emissions. Moreover, DOC export declined substantially, since runoff from the rewetted areas largely stopped. This may, however, be a temporal effect until rewetting has been completed and runoff with DOC export may resume. CH4 emission increased most significantly in areas with “wet grassland”, where sedges and other aerenchymatic plants facilitated the release of methane from deep peat layers, bypassing the methanotrophic filter. CH4 emission from the drainage network decreased by flooding. Nitrous oxide made only a small contribution to the reduction of in GHG emissions.

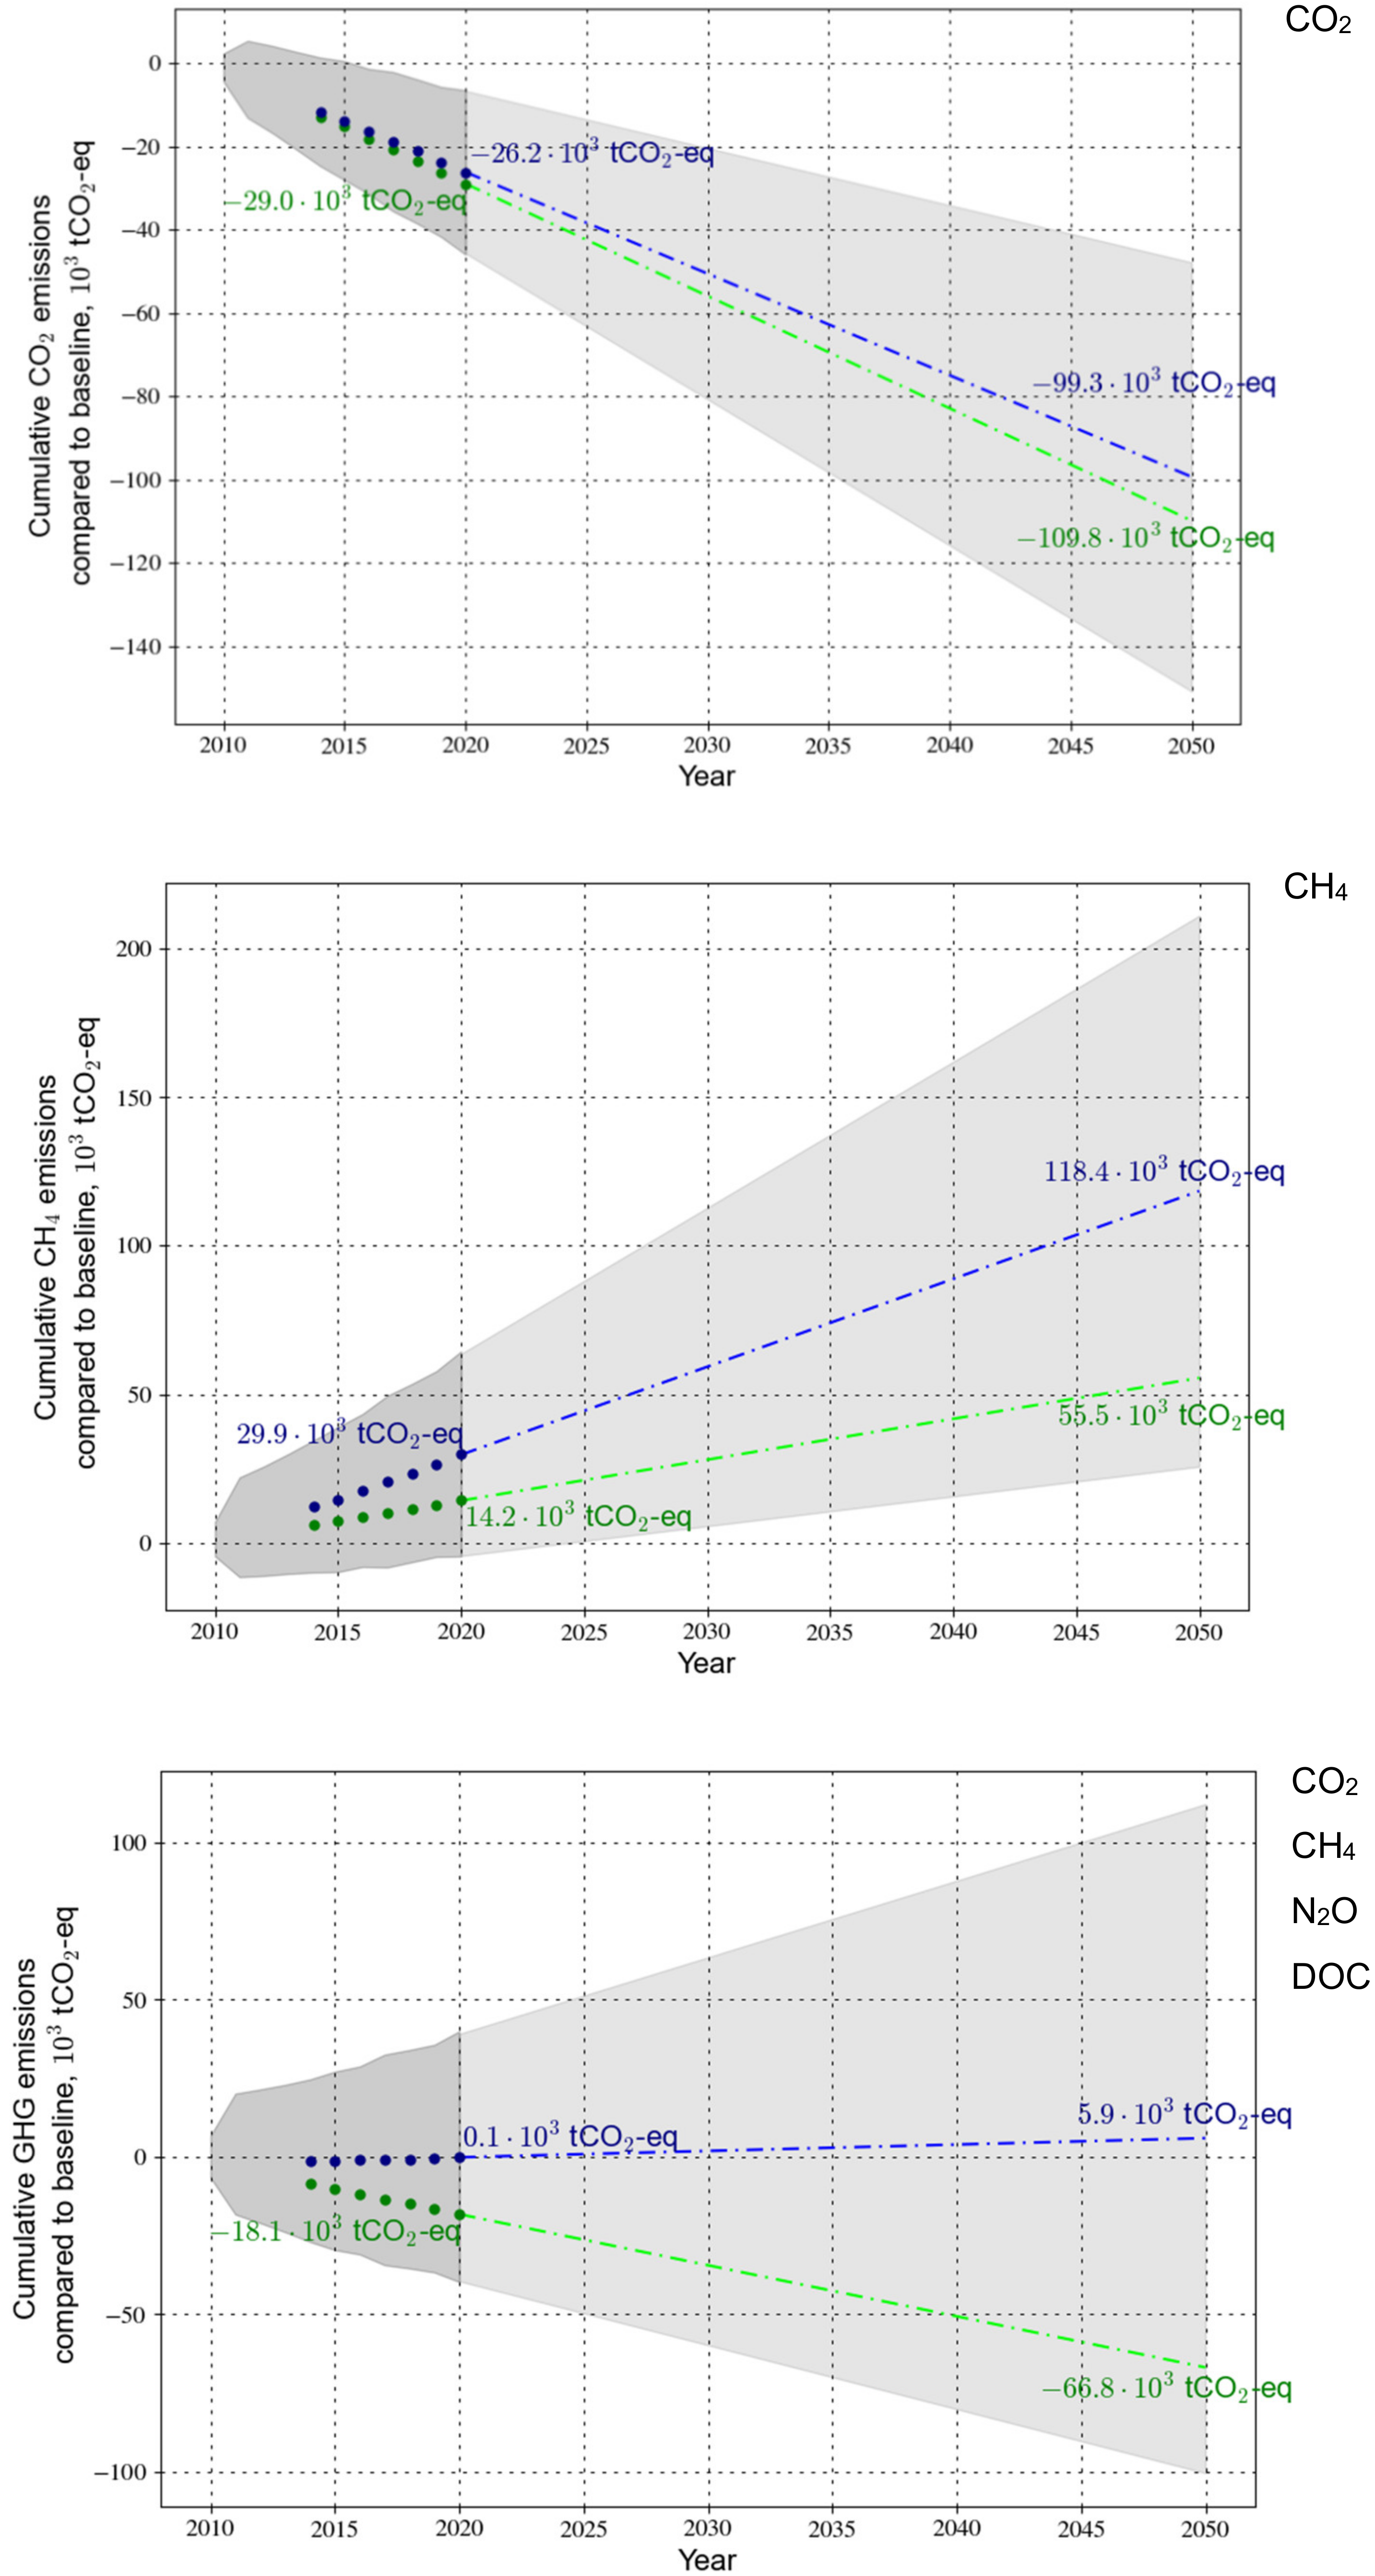
3.3. GHG Emissions Reduction for Regional and National Reporting

The area occupied by “wet grassland” and “water” in the Moscow Region peatlands varied between years. In general, variation was consistent with the dynamics discussed for the Radovitsky Mokh peatland. In 2020, these classes covered 5644 ha and 2586 ha in the Moscow Region, respectively (Table 5), corresponding to 7 and 5% of the area of the objects, where rewetting measures had been undertaken. Smaller sites, up to some tens of ha flooded sites, which had resulted from previous rewetting initiatives, were not taken into account in this assessment.
Moreover, when taking the increased CH4 emissions into account, the overall GHG emission reduction by rewetting was more than 32,000 tCO2-eq year−1 (Table 6). This amount will further increase by progressive rewetting and expansion of areas related to “wet grassland” and “water”.
The main reduction in GHG emissions came from CO2. The areas occupied by “wet grassland” contributed the most, both by their larger area and by the larger change in EFs. In “wet grassland”, more photosynthesis takes place than in water surfaces and part of the organic matter produced is stored long-term in the more copious biomass, in the accumulated litter and eventually in the peat. A further reduction in CO2 emissions can be expected both through increasing wetting of the area and through the overgrowth of flooded areas.
All the considerations above have implications for the GHG balance of the sites. However, only the “permanently” rewetted areas, i.e., the “wet grassland” and “water” can, in our view, be considered to have changed in the IPCC land category. In the national reporting of the Russian Federation [38], they were moved from ‘peatlands under extraction’ to the new IPCC category ‘rewetted peatlands’.

4. Discussion

Due to the large uncertainties in the EFs, and especially those of methane, emission reduction has a large range of possible values, which can be approximated by a normal distribution (Figure 8). Actual emission reductions from a concrete site may, with a probability of 95%, lie between the confidence limits. The calculated values were obtained by substituting the emission factors into Equation (1), and the mean values were calculated according to the distribution of random values. The calculated and average values differ from each other because of the asymmetric uncertainties of the emission coefficients. Therefore, the emission estimates made according to Equation (1) will also differ from the mean. Calculated values have to be used for the reporting, but to understand and forecast, we need to consider mean values as well.
If we assume that the rewetting of the drained peatlands took place at one point in time, we do not need to consider possible changes in the extent of rewetted areas. Without rewetting, annual GHG emissions would lead to an increasing climate burden over time, especially because of the accumulation of the persistent CO2 in the atmosphere [14]. After rewetting, annual GHG emissions would remain lower, resulting in a cumulatively increasing positive climatic effect compared to the drained situation.
Calculations show that CO2 emission reductions for the Radovitsky Mokh peatland cumulatively have reached 29 thousand tons of CO2 in 2020, and will amount to almost 110 thousand tons of CO2 by 2050 (Figure 9). If the increased CH4 emissions after rewetting are taken into account, GHG emission reductions for this single peatland have been over 17 thousand tons CO2-eq. in 2020 and will be over 66 thousand tons CO2-eq. in 2050.
These estimates are conservative. The focus on two clearly wet land cover classes disregards reduced microbial oxidation as a result of higher water levels (which linearly relate to CO2 emissions [55]) in not fully rewetted subareas, the post-fire regrowth of (forest) vegetation, and the emission reduction from preventing further peat fires [16].
Taking these aspects into account may significantly refine the methodology and the assessment results. The EFs of the Wetlands Supplement [10] have meanwhile been updated [13] and new measurements of greenhouse gas fluxes and runoff losses of dissolved organic carbon are emerging. The transition to regionally measured and elaborated CO2, CH4, N2O and DOC country/region specific Tier 2 EFs will allow additional improvements.
National and, if necessary, regional reporting of changes in GHGs emissions from peatland rewetting requires a methodology to assess the relevant area and the changes in GHGs and DOC EFs. In the absence of statistical accounting of rewetted areas in the Russian Federation, we have proposed an approach to identify effectively rewetted areas. We considered only areas that have been “permanently” watered of which the land category allocation (following 2013 Wetland Supplement [10]) has been changed, i.e., areas with “wet grassland” and “water”. With respect to the IPCC land category before rewetting, we have assumed that they were ‘peatlands under extraction’, but (unused) agricultural land—‘grassland’ or ‘cropland’—may apply in other cases. As for forest land on organic soils, and primarily forest-drainage sites, rewetting and related changes of the water regime is not a priority [56] and in Russia even legally forbidden.
Rewetting of abandoned drained peatlands, in addition to meeting the goals of peat fire prevention, improved environmental security and restoration of many of the ecosystem services of peatlands critical to humans, is an effective way to reduce greenhouse gas emissions from land use. As emissions from other sectors decline, the GHGs emissions associated with drained peatlands will increase in relative importance and may become key to keeping global warming below +1.5 to +2 °C. Given the areas of drained and abandoned peatlands in the Russian Federation, their rewetting represents an important but largely overlooked requirement for meeting the Paris Agreement commitments. The implication of that Agreement is that all CO2 emissions must be net zero in 2050, whereas CH4 and N2O emissions have to be reduced, respectively, by 50% and 20% compared to 1990 [57]. This will require substantial effort. The proposed approach is a first step in addressing the monitoring of rewetted unused drained peatlands and mire restoration at the country, regional and project level.

Author Contributions

Conceptualization, A.S., V.K., H.J., T.M.; methodology, A.S., M.M., V.K.; data analysis, M.M., A.S., D.I., G.S.; validation and uncertainties, V.I., M.M., V.K.; writing—original draft preparation, A.S., M.M., V.I., V.K.; writing—review and editing, H.J., A.S., T.M.; visualization, M.M., V.I., A.S., D.I.; supervision, A.S.; project administration, T.M., A.S.; funding acquisition, T.M., A.S. All authors have read and agreed to the published version of the manuscript.

Funding

This research was supported by the Russian Science Foundation (project 19-74-20185) and projects of the International Climate Initiative (IKI) of the Federal Ministry for the Environment, Nature Conservation and Nuclear Safety of the Federal Republic of Germany (BMUB) in the framework of Russian-German cooperation: “Restoring peatlands in Russia—for fire prevention and climate change mitigation” project managed through the German development bank KfW and “Development of Methodological Framework for Including Peatland Rewetting Projects in National Climate Reporting of Russian Federation” managed by GIZ.

Institutional Review Board Statement

Not applicable.

Informed Consent Statement

Not applicable.

Data Availability Statement

Not applicable.

Acknowledgments

The authors are grateful to A. Romanovskaya (Yu. A. Izrael Institute of Global Climate and Ecology) for her advice and assistance in incorporation of rewetted peatlands in the National Cadastre of the Russian Federation and to Kirill Shakhmatov (Tver State Technological University) for Radovitsky Mokh drone photography.

Conflicts of Interest

The authors declare no conflict of interest.

References

  1. Joosten, H.; Sirin, A.; Couwenberg, J.; Laine, J.; Smith, P. The role of peatlands in climate regulation. In Peatland Restoration and Ecosystem Services: Science, Policy and Practice; Bonn, A., Allott, T., Evans, M., Joosten, H., Stoneman, R., Eds.; Cambridge University Press: Cambridge, UK, 2016; pp. 66–79. [Google Scholar] [CrossRef]
  2. Tubiello, F.N.; Biancalani, R.; Salvatore, M.; Rossi, S.; Conchedda, G. A worldwide assessment of greenhouse gas emissions from drained organic soils. Sustainability 2016, 8, 371. [Google Scholar] [CrossRef] [Green Version]
  3. Sirin, A.; Laine, J. Chapter 7: Peatlands and greenhouse gases. In Assessment on Peatlands, Biodiversity and Climate Change: Main Report; Parish, F., Sirin, A., Charman, D., Joosten, H., Minayeva, T., Silvius, M., Stringer, L., Eds.; Global Environment Centre: Kuala Lumpur, Malasia; Wetlands International: Wageningen, The Netherlands, 2008; pp. 118–138. [Google Scholar]
  4. Waddington, J.M.; Tóth, K.; Bourbonniere, R. Dissolved organic carbon export from a cutover and restored peatland. Hydrol. Process. 2008, 22, 2215–2224. [Google Scholar] [CrossRef]
  5. Sirin, A.; Minayeva, T.; Vozbrannaya, A.; Bartalev, S. How to avoid peat fires? Sci. Russ. 2011, 2, 13–21. [Google Scholar]
  6. Huang, X.; Rein, G. Downward spread of smouldering peat fire: The role of moisture, density and oxygen supply. Int. J. Wildland Fire 2017, 26, 907–918. [Google Scholar] [CrossRef]
  7. Sirin, A.; Maslov, A.; Makarov, D.; Gulbe, Y.; Joosten, H. Assessing wood and soil carbon losses from a forest-peat fire in the boreo-nemoral zone. Forests 2021, 12, 880. [Google Scholar] [CrossRef]
  8. Glukhova, T.V.; Sirin, A.A. Losses of soil carbon upon a fire on a drained forested raised bog. Eurasian Soil Sci. 2018, 51, 542–549. [Google Scholar] [CrossRef]
  9. Leifeld, J.; Wüst-Galley, C.; Page, S. Intact and managed peatland soils as a source and sink of GHGs from 1850 to 2100. Nat. Clim. Chang. 2019, 9, 945–947. [Google Scholar] [CrossRef]
  10. Blain, D.; Murdiyarso, D.; Couwenberg, J.; Nagata, O.; Renou-Wilson, F.; Sirin, A.; Strack, M.; Tuittila, E.-S.; Wilson, D.; Evans, C.D.; et al. Chapter 3: Rewetted organic soils. In 2013 Supplement to the 2006 IPCC Guidelines for National Greenhouse Gas Inventories: Wetlands; Hiraishi, T., Krug, T., Tanabe, K., Srivastava, N., Baasansuren, J., Fukuda, M., Troxler, T.G., Eds.; IPCC: Geneva, Switzerland, 2014; p. 41. Available online: https://www.ipcc.ch/publication/2013-supplement-to-the-2006-ipcc-guidelines-for-national-greenhouse-gas-inventories-wetlands/ (accessed on 29 September 2021).
  11. Leifeld, J.; Menichetti, L. The underappreciated potential of peatlands in global climate change mitigation strategies. Nat. Commun. 2018, 9, 1–8. [Google Scholar] [CrossRef] [Green Version]
  12. IPCC 2019. Climate Change and Land: An IPCC Special Report on Climate Change, Desertification, Land Degradation, Sustainable Land Management, Food Security, and Greenhouse Gas Fluxes in Terrestrial Ecosystems; Shukla, P.R., Skea, J., Calvo Buendia, E., Masson-Delmotte, V., Pörtner, H.-O., Roberts, D.C., Zhai, P., Slade, R., Connors, S., van Diemen, R., et al., Eds.; in press; Available online: https://www.ipcc.ch/srccl/ (accessed on 29 September 2021).
  13. Wilson, D.; Blain, D.; Couwenberg, J.; Evans, C.D.; Murdiyarso, D.; Page, S.E.; Renou-Wilson, F.; Rieley, J.O.; Sirin, A.; Strack, M.; et al. Greenhouse gas emission factors associated with rewetting of organic soils. Mires Peat 2016, 17, 1–28. [Google Scholar] [CrossRef]
  14. Günther, A.; Barthelmes, A.; Huth, V.; Joosten, H.; Jurasinski, G.; Koebsch, F.; Couwenberg, J. Prompt rewetting of drained peatlands reduces climate warming despite methane emissions. Nat. Commun. 2020, 11, 1644. [Google Scholar] [CrossRef] [Green Version]
  15. Granath, G.; Moore, P.A.; Lukenbach, M.C.; Waddington, J.M. Mitigating wildfire carbon loss in managed northern peatlands through restoration. Sci. Rep. 2016, 6, 28498. [Google Scholar] [CrossRef] [Green Version]
  16. Sirin, A.A.; Medvedeva, M.A.; Makarov, D.A.; Maslov, A.A.; Joosten, H. Multispectral satellite based monitoring of land cover change and associated fire reduction after large-scale peatland rewetting following the 2010 peat fires in Moscow region. Ecol. Eng. 2020, 158, 106044. (In Russian) [Google Scholar] [CrossRef]
  17. Minayeva, T.Y.; Bragg, O.M.; Sirin, A.A. Towards ecosystem-based restoration of peatland biodiversity. Mires Peat 2017, 19, 1–36. [Google Scholar] [CrossRef]
  18. Ahmad, S.; Haojie, L.; Günther, A.; Couwenberg, J.; Lennartz, B. Long-term rewetting of degraded peatlands restores hydrological buffer function. Sci. Total Environ. 2020, 749, 141571. [Google Scholar] [CrossRef] [PubMed]
  19. Bonn, A.; Reed, M.; Bain, C.; Chris, D.E.; Joosten, H.; Farmer, J.; Emmer, I.; Couwenberg, J.; Moxey, A.; Artz, R.; et al. Investing in nature: Developing ecosystem service markets for peatland restoration. Ecosyst. Serv. 2014, 9, 54–65. [Google Scholar] [CrossRef] [Green Version]
  20. Global Peatland Database. Available online: https://www.greifswaldmoor.de/global-peatland-database-en.html (accessed on 28 August 2021).
  21. Vomperskij, S.E.; Sirin, A.A.; Tsyganova, O.P.; Valyaeva, N.A.; Majkov, D.A. Peatlands and paludified lands of Russia: Attempt of analyses of spatial distribution and diversity. Izv. RAN Geogr. Ser. 2005, 5, 39–50. (In Russian) [Google Scholar]
  22. Vompersky, S.E.; Sirin, A.A.; Salnikov, A.A.; Tsyganova, O.P.; Valyaeva, N.A. Estimation of forest cover extent over peatland and paludified shallow peatlands in Russia. Contemp. Probl. Ecol. 2011, 4, 734–741. [Google Scholar] [CrossRef]
  23. Minayeva, T.; Sirin, A.; Bragg, O. (Eds.) A Quick Scan of Peatlands in Central and Eastern Europe; Wetlands International: Wageningen, The Netherlands, 2009; p. 132. Available online: https://www.wetlands.org/publications/a-quick-scan-of-peatlands-in-central-and-eastern-europe/ (accessed on 29 September 2021).
  24. Sirin, A.; Minayeva, T.; Yurkovskaya, T.; Kuznetsov, O.; Smagin, V.; Fedotov, Y.U. Russian federation (European part). In Mires and Peatlands of Europe: Status, Distribution and Conservation; Joosten, H., Tanneberger, F., Moen, A., Eds.; Schweizerbart Science Publishers: Stuttgart, Germany, 2017; pp. 589–616. [Google Scholar] [CrossRef]
  25. Tanneberger, F.; Tegetmeyer, C.; Busse, S.; Barthelmes, A.; Shumka, S.; Mariné, A.M.; Jenderedjian, K.; Steiner, G.M.; Essl, F.; Etzold, J.; et al. The peatland map of Europe. Mires Peat 2017, 19, 1–17. [Google Scholar] [CrossRef]
  26. Tanneberger, F.; Moen, A.; Barthelmes, A.; Lewis, E.; Miles, L.; Sirin, A.; Tegetmeyer, C.; Joosten, H. Mires in Europe—Regional diversity, condition and protection. Diversity 2021, 13, 381. [Google Scholar] [CrossRef]
  27. Panov, V.V. (Ed.) Perspective Use of Depleted Peat Bogs; Triada Publ.: Tver, Russia, 2013; p. 280. (In Russian) [Google Scholar]
  28. Sirin, A.A.; Minaeva, T.Y. Peatlands of Russia: Towards the Analysis of Sectoral Information; GEOS Publ.: Moscow, Russia, 2001; p. 190. (In Russian) [Google Scholar]
  29. Romanovskaya, A.A.; Korotkov, V.N.; Smirnov, N.S.; Karaban’, R.T.; Trunov, A.A. Land use contribution to the anthropogenic emission of greenhouse gases in Russia in 2000–2011. Russ. Meteorol. Hydrol. 2014, 39, 137–145. [Google Scholar] [CrossRef]
  30. Blain, D.; Row, C.; Alm, J.; Byrne, K.; Parish, F.; Duchemin, É.; Huttunen, J.T.; Tremblay, A.; Delmas, R.; Menezes, C.F.S.; et al. Agriculture, forestry and other land use. In IPCC Guidelines for National Greenhouse Gas Inventories; Chapter 7: Wetlands; Eggleston, H.S., Buendia, L., Miwa, K., Ngara, T., Tanabe, K., Eds.; IGES: Kanagawa, Japan, 2006; Volume 4, p. 24. Available online: https://www.ipcc.ch/report/2006-ipcc-guidelines-for-national-greenhouse-gas-inventories/ (accessed on 29 September 2021).
  31. IPCC. Refinement to the 2006 IPCC Guidelines for National Greenhouse Gas Inventories; Calvo Buendia, E., Tanabe, K., Kranjc, A., Baasansuren, J., Fukuda, M., Ngarize, S., Osako, A., Pyrozhenko, Y., Shermanau, P., Federici, S., Eds.; IPCC: Geneva, Switzerland, 2019; Available online: https://www.ipcc.ch/report/2019-refinement-to-the-2006-ipcc-guidelines-for-national-greenhouse-gas-inventories/ (accessed on 29 September 2021).
  32. Medvedeva, M.A.; Vozbrannaya, A.E.; Sirin, A.A.; Maslov, A.A. Capabilities of multispectral remote-sensing data in an assessment of the status of abandoned fire hazardous and rewetting peat extraction lands. Izv. Atmos. Ocean. Phys. 2017, 53, 1070–1078. [Google Scholar] [CrossRef]
  33. Suvorov, G.G.; Chistotin, M.V.; Sirin, A.A. The carbon losses from a drained peatland in Moscow oblast used for peat extraction and agriculture. Agrochemistry 2015, 11, 51–62. (In Russian) [Google Scholar]
  34. Joosten, H. The Global Peatland CO2 Picture; Wetlands International: Wageningen, The Netherlands, 2010; p. 35. Available online: https://www.wetlands.org/publications/the-global-peatland-co2-picture/ (accessed on 29 September 2021).
  35. Briefing Paper on the Role of Peatlands in the New European Union’s Common Agriculture Policy (CAP); Greifswald Mire Centre: Greifswald, Germany, 2019; Available online: https://greifswaldmoor.de/files/dokumente/Infopapiere_Briefings/GMC-briefing%20paper_CAP_final.pdf (accessed on 29 September 2021).
  36. Water Code of the Russian Federation 03.06.2006. No. 74-FZ (Red. ot 08.12.2020). The Law Came into Force 01.01.2021. Available online: https://policy.asiapacificenergy.org/node/826 (accessed on 29 September 2021). (In Russian).
  37. Sirin, A.A.; Maslov, A.A.; Valyaeva, T.A.; Tsyganova, O.P.; Glukhova, T.V. Mapping of peatlands in the Moscow oblast based on high resolution remote sensing data. Contemp. Probl. Ecol. 2014, 7, 809–815. [Google Scholar] [CrossRef]
  38. National Report on the Inventory of Anthropogenic Emissions by Sources and Removals by Sinks of Greenhouse Gases Not Regulated by the Montreal Protocol for 1990–2019. Part 2. Applications. Appendix 3.4 Information on the Rewetted Peatlands of the Russian Federation. Moscow, Russian, 2021; pp. 71–79. Available online: https://unfccc.int/documents/273477 (accessed on 29 September 2021). (In Russian).
  39. Hytteborn, H.; Maslov, A.A.; Nazimova, D.I.; Rysin, L.P. Boreal forests of Eurasia. In Coniferous Forests; Andersson, F., Goodall, D.W., Eds.; Ecosystems of the World: Amsterdam, The Netherlands; Elsevier: Amsterdam, The Netherlands, 2005; Volume 6, pp. 23–99. [Google Scholar]
  40. Barriopedro, D.; Fischer, E.M.; Luterbacher, J.; Trigo, R.M.; García-Herrera, R. The hot summer of 2010: Redrawing the temperature record map of Europe. Science 2011, 332, 220–224. [Google Scholar] [CrossRef] [PubMed] [Green Version]
  41. Konovalov, I.B.; Beekmann, M.; Kuznetsova, I.N.; Yurova, A.; Zvyagintsev, A.M. Atmospheric impacts of the 2010 Russian wildfires: Integrating modelling and measurements of an extreme air pollution episode in the Moscow region. Atmos. Chem. Phys. 2011, 11, 10031–10056. [Google Scholar] [CrossRef] [Green Version]
  42. Shaposhnikov, D.; Revich, B.; Bellander, T.; Bedada, G.B.; Bottai, M.; Kharkova, T.; Kvasha, E.; Lezina, E.; Lind, T.; Semutnikova, E.; et al. Mortality related to air pollution with the Moscow heat wave and wildfire of 2010. Epidemiology 2014, 25, 359–364. [Google Scholar] [CrossRef] [PubMed] [Green Version]
  43. Shaposhnikov, D.; Revich, B.; Bellander, T.; Bedada, G.B.; Bottai, M.; Kharkova, T.; Kvasha, E.; Lind, T.; Pershagen, G. Long-term impact of Moscow heat wave and wildfires on mortality. Epidemiology 2015, 26, 21–22. [Google Scholar] [CrossRef]
  44. Medvedeva, M.A.; Vozbrannaya, A.E.; Bartalev, S.A.; Sirin, A.A. Multispectral remote sensing for assessing changes on abandoned peat extraction lands. Earth Obs. Remote Sens. 2011, 5, 80–88. (In Russian) [Google Scholar]
  45. Medvedeva, M.A.; Vozbrannaya, A.E.; Sirin, A.A.; Maslov, A.A. Potential of different multispectral satellite data for monitoring abandoned fire hazardous peatlands and rewetting effectiveness. Mod. Probl. Remote Sens. Earth Space 2019, 16, 150–159. [Google Scholar] [CrossRef]
  46. Sirin, A.; Medvedeva, M.; Maslov, A.; Vozbrannaya, A. Assessing the land and vegetation cover of abandoned fire hazardous and rewetted peatlands: Comparing different multispectral satellite data. Land 2018, 7, 71. [Google Scholar] [CrossRef] [Green Version]
  47. Maslov, A.A.; Gul’be, A.Y.; Gul’be, Y.I.; Medvedeva, M.A.; Sirin, A.A. Assessment of the situation with the overgrowth of agricultural lands with forest vegetation on the example of the Uglich district of the Yaroslavl region. Sustain. For. Manag. 2016, 4, 6–14. (In Russian) [Google Scholar]
  48. Olofsson, P.; Foody, G.M.; Herold, M.; Stehman, S.V.; Woodcock, C.E.; Wulder, M.A. Good practices for estimating area and assessing accuracy of land change. Remote Sens. Environ. 2014, 148, 42–57. [Google Scholar] [CrossRef]
  49. Labutina, I.A. Interpretation of Remote Sensing Images: A Textbook for University Students; Aspekt Press: Moscow, Russia, 2004; p. 184. (In Russian) [Google Scholar]
  50. Chistotin, M.V.; Sirin, A.A.; Dulov, L.E. Seasonal dynamics of carbon dioxide and methane emission from a peatland in Moscow region drained for peat extraction and agricultural use. Agrochemistry 2006, 6, 54–62. (In Russian) [Google Scholar]
  51. Rydin, H.; Jeglum, J.K. The Biology of Peatlands; University Press: Oxford, UK, 2006; p. 162. [Google Scholar]
  52. Sirin, A.A.; Suvorov, G.G.; Chistotin, M.V.; Glagolev, M.V. Values of methane emission from drainage ditches. Environ. Dyn. Glob. Clim. Chang. 2012, 3, 1–10. (In Russian) [Google Scholar] [CrossRef] [Green Version]
  53. Kravchenko, I.; Kizilova, A.; Menko, E.; Sirin, A. Methane cycling microbial communities in natural and drained sites of taldom peatland, Moscow region, Russia. Annu. Res. Rev. Biol. 2015, 6, 121–132. [Google Scholar]
  54. IPCC. Good Practice Guidance and Uncertainty Management in National Greenhouse Gas Inventories; Methodology Report; Penman, J., Kruger, D., Galbally, I., Hiraishi, T., Nyenzi, B., Emmanul, S., Buendia, L., Hoppaus, R., Martinsen, T., Meijer, J., et al., Eds.; IGES: Kanagawa, Japan, 2000; Available online: https://www.ipcc.ch/publication/good-practice-guidance-and-uncertainty-management-in-national-greenhouse-gas-inventories/ (accessed on 29 September 2021).
  55. Couwenberg, J.; Thiele, A.; Tanneberger, F.; Augustin, J.; Bärisch, S.; Dubovik, D.; Liashchynskaya, N.; Michaelis, D.; Minke, M.; Skuratovich, A.; et al. Assessing greenhouse gas emissions from peatlands using vegetation as a proxy. Hydrobiologia 2011, 674, 67–89. [Google Scholar] [CrossRef]
  56. Abel, S.; Haberl, A.; Joosten, H. A Decision Support System for Degraded Abandoned Peatlands Illustrated by Reference to the Peatlands of the Russian Federation; Michael Succow Foundation for Protection of Nature: Greifswald, Germany, 2011; pp. 1–52. [Google Scholar]
  57. IPCC 2018. An IPCC Special Report on the Impacts of Global Warming of 1.5 °C Above Pre-Industrial Levels and Related Global Greenhouse Gas Emission Pathways, in the Context of Strengthening the Global Response to the Threat of Climate Change, Sustainable Development, and Efforts to Eradicate Poverty; Masson-Delmotte, V., Zhai, P., Pörtner, H.-O., Roberts, D., Skea, J., Shukla, P.R., Pirani, A., Moufouma-Okia, W., Péan, C., Pidcock, R., et al., Eds.; in press; Available online: https://www.ipcc.ch/sr15/ (accessed on 29 September 2021).
Figure 1. Part of Radovitsky Mokh peatland, rewetted in 2010 in Moscow Region, Central European Russia. Drone photography of 7 October 2020, altitude 70 m. Courtesy of Kirill Shakhmatov. a—wet grassland, b—water.
Land 10 01200 g001
Figure 2. Peatlands of Moscow Region and peatlands rewetted under the 2010–2013 regional program. Peatlands include both drained and remaining undrained mires [37]. Radovitstky Mokh described in the paper is shown in light blue. Inset: IPCC Climate zones after IPCC [31].
Land 10 01200 g002
Figure 3. Average values of spectral radiance from different sensors for the classes “wet grassland” and “water” in comparison to other land cover classes. R = Red; N = near-infrared NIR; S2 = short-wave infrared SWIR2, S3 = short-wave infrared SWIR3.
Land 10 01200 g003
Figure 4. “Wet grassland” with cattail, sedge, reeds, and other wetland plants (above), “water”–open water bodies formed mainly after rewetting (below).
Land 10 01200 g004
Figure 5. Uncertainty assessment of the boundaries of the land cover classes “wet grassland” (light blue) and “water” (blue) identified by remote sensing. The darker color indicates “boundary” pixels to which the uncertainty assessment applies. Grey reflects not-considered land cover classes. Pixel size depends on the resolution of the satellite imagery.
Land 10 01200 g005
Figure 6. Areas occupied by “wet grassland” and “water” before and in every year after rewetting in Radovitsky Mokh peatland (1535 ha), Moscow Region. Red and blue arrows are fires and rewetting, respectively.
Land 10 01200 g006
Figure 7. Changes in area of “wet grassland” and “water” before and after rewetting (starting from 2010) in part of Radovitsky Mokh peatland (1534.8 ha), Moscow Region (left) and the relation between percentage of “water” and cumulative precipitation (in mm) over the previous 30 days (right).
Land 10 01200 g007
Figure 8. Probability density function of GHG emissions reduction for Radovitsky Mokh in 2020. Green dot—calculated value, blue dot—mean value, red dots—95% confidence limits.
Land 10 01200 g008
Figure 9. GHG emission changes after rewetting by cumulative total for the period 2010–2020 (dots) and forecast for the period up to 2050 (dashed line) for testing area of the Radovitsky Mokh peatland (1535 ha) Moscow Region: calculated according to Equation (1) (green) and mean according to the probability of distribution (blue).
Land 10 01200 g009
Table 1. Full error matrices and accuracy of classification results relative to ground data.
Satellite/Ground DataHydrophilic VegetationWater SurfacesΣUser’s Accuracy Producer’s AccuracyOverall Accuracy
Hydrophilic vegetation2612796.3100
Water surfaces02727100.096.4
Σ262854 98.15
Table 2. Emission factors (EFs) for peat extraction [10].
AgentUnitsEF * (95% Confidence Interval)Reference
CO2tCO2-C ha−1 yr−12.8 (1.1–4.2) **[10], Table 2.1
DOC0.31 (0.19–0.46) ***[10], Table 2.2
CH4 soilkgCH4-C ha−1 yr−16.1 (1.6–11) **[10], Table 2.3
CH4 ditch542 (102–981) **[10], Table 2.4
N2OkgN2O-N ha−1 yr−10.3 (−0.03–0.64) **[10], Table 2.5
* mean; ** boreal and temperate; *** temperate; CH4 soil and CH4 ditch: CH4 emission from the soil surface and from the ditch.
Table 3. Emission factors (EFs) for rewetted peatlands (modified after [10,31]).
AgentUnitsEF * (95% Confidence Interval)Reference
‘Rewetted organic soils‘ [10]
CO2tCO2-C ha−1 yr−10.50 (−0.71–1.71) **[10], Table 3.1
DOC0.24 (0.14–0.36) ***[10], Table 3.2
CH4 soilkgCH4-C ha−1 yr−1216 (0–856) **[10], Table 3.3
CH4 ditch84.7 (78.8–90.6) ****
N2OkgN2O-N ha−1 yr−1negligible[10], page 3.19
‘Flooded land’ [31]
CO2тCO2-C ha−1 yr−11.02 (1.00–1.04) ****[31], Table 7.13
DOC 0
CH4 soilkgCH4 ha−1 yr−184.7 (78.8–90.6) ****[31], Table 7.15
CH4 ditch
N2OkgN2O-N ha−1 yr−1[31], page 7.24
* mean; ** temperate rich; *** temperate; **** cool temperate; CH4 soil and CH4 ditch: CH4 emission from soil surface and from ditches; CH4 emissions from ditches after rewetting are assumed to be equal to the emissions from ‘flooded land’; DOC export from flooded land is assumed to be “0” because of no runoff from rewetted areas (process discharges are not considered); under Tier 1, N2O emissions from rewetted soils are assumed to be negligible [31]; N2O emissions from flooded land are not considered; N2O emissions from aquatic systems are indirect and if existing are related to other managed lands [31].
Table 4. Changes of emission factors (EFs) for peat extraction sites after rewetting and conversion to other land categories according to [10].
AgentUnitsEF * (95% Confidence Interval)
‘Rewetted organic soils’ [10]
CO2tCO2-C ha−1 yr−1−2.3 (−4.4…−0.4)
DOC−0.07 (−0.25…0.11)
CH4 soilkgCH4-C ha−1 yr−1210 (1…434)
CH4 ditch−457 (−837…172)
N2OkgN2O-N ha−1 yr−1−0.3 (−0.64...0.03)
‘Flooded land’ [31]
CO2tCO2-C ha−1 yr−1−1.78 (−3.43…−0.41)
DOC−0.31 (−0.50…0.15)
CH4 soilkgCH4-C ha−1 yr−178.6 (70.7…86.2)
CH4 ditch−457 (−887.2…−27.4)
N2OkgN2O-N ha−1 yr−1−0.3 (−0.64...0.03)
* calculated value; CH4 soil and CH4 ditch: CH4 emission from soil surface and ditches.
Table 5. Emissions before and after rewetting and resulting emission reductions in 2020 (in 103 t CO2-eq yr−1) in Radovitsky Mokh peatland (calculated value and 95% confidence interval).
AgentBefore RewettingAfter RewettingEmission Reduction
CO23.67 (−3…10)0.92 (−4…6)2.75 (−11…6)
DOC0.41 (−0.1…1.0)0.19 (−0.2…0.6)0.22 (0.9…0.5)
CH40.39 (−0.5…1.3)1.9 (−11…18)−1.52 (−11…18)
N2O0.05 (−0.1…0.2)0 (0…0)0.05 (−0.2…0.1)
Total 1.5 (−16…17)
Table 6. Changes in emissions by peatland rewetting in Moscow Region in 2020, compared to the situation before rewetting (calculated value and 95% confidence interval).
Agent“Wet Grassland”“Water”Total
103 tCO2-eq yr−1
CO2−47.6 (−250…160)−16.9 (−65…35)−64.5 (−270…150)
DOC−1.4 (−20…16)−2.9 (−8…1)−4.4 (−23…14)
CH433.2 (−300…465)4.5 (−2…11)37.7 (−300…470)
N2O−0.8 (−5…4)−0.4 (−2…1)−1.2 (−6…3)
Total −32.3 (−415…460)
Publisher’s Note: MDPI stays neutral with regard to jurisdictional claims in published maps and institutional affiliations.

