Article

Quantifying Cereal Productivity on Sandy Soil in Response to Some Soil-Improving Cropping Systems

1
Institute of Agrophysics, Polish Academy of Sciences, Doświadczalna 4, 20-290 Lublin, Poland
2
Faculty of Civil Engineering and Environmental Sciences, Bialystok University of Technology, Wiejska 45 E, 15-351 Białystok, Poland
*
Author to whom correspondence should be addressed.
Land 2021, 10(11), 1199; https://doi.org/10.3390/land10111199
Submission received: 19 October 2021 / Revised: 2 November 2021 / Accepted: 4 November 2021 / Published: 5 November 2021

Abstract

:
Little information is available on the effect of soil-improving cropping systems (SICS) on crop productivity on low fertility sandy soils although they are increasingly being used in agriculture in many regions of the world due to the growing demand for food. The study aimed at quantifying the effect of four soil-improving cropping systems applied on sandy soil on cereal productivity (yield of grain and straw and plant height) in a 4-year field experiment conducted in Poland with spring cereal crops: oat (2017), wheat (2018), wheat (2019), and oat (2020). The experiment included the control (C) and the following SICS: liming (L), leguminous catch crops for green manure (LU), farmyard manure (M), and farmyard manure + liming + leguminous catch crops for green manure together (M + L + LU). To quantify the effect of the SICS, classic statistics and the Bland–Altman method were used. It was shown that all yield trait components significantly increased in the last study year (2020) under SICS with M and M + L + LU. All yield trait components were significantly lower in the dry years (2018–2019) than in the wet years (2017 and 2020). The relatively large rainfall quantity in May during intensive growth at shooting and the scarce precipitation during later growth in the dry year 2019 resulted in a significantly greater straw yield compared to the other dry year 2018. The values of Bland–Altman bias (mean difference between the particular SICS and the control) varied (in kg m−2) from −0.002 for LU in 2019 to 0.128 for M and 0.132 for M + L + LU in 2020. The highest limits of agreement (LoA) were in general noted for all yield trait components (the least even yield) in the most productive SICS including M and M + L + LU in the wet year 2020. The Bland–Altman ratio (BAR) values indicate that quantification of the effects of all soil-improving practices was most uncertain in the dry year 2018 for the grain yield and in the wet year 2020 for the straw yield and much less uncertain for the plant height in all SICS and study years. The results of this study provide helpful information about the effect of the SICS on the different yield trait components depending on the period of their application and weather conditions prevailing during the growing season.

1. Introduction

Sandy soils cover globally approximately 900 million ha [1]. They occur in different regions across the world [2,3,4], particularly in arid or semi-arid regions [5]. In Poland, around 50 percent of soils developed from sands [6,7].
Sandy soils are characterized by low crop productivity. This is mostly attributed to a weakly developed aggregated structure [8], high saturated hydraulic conductivity and permeability and low water-retention capacity due to the high contribution of large pores between sand particles [9,10,11], low nutrient levels, and poor ability to store and exchange nutrients [1]. Furthermore, after rapid dewatering, the large pores become air-filled first and act as a barrier (discontinuity) to water flow through the smaller pores towards the plant roots in unsaturated soil conditions [12,13].
Another threat limiting crop production on sandy soils is their acidity due to the presence of acid from the post-glacial acidified parent material, leaching exchangeable base cations [14,15], and chemical N fertilization [16]. Soil acidity limits crop productivity by increasing Al3 + toxicity leading to production of short, thick, and shallow plant roots and deficiency of some nutrients in the soil solution [12]. Instead, sandy soils require rather low energy inputs for tillage [17] and warm up rapidly in the spring prior to the growing season to achieve the minimum soil temperature for plant growth [12].
Despite low fertility and quality, sandy soils are increasingly being used for crop production due to the shortage of agricultural land resources [1,18,19] as well as the growing population and demand for food [20,21]. However, arable farming on these soils require large amounts of irrigation and nutrient inputs [22,23] in many areas, which reduces the profitability of agricultural products.
There is a broad agreement that water and nutrient supply for plant growth in sandy soils can be improved by increasing organic matter content [1,24,25,26,27,28]. This is related to the fact that soil organic matter increases plant available water capacity [21,29] by reducing pore diameter [30] and improves the capability of soils to retain and exchange nutrient cations and hold hydrogen ions, thereby neutralizing soil acidity [31]. Furthermore, increase in soil organic carbon (SOC) content in sandy soils is responsible for variation in cation exchange capacity [1].
There are many soil-improving cropping systems to maintain or increase the SOM content. They include application of organic amendments and diversified crop rotation favoring formation of stable soil aggregates, which protect soil organic carbon (SOC) from mineralization [27,32]. Inclusion of legumes fixing nitrogen from the atmosphere in crop rotation reduces the need for mineral nitrogen fertilization, thereby increasing profitability in crop production [33,34,35], and is one of the ways to meet greening requirements [36]. Furthermore, these practices are important in terms of increasing cereal-based crop rotations that along with conventional treatments (plough) disintegrate soil organic matter by physical disturbance of the soil structure and stability [27]. Increasing the soil organic matter content is part of the global strategy to enhance carbon sequestration stocks, reduce chemical leaching [1,32,37,38], and create drought resilient soils to mitigate global warming effects [21,39].
The aim of the work was to quantify the effect of different soil-improving practices, including application of farmyard manure, liming, and catch crops, on cereal productivity of sandy soil in a 4-year experiment with the use of the statistical Bland–Altman method [40,41]. Plotting the yield differences between a given treatment and the control against their averages and determining the average difference (bias), limits of agreement, and confidence intervals in this method allow quantifying the direct effect of the examined soil-improving cropping systems on crop yields. The Bland–Altman method is widely used in medicine (e.g., [42,43,44]) and in some satellite research [45,46]. More recent studies showed usefulness of this approach to quantify pure effects of agricultural practices on crop yield and soil physical properties [47,48] and the agreement between methods for determining the Atterberg plastic and liquid limits of soils [49]. This study was inspired by recent literature reviews indicating that, despite their importance, sandy soils have received less research attention compared to other soils [1,5].

2. Materials and Method

2.1. Study Area and Field Experiment

The field experiment (350 × 35 m) was localized in a private farm in Szaniawy, Podlasie region, Poland (51°58′56.5″ N 22°32′22.1″ E) on Podzol soil [50] derived from sandy material of glacial origin. The soil contains 62.9% of sand (2–0.05 mm), 34.8% of silt (0.05–0.002 mm), 2.2% of clay (<0.002 mm), and 0.8% of organic carbon and has pH 4.0 (in H20) and cation exchange capacity 12.3 cmol kg−1. Such and similar soils predominate in the region and in Poland. A randomized field-experiment was established in autumn 2016 and conducted for four years with the following spring cereal crops: oats (Avena sativa L.) (2017), wheat (Triticum aestivum L.) (2018), wheat (2019), and oats (2020), which predominate in the crop rotation of the region.
The experiment included the following 5 treatments: (C) control, (L) liming with 5.6 t ha−1 CaCO3 (applied once in autumn 2016), (LU) catch crops for green manure including yellow lupin (Lupinus luteus L.) with seeding rates in brackets (130 kg ha−1), serradella (Ornithopus sativus) (30 kg ha−1), and phacelia (Phacelia tanacetifolia Benth.) (3 kg ha−1) sown every year, (M) farmyard manure applied at 30 t ha−1 every year in autumn), and (M + L + LU) manure (10 t ha−1) + liming with 5.6 t ha−1 CaCO3 + catch crops for green manure including lupines with seeding rates in brackets (130 kg ha−1), serradella (30 kg ha−1), and phacelia (3 kg ha−1) (applied every year), except liming only in autumn 2016. Yellow lupine, serradella, and phacelia are common plants used for green manures in Poland. Each treatment had three replicate plots (35 × 20 m) separated by a 1.0-m margin between the plots. The grain yield, straw yield, and plant height were measured in nine one-square-meter sub-plots in each of the five treatments (three sub-plots × three replicate plots).
Stubble tillage (10 cm) using a cultivator plus tooth harrows was done after harvesting in all treatments (first half of August) and then catch crops were sown in treatments LU and M + L + LU. Next, mouldboard ploughing (20–25 cm) in late autumn and disking (10 cm) and tooth harrowing (6 cm) in spring (2nd half of March) were applied in all treatments (1st half of April) to prepare the seedbed for spring cereals. The autumn ploughing in M and M + L + LU also ploughed down the catch crops for green manure. Weed control and crop protection were carried out by herbicides, insecticides, and fungicides used in the farm where the experiment was conducted in the same manner in all treatments. All management practices were done using light wheel tractors (2.5 to 3.5 Mg mass) to minimize soil compaction effects on crop yield.

2.2. Descriptive Statistics

Descriptive statistics including the mean, standard deviation, coefficient of variation, minimum and maximum values, skewness, and kurtosis were calculated for each yield trait. Pearson correlation coefficients between the yield trait components within the particular years and between the years were determined using STATISTICA 12 PL (StatSoft 2019).

2.3. Bland–Altman Method

The Bland–Altman statistics was adopted to determine the separate effect of the different SICS vs. control plots on the cereal yield trait components. In this method, the differences in the cereal yield trait components (grain, straw, and plant height) between the plots with different SICS and the control plots against the average yield with SICS and the control were graphically presented for each study year. The agreement between the yield in the plots with SICS and the control plots was assessed using bias (average of differences between the yield from the plots with SICS and control plots), the limit of agreement (LoA) defined as bias ±1.96 × standard deviation (SD), confidence intervals (CI) for the bias and LoA defined as ± standard error × the value of t distribution with n–1 degrees of freedom, and the Bland–Altman ratio (BAR) defined as the ratio of half the range of LoA to the mean of the pair including the yield from plots with SICS and control plots, the and regression line from the equation y = ax + b, where y—differences between the plots with different SICS and the control plots, x—average yield from plots with SICS and the control, a—regression coefficient, b—intercept. The BAR values were graded as good, moderate, and insufficient for values (BAR < 0), (0.2 ≤ BAR < 0.4), or (BAR ≥ 0.4), respectively [48].
Root mean square residuals (RMSR) and maximum relative residuals (MRR), which are the differences in the yield between the plots with SICS and the control plots, were determined for all yield trait components and each study year.

3. Results

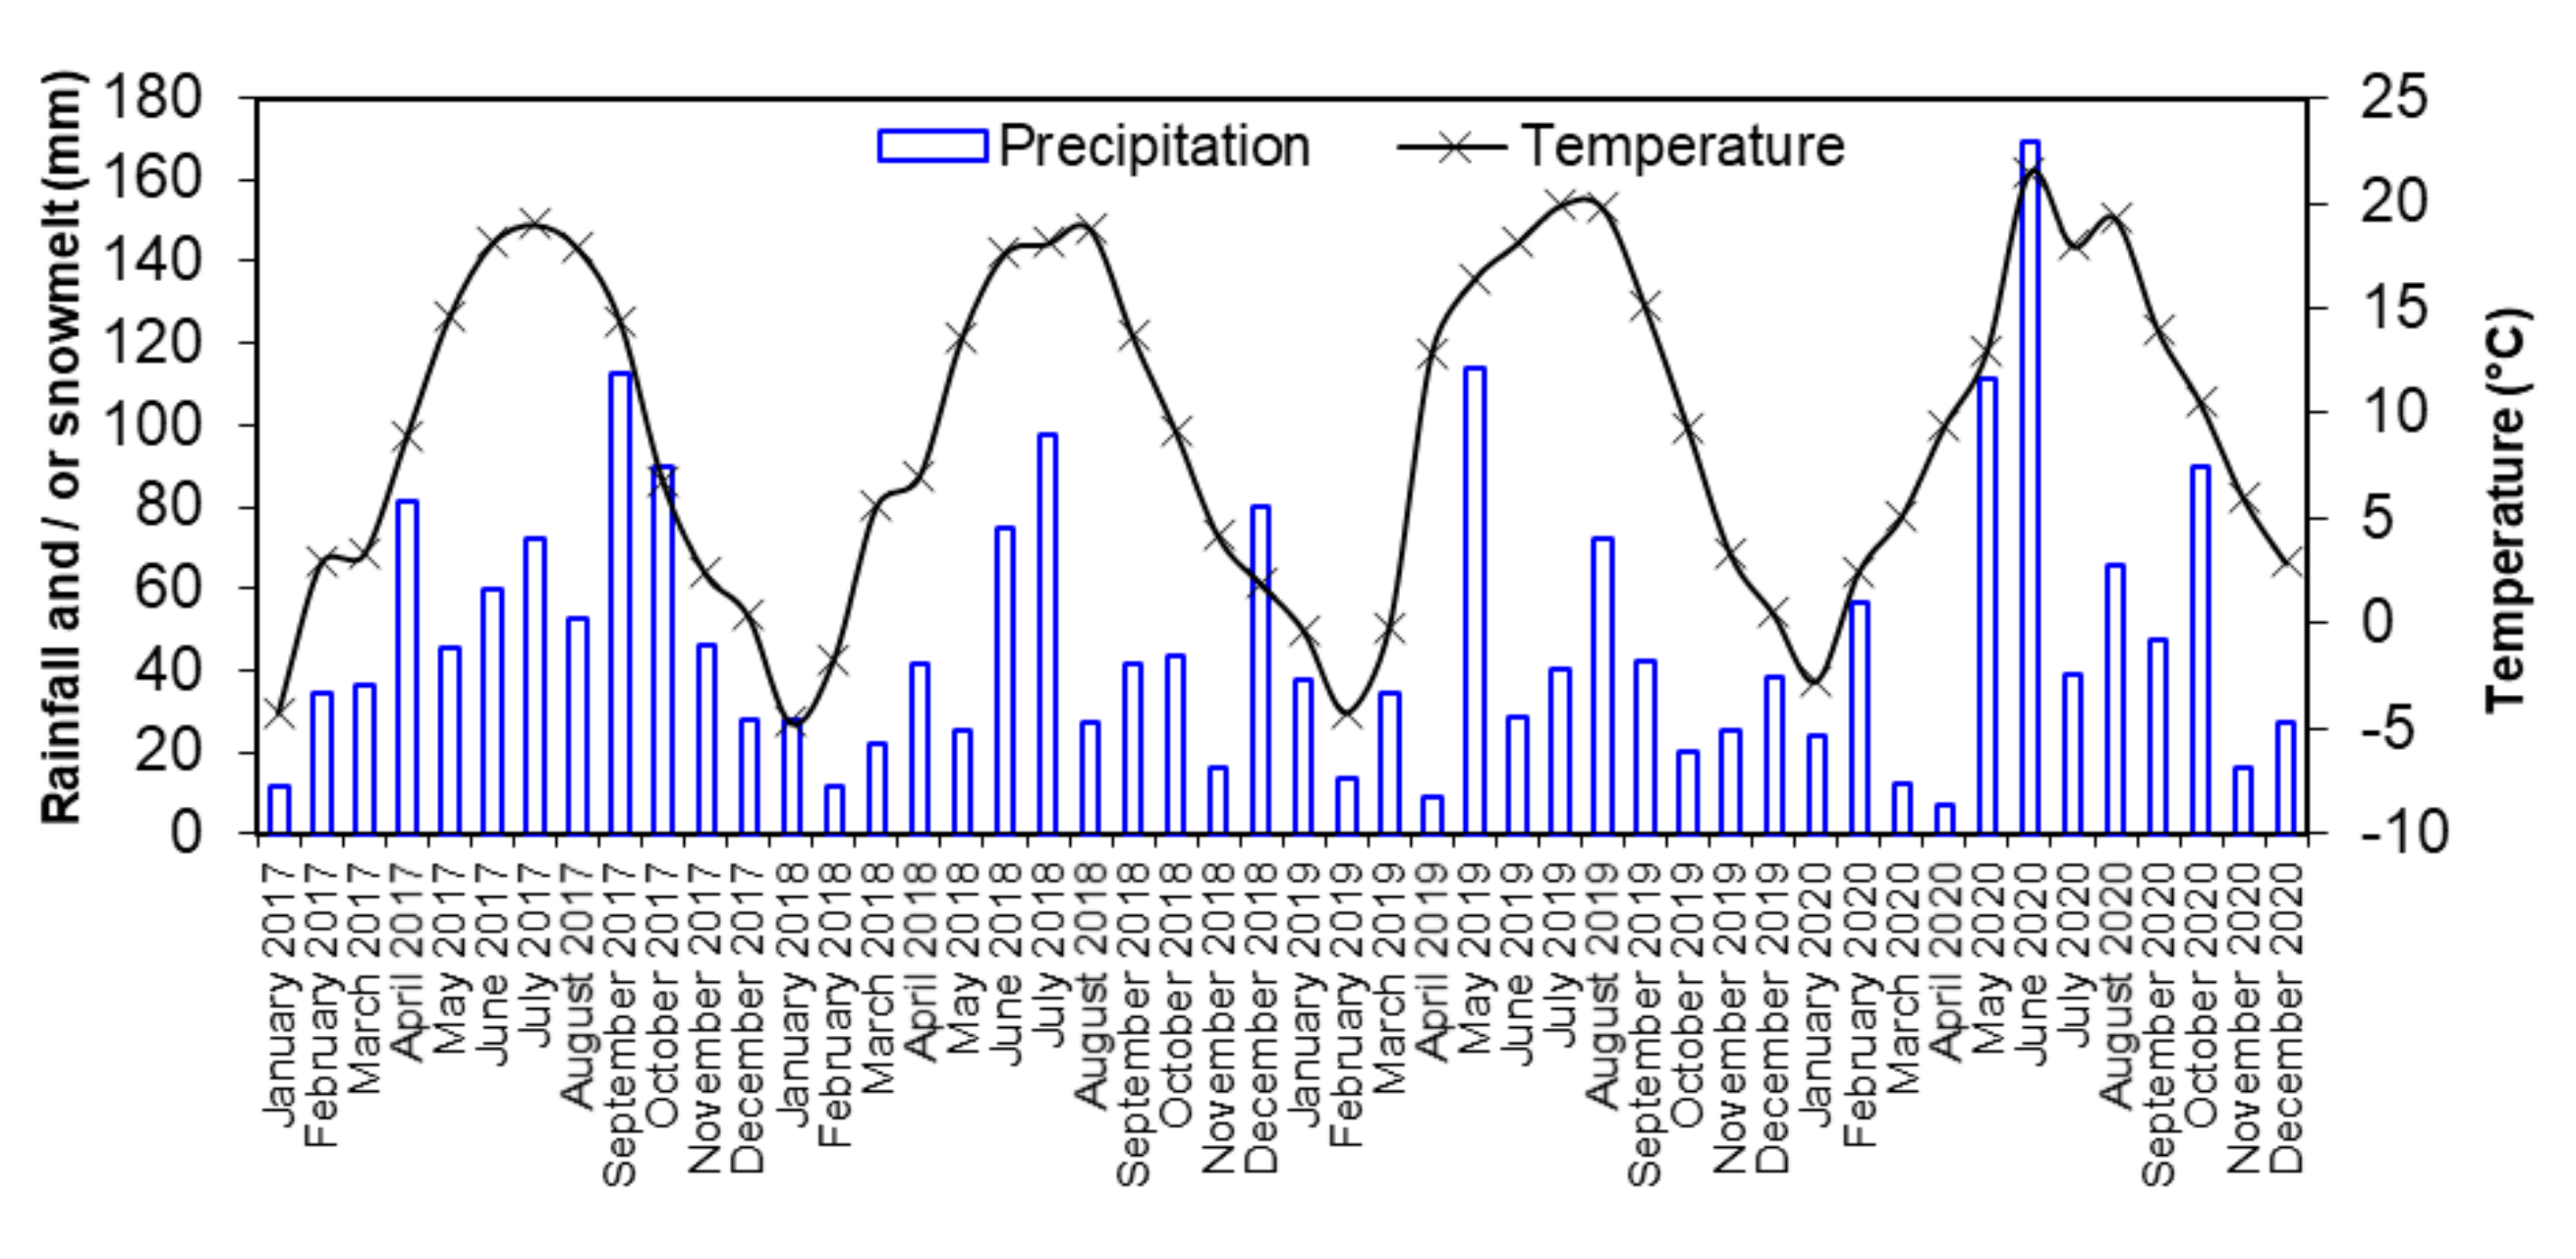
3.1. Weather Conditions

Figure 1 illustrates the course of monthly mean air temperatures and rainfall sums for 2017, 2018, 2019, and 2020 in the study site. The average temperatures during the growing season (April–September) and the annual temperatures in the successive years were 14.8, 17.1, 15.9, and 15.1 °C and 8.7, 9.3, 10.0, and 9.7 °C, respectively. The respective sums of the growing season and annual precipitation were 424.1, 308.1, 306.2, and 439.8 mm and 670.1, 509.1, 475.9, and 666.2 mm, respectively. The growing season precipitation rates in 2017–2020 were below the long–term average (567 mm).

3.2. Descriptive Statistics

Basic statistical parameters of the grain and straw yields and plant height are given in Table 1. The ranges of the mean, minimum, and maximum values of the grain yield (in kg m−2) in the growing seasons 2017–2020 were 0.123–0.361, 0.070–0.240, and 0.180–0.530, respectively. The corresponding ranges for the straw yield (in kg m−2) were 0.205–0.432, 0.140–0.230, and 0.310–0.770 and plant height (in cm): 53.5–90.1, 48–75, and 63–110. The minimum values of all yield trait components were noted in 2018 or 2019 and the maximum values were determined in 2017 or 2020. The largest and similar coefficient variations (CVs) were recorded for the grain yield (17.5–28.1%) and the straw yield (19.7–28.5%), whereas lower values were calculated for the plant height (7.5–10.2%).
According to the classification proposed by Dahiya et al. [51], the CV values for the grain and straw yields were moderate (15–75%) and low (0–15%) for the plant height. The asymmetry (skewness) of the grain and straw yields was positive (0.053–0.930), whereas that of the plant height ranged from positive 0.803 in 2018 to negative −0.052 in 2017. The kurtosis of the grain yield varied from 0.141 in 2018 to negative −0.445 in 2020. The corresponding ranges for the straw yield and the plant height were 0.480 in 2017 to −0.249 in 2019 and −0.349 in 2019 to −1.018 in 2020. In general, the skewness and kurtosis values indicate that the yield trait components were close to the normal distribution, which was slightly flattened in nine cases and slightly slender in three cases.
The response of the cereals to the SICS applied was related to the yield trait components and the study year. The differences in the mean grain yield between the particular treatments and the control in the first three study years (2017–2019) varied from 18.0% to −16.6% (Figure 2a). However, in the last study year (2020), the wheat grain yield increased (p < 0.05) in the M and M + L + LU treatments by up to 47.3% and 45.8, respectively, compared to that in the control (0.279 kg m−2). A substantially lower and statistically insignificant increase was observed in the lime (L) and catch crop (LU) treatments (by 10–18%). On average, the cereal grain yield during the experimental period (2017–2020) increased in the L, M, and M + L + LU variants by 2.5, 23.3, and 16.6%, respectively, and slightly decreased in LU (by 0.7%) compared to the control (0.224 kg m−2). Irrespective of the treatment, the grain yields were considerably lower in both dry years 2018 and 2019 (growing season rainfall: 306 and 308 mm) than in the wet years 2017 and 2020 (growing season rainfall: 424 and 440 mm). The grain yields averaged over the treatments were 0.123–0.143 kg m−2 in the dry years (2018–2019) and 0.333–0.361 kg m−2 in the wet years 2017 and 2020 (Table 1). The inter-annual variations in the grain yields were relatively greater than those between the SICS treatments in all study years.
The straw yield changes in response to the SICS applied varied in the first three years from 22.3% (in M + L + LU in 2019) to −11.4% (in L in 2018) (Figure 2b). The highest straw yield increment was observed in 2020 in the M and M + L + LU variants, where the straw yield increased by 58.2% and 65.0%, respectively, compared to that in the control (0.340 kg m−2). It is worth noting that this increase in the straw yield in both treatments was relatively greater than that of the grain yield and was reflected in lower grain/straw ratios (Figure 2c). Noteworthy, the similar mean grain yield of spring wheat in the dry years 2018–2019 (0.123–0.143 kg m−2) was accompanied by a considerably (almost twice) higher straw yield (0.395 kg m−2) in the dry year 2019 than in the other dry year 2018 (0.205 kg m−2).
The high straw yield in 2019 was clearly reflected in the considerably lower grain/straw ratios in all treatments (0.287 to 0.331), compared to those in the other years, i.e., 2017 (0.969 to 1.084), 2018 (0.633 to 0.787), and 2020 (0.733 to 0.874) (Figure 2c). The straw yield averaged over the whole experimental period (2017–2020) increased in L, LU, M, and M + L + LU by 1.5, 4.3, 23.8, and 29.0%, compared to the control 0.311 kg m−2, respectively.
The plant height at harvest in the first three years (2017–2019) in the particular SICS was slightly lower (to 5.8%) or higher (to 9.7%) and statistically insignificant compared to the control (Figure 2d). However, in 2020, the plant height was significantly (p < 0.05) higher in M (by 16.0%) and in M + L + LU (by 20.7%), compared to the control (86.7 cm). It is worth noting that the plant height response to the particular SICS was relatively lower than that for grain and straw, irrespective of the study year. The plant height averaged over the four study years increased in L, LU, M, and M + L + LU by 3.1, 0.8, 8.4, and 11.6%, respectively, compared to the control (69.4 cm).

3.3. Correlation Coefficients between Yield Trait Components

As can be seen from Table 2, the highest correlation coefficient (r) between straw and grain was determined in the wet and last study year 2020 (0.798), whereas the lowest value was reported in the dry 2018 (0.393); both values were statistically significant (p < 0.05). The correlation coefficients between the plant height and the grain yield were more closely correlated in the wet and last study year 2020 (0.776) (p < 0.05), compared to the first three study years (0.487–0.596). The lowest correlation coefficients between the plant height and the straw yield were calculated in the dry 2018 (0.189), and the highest values were recorded in the wet and last study year 2020 (0.833) (p < 0.05). Noteworthy, there were markedly different r values between the plant height and the straw yield in the two dry years, i.e., 2018 (0.189) and 2019 (0.785), with much higher straw yield (and higher plant height) in the latter at a similar grain yield in both years. In line with this finding, there are significant positive correlations for the grain yield and the plant height between 2018 (0.322) and 2019 (0.333) (p < 0.05) in contrast to the insignificant and negative correlation for the straw yield (−0.57). Overall, the highest coefficient correlations between all paired yield trait components were recorded in the last study year.

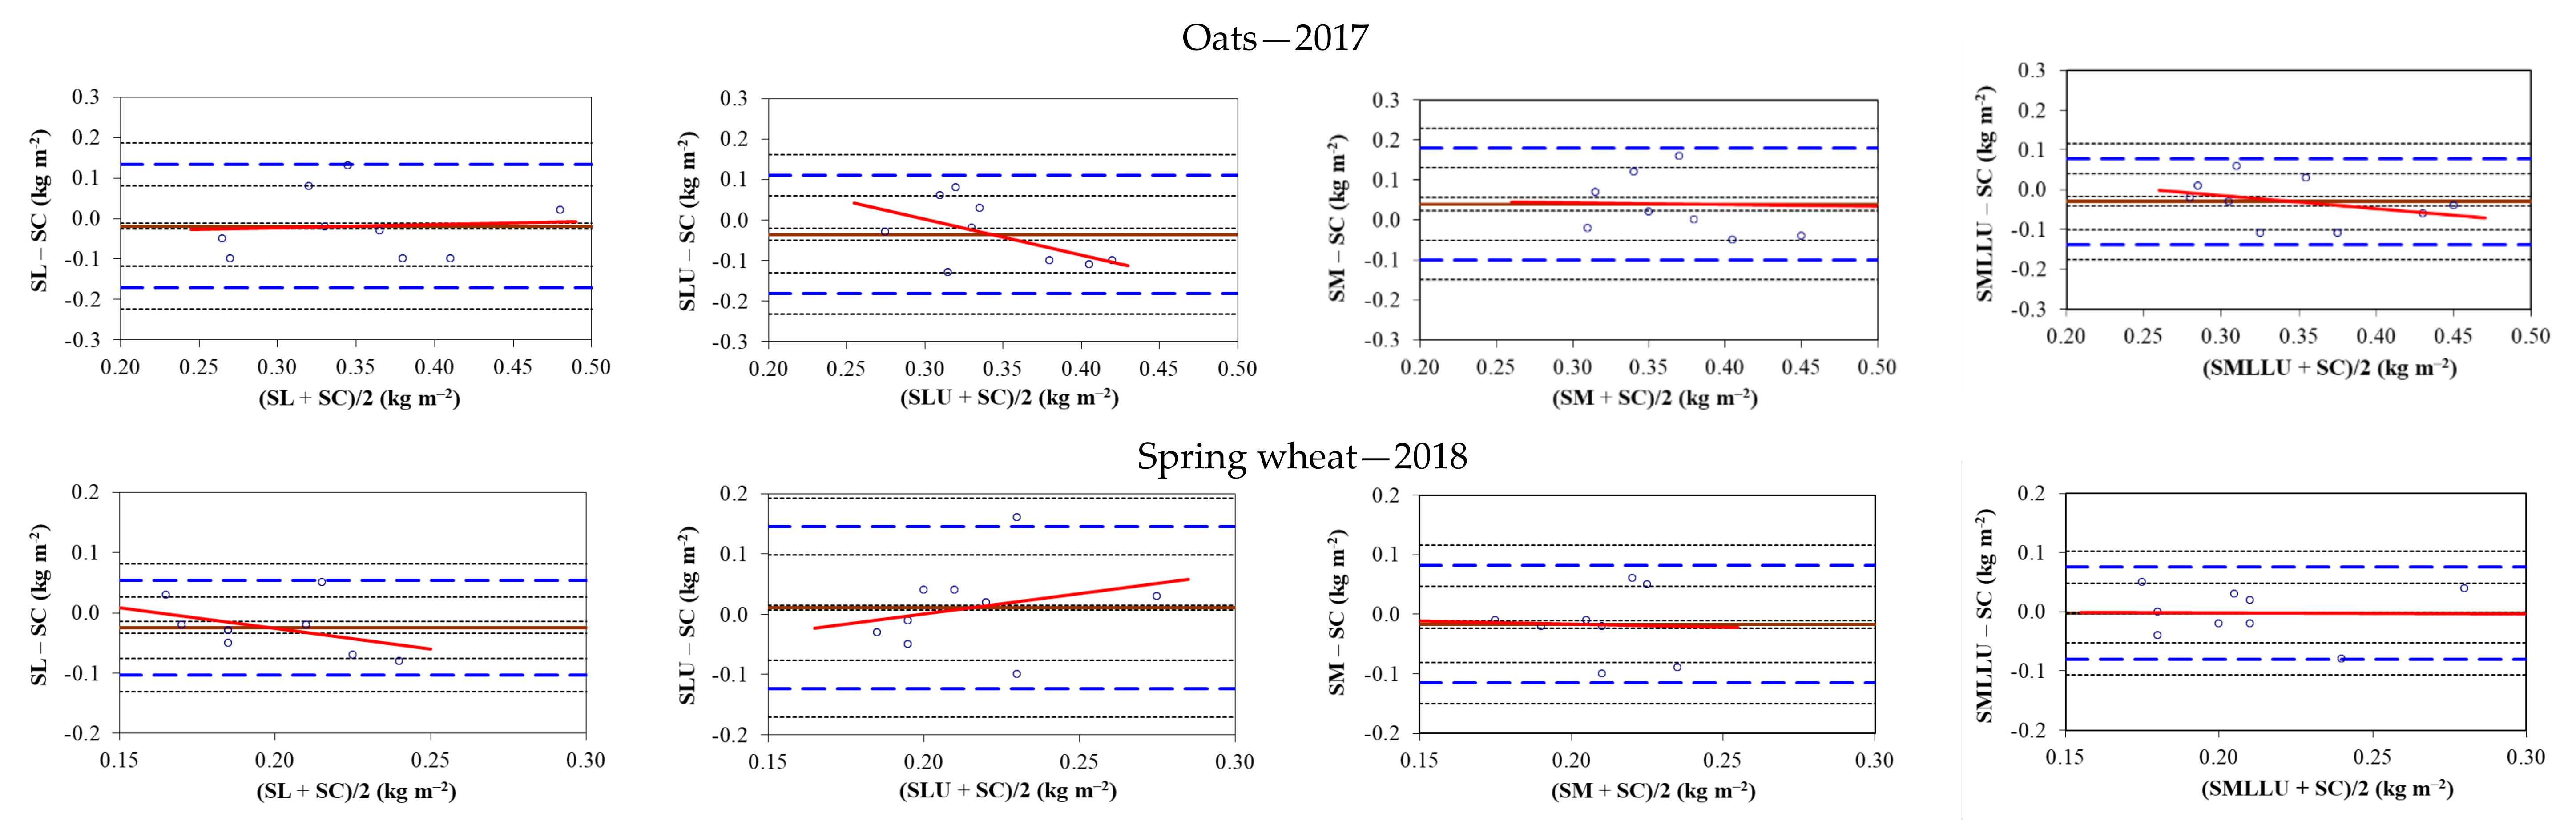
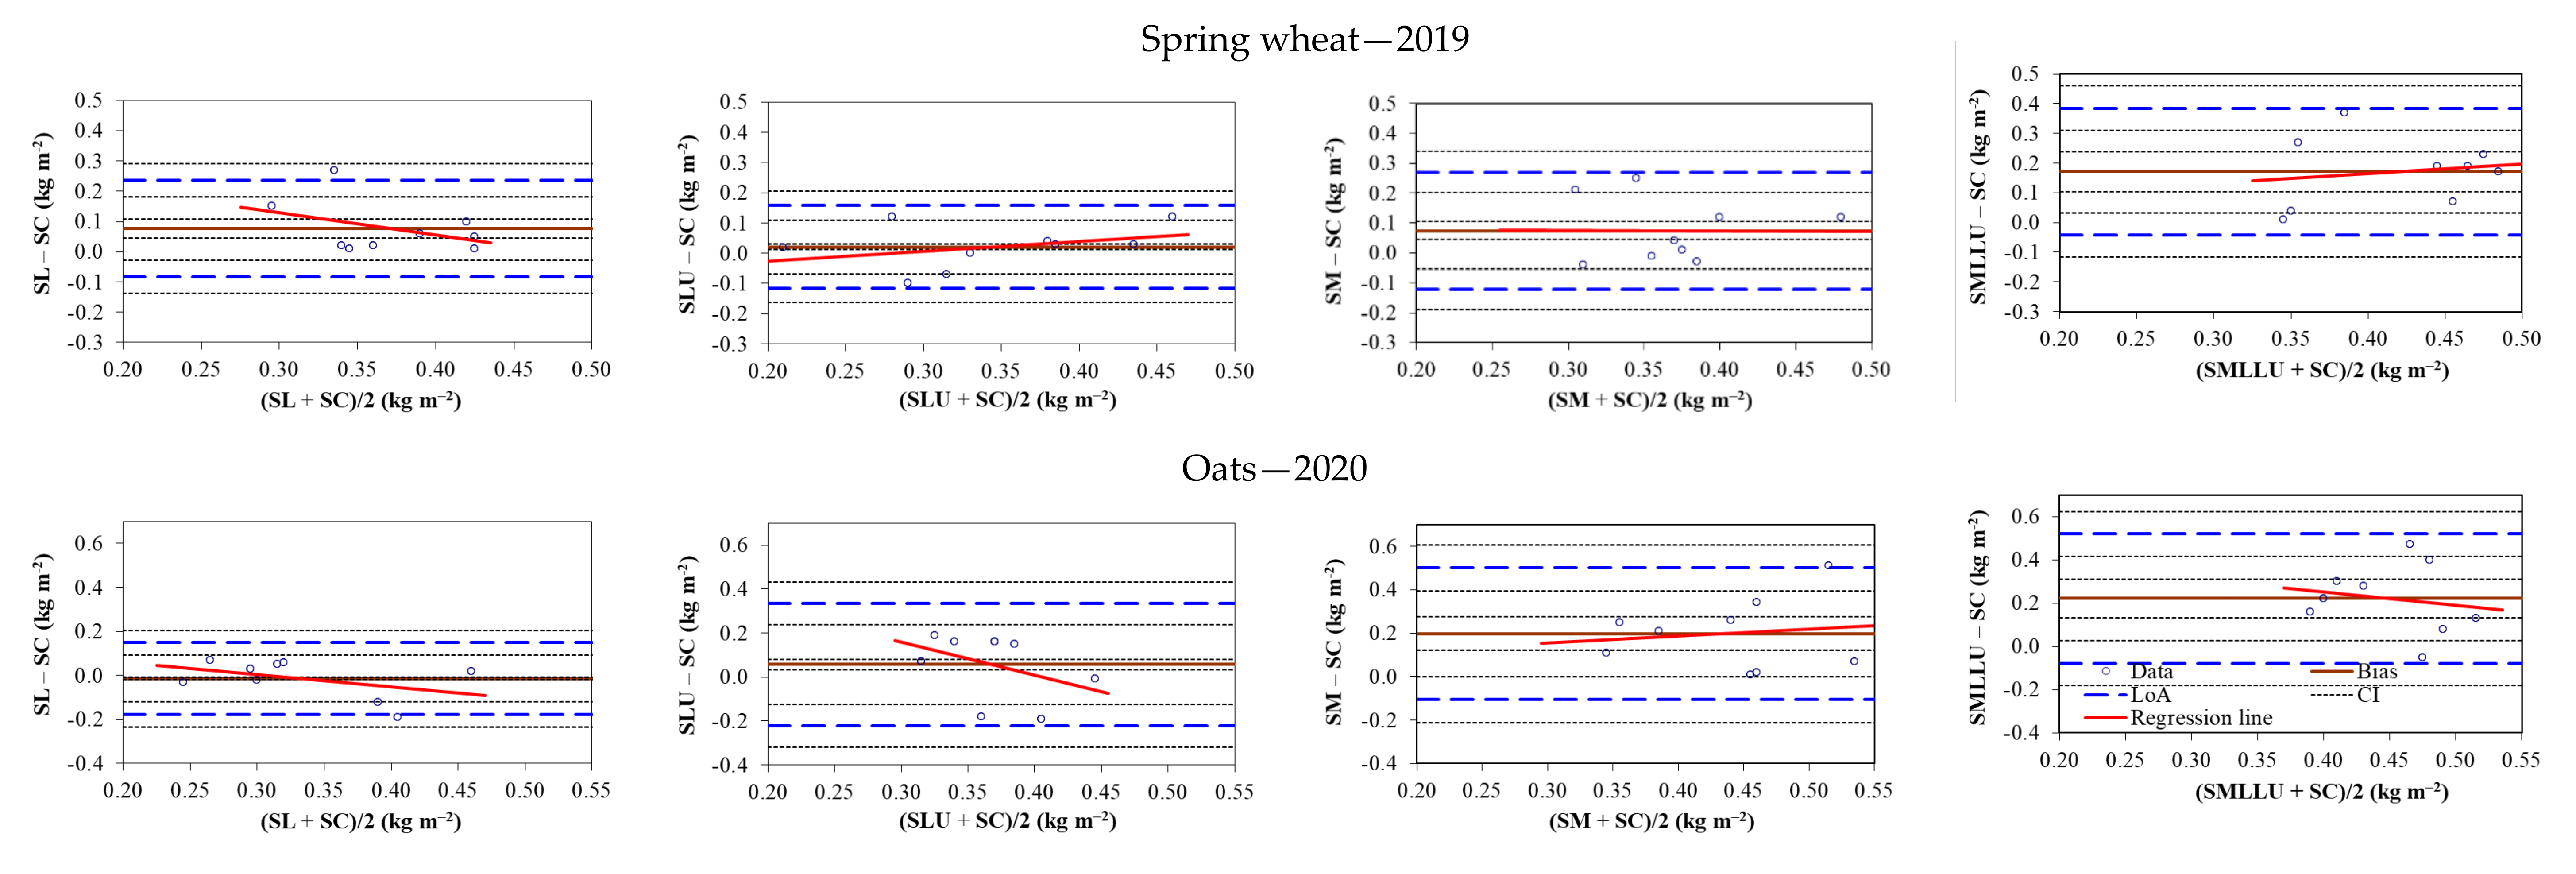
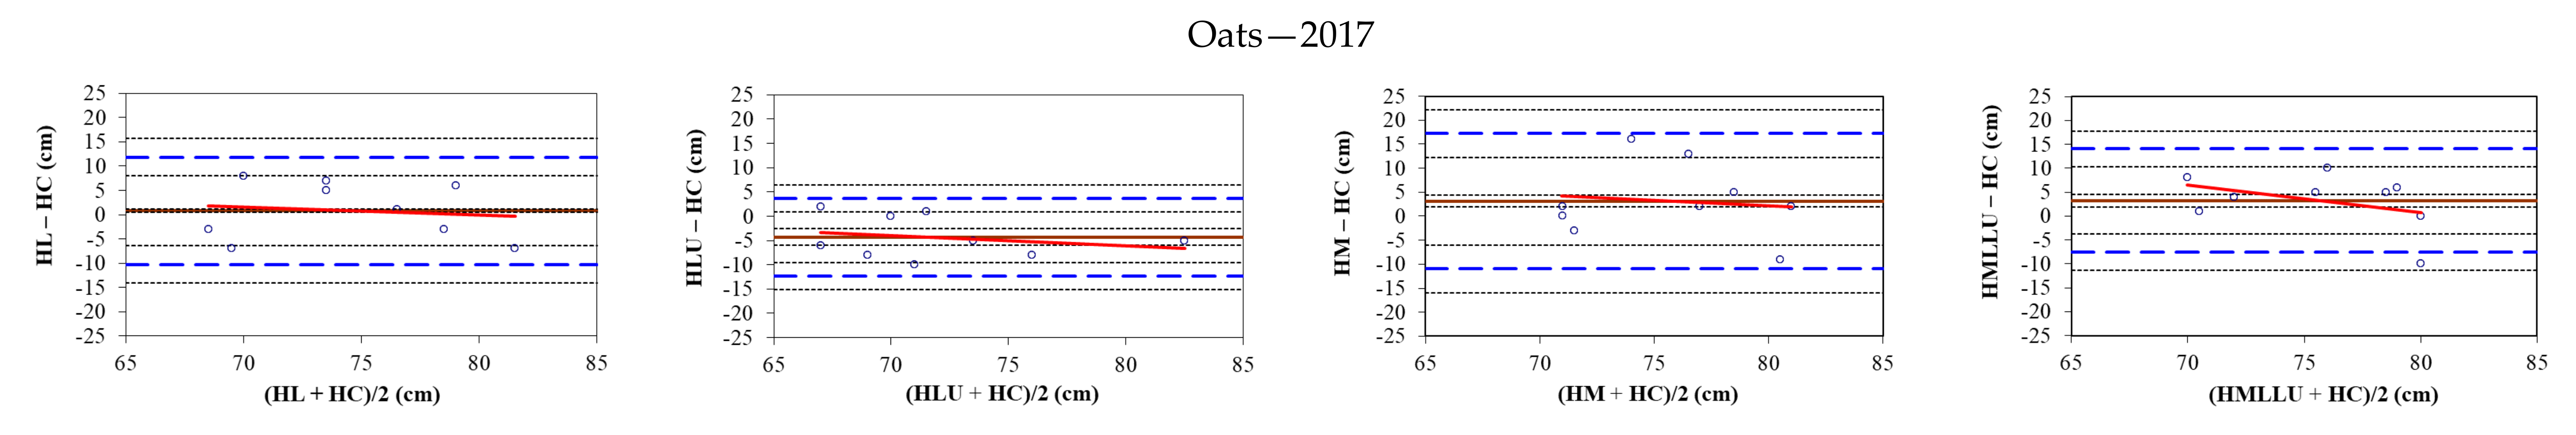
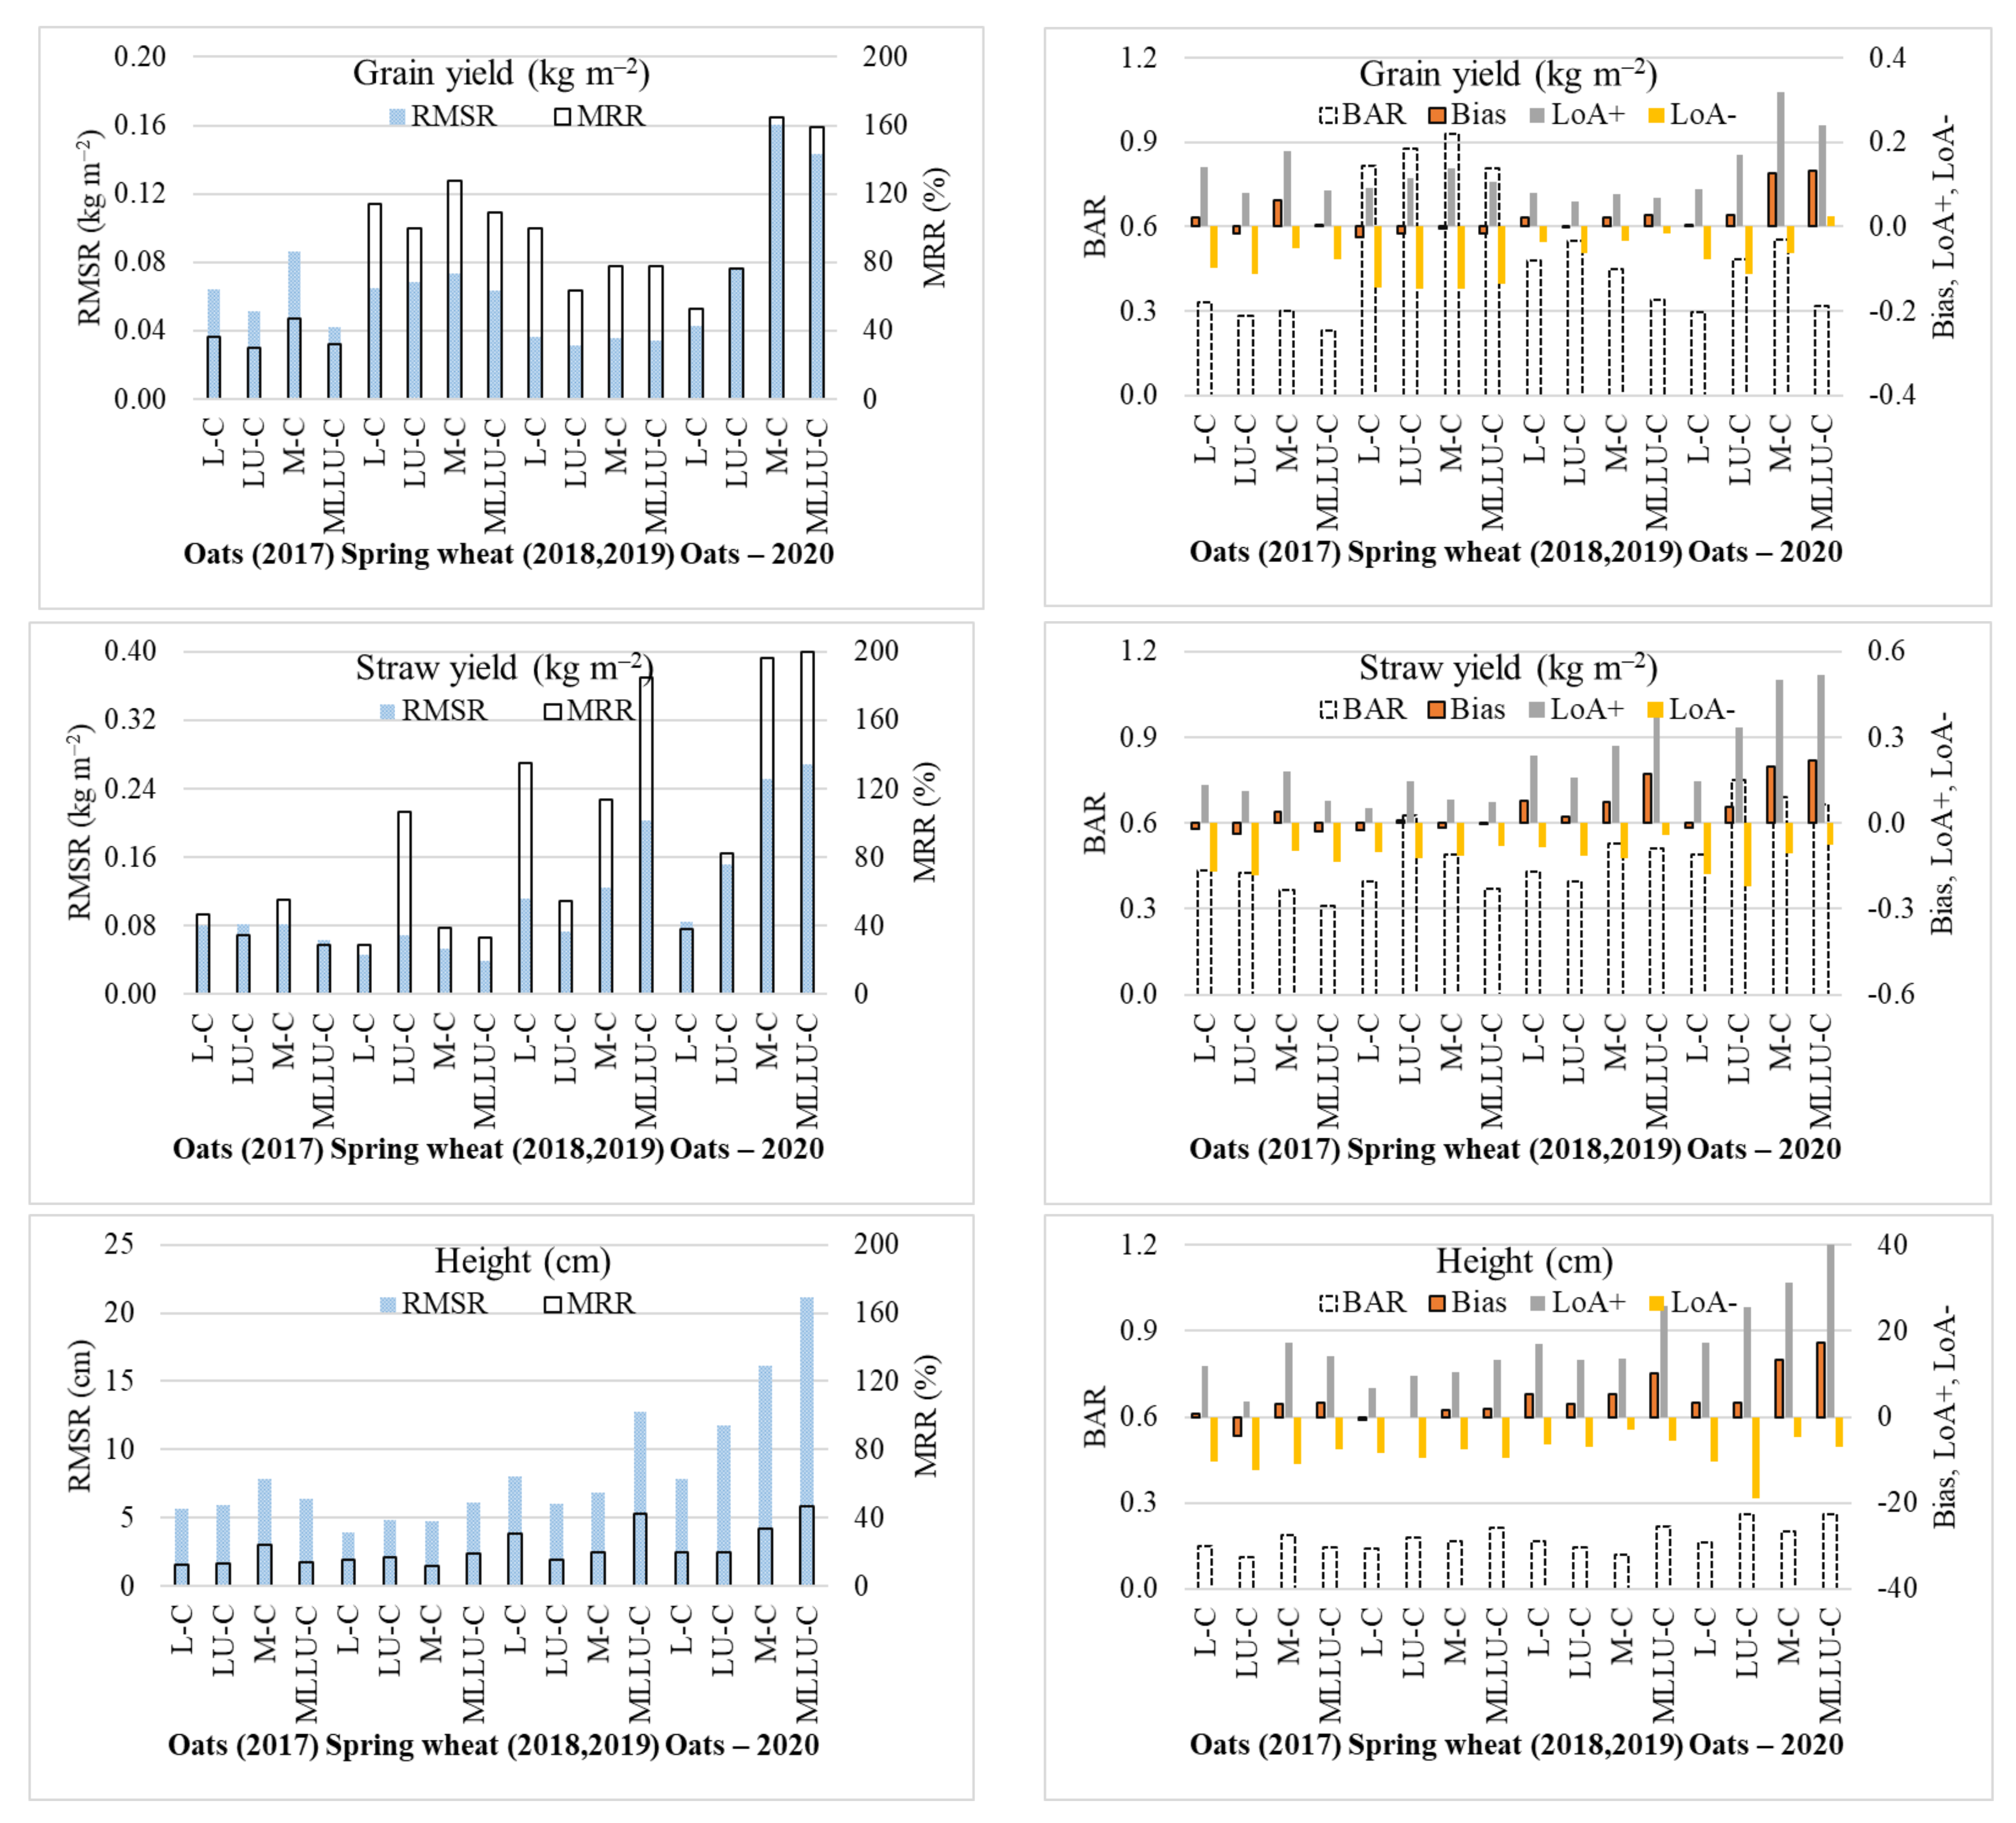
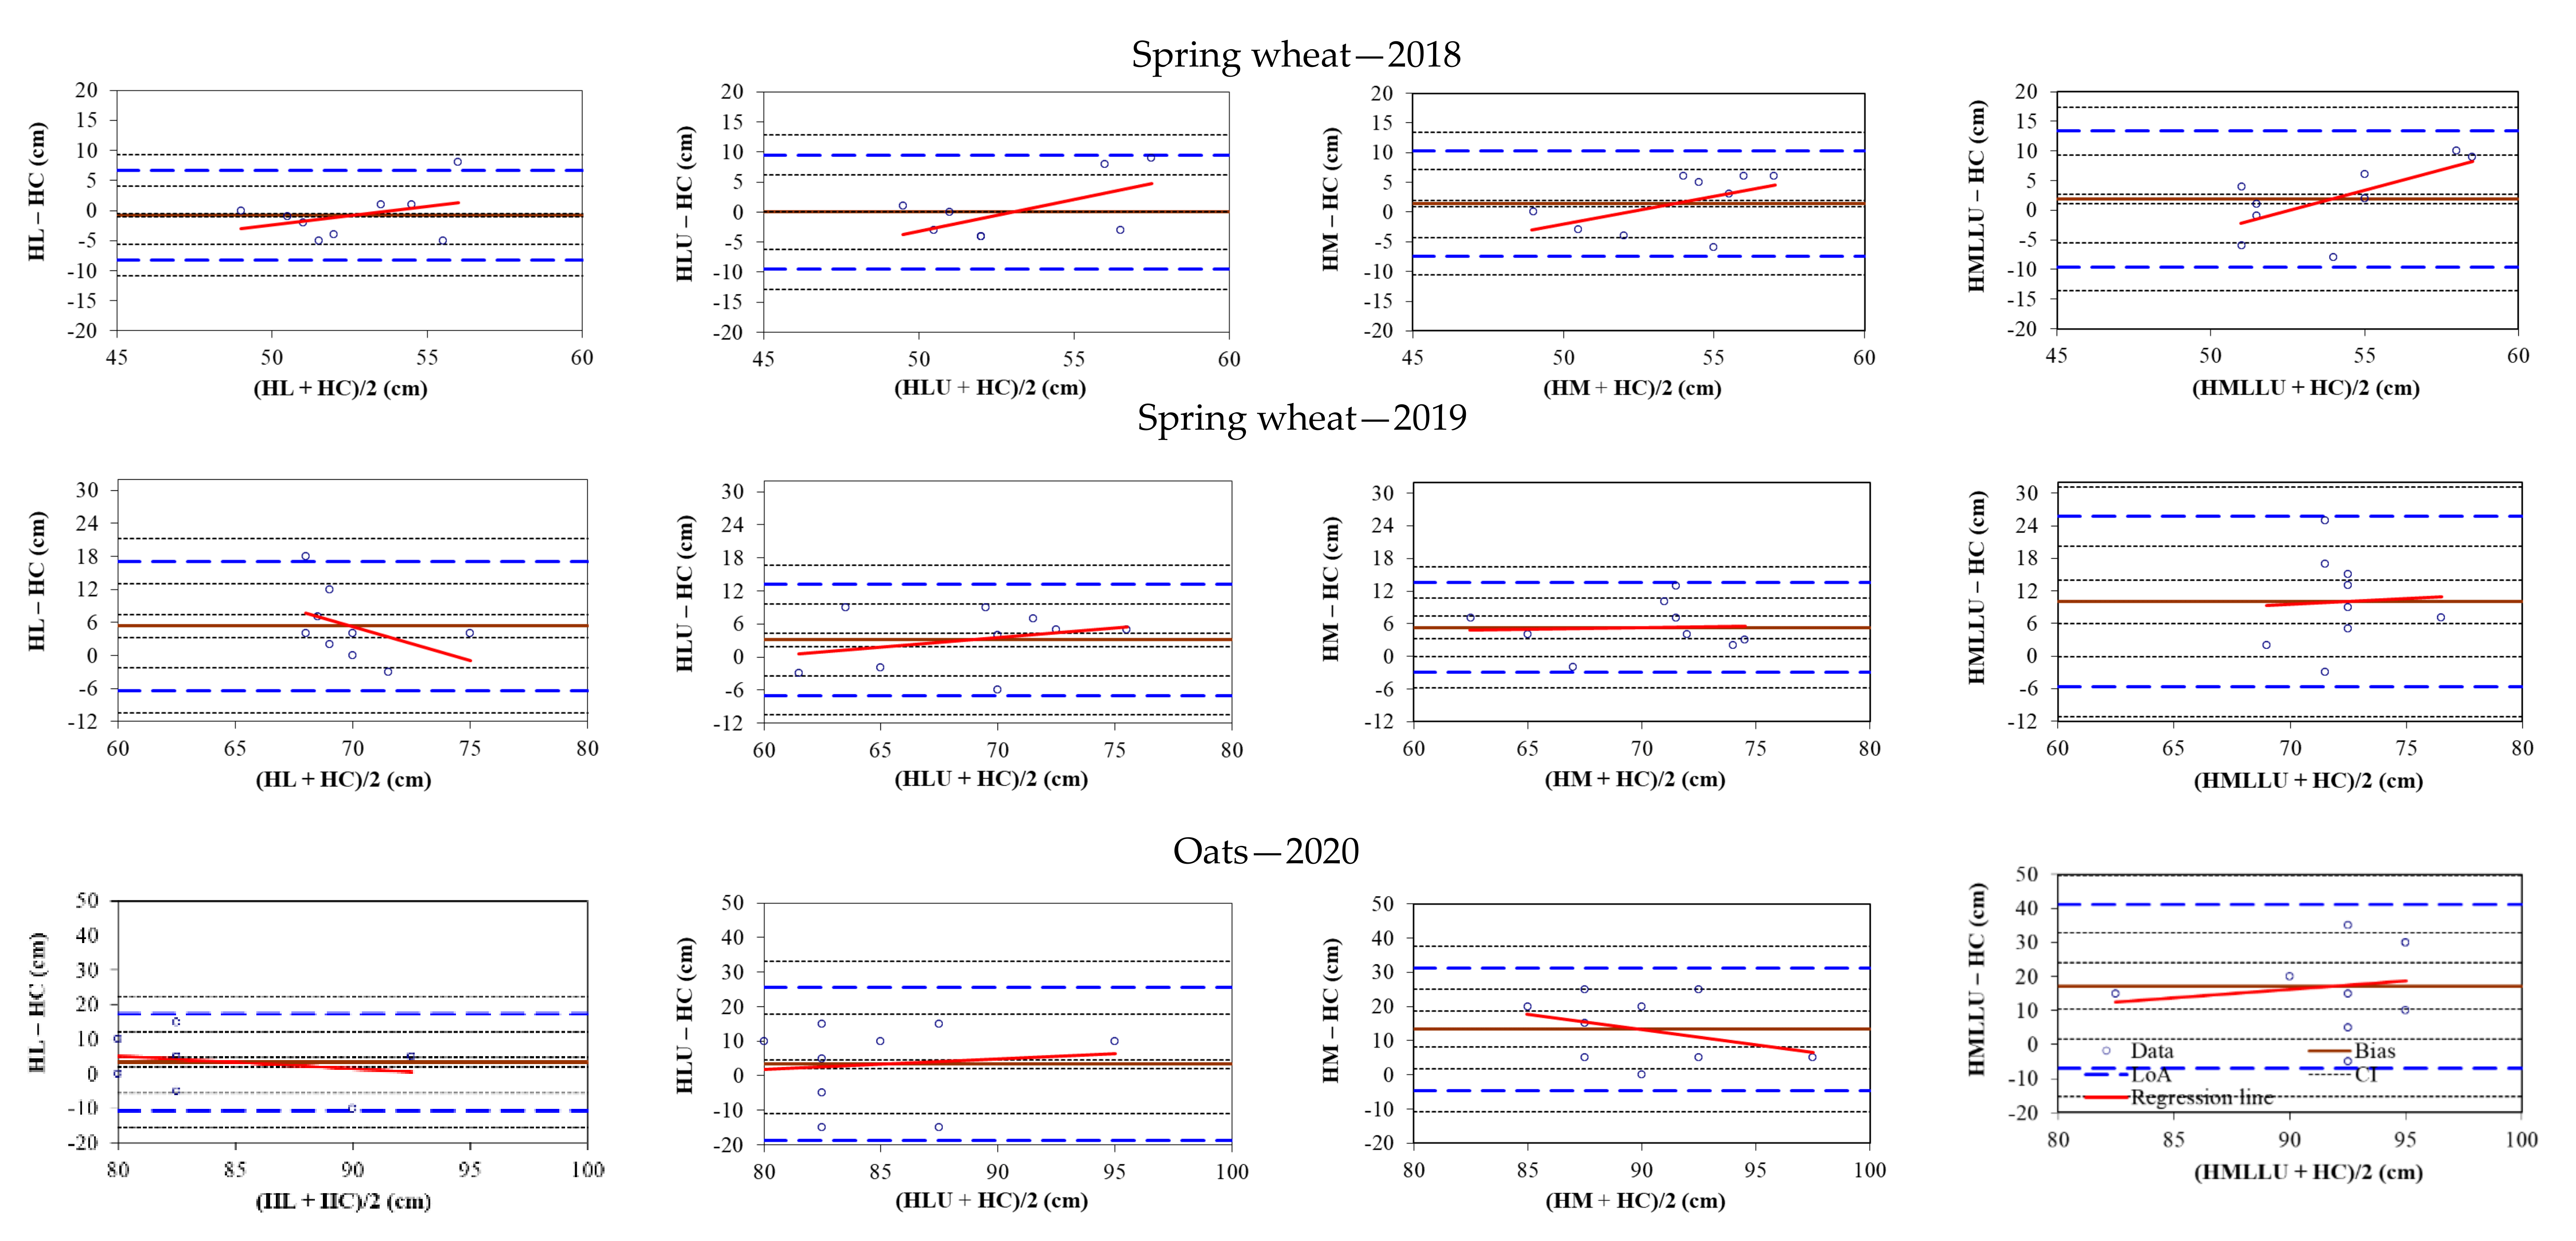
3.4. Bland–Altman Analysis

Bland–Altman plots including horizontal lines of the bias line (mean difference from the SICS and control plots), limits of agreement (LoA = bias ± 1.96 × SD) along with confidence intervals (CI), regression lines (y = ax + b), and Bland–Altman ratio (BAR, half the range of LoA to the mean differences between the SICS and control plots) describe quantitatively the impact of particular SICS vs. the control on the cereal grain and straw yields and plant height. They are shown in Figure 3, Figure 4 and Figure 5.
The average differences (biases) indicate that the application of the particular SICS resulted in a lower grain yield (bias < 0) in seven cases and a higher grain yield (bias > 0) in nine cases (Figure 3). The negative biases varied in kg m−2 from −0.002 for LU in 2019 to −0.017 for LU in 2018, and positive biased ranged from 0.006 for M + L + LU in 2017 and L in 2020 to 0128 for M and 0.132 for M + L + LU in 2020. It is worth noting that all negative biases occurred in the first three study years and the most positive ones were noted in the last study year. The ranges of LoA for the grain yields were in general similar in 2017 and 2018 in all comparable SICS treatments (except higher in LU in 2018). They decreased considerably in 2019 and then increased in 2020. The increase in 2020 was most pronounced in M and M + L + LU, where the ranges of LoA± in kg m−2 (0.318, −0.062 and 0.241, 0.023) were several times greater than those in 2019 (0.077, −0.033 and 0.069, −0.016). The largest ranges of LoA in M and M + L + LU in 2020 correspond with the respective highest maximum values of root mean square residuals (RSMR) (0.16 and 0.143 kg m−2) and maximum relative residuals (MRR) (164.7 and 158.8%) (Figure 6). Irrespective of the treatment, the largest Bland–Altman ratio (BAR) values were noted in 2018 (0.809–0.929) and the lowest were recorded in 2017 (0.231–0.330), which indicates insufficient (BAR ≥ 0.4) and moderate (0.2 ≤ BAR < 0.4) agreement, respectively, between the grain yield in the SICS and control plots [48].
As to the straw yield, the negative biases occurred in seven of the 16 cases and changed in kg m−2 from −0.002 for M + L + LU in 2018 to −0.036 for LU in 2017 (Figure 4). The positive biases varied from 0.011 for LU in 2018 to 0.198 for M and 0.221 for M + L + LU in 2020. The highest positive biases correspond with the highest RMSR (0.251–0.269 kg m−2) and MRR (196.2–204.3%). The ranges of the limits of agreements (LoA = bias ± 1.96 × SD) were in general relatively narrow and similar in all treatments in the first two study years 2017–2018, but increased largely in all SICS treatments in 2019–2020. This increase was most pronounced in 2020 in the M and M + L + LU treatments, where the LoAs ranges approximately doubled compared to those in 2017–2018. The lowest BAR values were recorded (0.311–0.425) in the first study year 2017, and the largest were noted in 2020 (0.490–0.753) in all comparable treatments (Figure 6), which indicates moderate (0.2 ≤ BAR < 0.4) and insufficient (BAR ≥ 0.4) agreement, respectively, between the straw yield in the SICS and control plots [48].
The bias values for the plant height were mostly positive in 13 of the 16 cases (except two negative values for LU in 2017 and L in 2018 and 0 for LU in 2018). The lowest bias in cm (−4.33) was recorded in 2017 for LU and the highest in 2020 for M (13.33) and M + L + LU (17.22). In comparable treatments, the lowest biases occurred in general in the dry growing season 2018 with the lowest mean plant height among the study years and the highest values in 2020 with the highest plant height (Figure 5). The ranges of LoAs were wider in 2020 than in the other years. The highest BAR values for most of the comparable pairs were recorded in 2020 when the plants were the tallest. In all years except 2017, the highest BAR values were noted for M + L + LU. The BAR values in 8 cases (0.111 to 0.199) and in four cases (0.212–0.262) (Figure 6) indicated good or moderate and moderate agreement [48], respectively, between the grain yield in the SICS and control plots. As can be seen in Figure 6, the BAR values for the plant height were lower than those for the grain and straw yields, irrespective of the treatment and study year. The lower BAR values for the plant height correspond with the higher RMSR and lower MRR values.
The regression lines of the differences between the particular SICS and control plots against the average yield of both indicate that the trends for grain were descending, ascending, or almost unchanged (close to the bias line) depending on the SICS type and study year. Ascending trends were mostly observed for the paired treatment M and Control. As to straw yield and plant height, the regression lines indicate slightly descending or ascending trends.
Regardless of the SICS type, yield trait component, and study year, the Bland–Altman plots indicate that a bulk of the points are within the limits of agreement (LoA) and outliers—within the confidence intervals (CI) (Figure 3, Figure 4 and Figure 5).

4. Discussion

4.1. Impact of the Soil-Improving Cropping Systems (SICS) on Yield Trait Components

Our study showed the most pronounced differences in all crop yield trait components between SICS in the fourth and wet study year. A statistically significant and similar increase in the crop yield was found in two SICS, i.e., M consisting of only farmyard manure and M + L + LU providing less farmyard manure and plus lime and cover crops. This significant impact of both treatments may result from the increased nutrient supply from farmyard manure and cover crops although the soil organic matter content increased only slightly (data not shown). Similarly, the high yields in the M and M + L + LU variants imply that organic matter from deficit farmyard manure in the former can be replaced in part by green manure/cover crops, with maintenance of the same productivity. The positive effect of the combined SICS (M + L + LU) on the crop yield in the acid soil can also be enhanced by yield-increasing liming improving the availability of essential nutrients to plants [52]. These results support the recent actions in several countries, including Poland, focused on promotion of incorporating legumes in the intercropping systems and extending agricultural lime application [53,54,55]. Application of the combined SICS should be considered not only in relation to crop productivity enhancement but also as a sustainable strategy to improve the supply capacity of essential nutrients including fixed atmospheric nitrogen [56], and alleviating the negative effect of soil acidity [52]. It should also be noted that increasing the organic carbon content or even keeping good levels in sandy soils requires a continuous supplying organic materials. This is due to the fact that sandy soils, especially tilled, are well aerated creating conditions conducive to rapid microbial decomposition of organic matter.

4.2. Weather Influences

Our results showed that the cereal yield trait components were largely influenced by both the total rainfall amount and their temporal distribution during the growing seasons. As could be expected, the wheat grain yield was appreciably lower (by more than 50%) in the two dry growing seasons compared to the two wet growing seasons. The analysis of the yield trait components and the weather course further revealed that, in both dry years (2018–2019) with almost the same total amount of rainfalls during the growing season (306–308 mm), the straw yield of spring wheat was by 160–221% higher, depending on treatment, in 2019 than 2018. In turn, the grain yield of spring wheat in 2019, compared to 2018, was not different or slightly lower (by 6.4–24.3%) in the comparable treatments. This opposite response of the yield trait components can be explained by the different distribution of rainfalls during the analyzed growing seasons. The large amounts of rainfalls in May during intensive growth at shooting and the scarce precipitation during later growth in 2019 (Figure 1) may have stimulated top growth. Moreover, the shoot growth in May 2019 may have been favored by the lower temperature (12.5 °C) compared to that in 2018 (18.5 °C) (Figure 1) by changing evaporation rates. The more intensive shoot growth in 2019 vs. 2018 was reflected in the greater straw yield in the former season in all treatments (Figure 4). The results imply that a good water supply at shooting increases allocation of assimilates to shoots while reducing the grain yield. These diverse responses of the yield trait components emphasize the importance of the increasingly frequent episodic (extreme) drought and wet conditions during the growing season associated with climate change [57]. The sensitivity of the yield trait components to weather variation during the growing season in sandy soils can be enhanced by the high permeability and low water holding capacity of these soils, which do not allow storing water for a longer time and efficient use of nutrients [5], and by the relatively shallow root system of spring cereals. Understanding the relations among the yield trait components depending on the weather course during the growing season is important in food and bioethanol production where grain and straw, respectively, are potential feedstocks [58,59].

4.3. Usefulness of the Bland–Altman Method

The use of the Bland–Altman method contributed to improvement of the quantification of the direct (separated) impact of a given soil-improving practice on the cereal yield trait components in reference to the control in different inter-annual weather conditions. For example, the small values of limits of agreement (LoA = bias ± 1.96 × SD) for the grain yield in the most yield-producing SICS (M and M + L + LU) in the dry growing season 2019 (with the lowest yield) increased by several times in the wet season 2020 (with the highest yield), indicating that the grain yields were less even in the latter. The reduced evenness of the yield in the wetter growing season 2020 may have resulted in part from the variability in soil water content and the related availability of nutrients from organic matter provided by these two SICS. The variable soil water content in these SICS treatments may have resulted from changes in the soil structure caused by the organic matter amendments and from the natural variability of the soil texture in the study area [19]. This explanation is supported by the fact that water deficit is a dominant crop yield–limiting factor in sandy soils [5,60].
The Bland–Altman plots indicate that the orientations of the regression equation lines for the grain and straw yield in M and M + L + LU, compared to the other SICS, were in most cases close together to the bias lines. This can be indicative of the stabilizing effect of the largest quantity of organic matter provided by both SICS on the yield and uniformity of the yield components. The regression equation lines below or above the bias line indicate a reduction in yield uniformity. It is important to add that if only one treatment, i.e., SICS or the control, in the pair has a wide range of limits of agreement (LoA), the Bland–Altman will always produce wide limits of agreement [61]. This means that poor agreement between the paired SICS and control do not necessarily indicate that the tested SICS has low evenness of crop yields in the replicate sub-plots.
The comparison of the Bland–Altman Ratio of the yield trait components revealed that grain and straw yields, compared to plant height, exhibit appreciably higher uncertainty (at the most comparable paired SICS and control). Even with high uncertainty, analysis of biases and LoA values facilitates assessment of the degree of the causal (positive or negative) effect of particular SICS on the crop yield. This observation along with inter-annual differences in crop yield trait components is important in modelling crop responses to SICS and weather conditions during growing seasons [62].

5. Conclusions

The results of this study indicate the following findings:
(1)
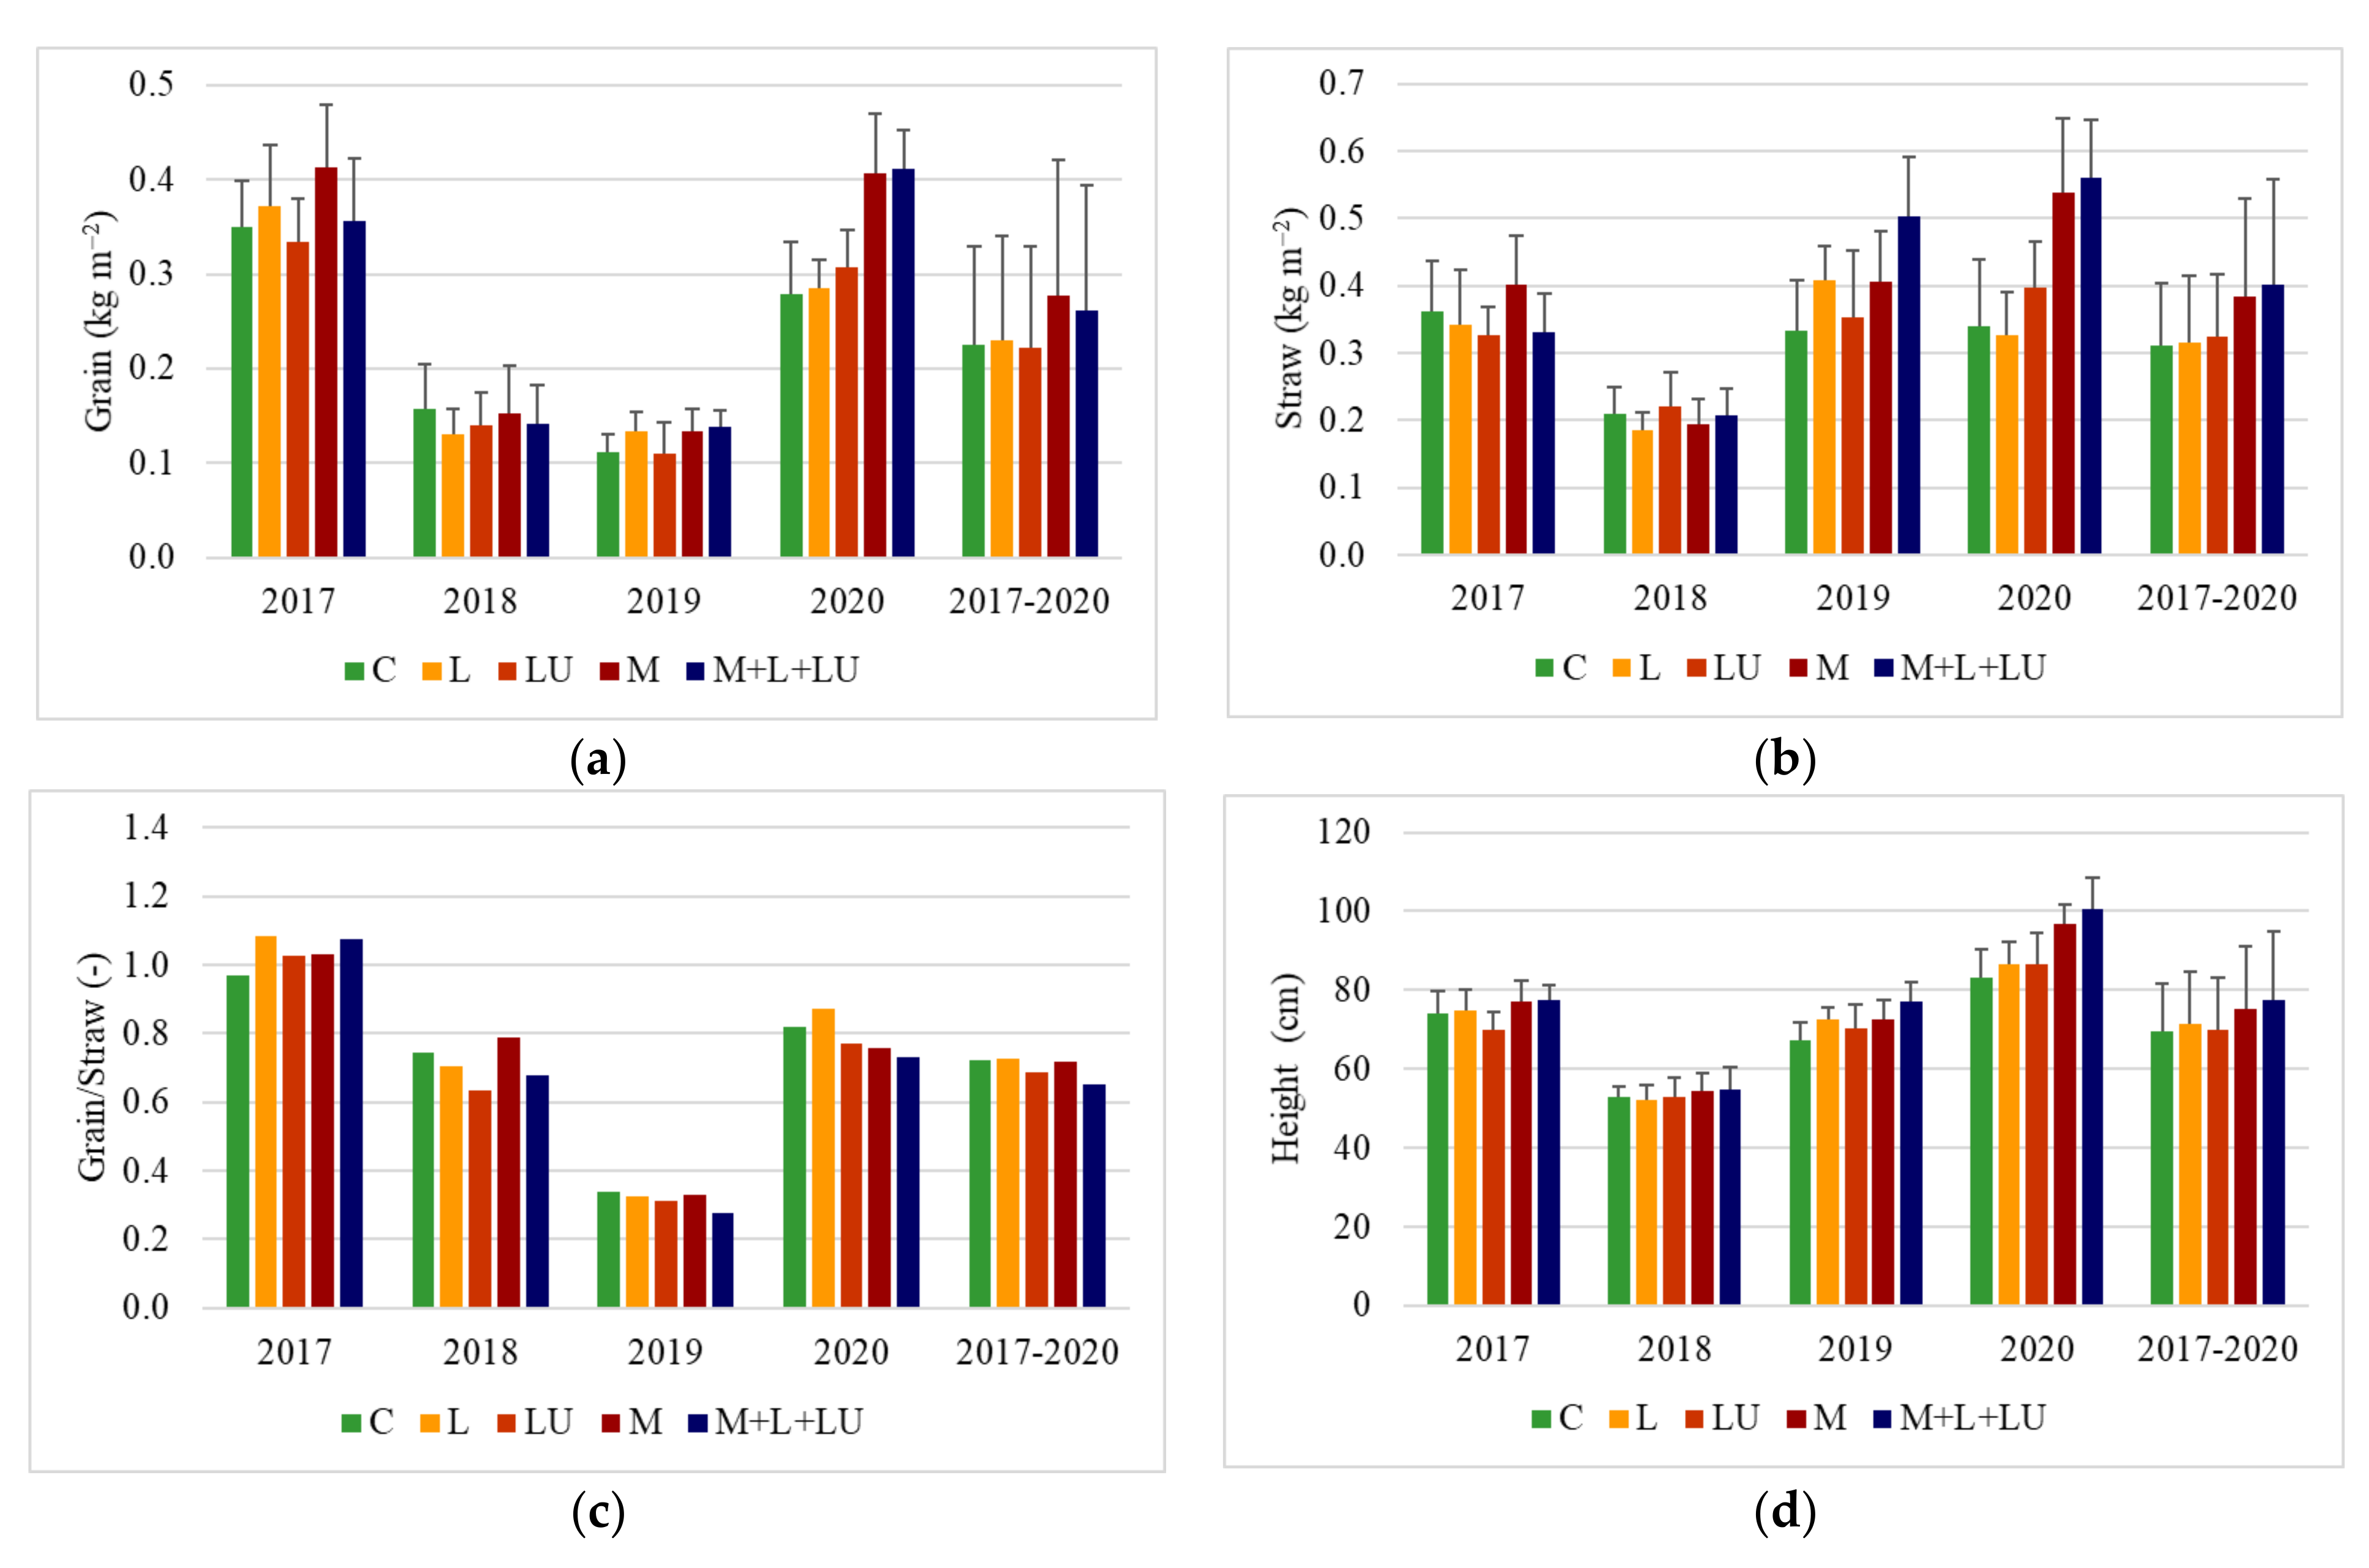
Differences in the yield of grain and straw and plant height between all each soil-improving cropping system (SICS) and the control were not significant in the first three study years (2017–2019). In the last study year (2020), however, all yield trait components significantly increased in SICS with the use of farmyard manure (M) and farmyard manure, liming, and catch crops together (M + L + LU) but not in SICS with application of liming (L) and catch crops (LU) alone.
(2)
Irrespective of the type of the soil-improving cropping systems, all yield trait components were considerably lower in the dry years (2018–2019) than in the wet years (2017–2020). The inter-annual variations were relatively greater than those between the SICS treatments in all study years. The relatively large amount of rainfalls in May in 2019 during intensive growth at shooting and the scarce precipitation during later growth resulted in a significantly greater straw yield.
(3)
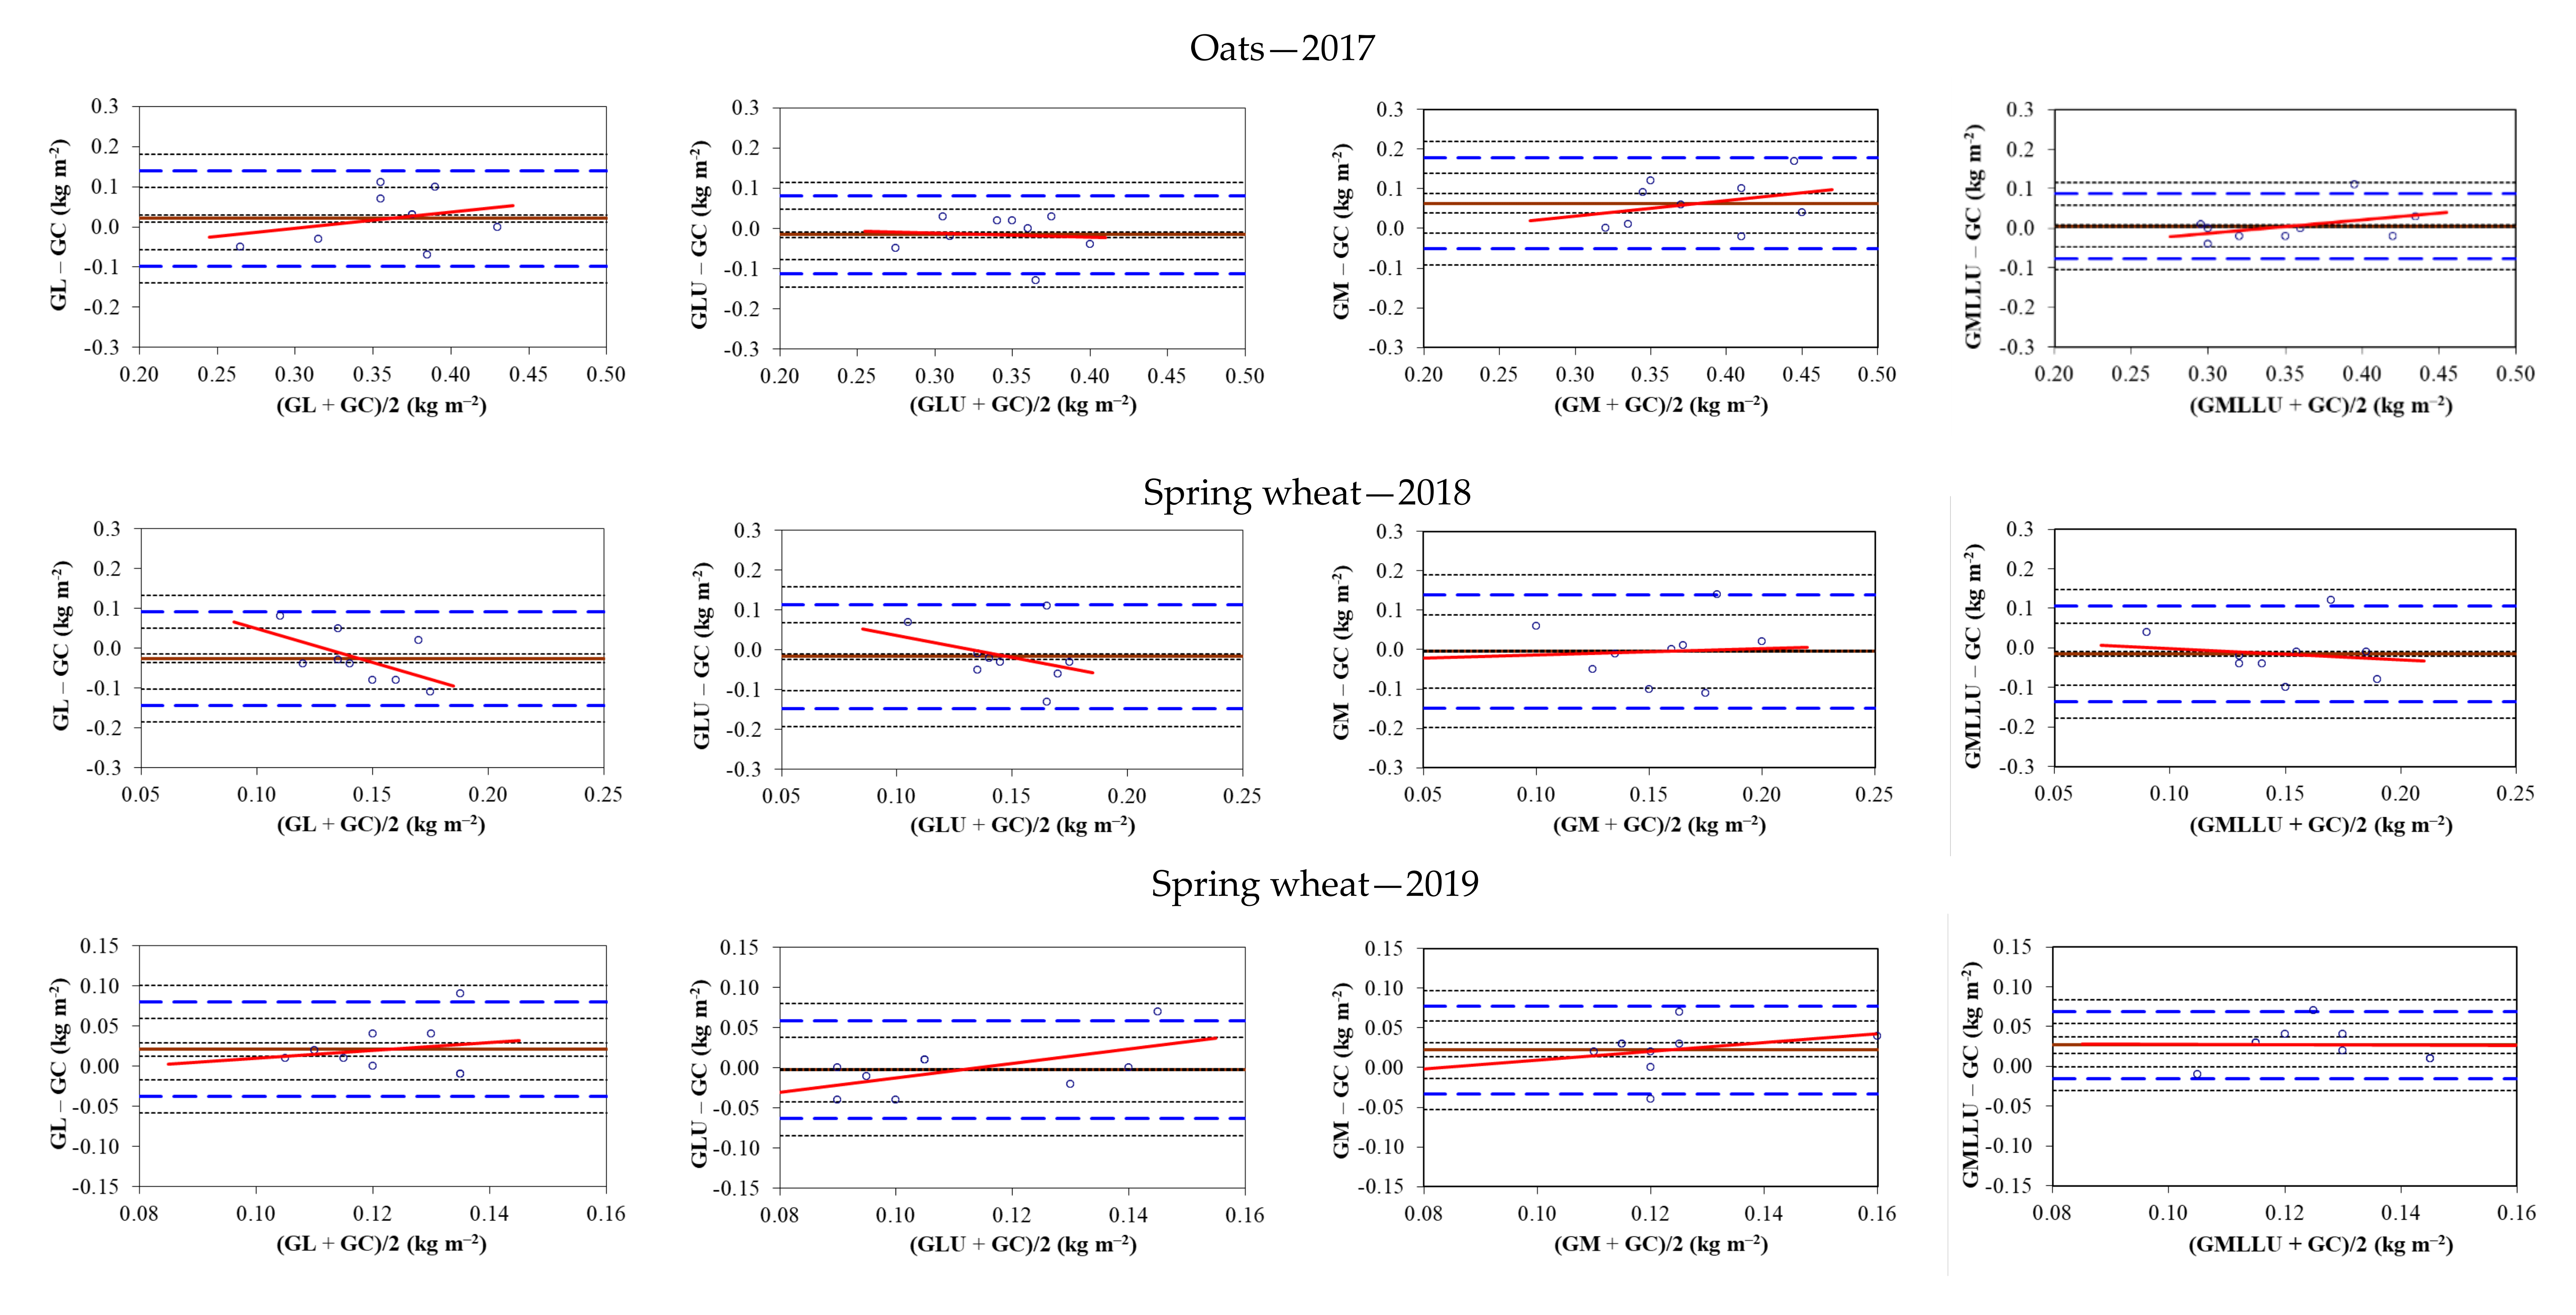
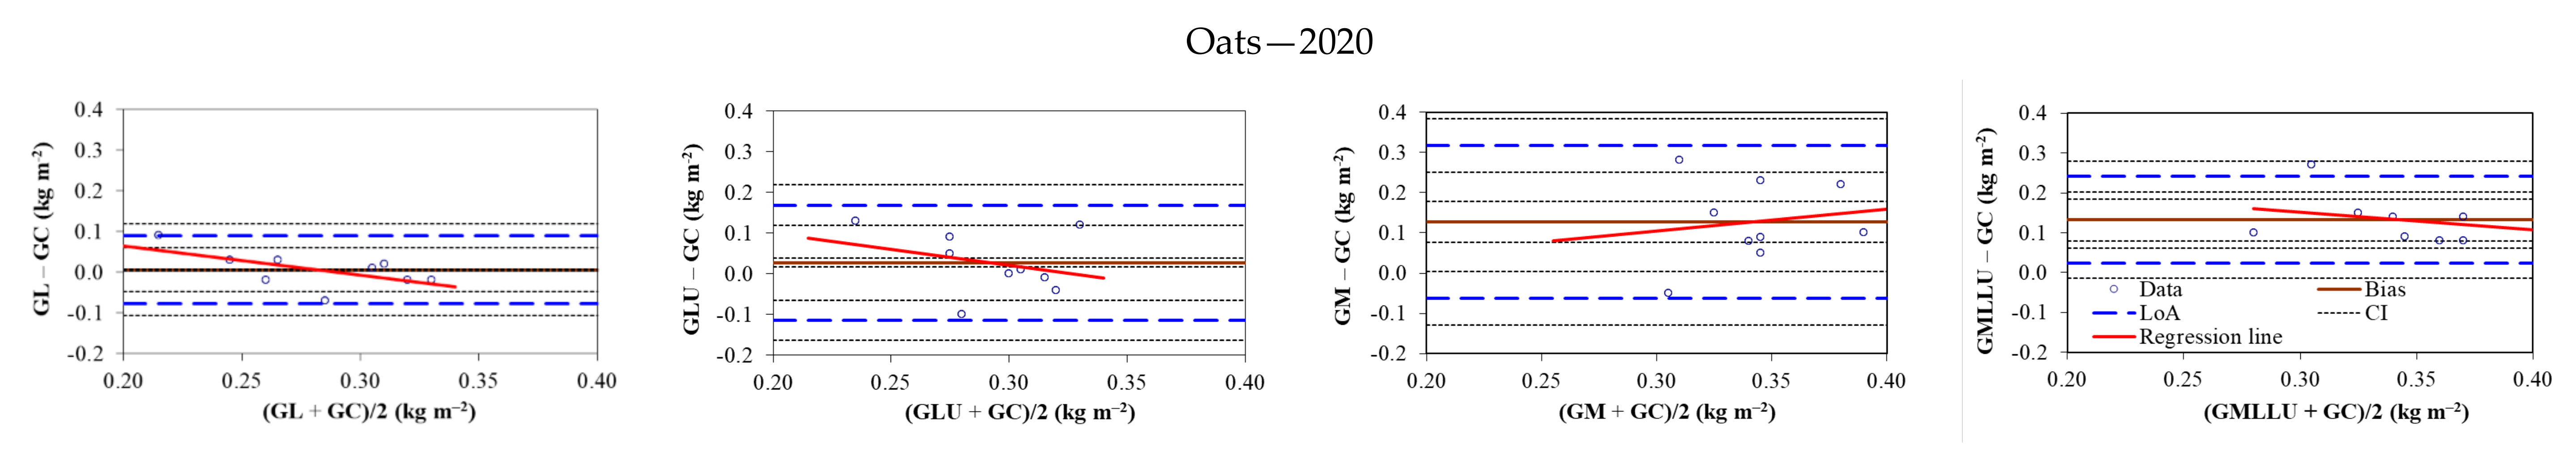
The values of Bland–Altman bias (mean difference) varied from (in kg m−2) −0.002 for LU in 2019 to 0.128 for M and 0.132 for M + L + LU in 2020. Irrespective of the yield trait components, the highest limits of agreement (LoA) were recorded in 2020 in the M and M + L + LU variants, where all yield trait components reached the maximum values.
(4)
The highest Bland–Altman ratio (BAR) values suggest that quantification of the effects of all soil-improving cropping practices was most uncertain for the grain yield in the dry year 2018 and for the straw yield in the wet year 2020. The uncertainty for the plant height was much lower than for the grain and straw yield, irrespective of the soil-improving cropping systems and study year.
(5)
Overall, the results from the Bland–Altman method well complement classical statistics by providing helpful information for selection of the most yield-producing soil-improving cropping system, depending on weather conditions prevailing during the growing season.

Author Contributions

B.U. and J.L. performed experiments and measurements. B.U. carried out data computation and statistical analysis. All authors have read and agreed to the published version of the manuscript.

Funding

The research leading to these results has received funding from the H2020 under grant agreement number 677407 (SOILCARE).

Institutional Review Board Statement

Not applicable.

Data Availability Statement

Data sharing is not applicable to this article.

Conflicts of Interest

The authors declare no conflict of interest.

References

  1. Yost, J.L.; Hartemink, A.E. Chapter four—Soil organic carbon in sandy soils: A review. In Advances in Agronomy, 1st ed.; Sparks, D.L., Ed.; Academic Press: Newark, DE, USA, 2019; pp. 217–230. [Google Scholar]
  2. Bronick, C.J.; Lal, R. Manuring and rotation effects on soil organic carbon concentration for different aggregate size fractions on two soils in northeastern Ohio, USA. Soil Tillage Res. 2005, 81, 239–252. [Google Scholar] [CrossRef]
  3. Thorsen, M.K.; Hopkins, D.W.; Woodward, S.; McKenzie, B.M. Resilience of microorganisms and aggregation of a sandy calcareous soil to amendment with organic and synthetic fertilizer. Soil Use Manag. 2010, 26, 149–157. [Google Scholar]
  4. Jankowski, M.; Przewoźna, B.; Bednarek, R. Topographical inversion of sandy soils due to local conditions in Northern Poland. Geomorphology 2011, 135, 277–283. [Google Scholar] [CrossRef]
  5. Huang, J.; Hartemink, A.E. Soil and environmental issues in sandy soils. Earth Sci. Rev. 2020, 208, 103295. [Google Scholar] [CrossRef]
  6. Białousz, S.; Marcinek, J.; Stuczyński, T.; Turski, R. Soil survey, soil monitoring and soil databases in Poland. In European Soil Bureau—Research Report; No. 9 ESB-RR9; European Soil Bureau: Brussels, Belgium, 2000; pp. 263–273. Available online: https://www.academia.edu/34998638/ (accessed on 19 October 2021).
  7. Rutkowska, A.; Pikuła, D. Effect of crop rotation and nitrogen fertilization on the quality and quantity of soil organic matter. In Soil Processes and Current Trends in Quality: Assessment; Hernandez Soriano, M.C., Ed.; Intech Open: London, UK, 2013; pp. 249–267. Available online: https://www.intechopen.com/chapters/41059 (accessed on 19 October 2021). [CrossRef] [Green Version]
  8. Osman, K.T. Management of soil problems. In Sandy Soils; Osman, K.T., Ed.; Springer International Publishing: Cham, Switzerland, 2018; pp. 37–65. [Google Scholar]
  9. Peake, L.R.; Reid, G.J.; Tang, X. Quantifying the influence of biochar on the physical and hydrological properties of dissimilar soils. Geoderma 2014, 235–236, 182–190. [Google Scholar] [CrossRef]
  10. Zhou, H.; Fang, H.; Zhang, Q.; Wang, Q.; Chen, C.; Mooney, S.J.; Peng, X.; Du, Z. Biochar enhances soil hydraulic function but not soil aggregation in a sandy loam. Eur. J. Soil Sci. 2019, 70, 291–300. [Google Scholar] [CrossRef]
  11. Usowicz, B.; Lipiec, J. Spatial variability of saturated hydraulic conductivity and its links with other soil properties at the regional scale. Sci. Rep. 2021, 11, 8293. [Google Scholar] [CrossRef]
  12. Gliński, J.; Lipiec, J. Soil Physical Conditions and Plant Roots, 1st ed.; CRC Press Taylor & Francis Group: Boca Raton, FL, USA, 1990; p. 260. First Published 1990; ISBN 13: 978-1-351-07670-8. [Google Scholar]
  13. Villagra-Mendoza, K.; Horn, R. Effect of biochar on the unsaturated hydraulic conductivity of two amended soils. Int. Agrophys. 2018, 32, 373–378. [Google Scholar] [CrossRef]
  14. Krasowicz, S.; Oleszek, W.; Horabik, J.; Dębicki, R.; Jankowiak, J.; Stuczyński, T.; Jadczyszyn, J. Rational management of the soil environment in Poland. Pol. J. Agron. 2011, 7, 43–58. [Google Scholar]
  15. Behera, S.K.; Shukla, A.K. Spatial distribution of surface soil acidity, electrical conductivity, soil organic carbon content and exchangeable potassium, calcium and magnesium in some cropped acid soils of India. Land Deg. Dev. 2015, 26, 71–79. [Google Scholar] [CrossRef]
  16. Cai, Z.J.; Wang, B.R.; Xu, M.G.; Zhang, H.M.; He, X.; Zhang, L.; Gao, S. Intensified soil acidification from chemical N fertilization and prevention by manure in an 18-year field experiment in the red soil of southern china. J. Soils Sediments 2015, 15, 260–270. [Google Scholar] [CrossRef]
  17. Novák, P.; Chyba, J.; Kumhála, F.; Procházka, P. The measurement of stubble cultivator draught force under different soil conditions. Agron. Res. 2014, 12, 135–142. [Google Scholar]
  18. Schjønning, P.; Heckrath, G.; Christensen, B.T. Threat to soil quality in Denmark. A review of existing knowledge in the context of the EU soil thematic strategy. In DJF Report Plant Science no. 143; Aarhus University: Tjele, Denmark, 2009; pp. 11–121. Available online: http://web.agrsci.dk/djfpublikation/index.asp?action=show&id=1073 (accessed on 19 October 2021).
  19. Usowicz, B.; Lipiec, J. Spatial variability of soil properties and cereal yield in a cultivated field on sandy soil. Soil Tillage Res. 2017, 174, 241–250. [Google Scholar]
  20. Reichert, J.M.; Albuquerque, J.A.; Kaiser, D.R.; Reinert, D.J.; Urach, F.L.; Carlesso, R. Estimation of water retention and availability in soils of Rio Grande do Sul. Rev. Bras. Cienc. Solo 2020, 33, 1547–1560. [Google Scholar]
  21. Lal, R. Soil organic matter and water retention. Agron. J. 2020, 112, 3265–3277. [Google Scholar] [CrossRef]
  22. Adhikari, K.; Hartemink, A.E. Soil organic carbon increases under intensive agriculture in the Central Sands, Wisconsin, USA. Geoderma Reg. 2017, 10, 115–125. [Google Scholar] [CrossRef]
  23. Cai, A.; Xu, M.; Wang, B.; Zhang, W.; Liang, G.; Hou, E.; Lua, Y. Manure acts as a better fertilizer for increasing crop yields than synthetic fertilizer does by improving soil fertility. Soil Tillage Res. 2019, 189, 168–175. [Google Scholar]
  24. Ajayi, A.E.; Holthusen, D.; Horn, R. Changes in microstructural behaviour and hydraulic functions of biochar amended soils. Soil Tillage Res. 2016, 155, 166–175. [Google Scholar] [CrossRef]
  25. Minasny, B.; McBratney, A.B. Limited effect of organic matter on soil available water capacity. Eur. J. Soil Sci. 2017, 69, 39–47. [Google Scholar] [CrossRef] [Green Version]
  26. Bhogal, A.; Nicholson, F.A.; Rollett, A.; Taylor, M.; Litterick, A.; Whittingham, M.J.; Williams, J.R. Improvements in the quality of agricultural soils following organic material additions depend on both the quantity and quality of the materials applied. Front. Sustain. Food Syst. 2018, 2, 9. [Google Scholar] [CrossRef] [Green Version]
  27. EASAC (European Academies’ Science Advisory Council). Opportunities for soil sustainability in Europe. In Policy Report 36; European Academies Science Advisory Council: Halle, Germany, 2018; pp. 3–38. [Google Scholar]
  28. Villagra-Mendoza, K.; Horn, R. Effect of biochar addition on hydraulic functions of two textural soils. Geoderma 2018, 326, 88–95. [Google Scholar]
  29. Gluba, Ł.; Rafalska-Przysucha, A.; Szewczak, K.; Łukowski, M.; Szlązak, R.; Vitková, J.; Kobyłecki, R.; Bis, Z.; Wichliński, M.; Zarzycki, R.; et al. Effect of fine size-fractionated sunflower husk biochar on water retention properties of arable sandy soil. Materials 2021, 14, 1335. [Google Scholar] [CrossRef]
  30. Ibrahim, A.; Horton, R. Biochar and compost amendment impacts on soil water and pore size distribution of a loamy sand soil. Soil Sci. Soc. Am. J. 2021, 85, 1021–1036. [Google Scholar] [CrossRef]
  31. Bönecke, E.; Meyer, S.; Vogel, S.; Schröter, I.; Gebbers, R.; Kling, C.; Kramer, E.; Lück, K.; Nagel, A.; Philipp, G.; et al. Guidelines for precise lime management based on high-resolution soil pH, texture and SOM maps generated from proximal soil sensing data. Precis. Agric. 2021, 22, 493–523. [Google Scholar] [CrossRef]
  32. Bolinder, M.A.; Crotty, F.; Elsen, A.; Frąc, M.; Kismanyoky, T.; Lipiec, J.; Tits, M.; Toth, Z.; Kätterer, T. The effect of crop residues, cover crops, manures and nitrogen fertilization on soil organic carbon changes in agroecosystems: A synthesis of reviews. Mitig. Adapt. Strateg. Glob. Chang. 2020, 25, 929–952. [Google Scholar] [CrossRef]
  33. Kismányoky, T.; Tóth, Z. Effect of mineral and organic fertilization on soil organic carbon content as well as on grain production of cereals in the IOSDV (ILTE) long-term field experiment, Keszthely, Hungary. Arch. Agron. Soil Sci. 2013, 59, 1121–1131. [Google Scholar] [CrossRef]
  34. Bloch, S.E.; Ryu, M.H.; Ozaydin, B.; Broglie, R. Harnessing atmospheric nitrogen for cereal crop production. Curr. Opin. Biotechnol. 2020, 62, 181–188. [Google Scholar] [CrossRef]
  35. Popp, M.P.; Purcell, L.C.; Ross, W.J.; Norsworthy, J.S. Profitability of using nitrogen fertilizer or inoculating soybean seed. Agrosyst. Geosci. Environ. 2020, 3, e20115. [Google Scholar] [CrossRef]
  36. Świtek, S.; Sawinska, Z. Farmer rationality and the adoption of greening practices in Poland. Sci. Agric. 2017, 74, 275–284. [Google Scholar] [CrossRef]
  37. Zaniewicz-Bajkowska, A.; Rosa, R.; Kosterna, E.; Franczuk, J. Catch crops for green manure biomass yield and macroelement content depending on the sowing date. Acta Sci. Pol. Agric. 2013, 12, 65–79. [Google Scholar]
  38. Valkama, E.; Lemola, R.; Känkänen, H.; Turtola, E. Meta-analysis of the effects of undersown catch crops on nitrogen leaching loss and grain yields in the Nordic countries. Agric. Ecosyst. Environ. 2015, 203, 93–101. [Google Scholar]
  39. Soussana, J.-F.; Lutfalla, S.; Ehrhardt, F.; Rosenstock, T.; Lamanna, C.; Havlík, P.; Richards, M.; Wollenberg, E.; Chotte, J.-L.; Torquebiau, E.; et al. Matching policy and science: Rationale for the ‘4 per 1000—Soils for food security and climate’ initiative. Soil Tillage Res. 2017, 188, 3–15. [Google Scholar] [CrossRef]
  40. Bland, J.M.; Altman, D.G. Statistical method for assessing agreement between two methods of clinical measurement. Lancet 1986, 327, 307–310. [Google Scholar]
  41. Bland, J.M.; Altman, D.G. Measuring agreement in method comparison studies. Stat. Methods Med. Res. 1999, 8, 135–160. [Google Scholar] [CrossRef]
  42. Myles, P.S.; Cui, J. Using the Bland–Altman method to measure agreement with repeated measures. Br. J. Anaesth. 2007, 99, 309–311. [Google Scholar] [CrossRef] [PubMed] [Green Version]
  43. Giavarina, D. Understanding Bland-Altman analysis. Bio. Chem. Med. 2015, 24, 141–151. [Google Scholar] [CrossRef] [PubMed] [Green Version]
  44. Numao, S.; Uchida, R.; Kurosaki, T.; Nakagaichi, M. Differences in circulating fatty acid-binding protein 4 concentration in the venous and capillary blood immediately after acute exercise. J. Physiol. Anthropol. 2021, 40, 5. [Google Scholar] [CrossRef] [PubMed]
  45. Usowicz, B.; Marczewski, W.; Usowicz, J.; Łukowski, M.; Lipiec, J. Comparison of surface soil moisture from SMOS satellite and ground measurements. Int. Agrophys. 2014, 28, 359–369. [Google Scholar] [CrossRef] [Green Version]
  46. Zawadzki, J.; Kędzior, M. Soil moisture variability over Odra watershed: Comparison between SMOS and GLDAS data. Int. J. Appl. Earth. Obs. 2016, 45, 110–124. [Google Scholar] [CrossRef]
  47. Usowicz, B.; Lipiec, J. Determining the effect of exogenous organic materials on spatial distribution of maize yield. Sci. Rep. 2019, 9, 19883. [Google Scholar] [CrossRef]
  48. Usowicz, B.; Lipiec, J.; Łukowski, M.; Bis, Z.; Usowicz, J.; Latawiec, A.E. Impact of biochar addition on soil thermal properties: Modelling approach. Geoderma 2020, 376, 114574. [Google Scholar] [CrossRef]
  49. Rehman, H.U.; Pouladi, N.; Pulido-Moncada, M.; Arthur, E. Repeatability and agreement between methods for determining the Atterberg limits of fine-grained soils. Soil Sci. Soc. Am. J. 2020, 84, 21–30. [Google Scholar] [CrossRef]
  50. WRB IUSS Working Group. World reference base for soil resources 2014, update 2015. In International Soil Classification System for Naming Soils and Creating Legends for Soil Maps; World Soil Resources Reports No. 106; FAO: Rome, Italy, 2015; Available online: https://publications.jrc.ec.europa.eu/repository/handle/JRC91947 (accessed on 19 October 2021).
  51. Dahiya, I.S.; Ritcher, J.; Mark, P.S. Soil spatial variability: Review. Int. J. Trop. Agric. 1984, 11, 1–102. [Google Scholar]
  52. Mkhonza, N.P.; Buthelezi-Dube, N.N.; Muchaonyerwa, P. Effects of lime application on nitrogen and phosphorus availability in humic soils. Sci. Rep. 2020, 10, 8634. [Google Scholar] [CrossRef] [PubMed]
  53. Tamm, I.; Tamm, Ü.; Ingver, A.; Koppel, R.; Tupits, I.; Bender, A.; Tamm, S.; Narits, L.; Koppel, M. Different leguminous pre-crops increased yield of succeeding cereals in two consecutive years. Acta Agr. Scand. Sect. B Soil Plant Sci. 2016, 66, 593–601. [Google Scholar] [CrossRef]
  54. Gitari, H.I.; Gachene, C.K.K.; Karanja, N.N.; Kamau, S.; Nyawade, S.; Schulte-Geldermann, E. Potato-legume intercropping on a sloping terrain and its effects on soil physico-chemical properties. Plant Soil 2019, 438, 447–460. [Google Scholar] [CrossRef]
  55. Jerzak, M.; Mikulski, W. The importance of subsidies for the production of grain legumes for reconstruction of the domestic market of protein raw materials of vegetable origin in Poland. Probl. Agric. Econ. 2017, 2, 152–163. [Google Scholar]
  56. Wysokinski, A.; Kuziemska, B. The sources of nitrogen for yellow lupine and spring triticale in their intercropping. Plant Soil Environ. 2019, 65, 145–151. [Google Scholar] [CrossRef] [Green Version]
  57. Kundzewicz, Z.W.; Piniewski, M.; Mezghani, A.; Okruszko, T.; Pińskwar, I.; Kardel, I.; Hov, Ø.; Szcześniak, M.; Szwed, M.; Benestad, R.E.; et al. Assessment of climate change and associated impact on selected sectors in Poland. Acta Geophys. 2018, 66, 1509–1523. [Google Scholar] [CrossRef] [Green Version]
  58. Dai, J.; Bean, B.; Brown, B.; Bruening, W.; Edwards, J.; Flowers, M.; Karow, R.; Lee, C.; Morgan, G.; Ottman, M.; et al. Harvest index and straw yield of five classes of wheat. Biomass Bioenerg. 2016, 85, 223–227. [Google Scholar] [CrossRef] [Green Version]
  59. Liu, W.; Hou, P.; Liu, G.; Yang, Y.; Guo, X.; Ming, B.; Xie, R.; Wang, K.; Liu, Y.; Li, S. Contribution of total dry matter and harvest index to maize grain yield—A multisource data analysis. Food Energy Secur. 2020, 9, e256. [Google Scholar] [CrossRef]
  60. Lipiec, J.; Usowicz, B. Spatial relationships among cereal yields and selected soil physical and chemical properties. Sci. Total Environ. 2018, 633, 1579–1590. [Google Scholar] [CrossRef] [PubMed]
  61. Van Stralen, K.J.; Dekker, F.W.; Zoccali, C.; Jager, K.J. Measuring agreement, more complicated than it seems. Nephron Clin. Pract. 2012, 120, c162–c167. [Google Scholar] [CrossRef]
  62. Peng, B.; Guan, K.; Tang, J.; Ainsworth, E.A.; Asseng, S.; Bernacchi, C.J.; Cooper, M.; DeLucia, E.H.; Elliott, J.; Ewert, F.; et al. Towards a multiscale crop modelling framework for climate change adaptation assessment. Nat. Plants 2020, 6, 338–348. [Google Scholar] [CrossRef] [PubMed]
Figure 1. Monthly average air temperatures and sums of precipitation during the period of 2017–2020.
Land 10 01199 g001
Figure 2. Mean values of the grain yield (a), straw yield (b), grain to straw yield ratio (c), plant height (d), and in response to soil-improving cropping systems. C—control, L—liming, LU—leguminous catch crops, M—farmyard manure and M + L + LU—farmyard manure + liming + leguminous catch crops. The vertical bars indicate the standard deviations (n = 9).
Land 10 01199 g002
Figure 3. Bland–Altman plots for grain yield (G) (kg m−2) (oats—2017), (spring wheat—2018, 2019), (oats—2020). C—control, L—liming, LU—leguminous catch crops, M—farmyard manure, and MLLU—farmyard manure + liming + leguminous catch crops, LoA—limits of agreement, CI—confidence intervals.
Land 10 01199 g003aLand 10 01199 g003b
Figure 4. Bland–Altman plots for straw yield (S) (kg m−2) (oats—2017), (spring wheat—2018, 2019), (oats—2020). C—control, L—liming, LU—leguminous catch crops, M—farmyard manure, and MLLU—farmyard manure + liming + leguminous catch crops, LoA—limits of agreement, CI—confidence intervals.
Land 10 01199 g004aLand 10 01199 g004b
Figure 5. Bland–Altman plots for plant height (H) (cm) (oats—2017), (spring wheat—2018, 2019), (oats—2020). C—control, L—liming, LU—leguminous catch crops, M—farmyard manure, and MLLU—farmyard manure + liming + leguminous catch crops, LoA—limits of agreement, CI—confidence intervals.
Land 10 01199 g005aLand 10 01199 g005b
Figure 6. Root mean square residuals (RMSR) and maximum relative residuals (MRR), which are the difference in the yield trait components between the particular SICS and control plots, BAR—Bland–Altman ratio, Bias—mean of the differences, LoA—limit of agreements, SD—standard deviation of the differences.
Land 10 01199 g006
Table 1. Basic statistics for cereal yield trait components during the period of 2017–2020.
Year 2017, OatsYear 2018, Spring Wheat
(kg m−2)(cm)(kg m−2)(cm)
YieldGrainStrawHeightGrainStrawHeight
Number454545454545
Mean0.3610.35074.30.1430.20553.5
SD0.0630.0695.60.0400.0404.2
CV (%)17.519.77.528.119.37.9
Minimum0.2400.22064.00.0700.14048.0
Maximum0.5300.56085.00.2500.31063.0
Skewness0.2760.596−0.0520.8830.9300.803
Kurtosis−0.3400.480−1.0180.1410.406−0.514
Year 2019, Spring WheatYear 2020, Oats
(kg m−2)(cm)(kg m−2)(cm)
YieldGrainStrawHeightGrainStrawHeight
Number454545454545
Mean0.1230.39571.60.3330.43290.1
SD0.0260.0945.60.0720.1239.2
CV (%)20.923.87.821.528.510.2
Minimum0.0700.20059.00.1700.23075.0
Maximum0.1800.59084.00.4900.770110.0
Skewness0.2490.053−0.2290.3220.4770.300
Kurtosis−0.289−0.249−0.349−0.445−0.031−0.494
Table 2. Correlation coefficients (r) between grain, straw, and height in the study years. The correlation coefficients in bold are significant at p < 0.05.
Oats, 2017Spring Wheat, 2018Spring Wheat, 2019Oats, 2020
GrainStrawHeightGrainStrawHeightGrainStrawHeightGrainStrawHeight
2017Grain1.0000.6230.487−0.112−0.1690.0810.155−0.1160.0670.182−0.0220.073
Straw 1.0000.562−0.257−0.126−0.014−0.153−0.181−0.0960.116−0.0200.057
Height 1.000−0.063−0.0010.2290.3250.1500.2300.3060.1350.336
2018Grain 1.0000.3930.5120.3220.2280.1090.1740.122−0.007
Straw 1.0000.189−0.096−0.057−0.0800.1360.1150.058
Height 1.0000.3290.3460.3330.2170.1980.112
2019Grain 1.0000.6760.5960.3120.1210.330
Straw 1.0000.7850.4730.3670.506
Height 1.0000.3750.3260.483
2020Grain 1.0000.7980.776
Straw 1.0000.833
Height 1.000
Publisher’s Note: MDPI stays neutral with regard to jurisdictional claims in published maps and institutional affiliations.

